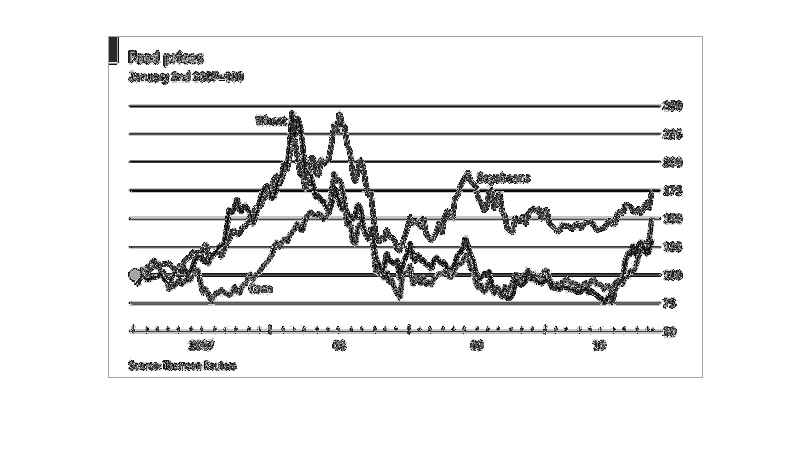
This graph shows food prices from 2007 to 2010 of Wheat, Soybeans, and Corn. The collectively
grew to a peak around 2008 and fell to a bottom around middle of 2009 before climbing back
up until the first quarter of 2009 where they fell and have stabilized until 2010. The began
to climb again at the end of 2010.
Error using .*
Matrix dimensions must agree.

Error in plotSpotlight (line 30)
    output = repmat(a,[1 1 3]).*single(im)/255;

Error in plot_individual_user_maps (line 49)
        [heat] = plotSpotlight(im,heatmap,3);