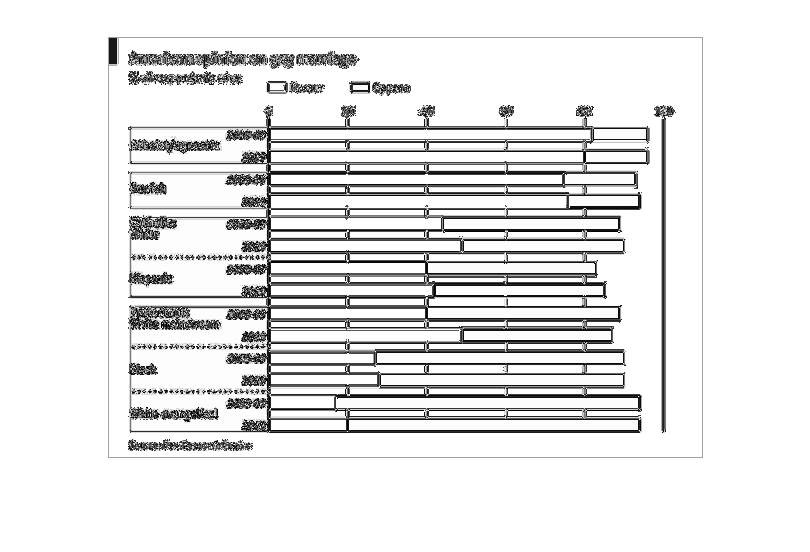
This is a colored bar graph chart regarding Americans view on gay marriage. It has categories
varying from race to religion. And it's main measure is whether the category favors it or
not.
Error using .*
Matrix dimensions must agree.

Error in plotSpotlight (line 30)
    output = repmat(a,[1 1 3]).*single(im)/255;

Error in plot_individual_user_maps (line 49)
        [heat] = plotSpotlight(im,heatmap,3);