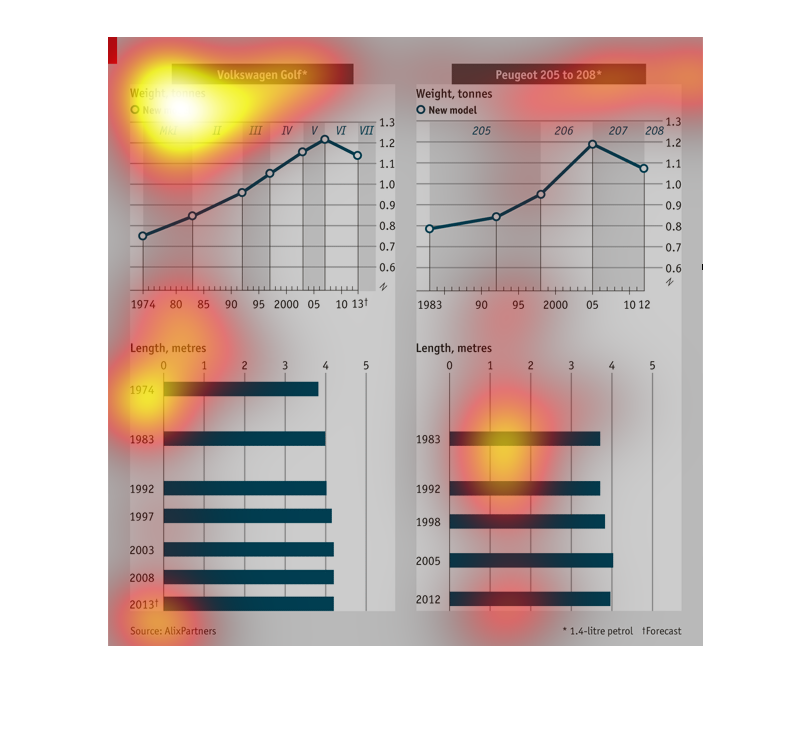
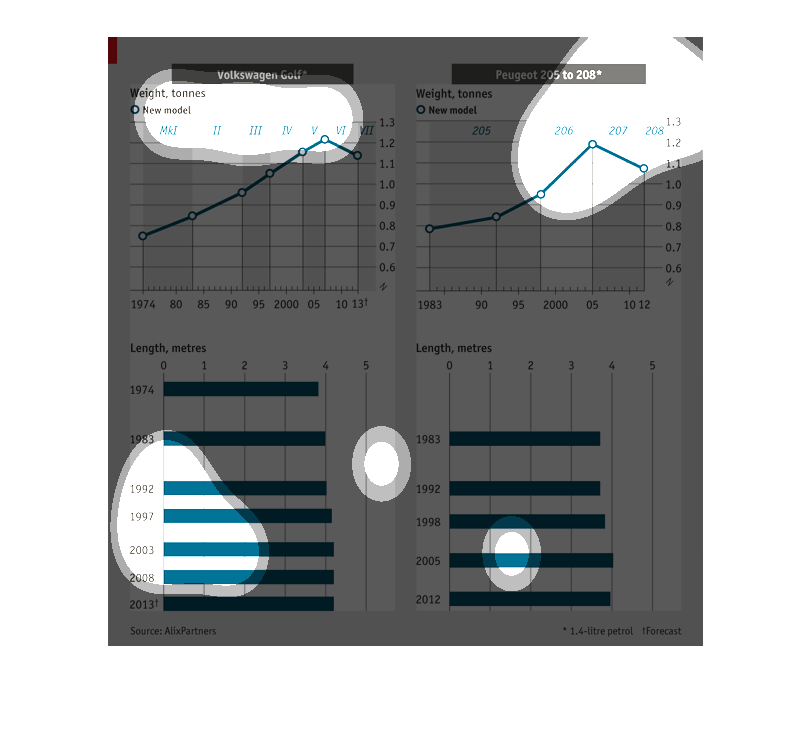
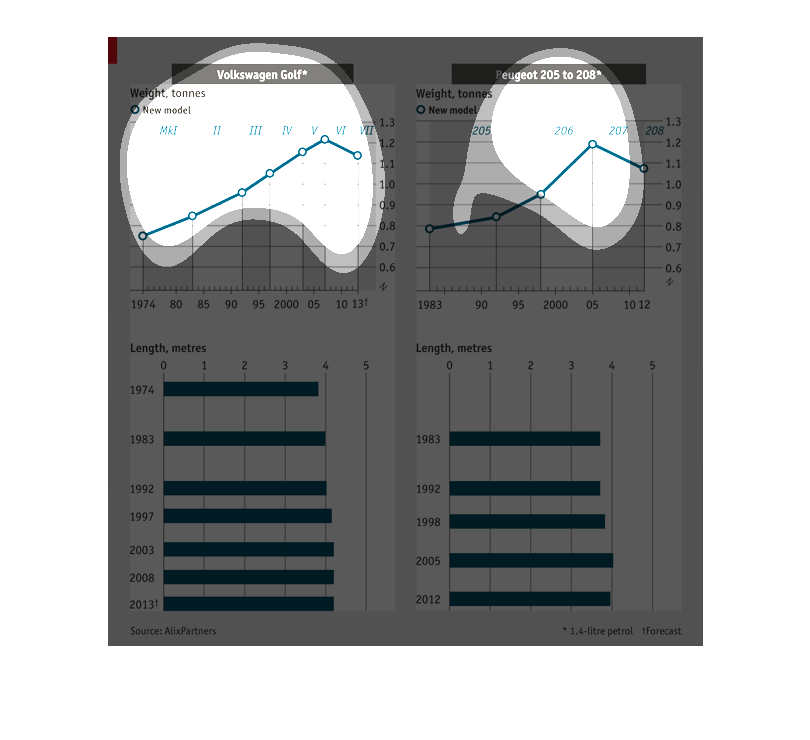
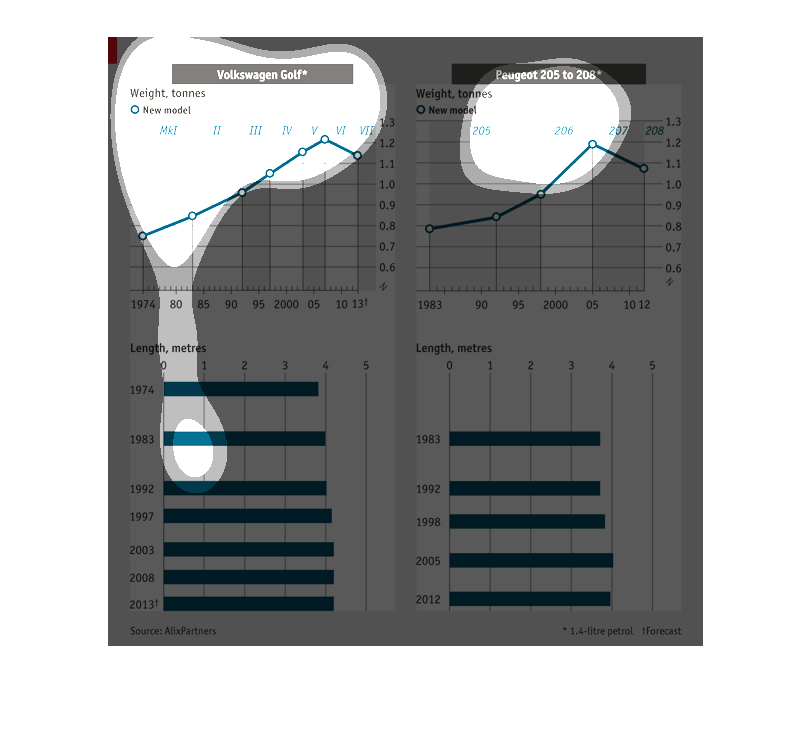
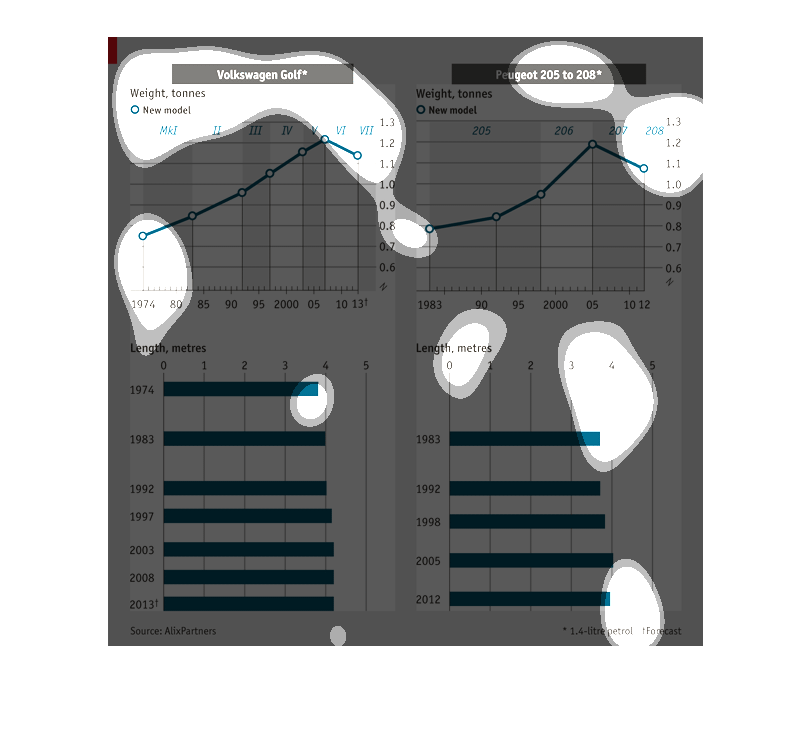
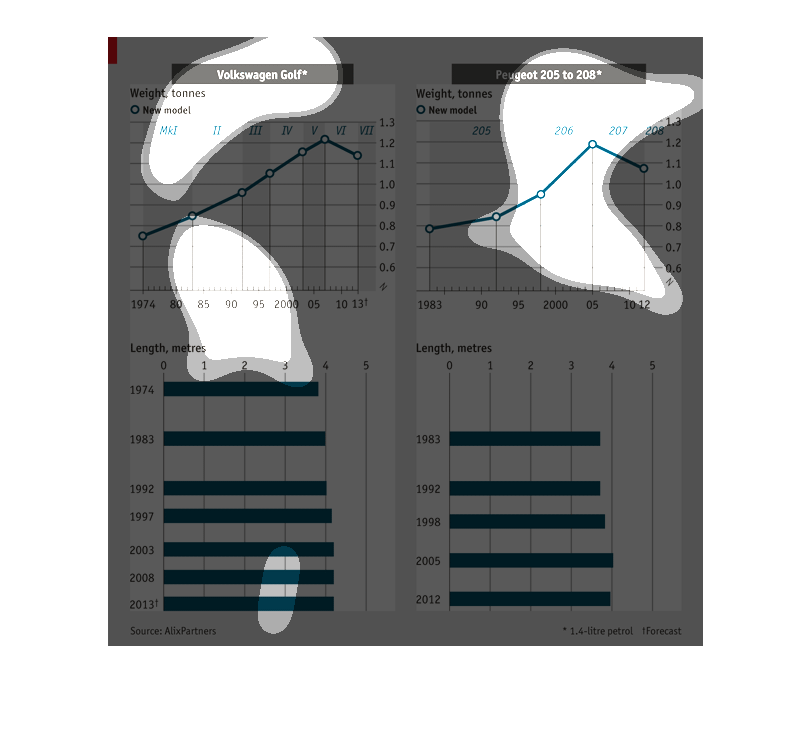
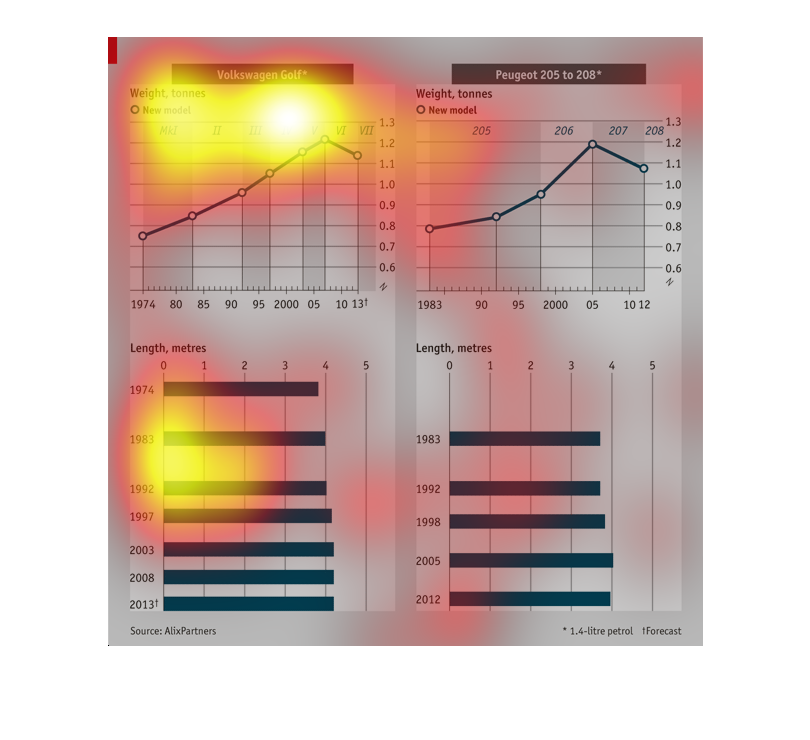
Four bar graphs plotting the weights and lengths of two models of car over time. The lengths
remain roughly consistent, while weights increase over time and then slightly decrease in
recent years.
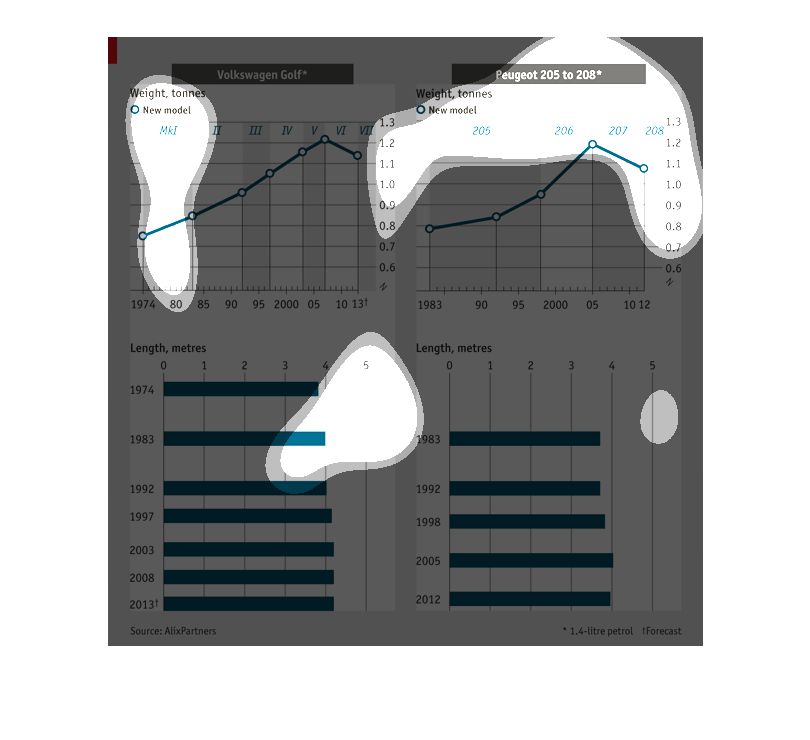
The image compares the weight of the Volkswagen Golf to the weight of the Peugeot 205 to 208
in a line graph.  The image also compares the length of the two vehicles in a horizontal bar
graph.
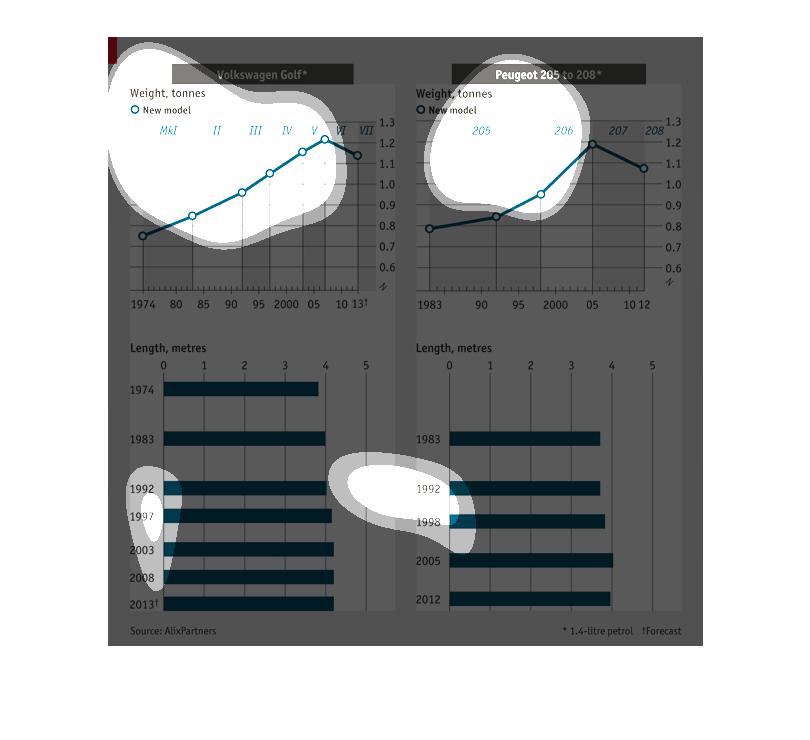
The top left graph shows the weight of the Volkswagen Golf from 1974 to 2013 and the top right
graph shows the weight of the Peugeot 205.  The bottom graphs show the length of these vehicles
over time, respectively.
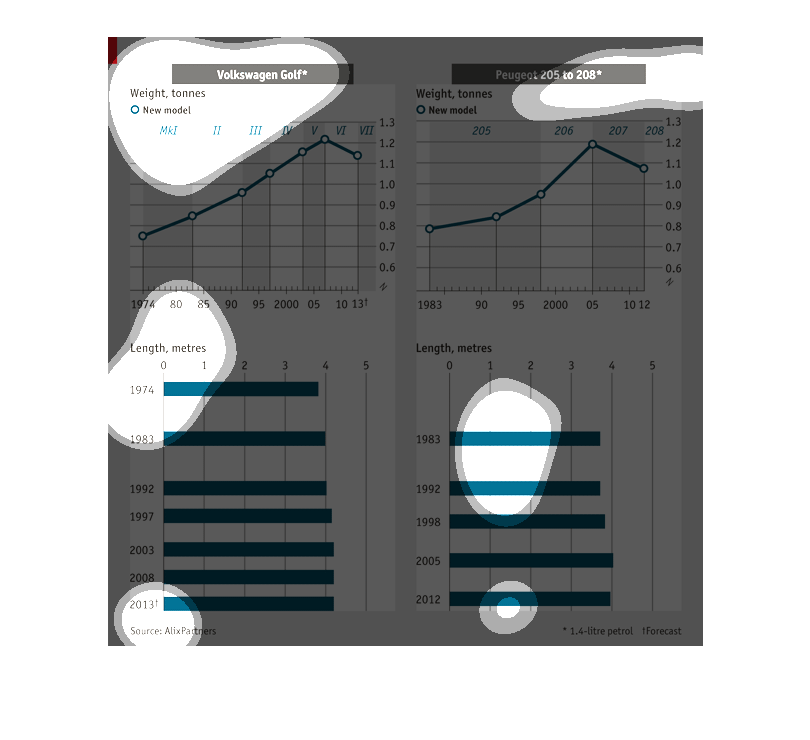
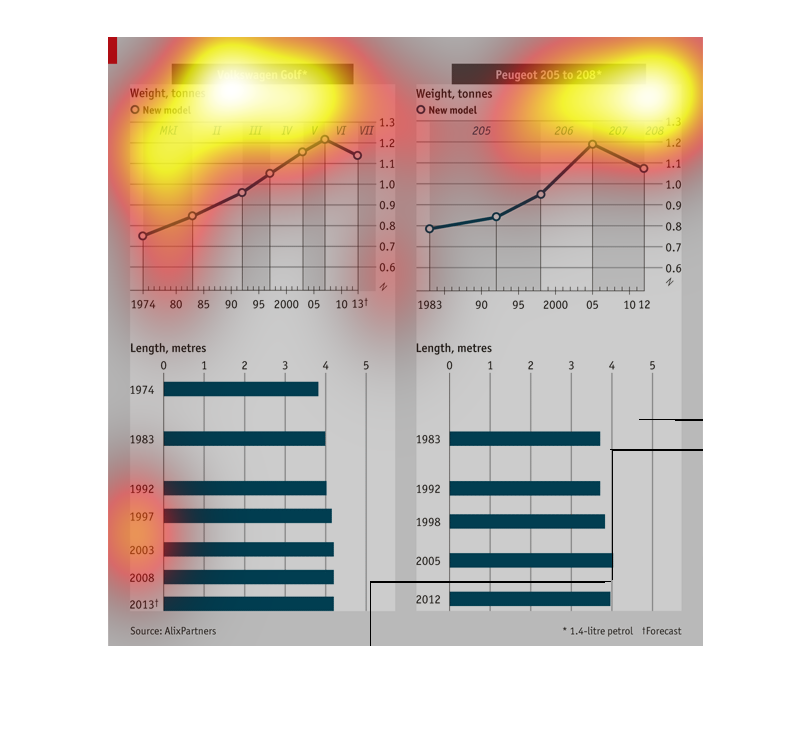
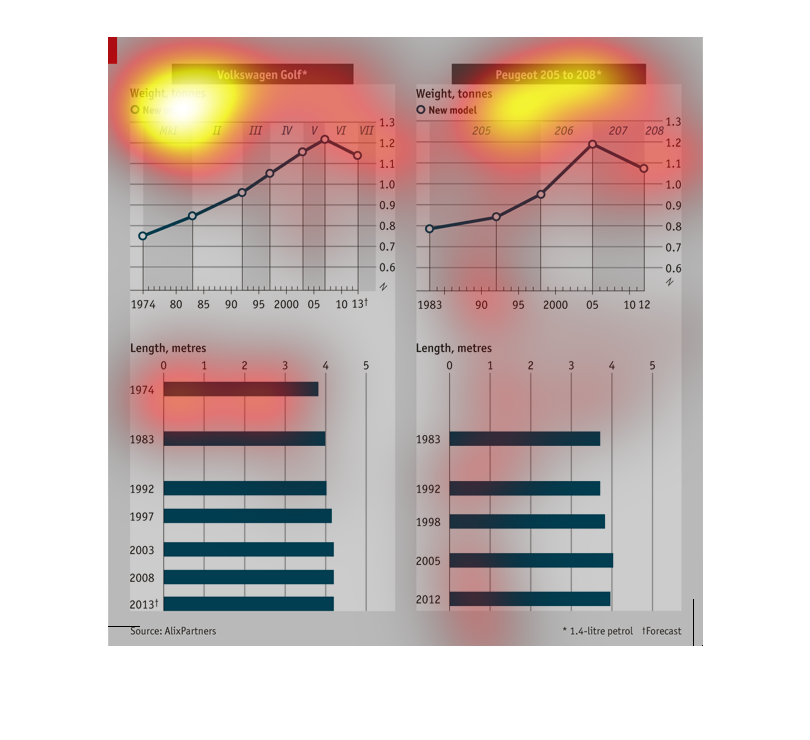
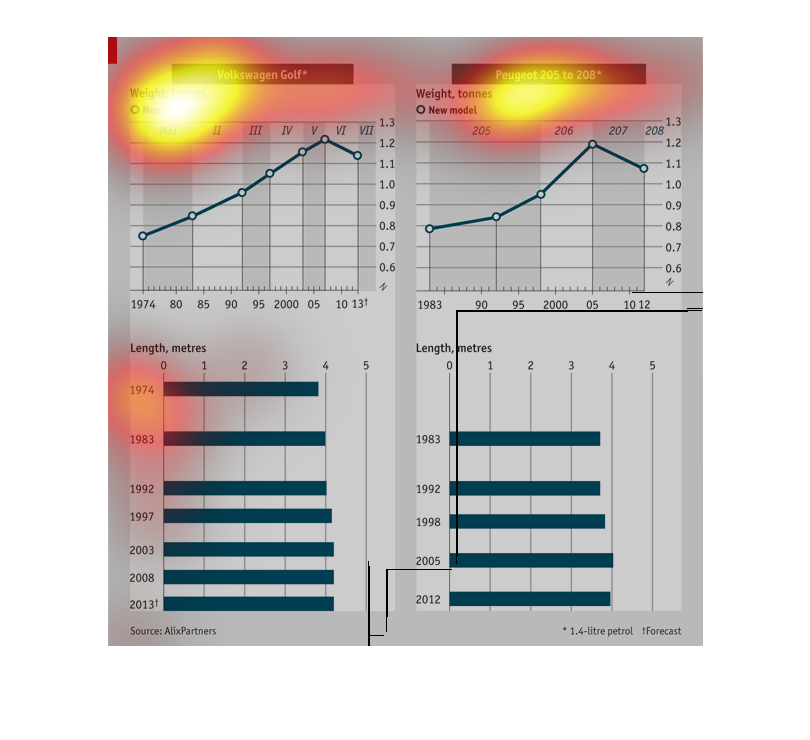
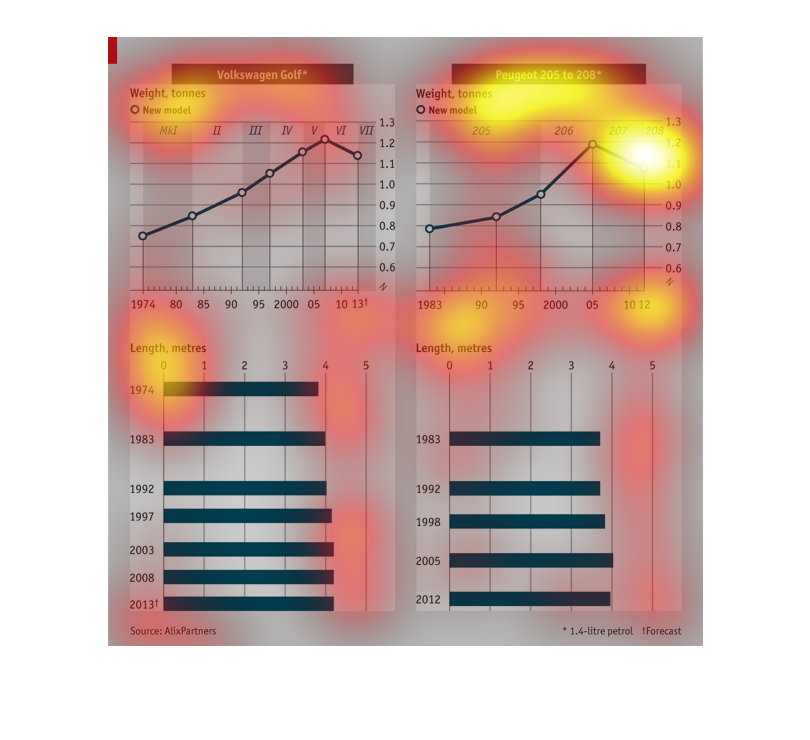
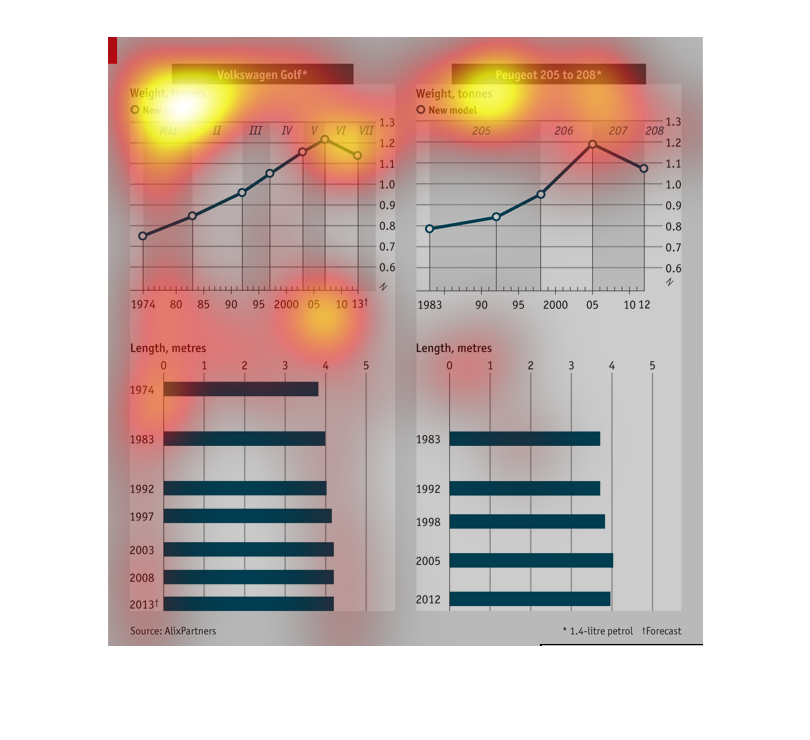
These are two graphs of VW and peugot model cars, ranked by their weights across different
models. Underneath is a breakdown of the lengths, shown in a horizontal bar graph.
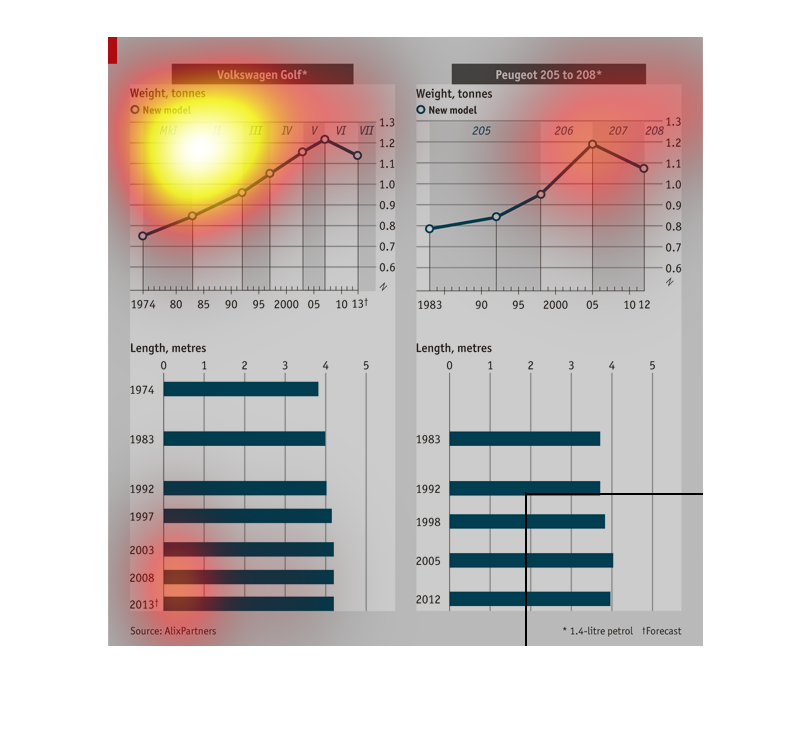
This chart compares various models of Volkswagen Golf and Peugeot 205 to 208 automobiles by
weight. Weight is measured and compared yearly for each model. The chart shows a trend of
increase in weight for both makes until 05 when the weight begins to decrease for both cars.
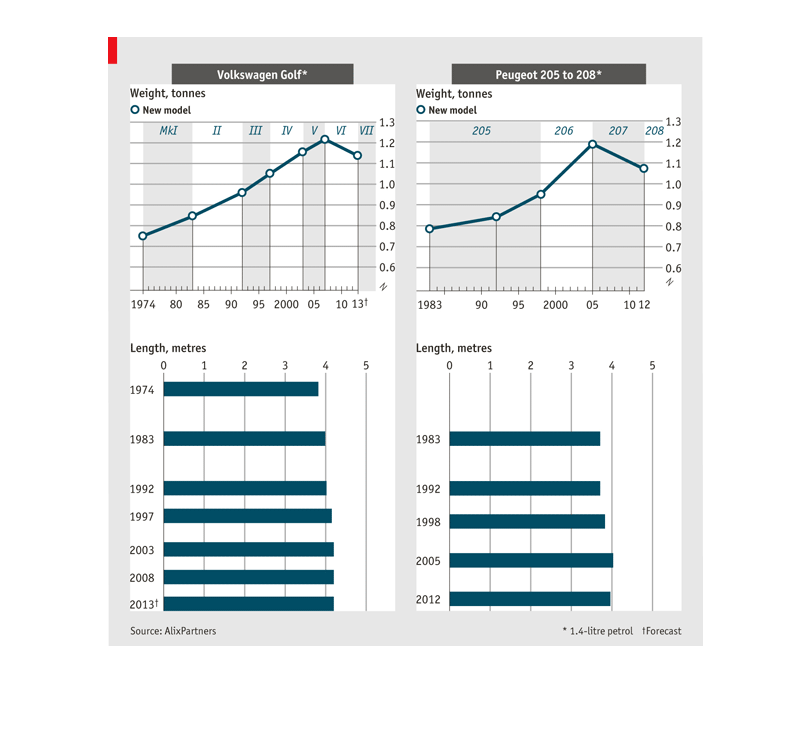
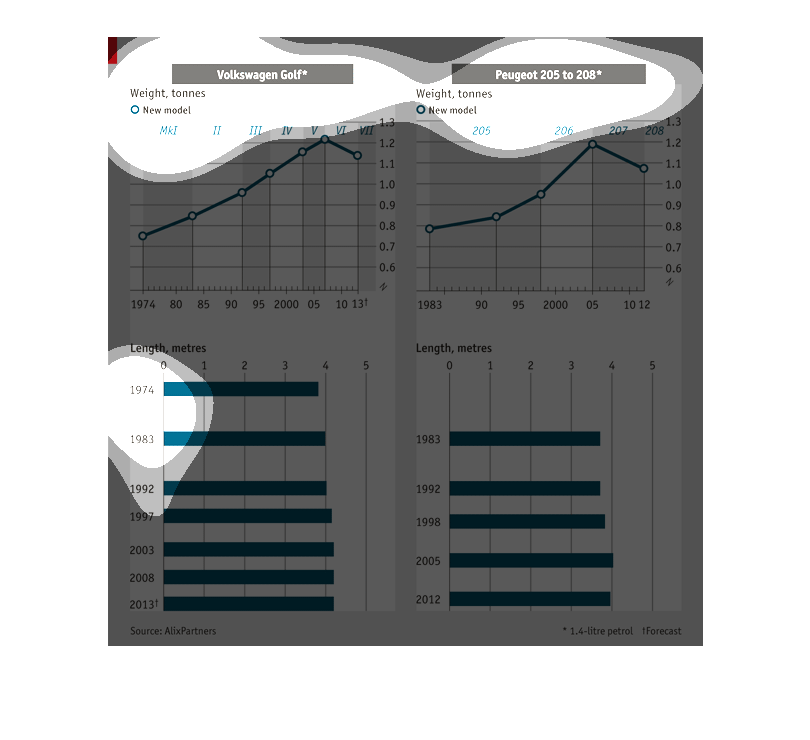
A comparison chart of the Volkswagon Golf and Puegot 205 to 208 cars. Comparing Weights and
Tonnage for models by years. Both show increase in weight until recent down trend
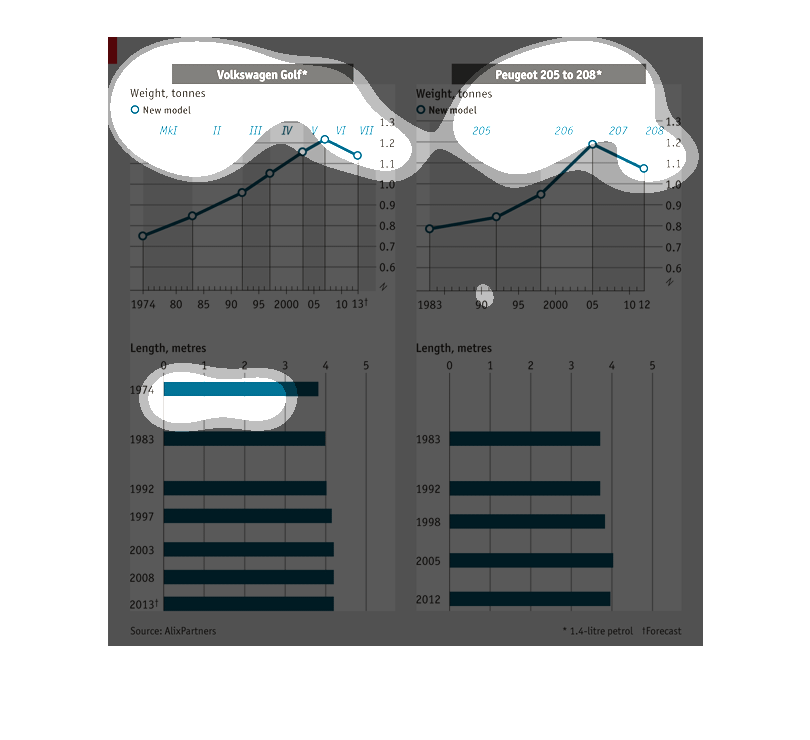
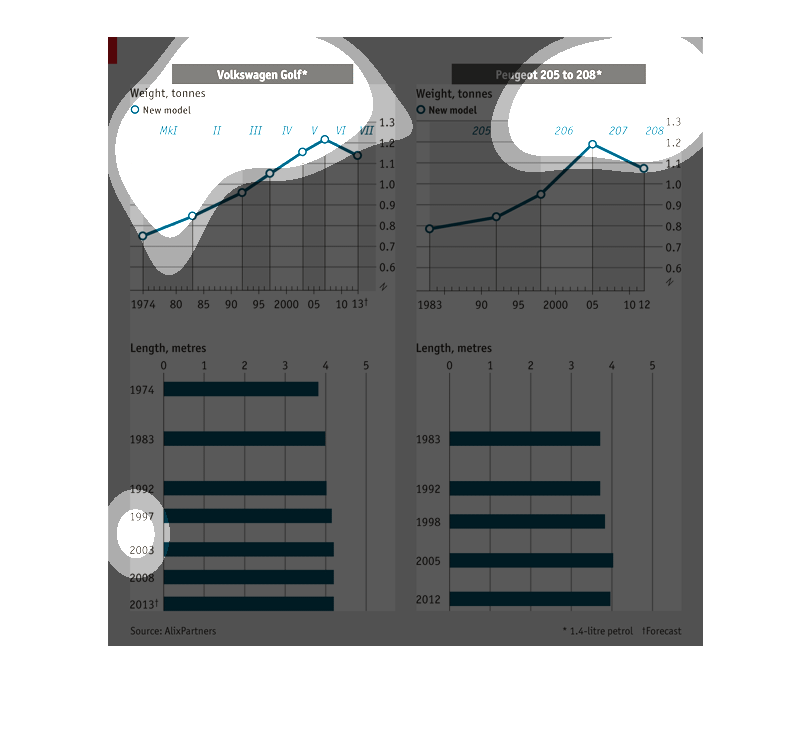
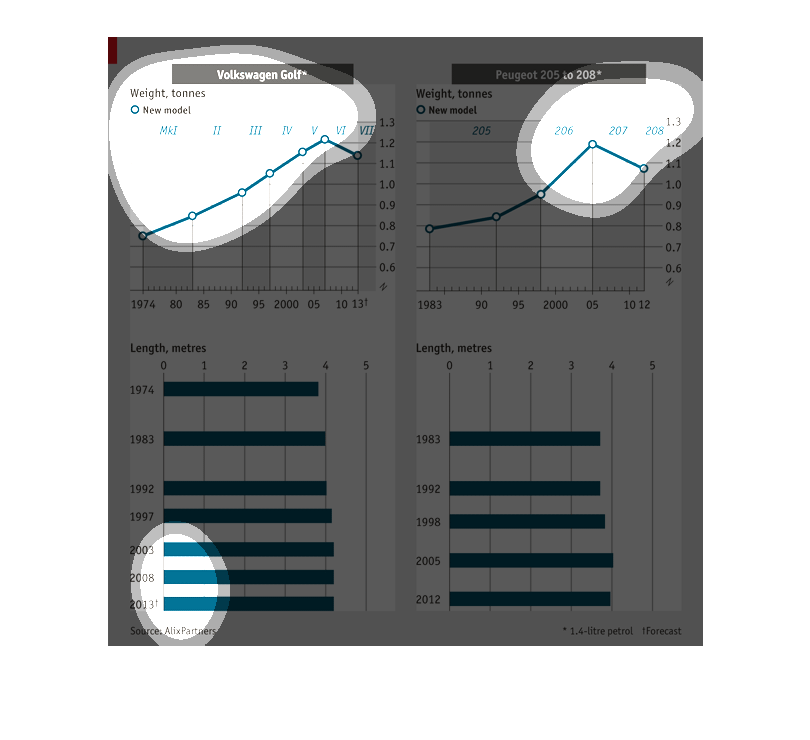
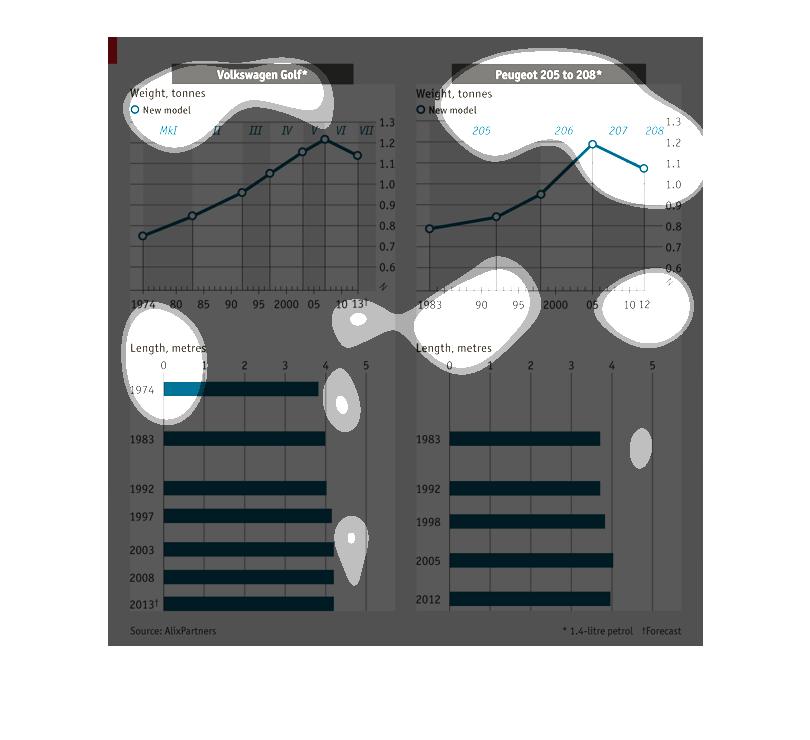
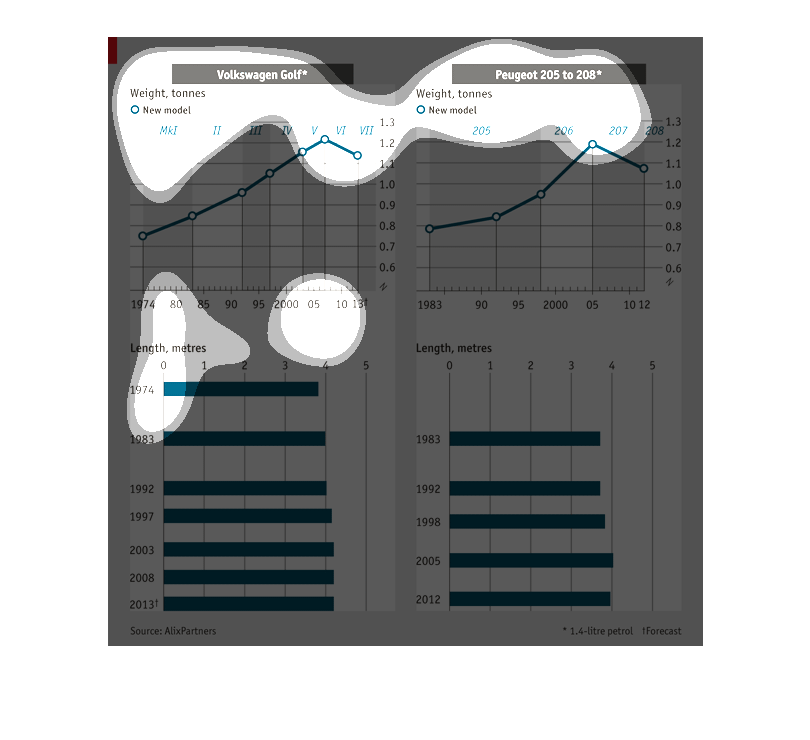
Volkswagen Golf ad the Peugeout car. The graphs are looking at weight in tonnes of the two
cars to evaluate things to decide what the trends are between the two cars
This chart describes the Volkswagen Golf and the Peugeot 205 to 208. Specifically weight,
tonnes. The chart is divided between both new models. The chart covers the years 1974 through
2013.
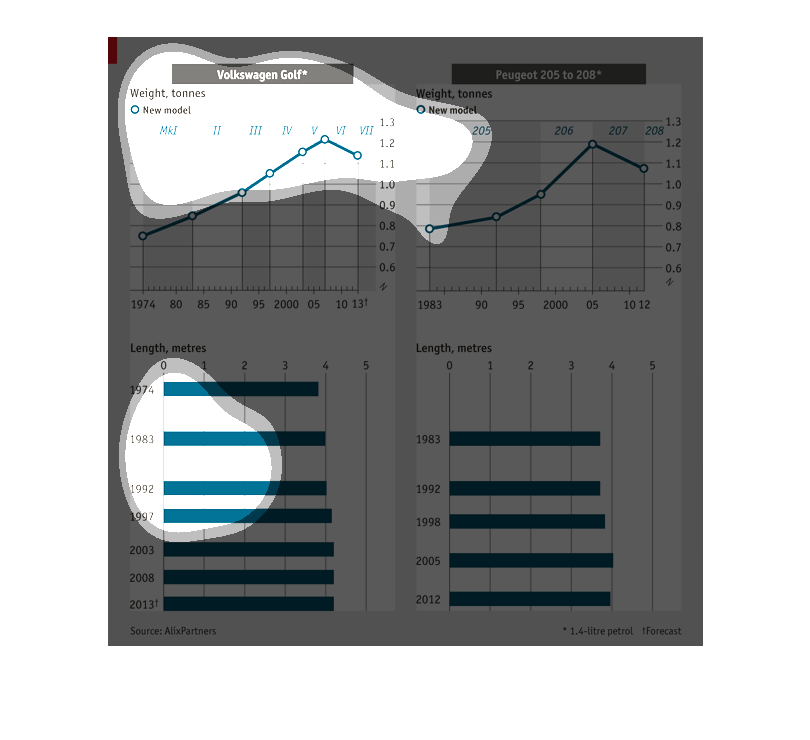
This is an info-graphic describing the differences between the Volkswagen Golf and the Peugeot
205 to 208. Both cars increase in weight of tonnes with each model and the subsequent years,
until the last model listed in which the weight was reduced from the previous model. It also
described the length of the two cars over the years. Although they have grown in size in recent
years, the change has been a subtle one. Less than half a meter difference between the first
and last models listed for both car companies can be seen.
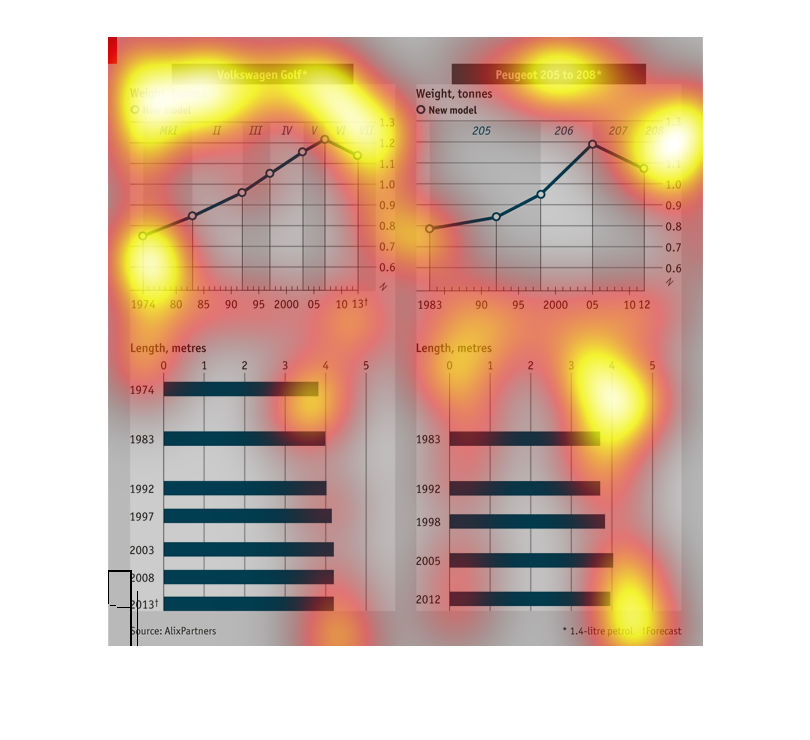
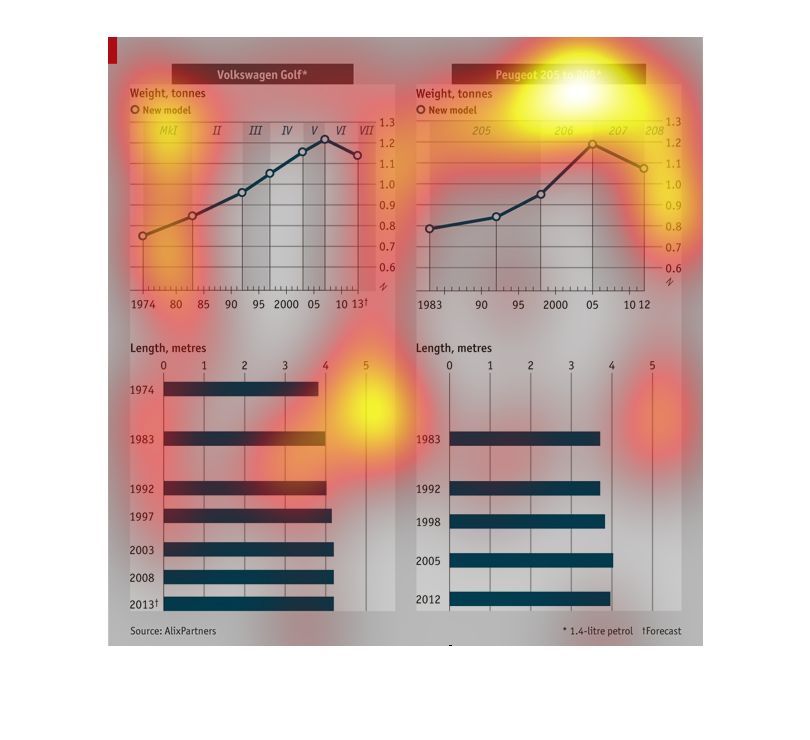
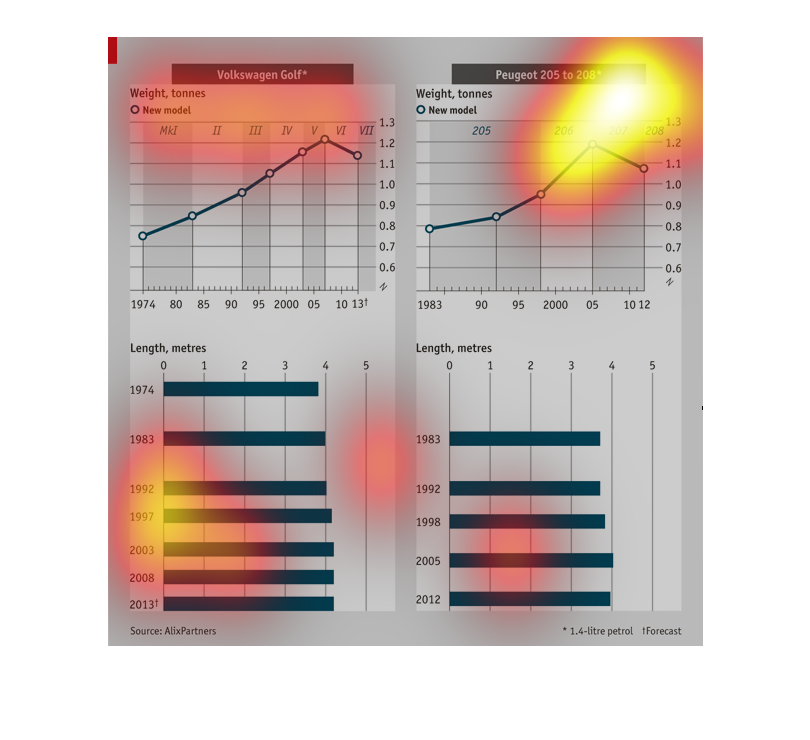
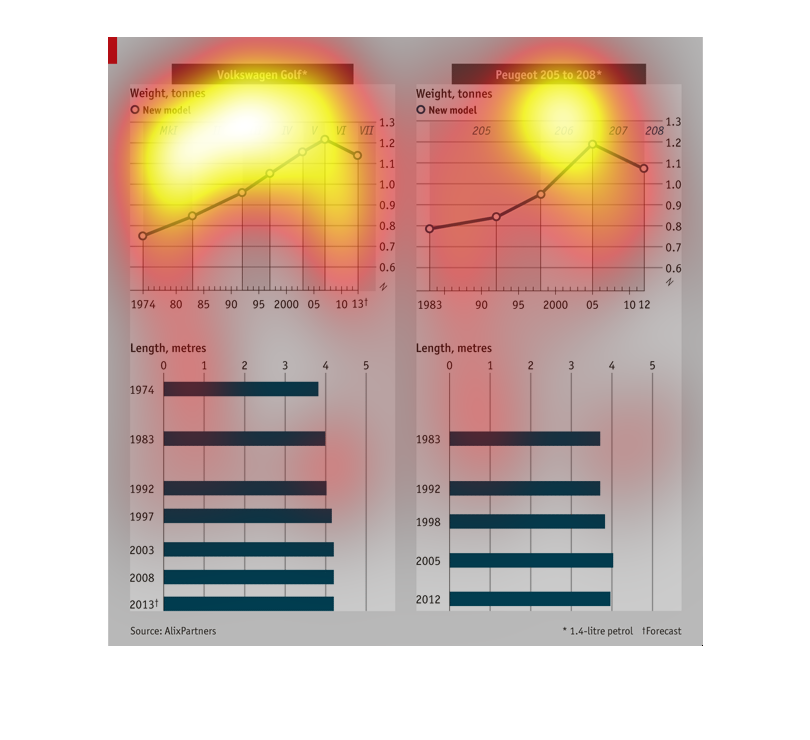
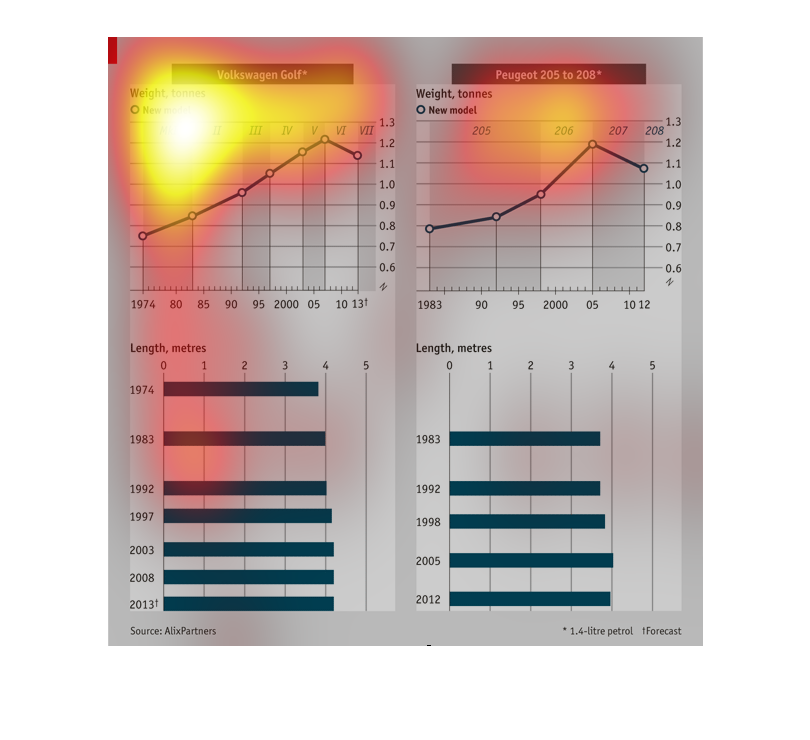
There are four charts in this picture.  The top two pictures are line line point charts about
the weight in tonnes of two different cars, the Volkswagon Golf and the Peuygect 205.  The
first chart dates from 1974 to 2013.  While the second dates from 1983 to 2012.  Both cars
steadily gained weight until peaking around the year 2005, where they've since gotten lighter.
 The bottom two charts list the length of the cars.  Both have gotten a little under a half
a meter longer in the years they've been in production.
Growth in the weight in tonnage of the Volkswagon Golf sedan over time from 1980s to present.
It is only for the golf sedan and not the other VW cars
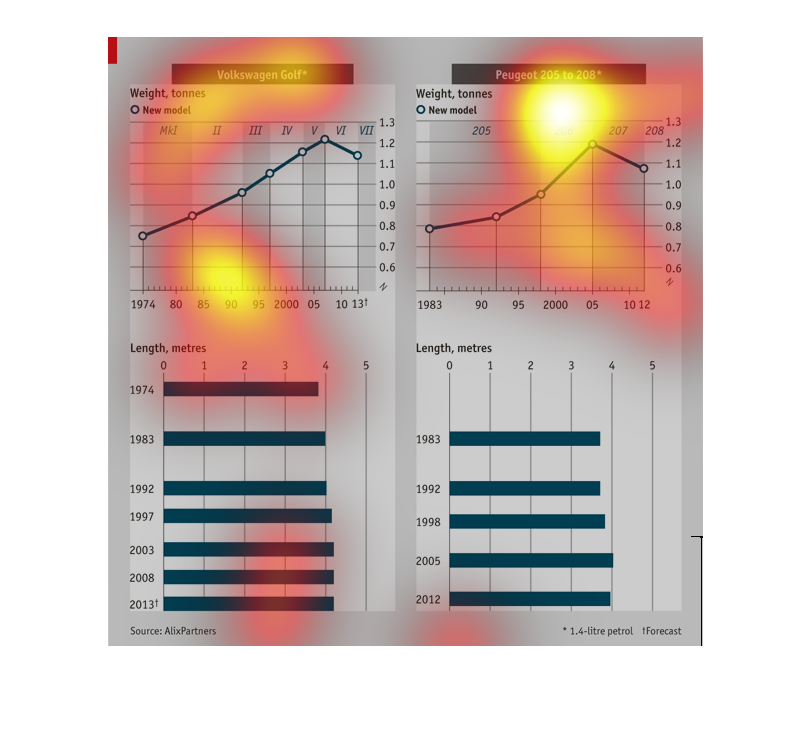
The image shows both English and a foreign language graph accounting for Volkswagen Golf's
sizing (both length in meters and weight in tons) for new models. It shows that over time
the length and weight increased up until around 2007, when we started seeing decreases in
weight.
Two comparison graphs of similarities and differences in weight and length between a Volkswagen
Golf (years 1974 - 2013) and the Peugeot 205 to 208 (years 1983 - 2012).
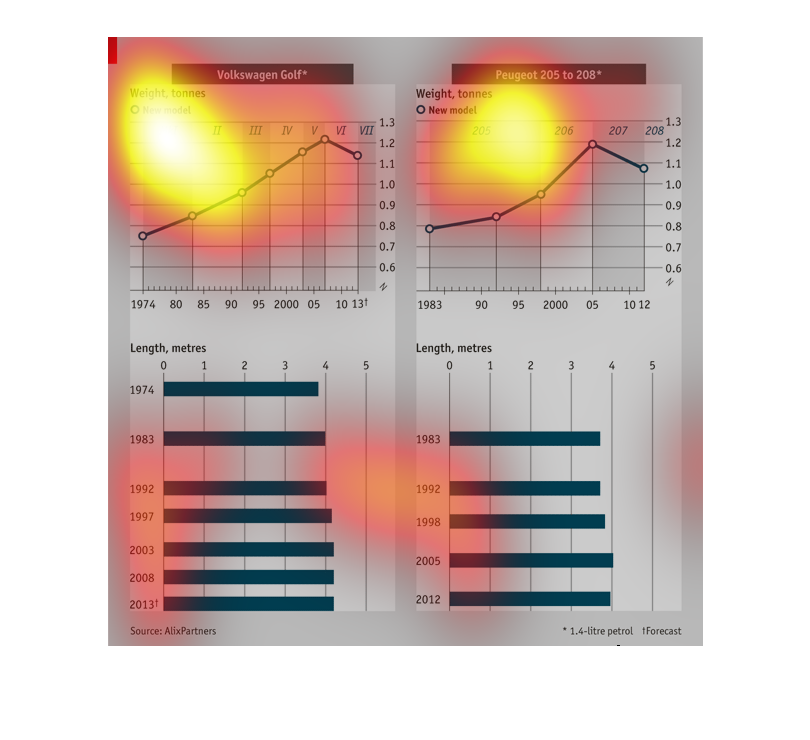
The chart on the top left describes the evolution of the weight of the Volkswagen Golf, by
year.  The chart on the top right does the same thing for the Peugeout.  The chart on the
bottom left measures the length in meters of the Volkswagen Golf, by year; the bottom right
does the same for the Peugout.
This is a chart apparently comparing the Volkswagon Golf, and the Peugeot 205 to 208 in terns
of weight and length. It runs from roughly 1974 to 2013.