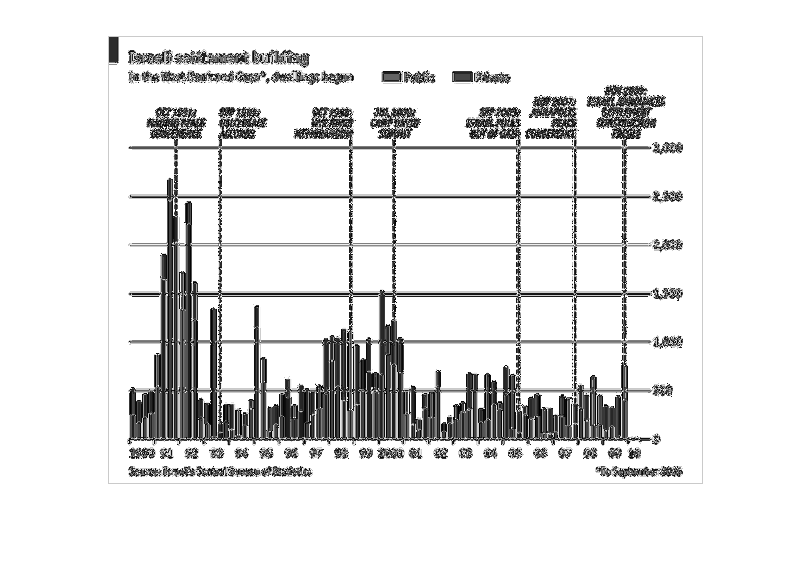
A bar chart of Israeli Settlement Building in the West Bank and Gaza from 1990 to 2010 with
major diplomatic events listed as a comparison on the chart
Error using .*
Matrix dimensions must agree.

Error in plotSpotlight (line 30)
    output = repmat(a,[1 1 3]).*single(im)/255;

Error in plot_individual_user_maps (line 49)
        [heat] = plotSpotlight(im,heatmap,3);