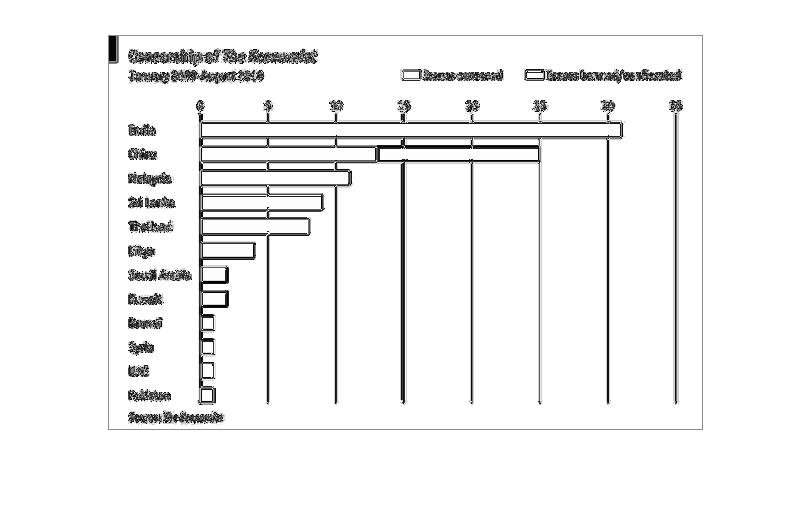
This graph shows the censorship of the economist dating from January 2009 - August 2010. Is
shows the issues censored and the issues banned/confiscated.
Error using .*
Matrix dimensions must agree.

Error in plotSpotlight (line 30)
    output = repmat(a,[1 1 3]).*single(im)/255;

Error in plot_individual_user_maps (line 49)
        [heat] = plotSpotlight(im,heatmap,3);