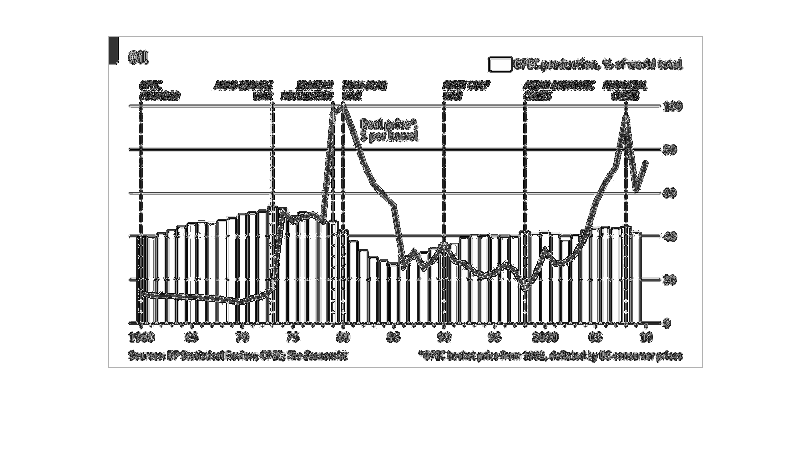
This graph displays OPEC funded oil through the years 1960-2010 while showcasing important
events such as periods of dispute, and the effects on oil prices per barrel.
Error using .*
Matrix dimensions must agree.

Error in plotSpotlight (line 30)
    output = repmat(a,[1 1 3]).*single(im)/255;

Error in plot_individual_user_maps (line 49)
        [heat] = plotSpotlight(im,heatmap,3);