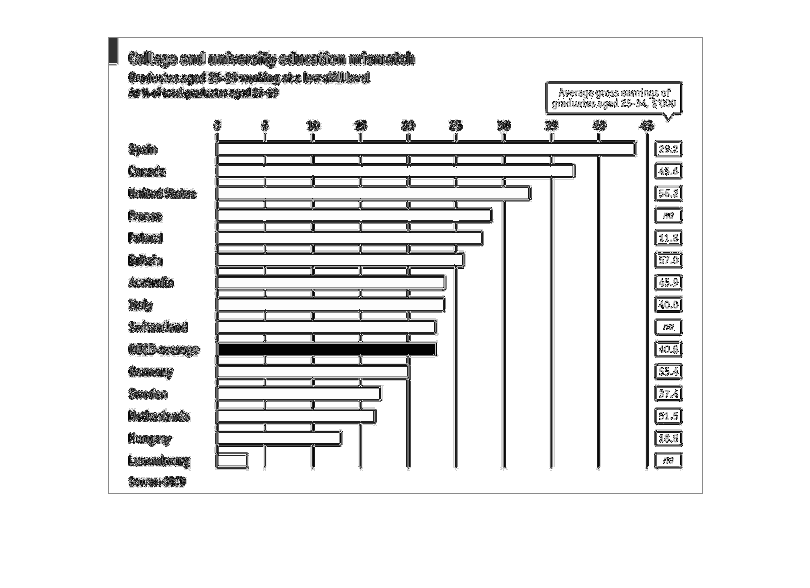
This chart show how recent graduates (ages25-29) have been getting jobs and working in positions
below their skill levels. The graph is separated by country.
Error using .*
Matrix dimensions must agree.

Error in plotSpotlight (line 30)
    output = repmat(a,[1 1 3]).*single(im)/255;

Error in plot_individual_user_maps (line 49)
        [heat] = plotSpotlight(im,heatmap,3);