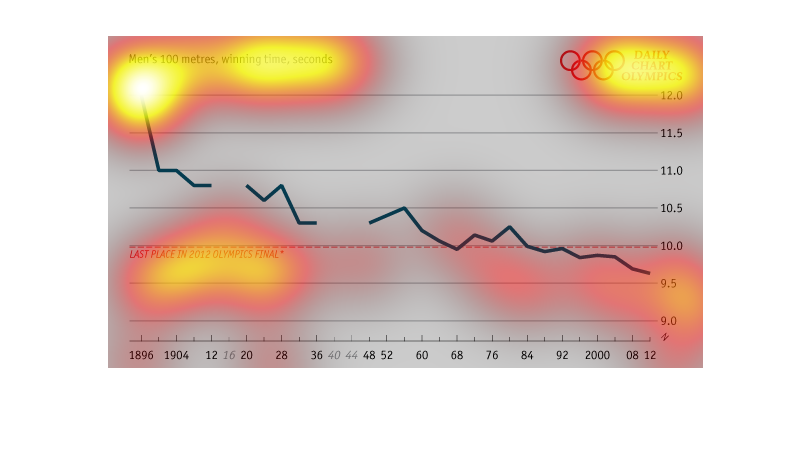
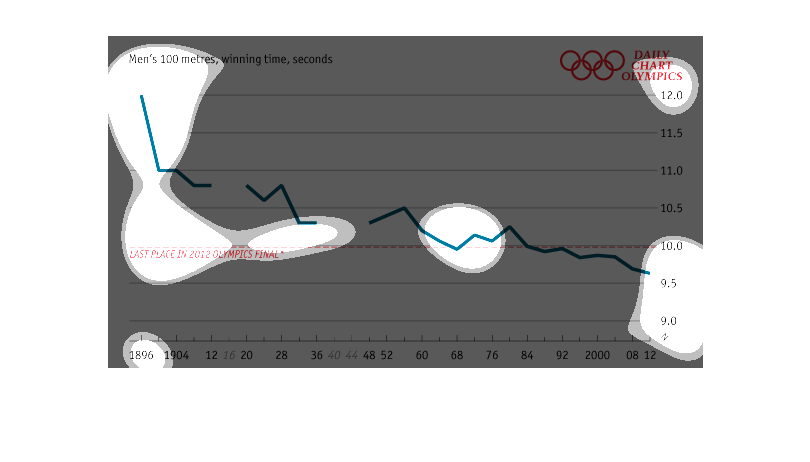
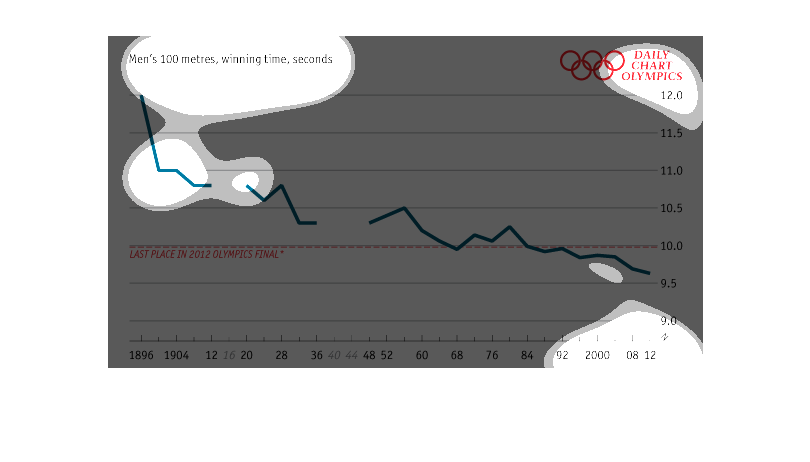
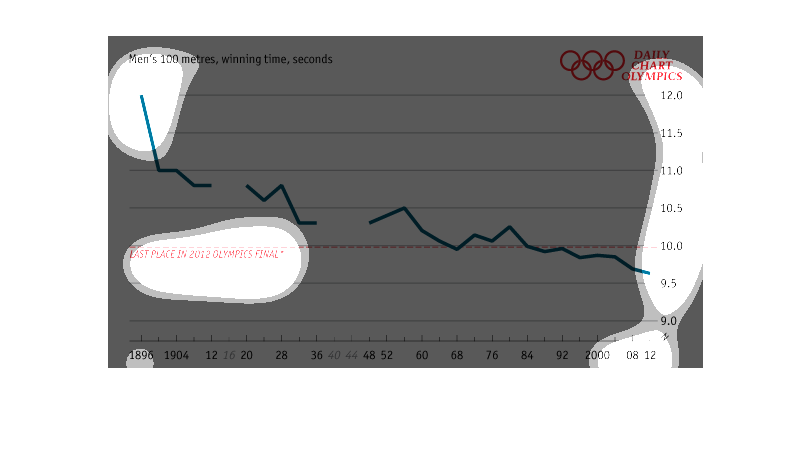
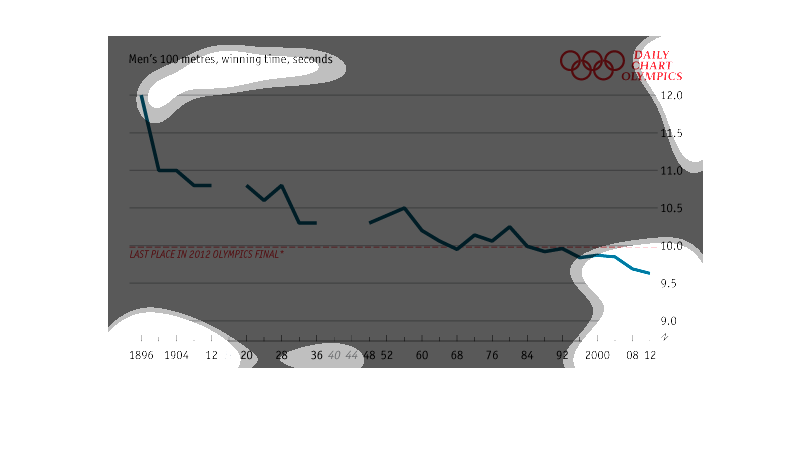
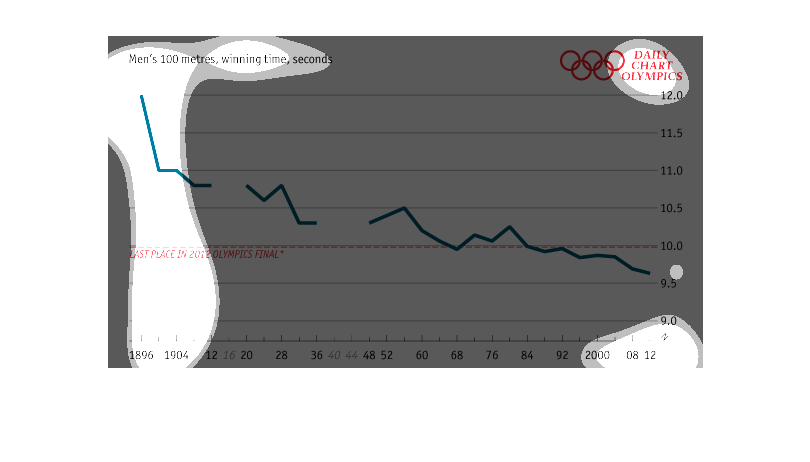
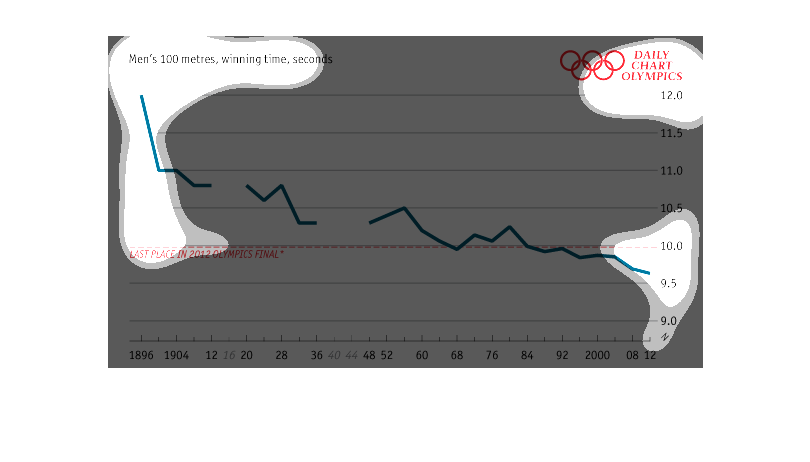
This chart shows mens 100 meters winning time in seconds from 1896 to 2012. In 1896 the winning
time was 12 seconds. Not until 1968 did the winning time fall below the level of the last
place person in the 2012 olympic finals. The world record was set in 2012 at just over 9.5
seconds.
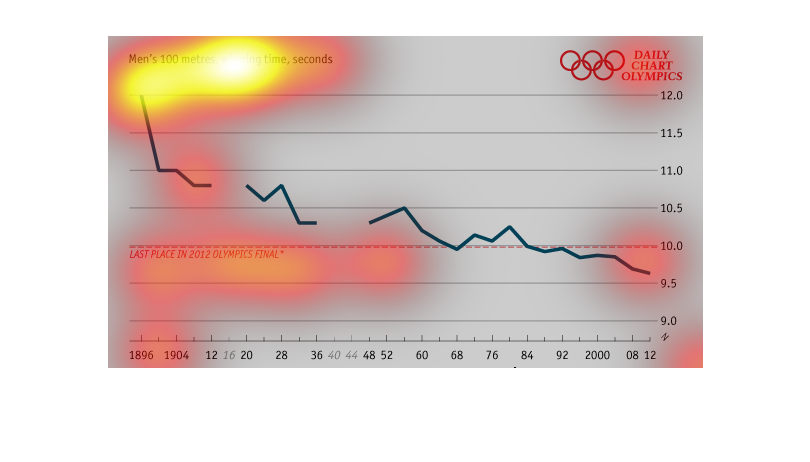
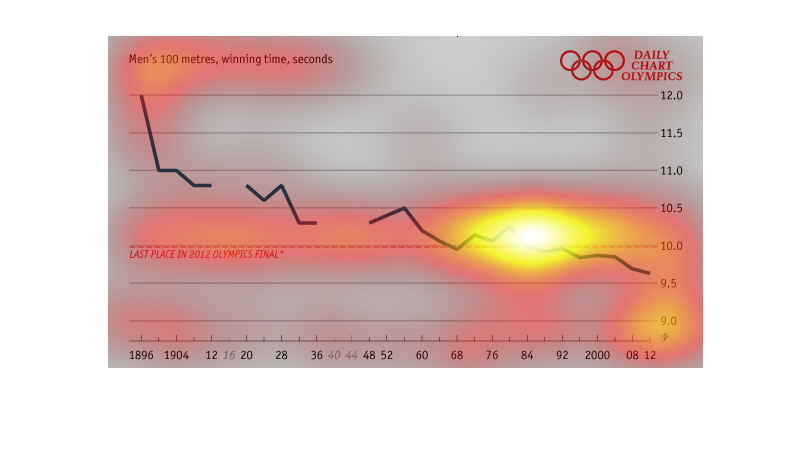
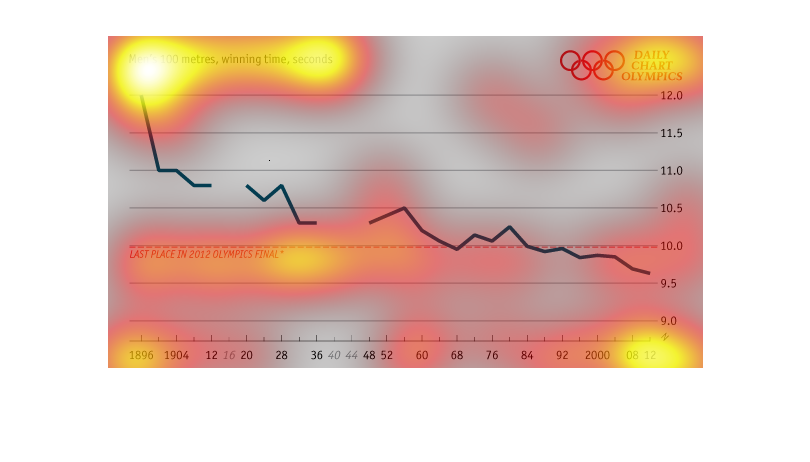
This chart describes the men's 100 meters. Specifically the winning time in seconds. The chart
covers the years 1896 though to the year 2012. With the peak coming in 1896.
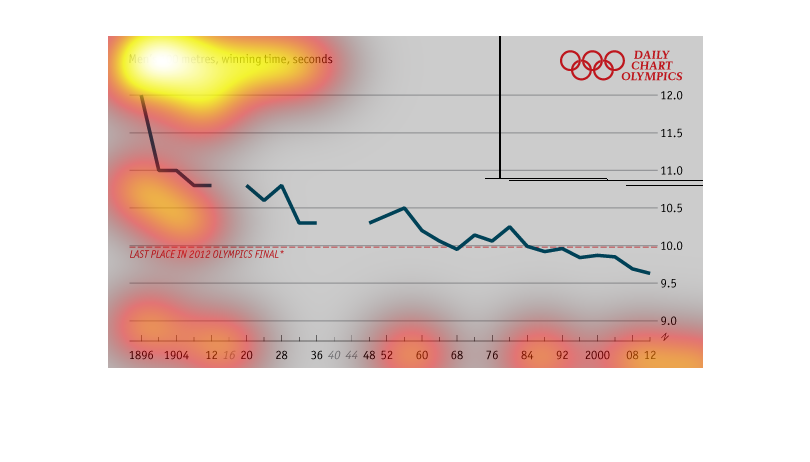
Men's one hundred meter sprint winning times provided by the olympics. What we see is a predictable
decrease in the amount of time it has taken over the last century's worth of olympic data
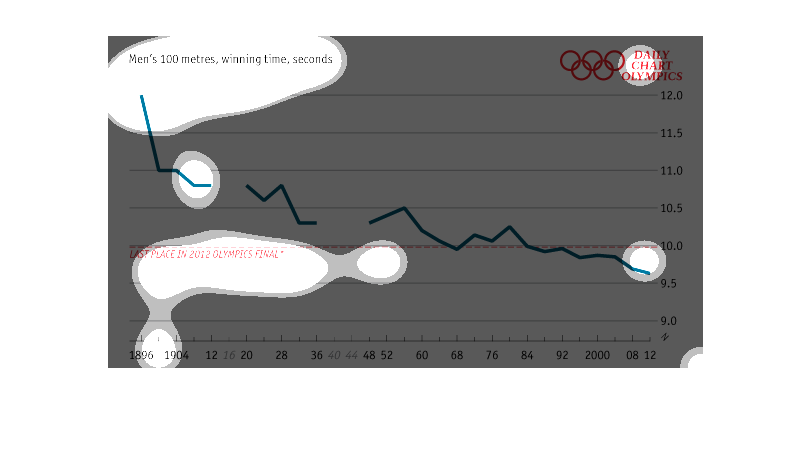
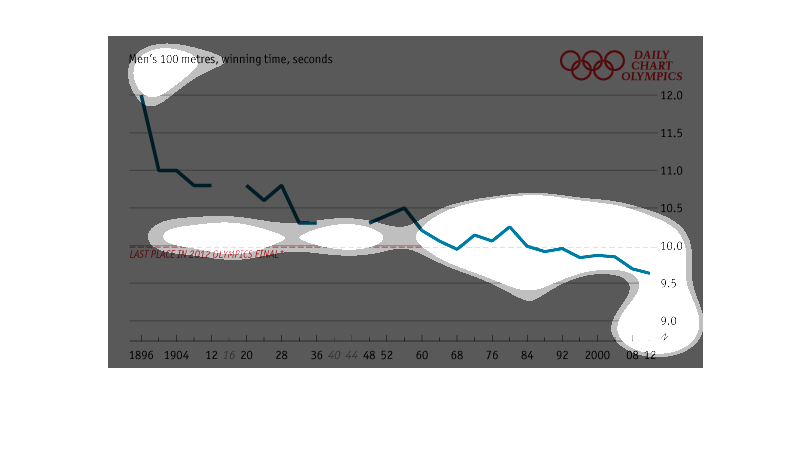
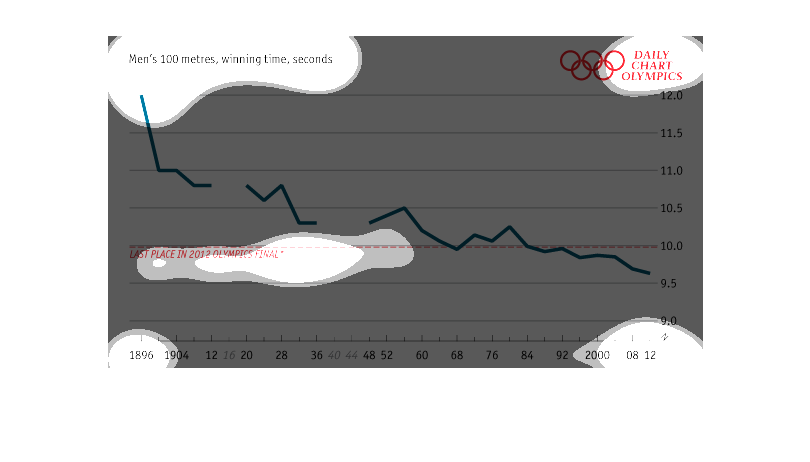
This chart depicts the winning time in the Men's 100 meter swimming event in the Olympics,
for various Olympiads.  The last place time in the 2012 event is shown as a benchmark.
It shows men running 100 meters in seconds for Olympic finalists. The chart starts at 1986
and ends at 2012. It seems that over the years men have gotten much faster at running 100
meters.
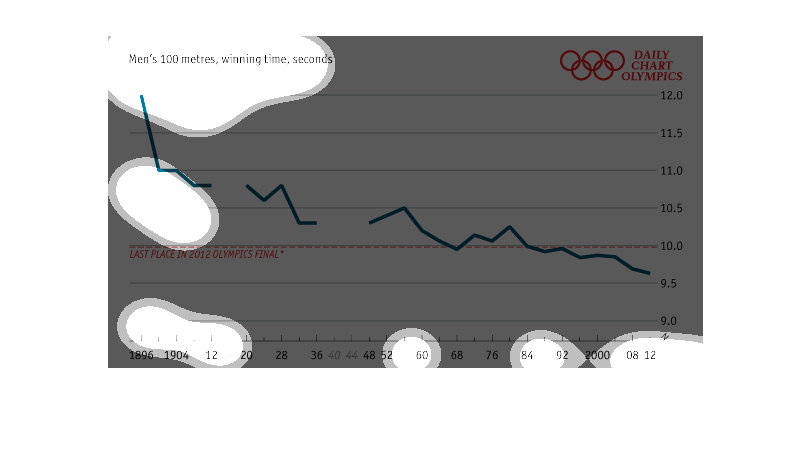
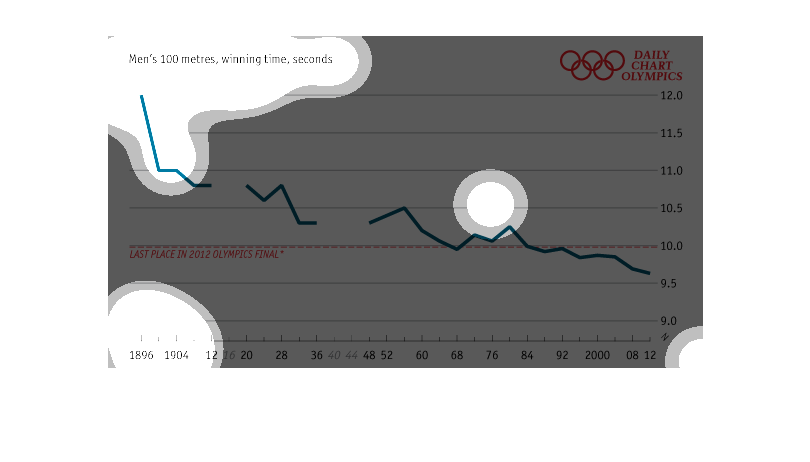
This chart shows data from the Olympic Men's 100 metres races. It charts the winning time
in seconds. Data includes the years from 1896-2012. The times have steadily decreased over
the years.
Men based 100 meter winning times in seconds, from daily chart olympics. 1896 began the chart
and up too 2012. seconds are ran in 9-12 increments, steady over time the times have gotten
shorter.
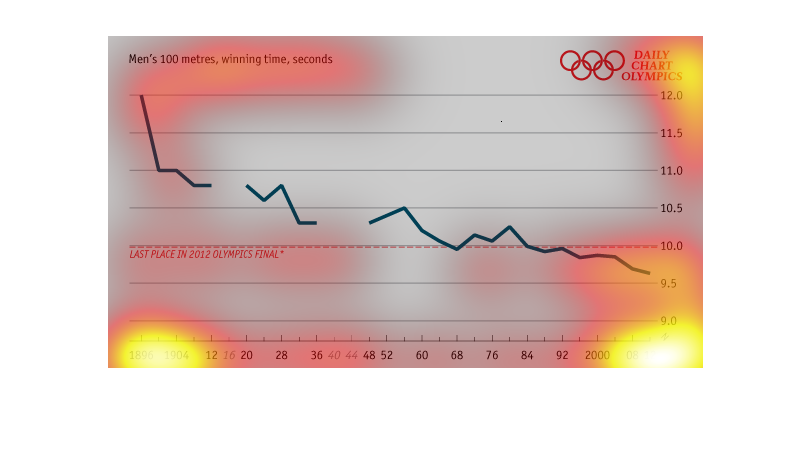
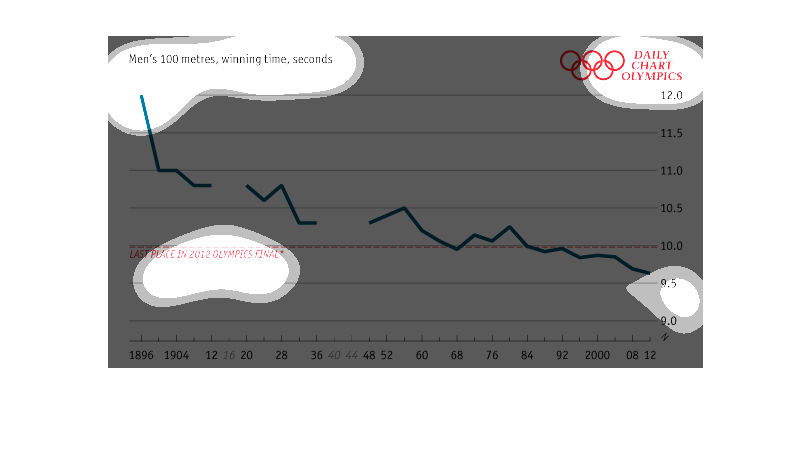
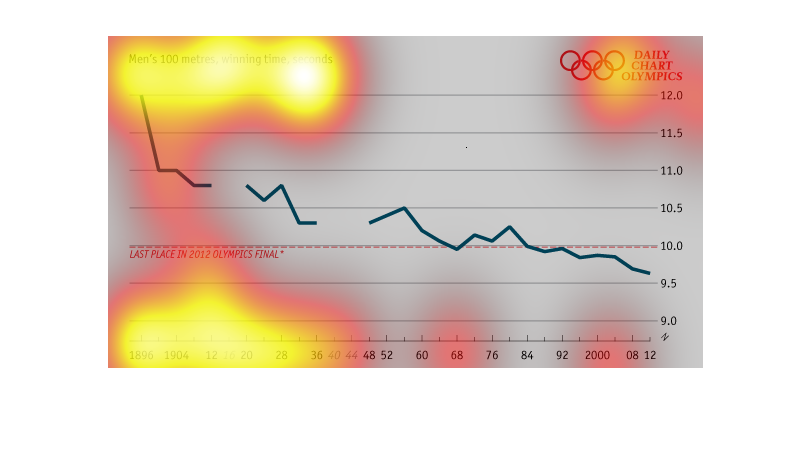
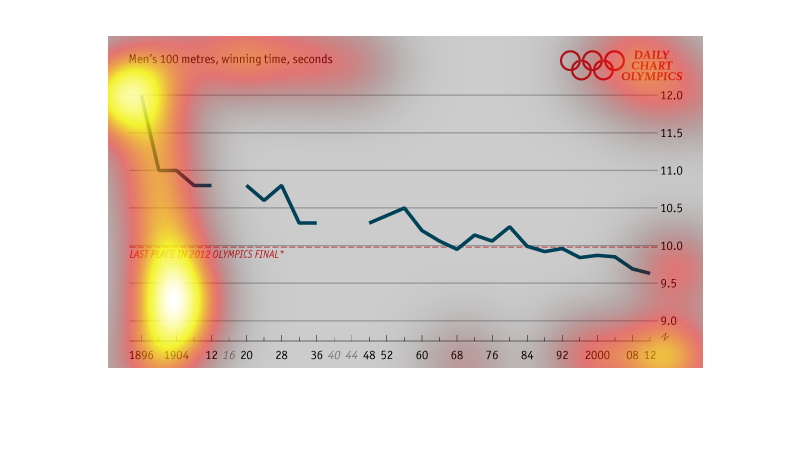
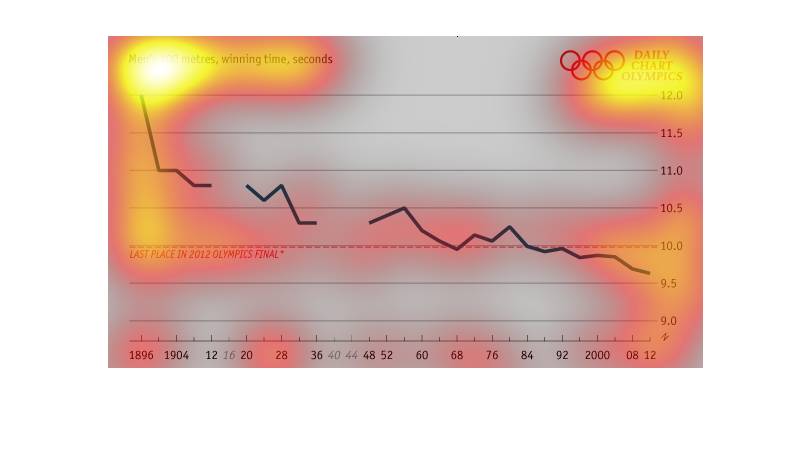
This graph shows men's 100 meter winning times in seconds from the Olympics from 1896 to 2012.
The blue line on the graph shows that men's 100 meter winning times have gotten shorter and
shorter over time. There is a red, dotted horizontal line on the graph that shows the time
for the last place men's 100 meter time in 2012. The graph shows that many winning times before
the 1980's were actually longer than the last place time in 2012.
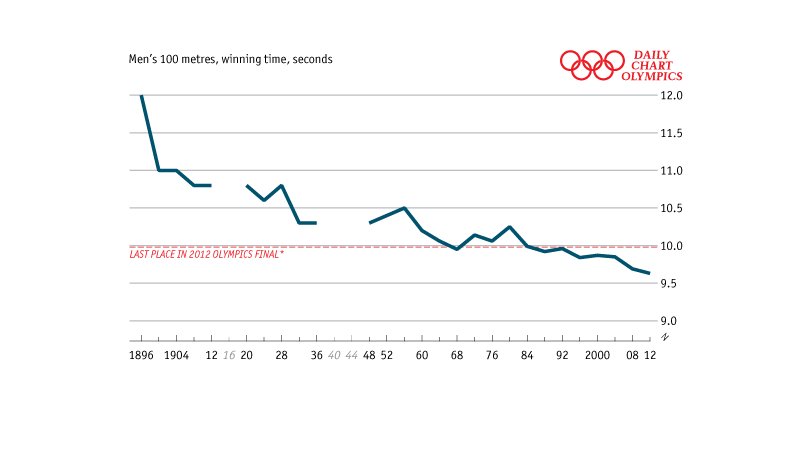
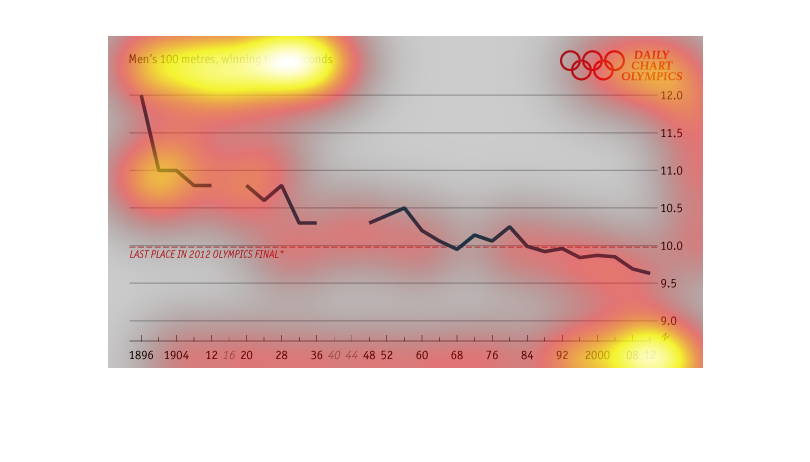
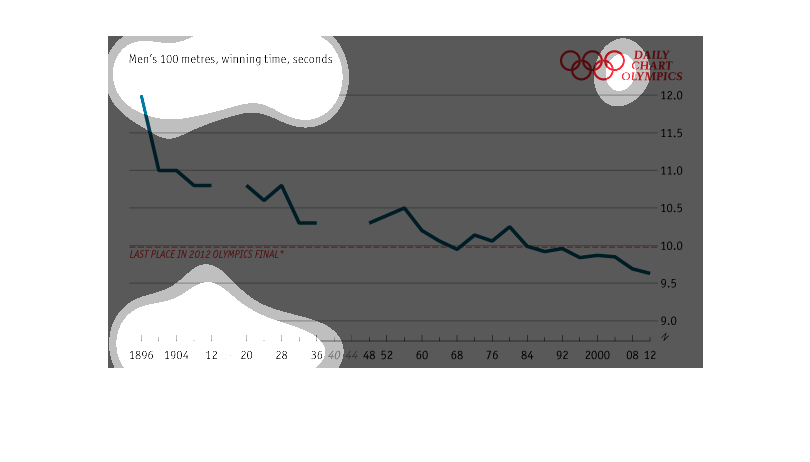
This chart shows the winning times in seconds of the Olympic men's 100 meter dash. The chart
starts in 1896 and runs through 2012. the time in 1896 was 12 seconds and in 2012 was 9.5.
This chart examines the Men's 100 meter's race by time in seconds over the years 1986-2012.
 It appears the average amount of time it took to complete the race decreased over all.
This image measure Olympic 100 meter times in seconds.  It begins in 1896 and ends in 2012.
 The colors used are mainly red and blue, while the numbers are written in black.
This is a chart depicting winning times in the mens 100 meter dash over time, from the years
1896 to 2012. It shows a long term trend and steadily falling times.
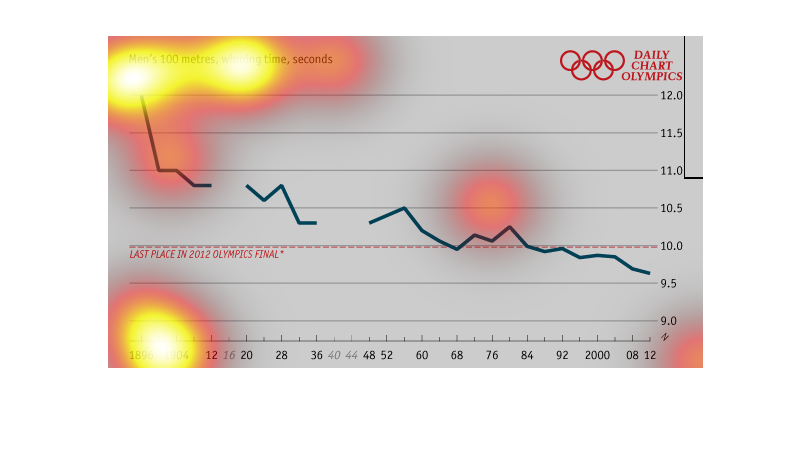
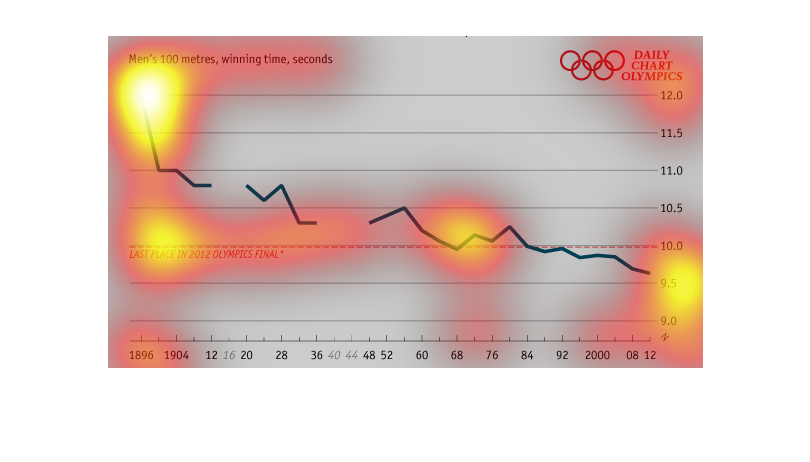
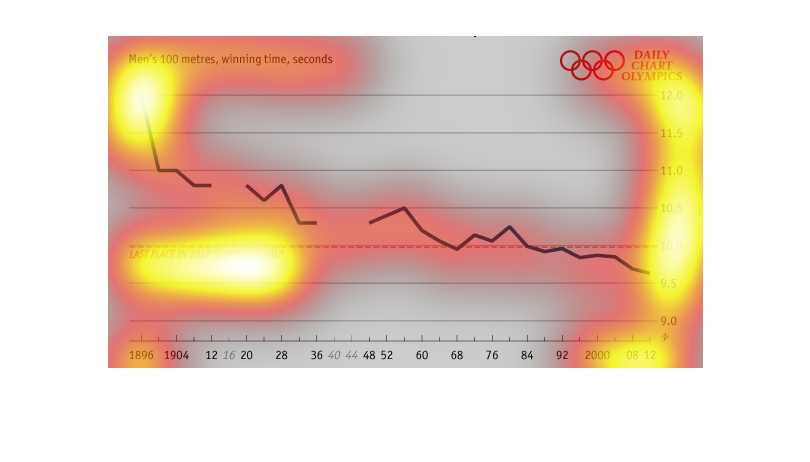
This chart shows the Men's 100 meters winning time, in seconds, for the Olympics. There is
also a threshold on the graph that shows the last place time of the 2012 Men's 100 meters.
From the chart, it can be seen that the much of the current trend is above that threshold,
however, there were some finishing times that were slower than the last place time of 2012.