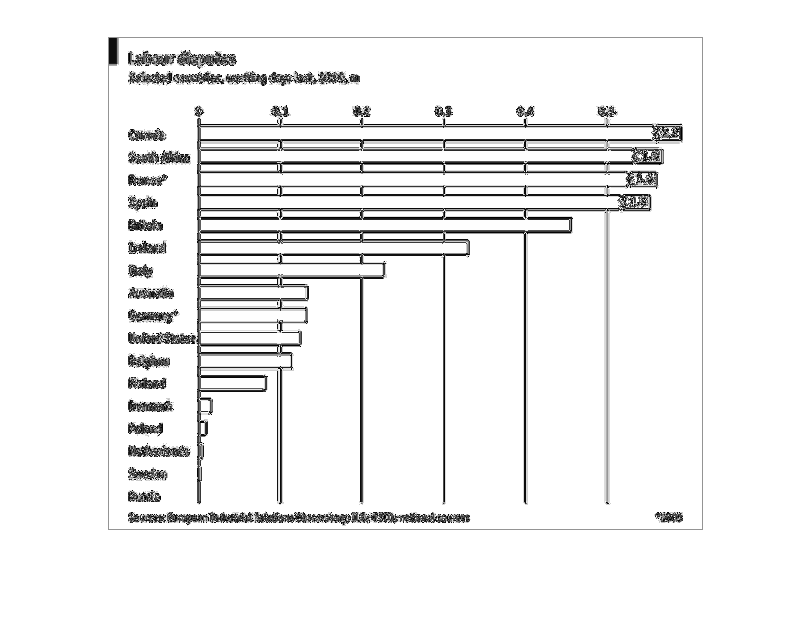
The graph shows the number of days lost due to labor disputes. Canada, South Africa, France
and Spain lead the graph with between 1.3 to 2.2 days lost where Russia is at the bottom with
no days lost.
Error using .*
Matrix dimensions must agree.

Error in plotSpotlight (line 30)
    output = repmat(a,[1 1 3]).*single(im)/255;

Error in plot_individual_user_maps (line 49)
        [heat] = plotSpotlight(im,heatmap,3);