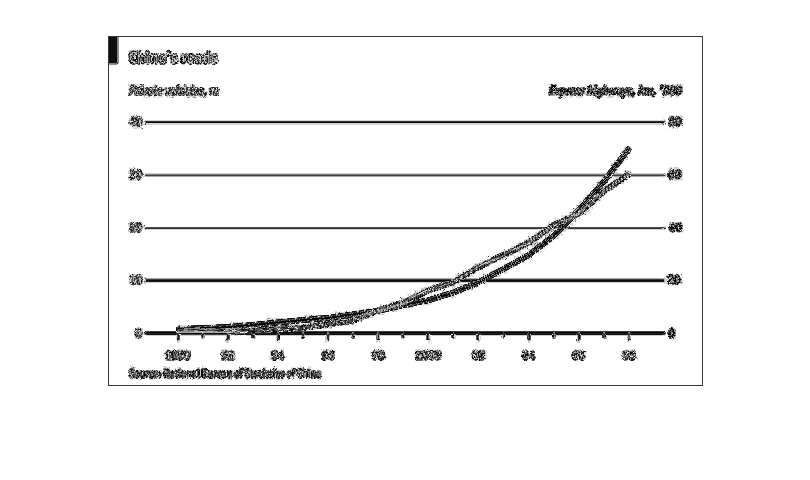
The image represents the amount of people on China's roads from 1990 to 2008. A blue line
represents the distance of private vehicles, while the red line represents those on express
highways. Overall both rise until 2006, where the slope decreases for express highways.
Error using .*
Matrix dimensions must agree.

Error in plotSpotlight (line 30)
    output = repmat(a,[1 1 3]).*single(im)/255;

Error in plot_individual_user_maps (line 49)
        [heat] = plotSpotlight(im,heatmap,3);