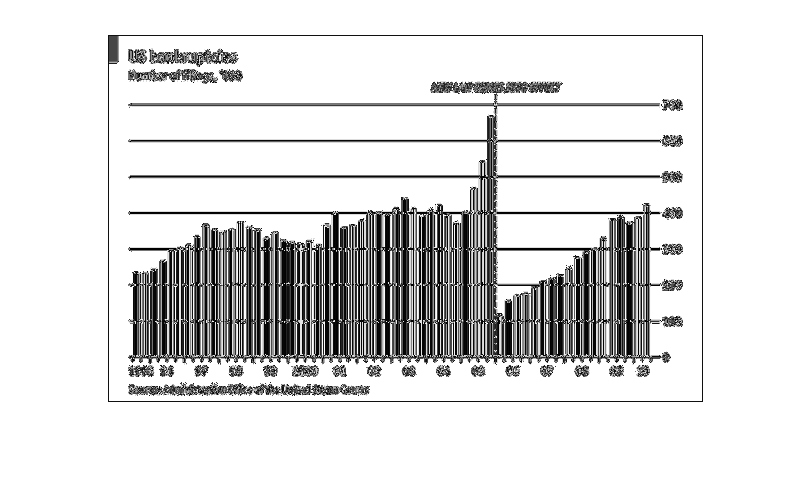
This chart describes US bankruptcies. Specifically the number of filings in the year 2000.
The chart covers the years 1995 through 2010. The highest spike on the chart comes in 2005.
Error using .*
Matrix dimensions must agree.

Error in plotSpotlight (line 30)
    output = repmat(a,[1 1 3]).*single(im)/255;

Error in plot_individual_user_maps (line 49)
        [heat] = plotSpotlight(im,heatmap,3);