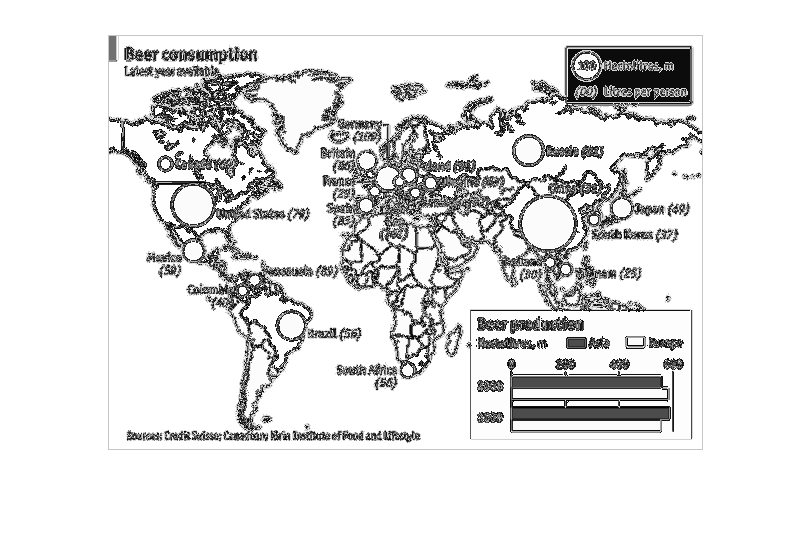
The title of this graph is, 'Beer consumption'.  The graph shows a flat map of the world.
 The continents are displayed with blue spheres of varying sizes, representative of different
countries consumption of this semiprecious beverage, 2008-2009.
Error using .*
Matrix dimensions must agree.

Error in plotSpotlight (line 30)
    output = repmat(a,[1 1 3]).*single(im)/255;

Error in plot_individual_user_maps (line 49)
        [heat] = plotSpotlight(im,heatmap,3);