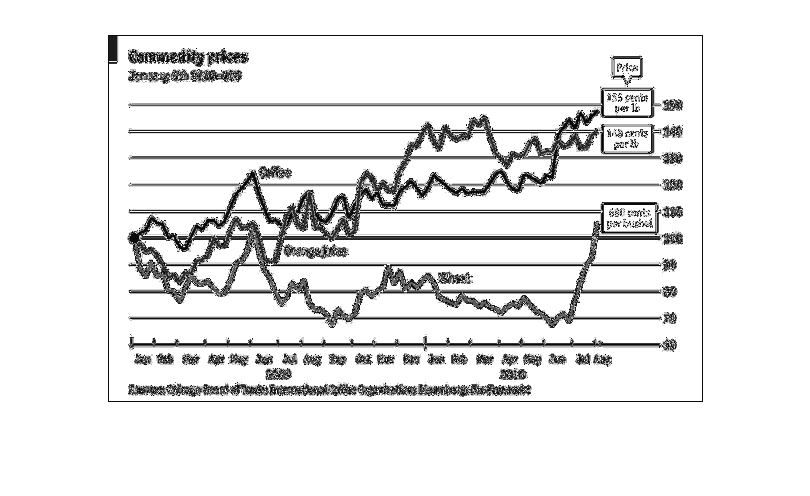
The graph describes Commodity Prices starting from January 2009 to August 2010. The commodities
graphed are coffee, orange juice, and wheat. Of the three, wheat pulls in the lowest costs
as time passes, marking 680 centers per bushel at the end of the study. Coffee has a price
spike between May and June of 2009, and it and orange juice jump back and forth for most of
2009, but at the end, coffees price is the highest at 155 cents per pound, with orange juice
at 148 cents per pound.
Error using .*
Matrix dimensions must agree.

Error in plotSpotlight (line 30)
    output = repmat(a,[1 1 3]).*single(im)/255;

Error in plot_individual_user_maps (line 49)
        [heat] = plotSpotlight(im,heatmap,3);