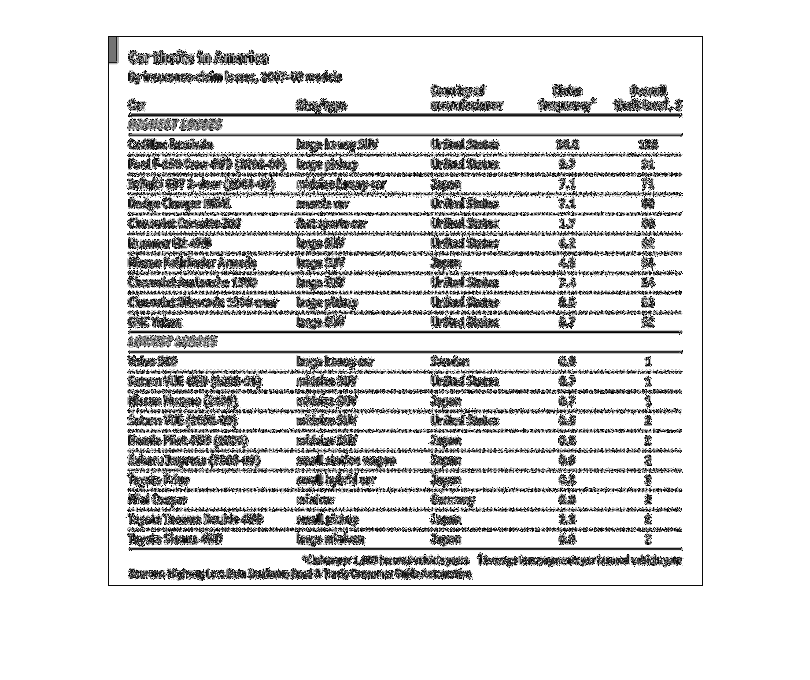
This chart is showing car thefts in america from 2007-2009.  The top part of the chart is
showing the cars with the highest losses such as the cadillac escalade.  While the lower chart
shows the cars with the lowest losses, such as the volvo s80.
Error using .*
Matrix dimensions must agree.

Error in plotSpotlight (line 30)
    output = repmat(a,[1 1 3]).*single(im)/255;

Error in plot_individual_user_maps (line 49)
        [heat] = plotSpotlight(im,heatmap,3);