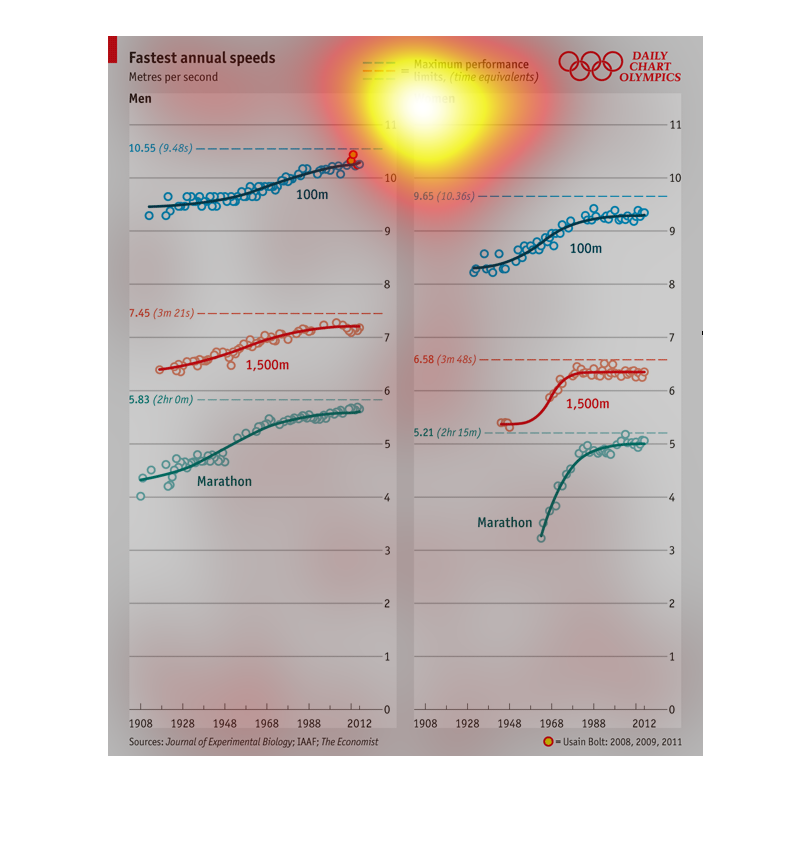
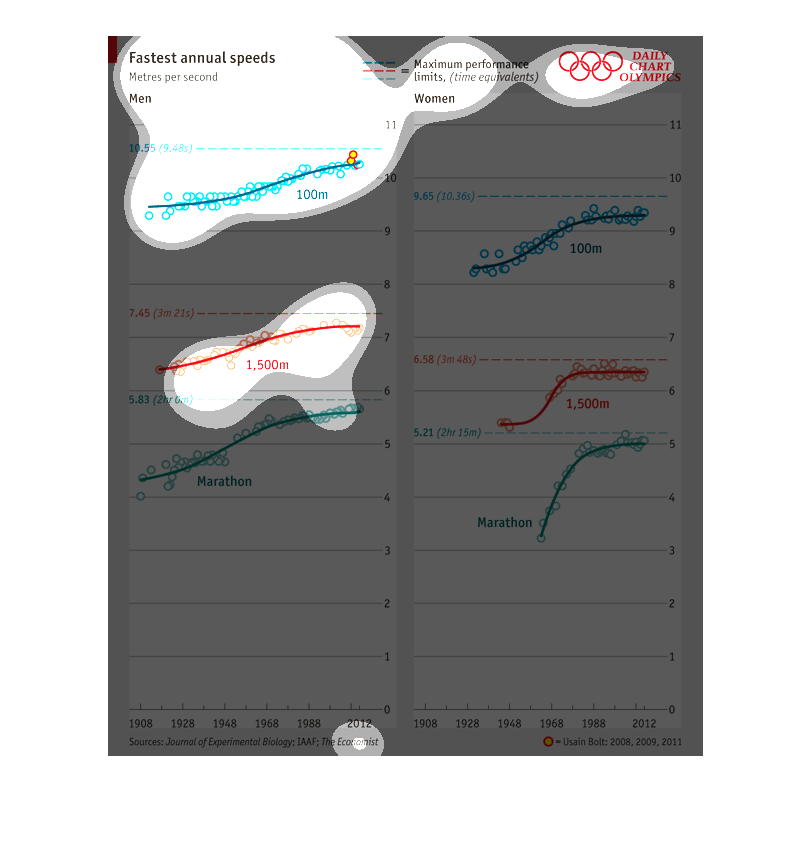
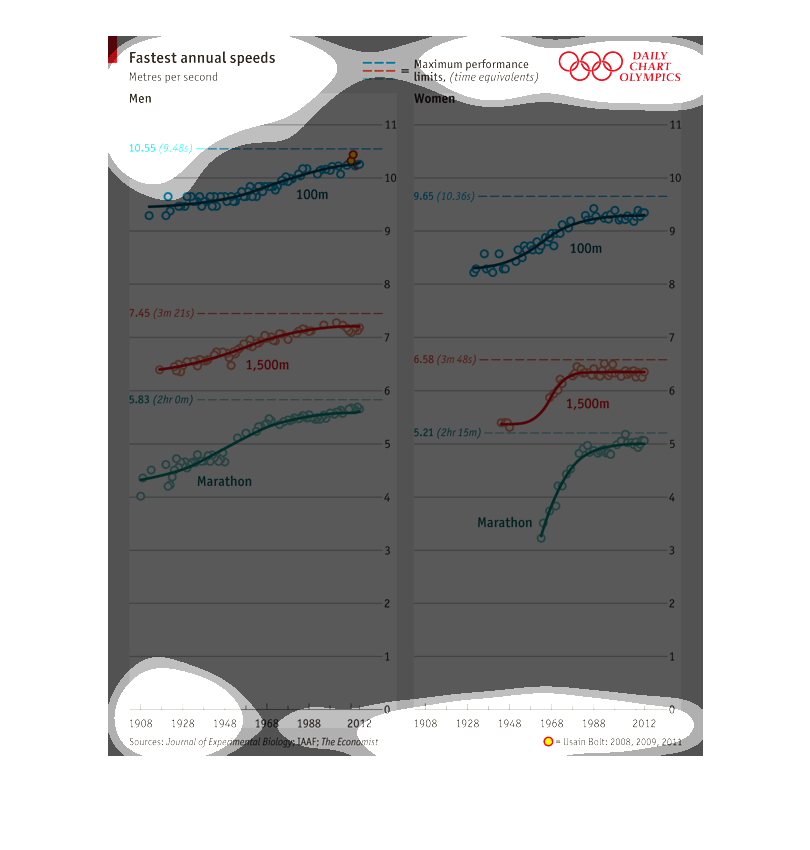
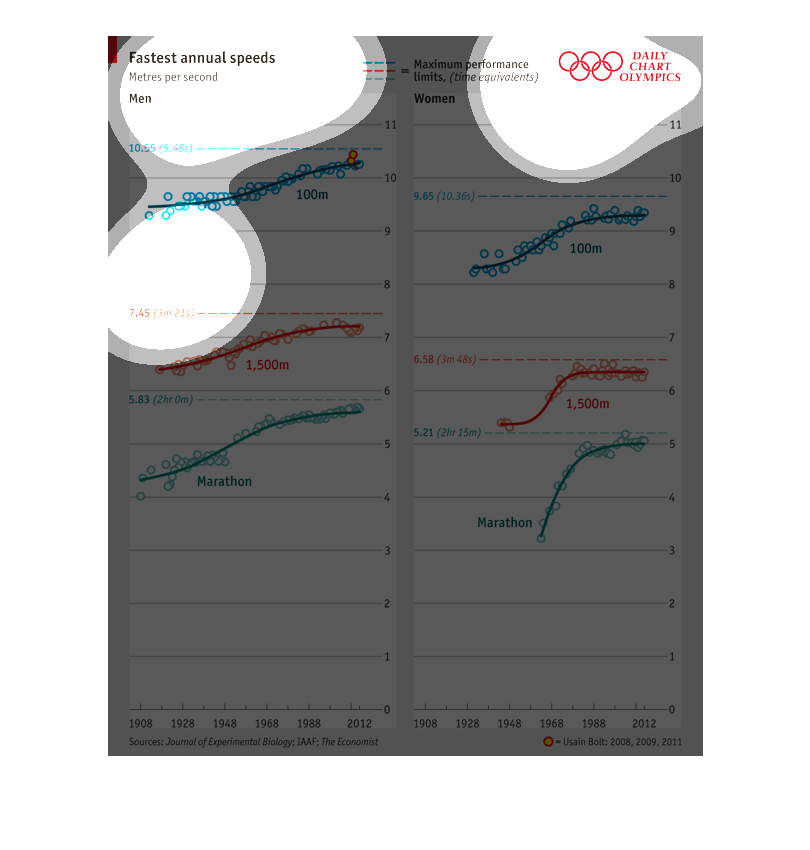
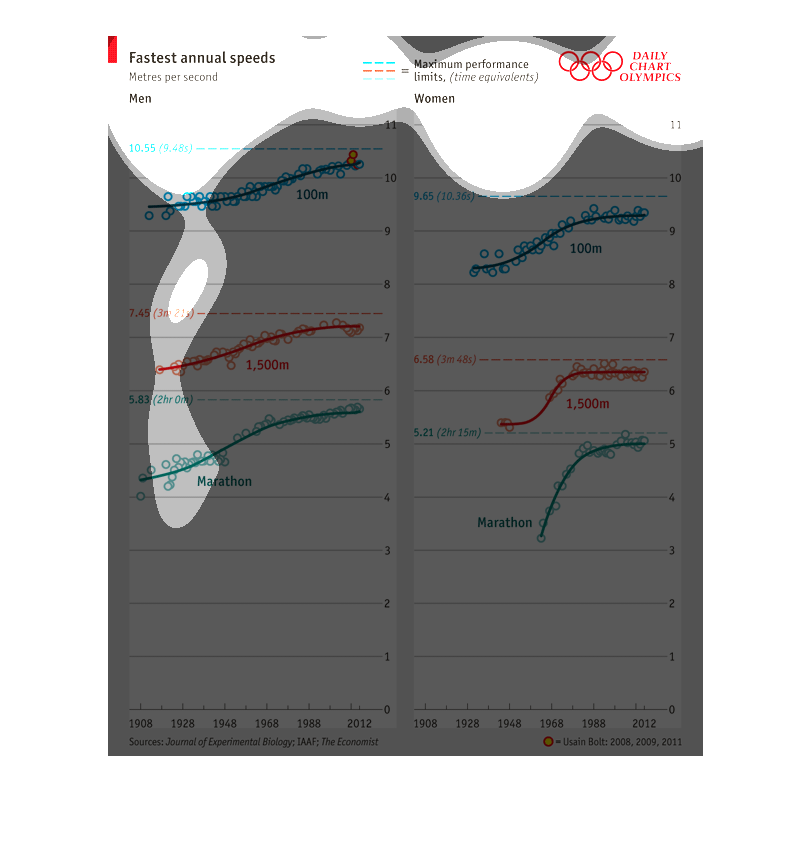
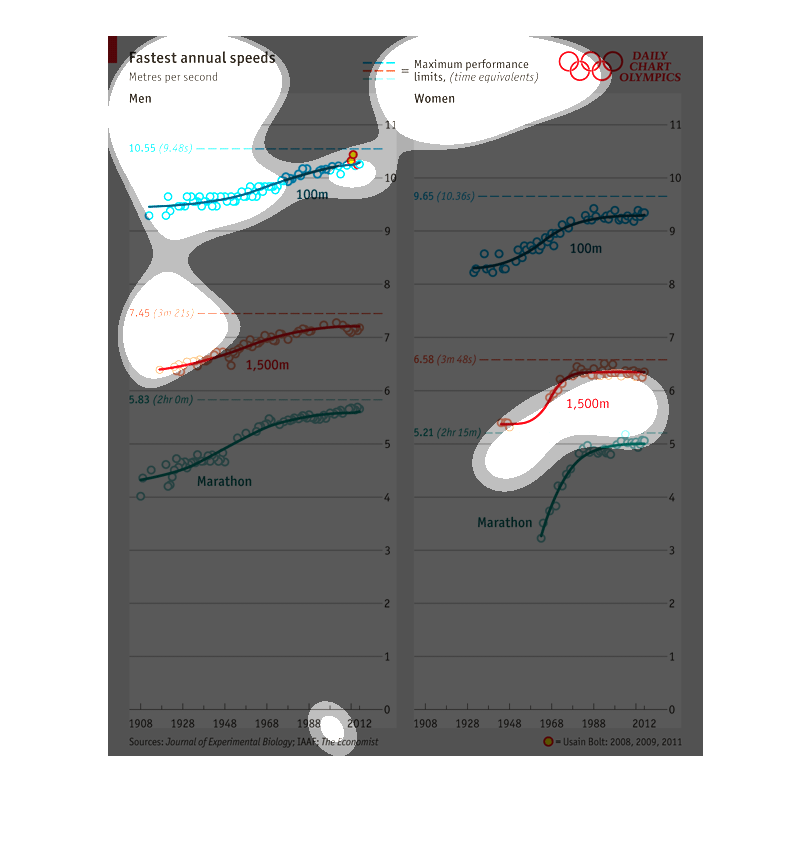
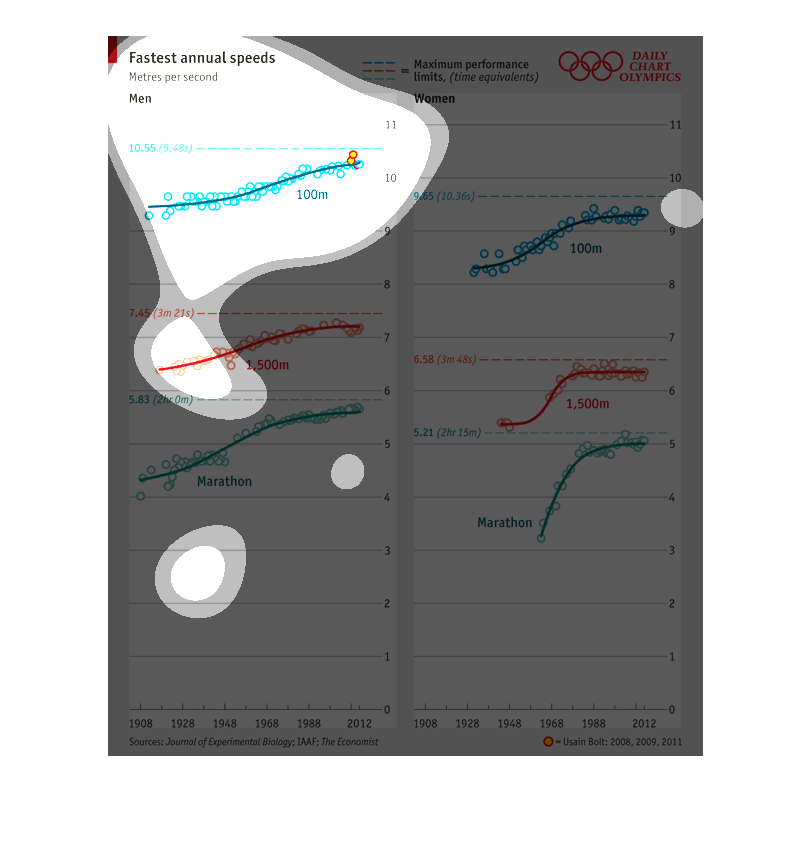
The title of this graph is, 'Fastest annual speed, Metres per second'.  The graphs and images
here are referring to woman's times for Olympic running events.
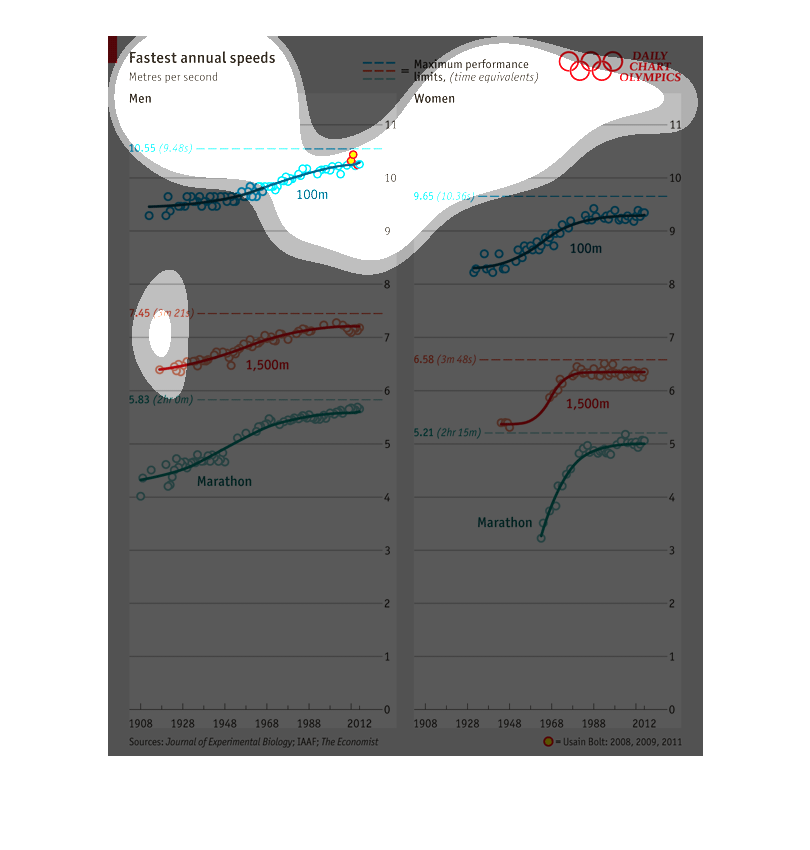
This image shows the fastest annual speeds at metrics per second at the Olympics between men
and women based on the distance they ran. Men seemed to have ran faster than woman on average.
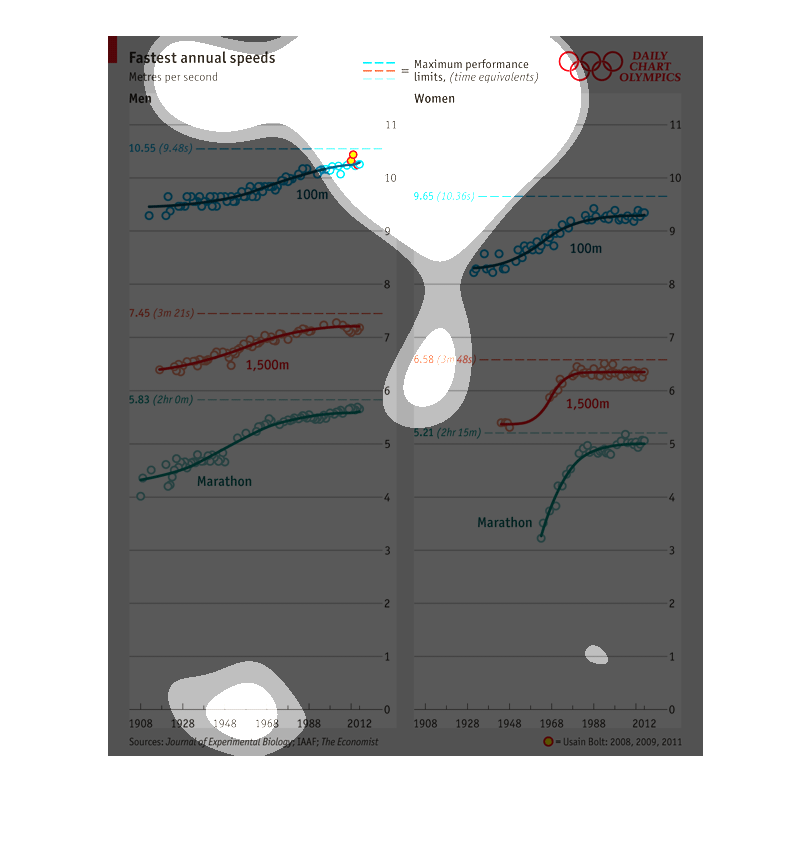
This chart shows the average speed of runners in Olympic events from1908 through 2012.  Men
and Women are given separate areas of the chart.  Various ditances of running events are shown.
 As expected all show a significant increase over time in the speed of the althletes.
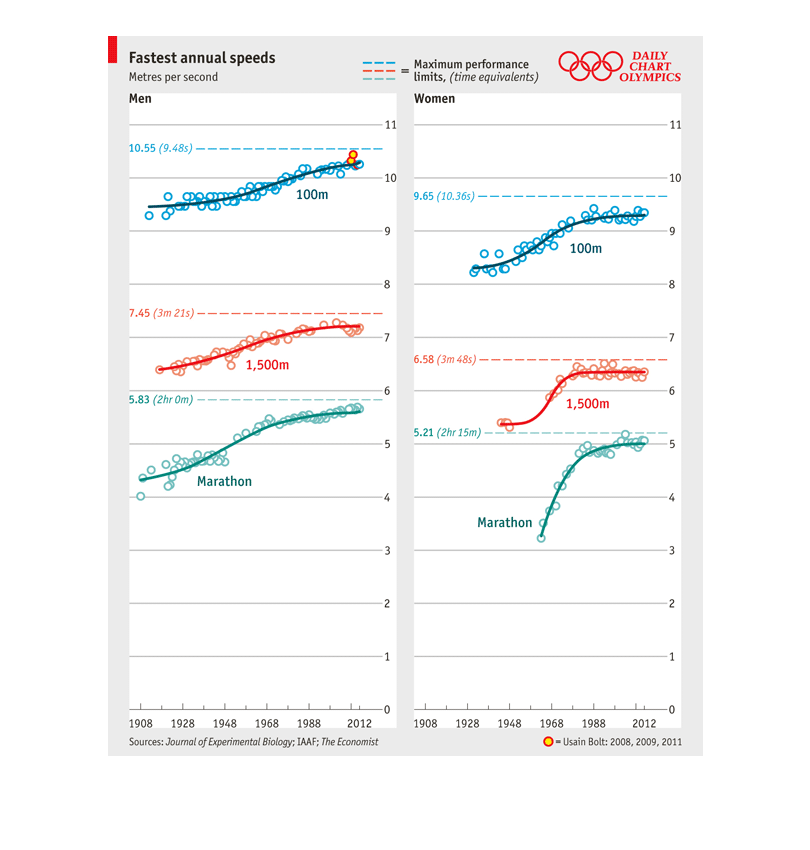
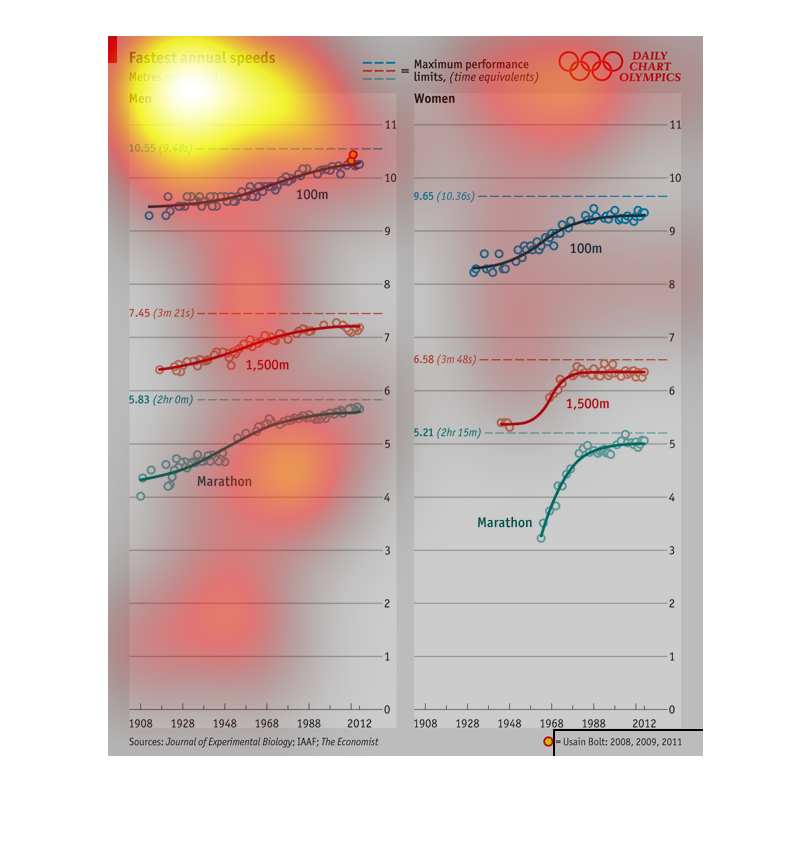
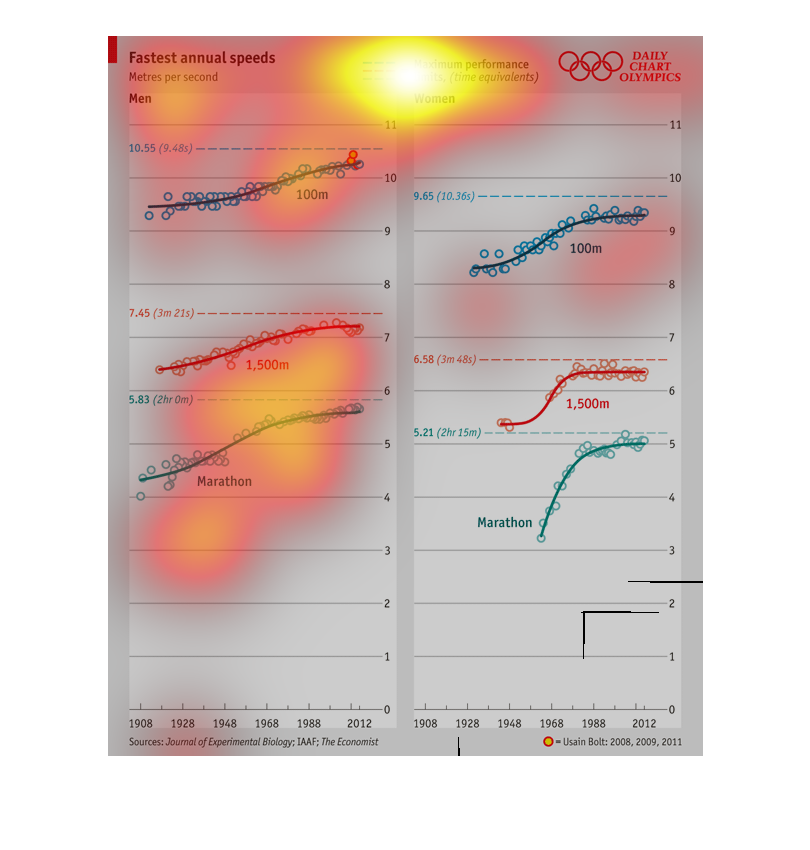
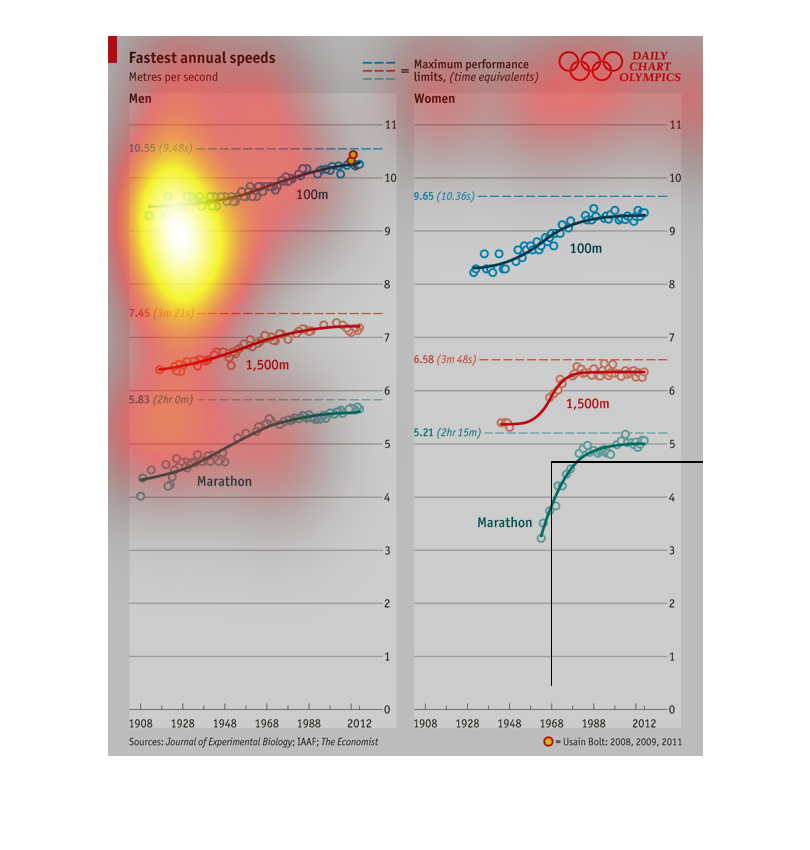
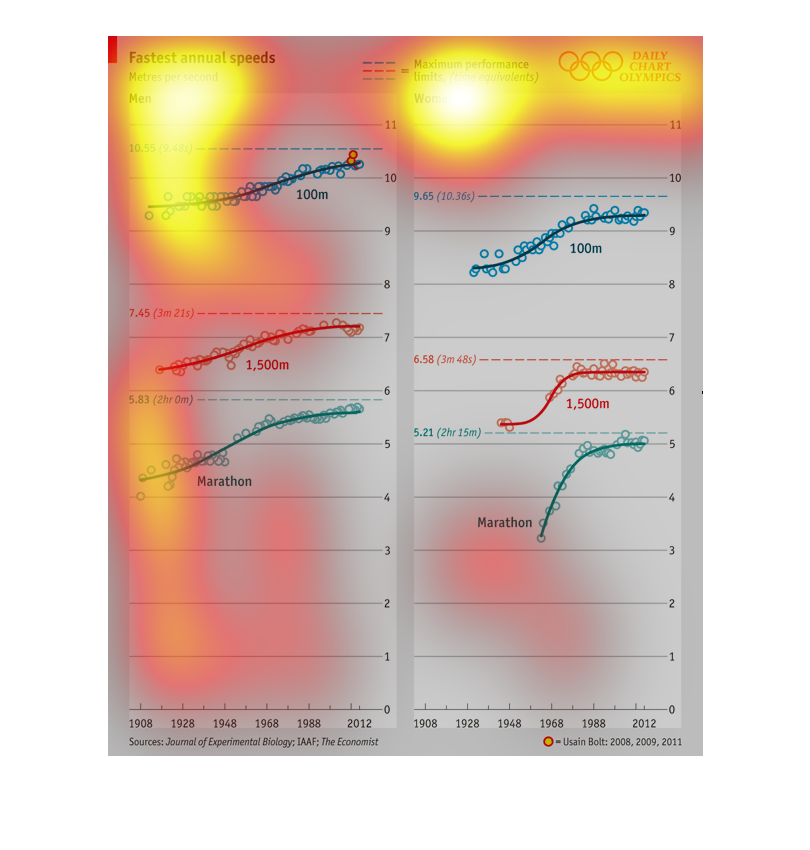
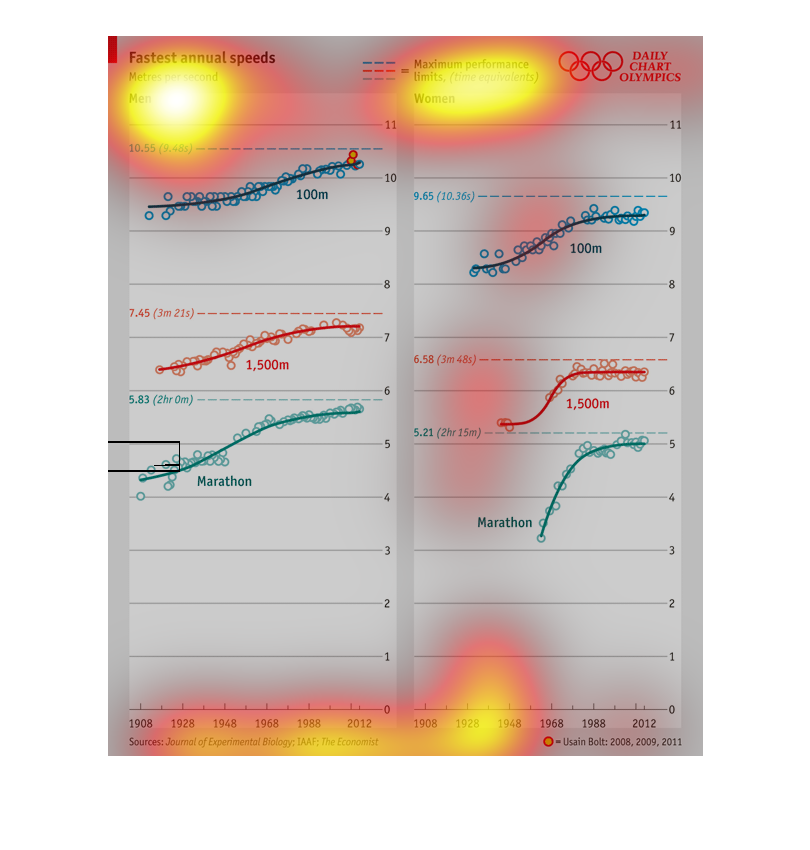
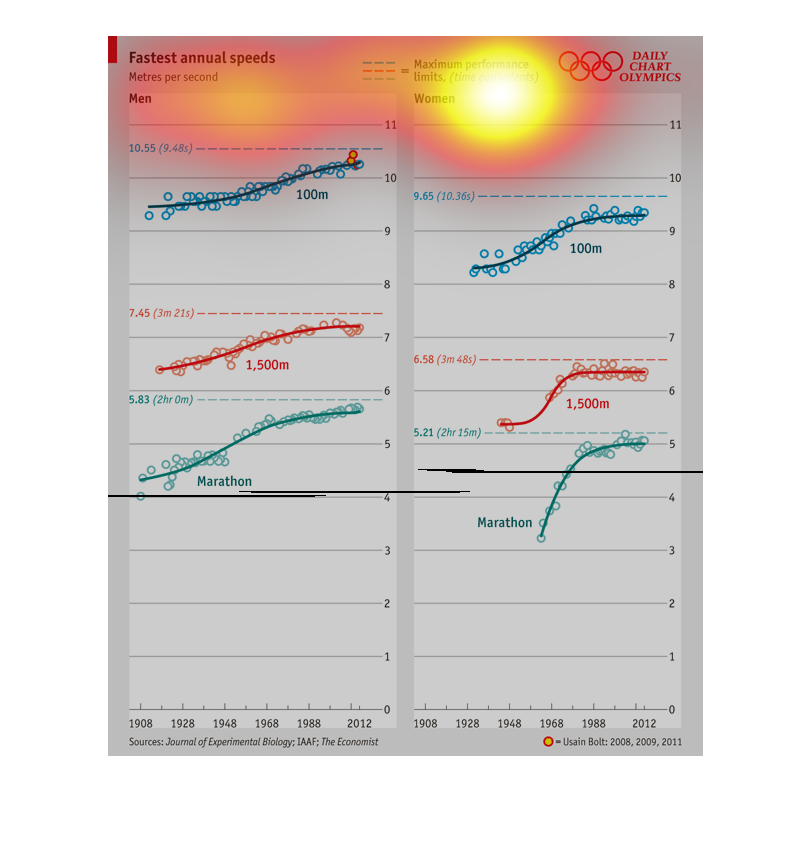
An Olympic chart infographic of Fastest Annual Speeds for various track and field distances
and the marathon from the year 1908 to 2012. Showing general increase
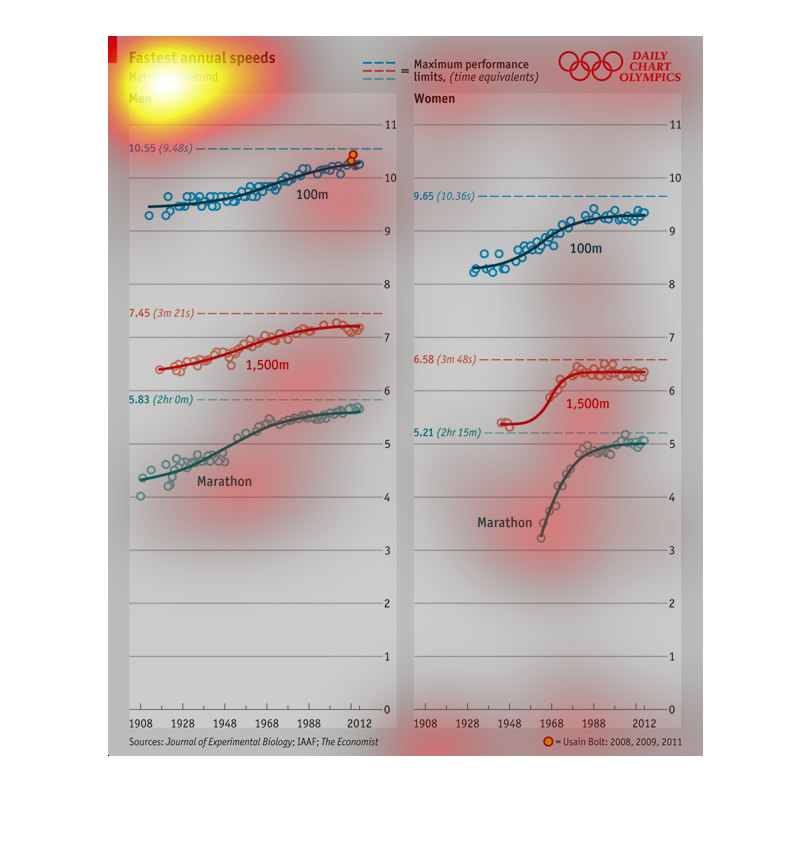
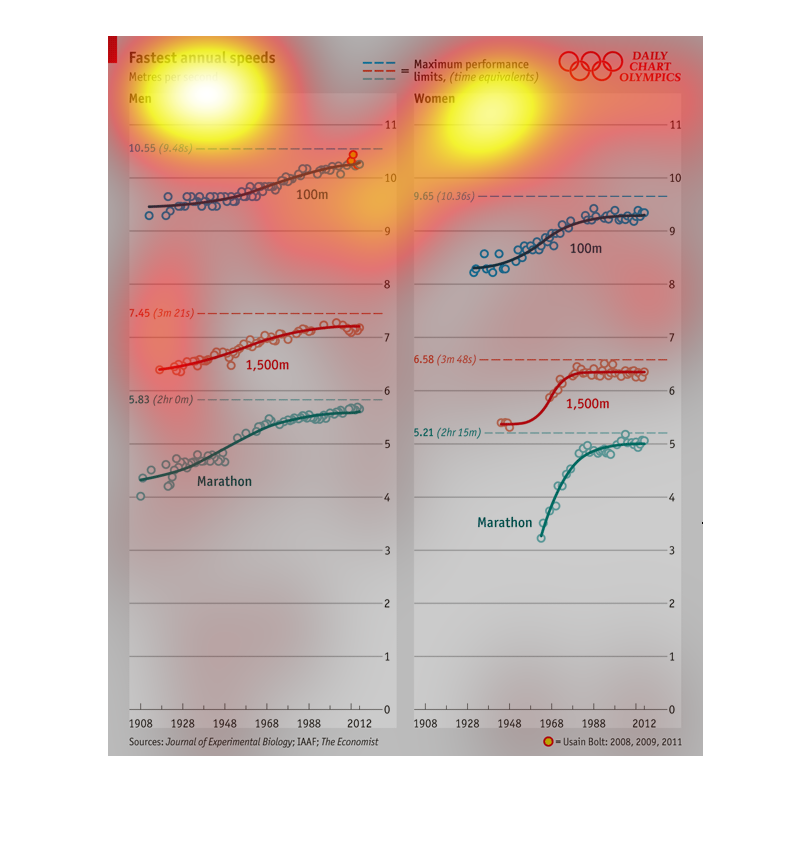
This shows the fastest maximum speeds for both men and women in the Olympics.  It shows from
1908-2012.  People have gotten faster during that time period.
This image shows a chart of the maximum performance of Olympic runners. The chart uses a line
based system and is very detailed. The colors are red and blue.
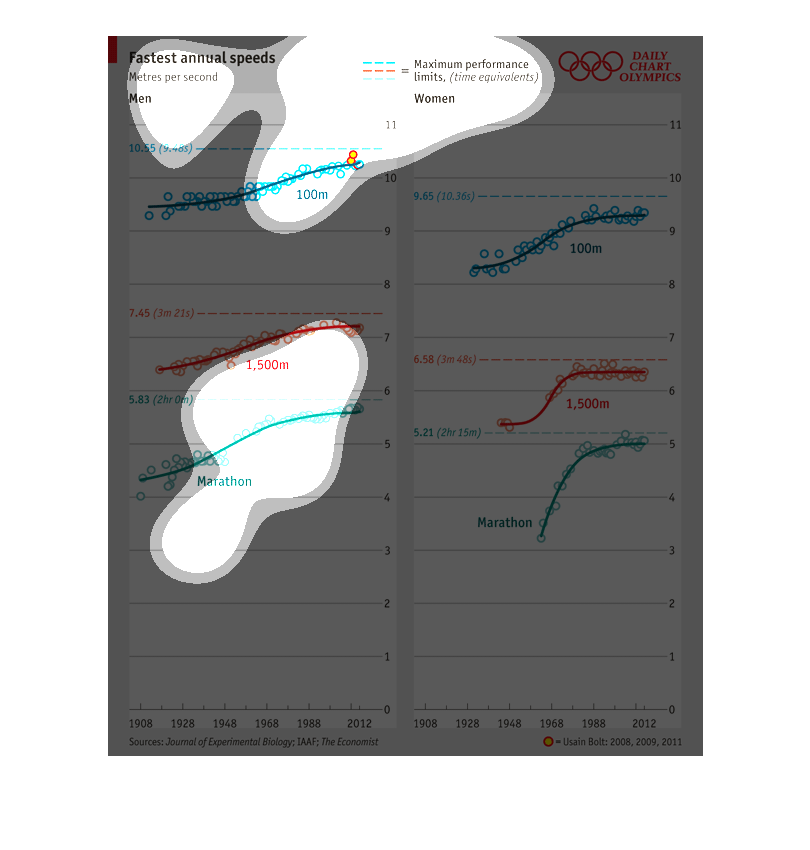
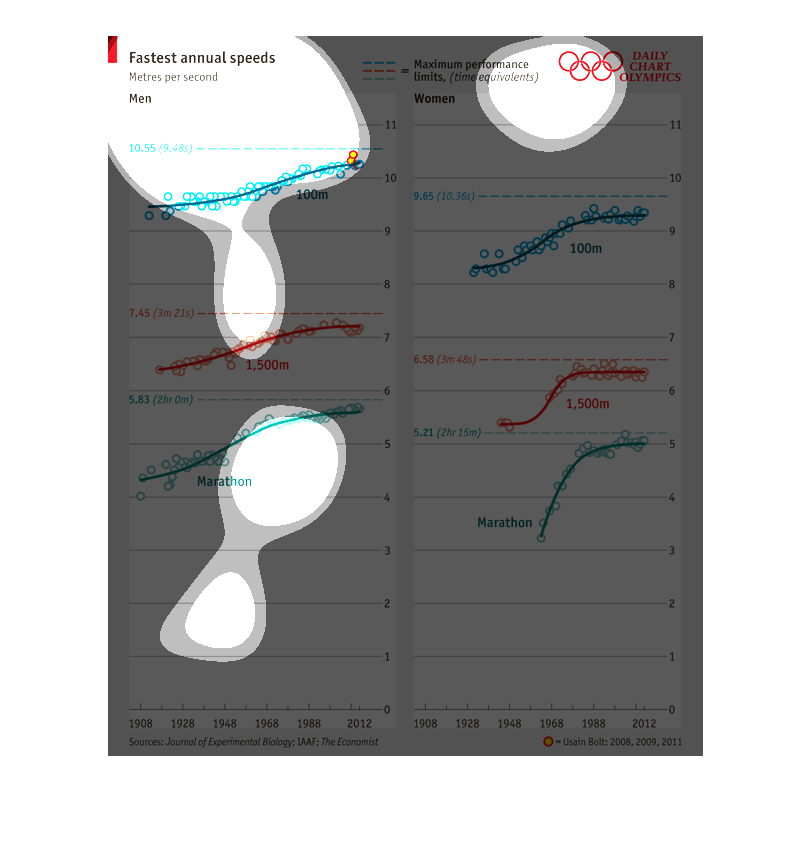
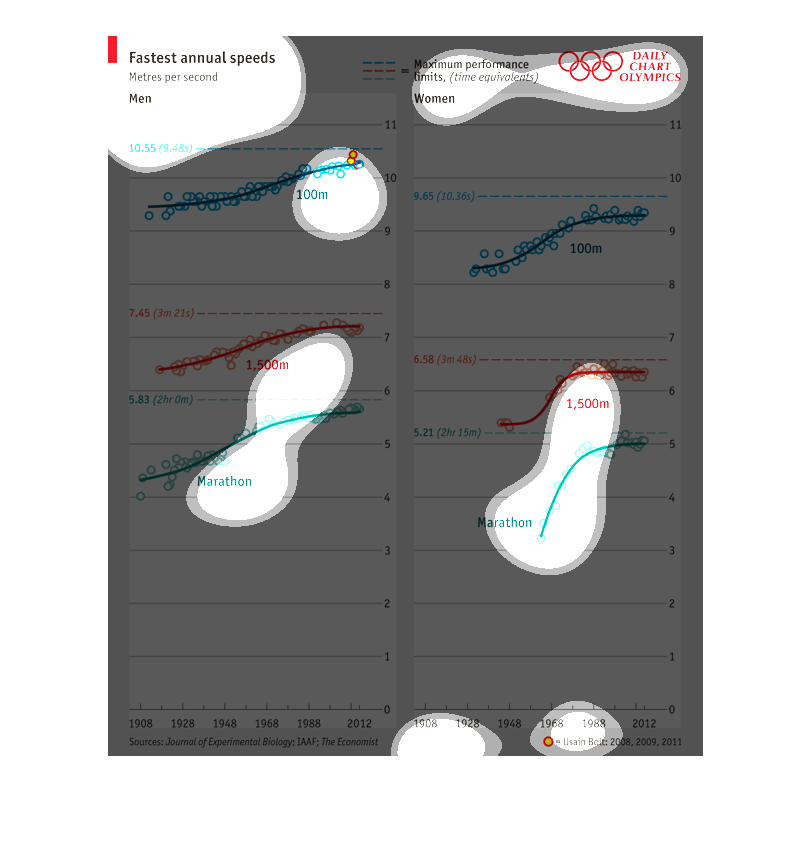
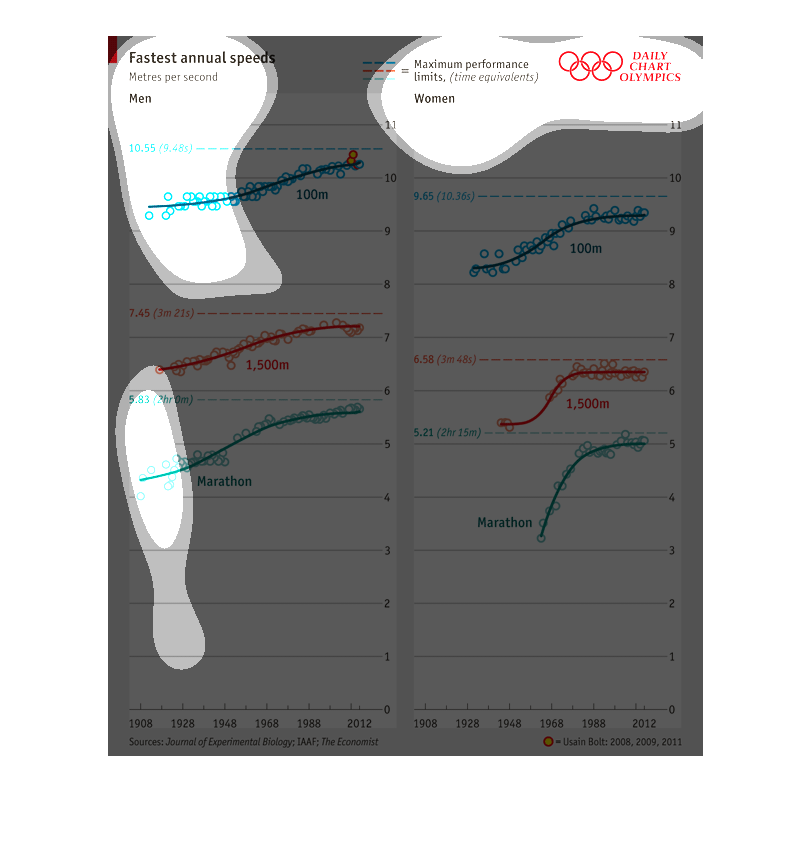
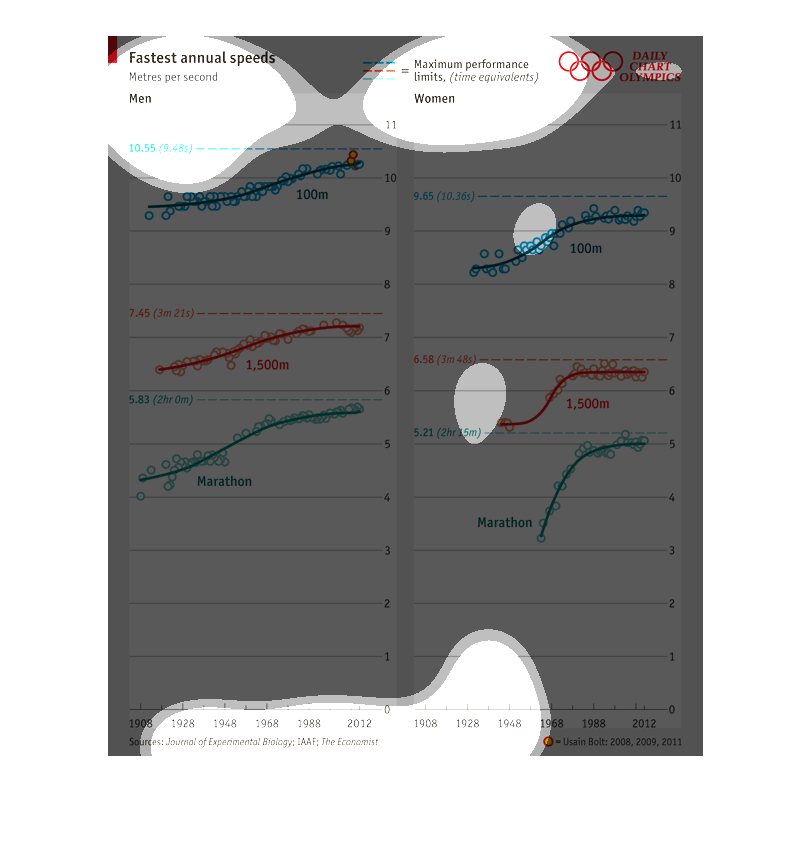
This chart shows the Fastest annual speeds. It is rated in Metres per second. On the left
is Men, and the right is Women. This chart was very interesting to me.
This graph shows fastest annual speeds for women and men in the Olympics.  It has speeds and
the dates they were achieved as well as what races were run to achieve them.
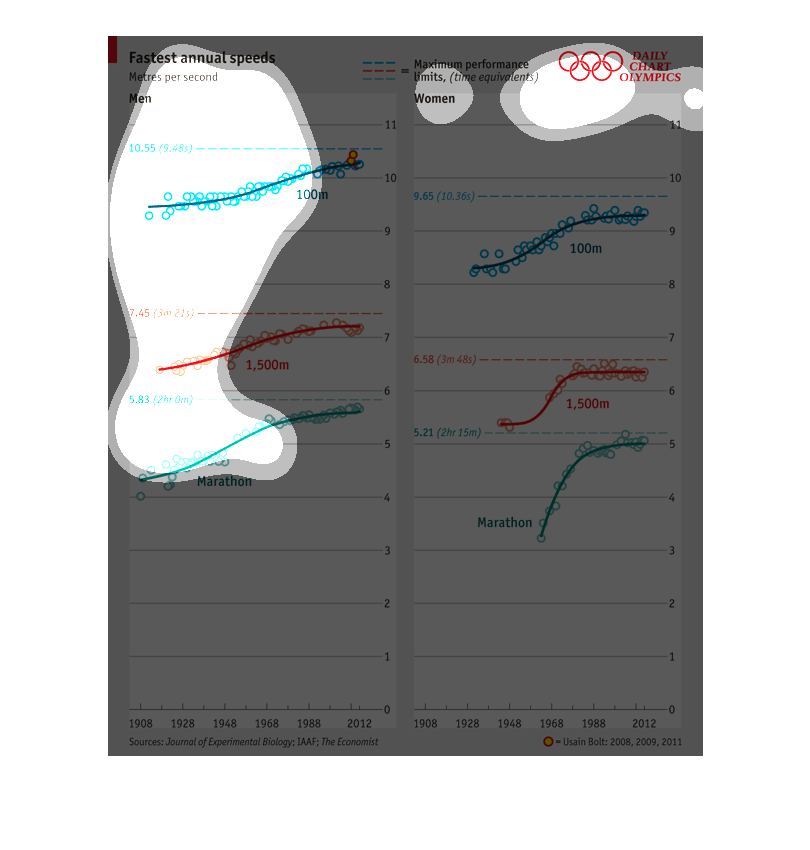
This is a series of charts depicting the fastest annual speeds in meters per second between
men and women. All of the trend lines show a steady increase over time.
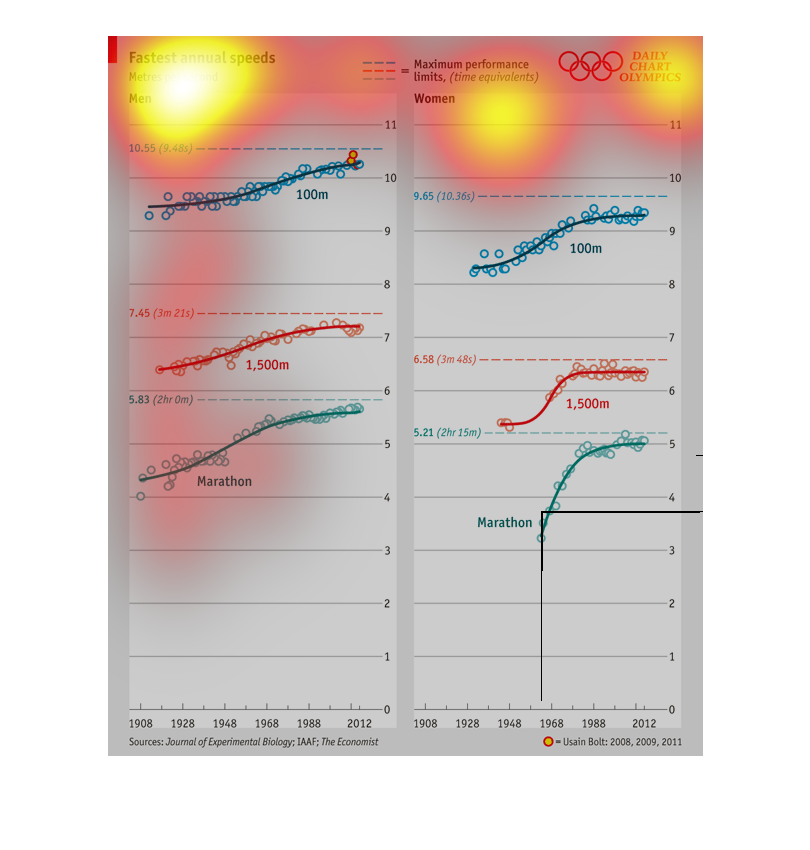
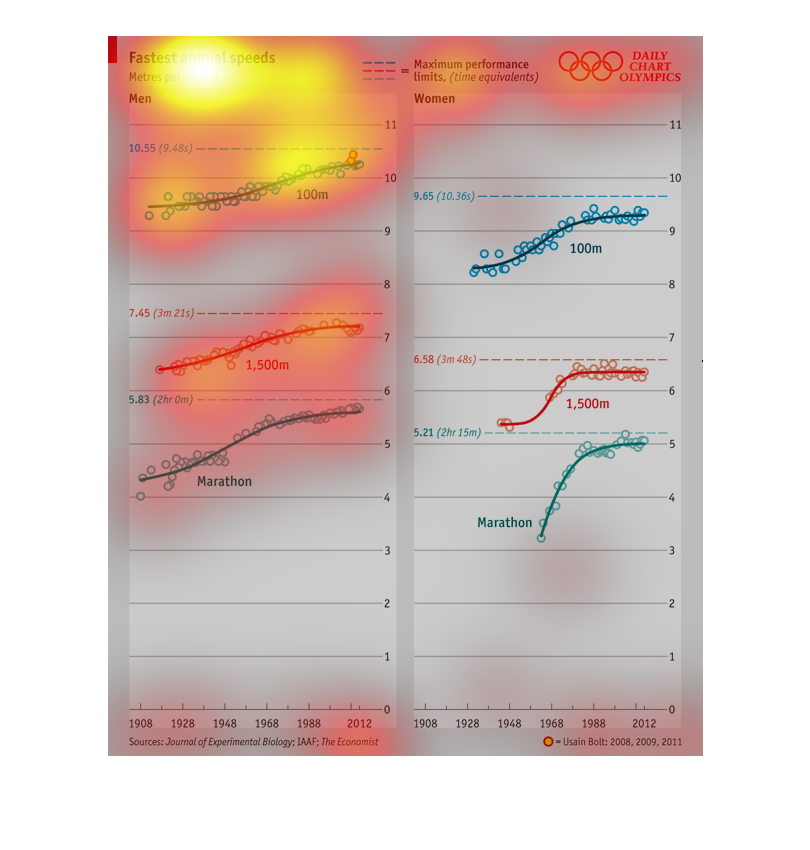
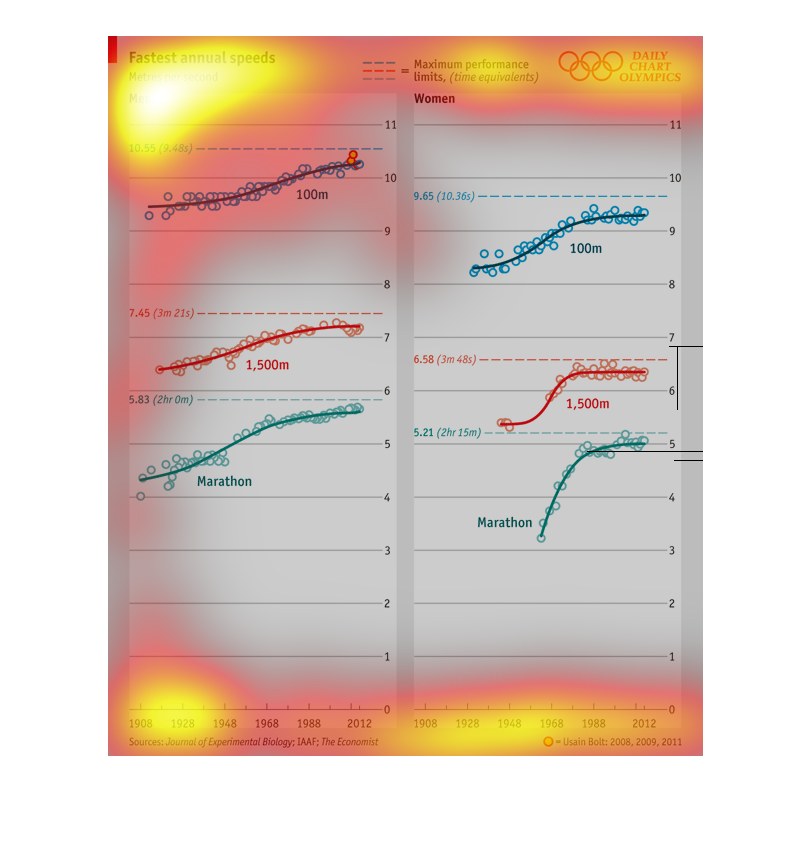
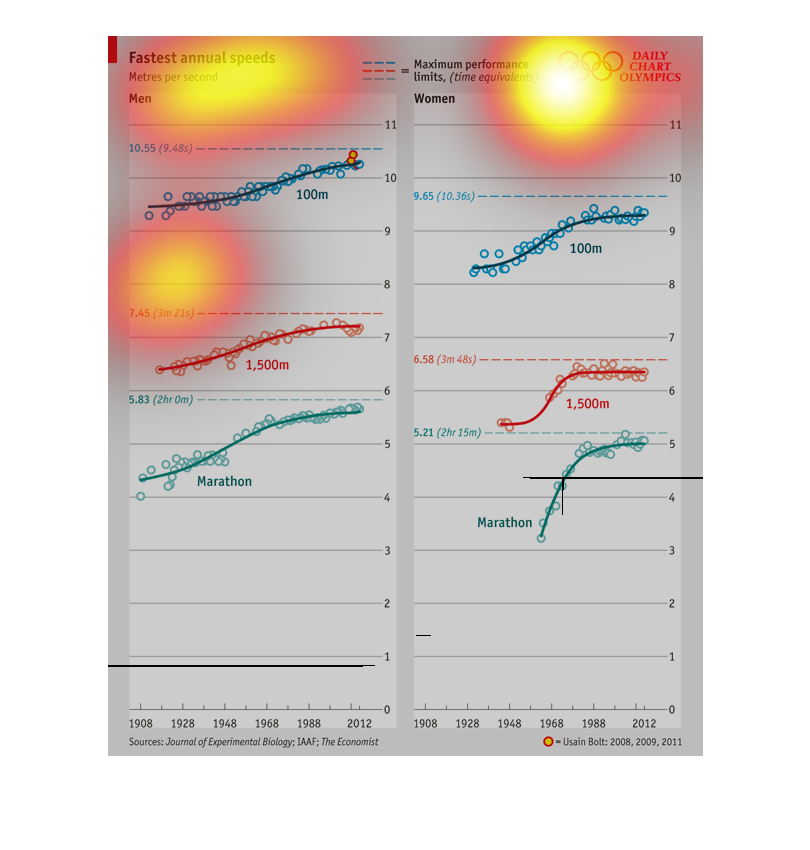
The chart shows fastest annual speeds in meters per second for the Olympics.  The left side
lists men's time sand the right side lists women's times.  It is divided into three events.
There are a series of graphs showing the fastest annual speeds, in metres per second, of both
men and women. In all the graphs, there is an upward trend indicating that men and women are
getting faster throughout the years.
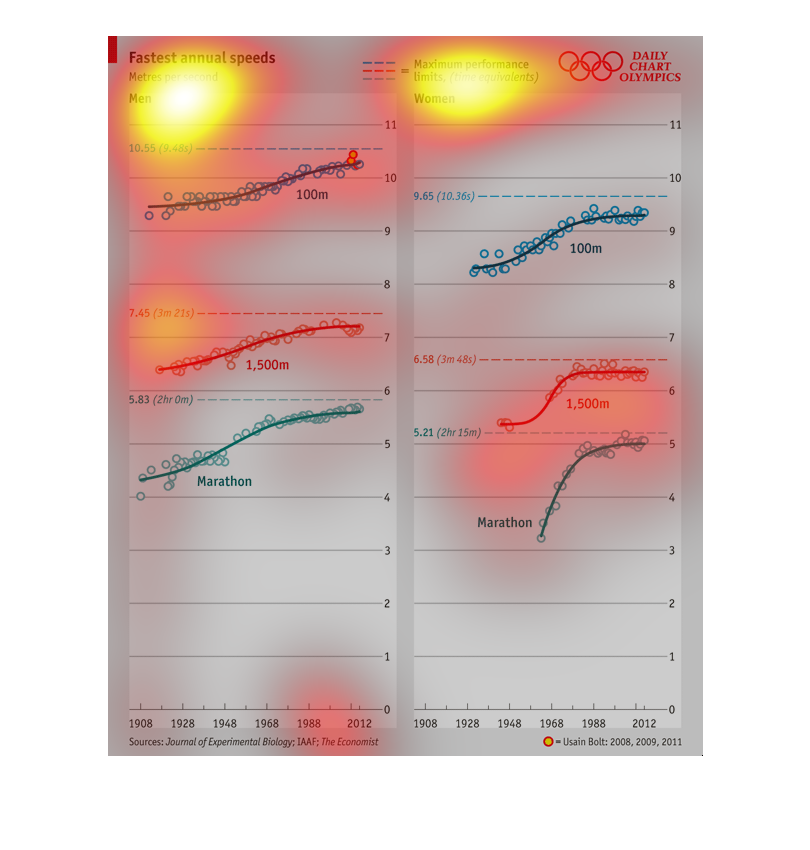
This chart shows the speeds for Olympics. This chart shows the speeds from 1908 to 2012. The
chart on the left is for men, and the one on the right is for women.
The following chart gives the fasted annual speed by both men and women. The data is broken
down by different types of races. Such as a one hundred meter sprint and a marathon.
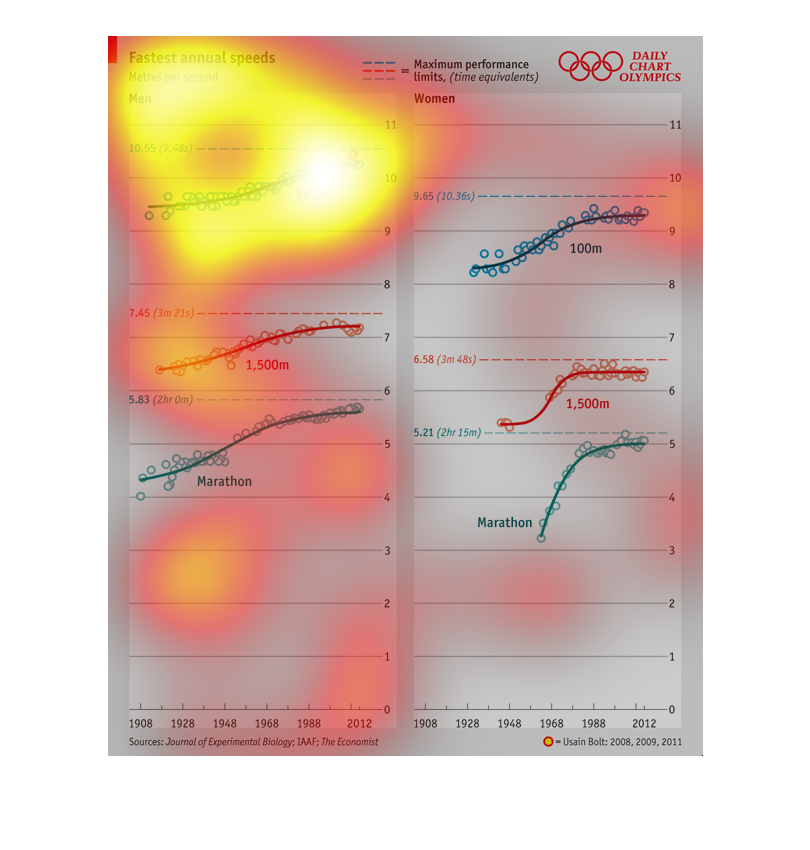
This chart describes the fastest annual speeds in meters per second. The chart is divided
between men and women and the maximum performance of each group.
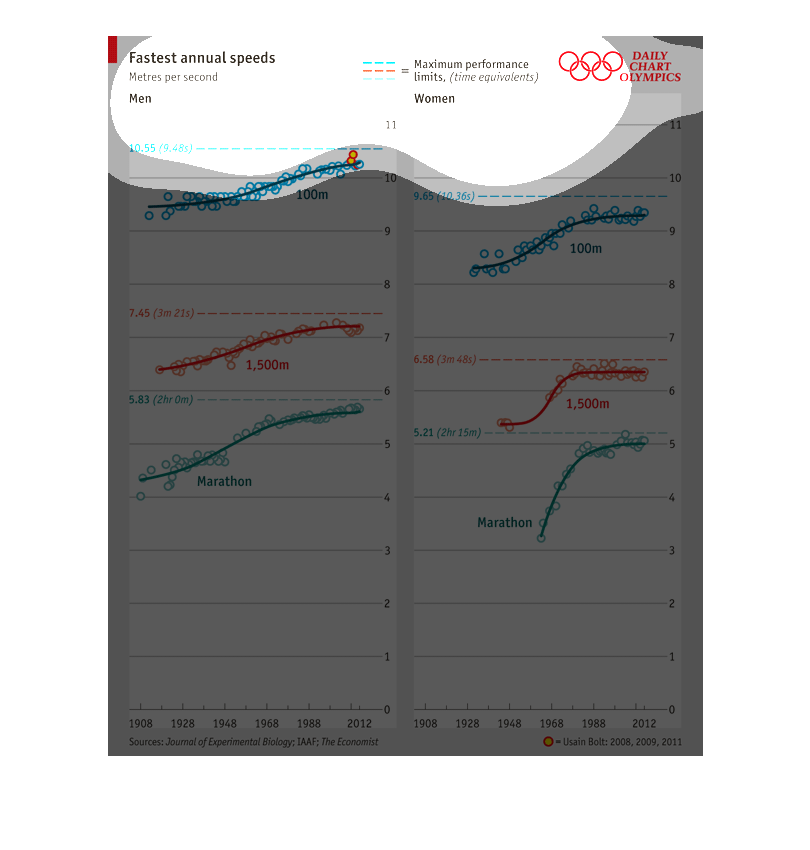
This graph shows "Fastest Annual Speeds. Meters per Second." In the graph there are blue,
orange and dark blue line indicating the speeds in meters. Women and marathons are included.