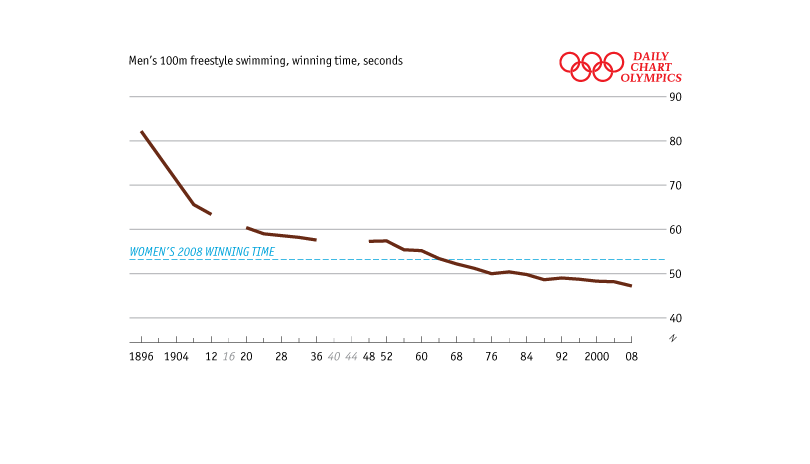
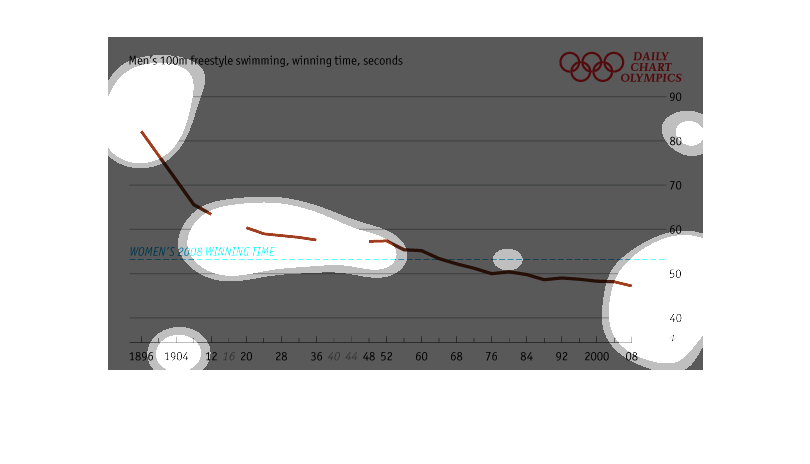
This chart shows the winning time in seconds for the men's 100 meter freestyle Olympic swimming.
The chart goes from 1896 to 2008 and shows in 1900 the time was around 83 seconds, and in
2008 it was  less than 50.
Daily Chart for the Olympics. This compares the womens racing time.  Also graphed is the Men's
100 meter freestyle.  You can compare the two over time.
Mens 100m freestyle swimming winning team graphs in seconds from 1986 to 2008. The winning
time has decreased by almost half in the last two decades according to this graph.
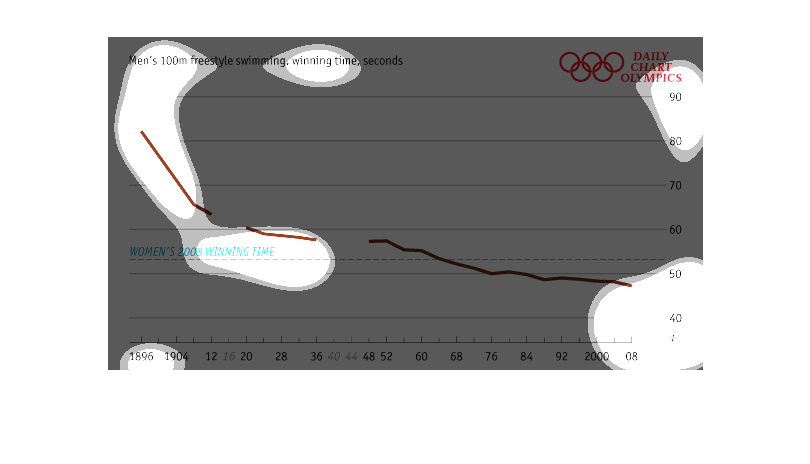
This is a chart of olympic mens 100m freestyle swimming winning times, dating all the way
back to 1896, and in seconds. A line showing the womens 2008 winning time lines about halfway
down the red line of times for comparison.
This chart shows the Men's 100 meter freestyle  swimming, winning time, seconds. It shows
the Women's 2008 winning times, This chart is very interesting.
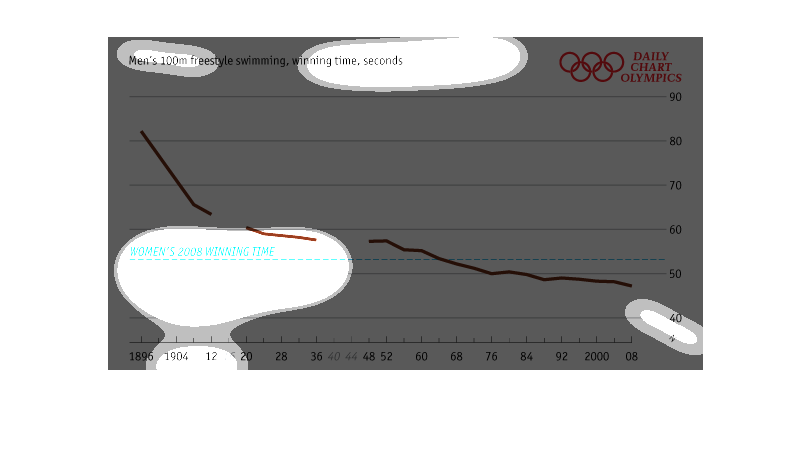
This is a graph of the best men's 100 meter freestyle swim times from the olympics beginning
in 1896, and ending in 2008.  The graph also shows the women's 2008 best time, and you can
easily see that the men's times have still been faster since roughly 1967.
This graph describes the Olympics men and women 100 meters freestyle swimming event. It includes
the winning times in seconds. It appears to compare the women's winning times to the men's
winning times
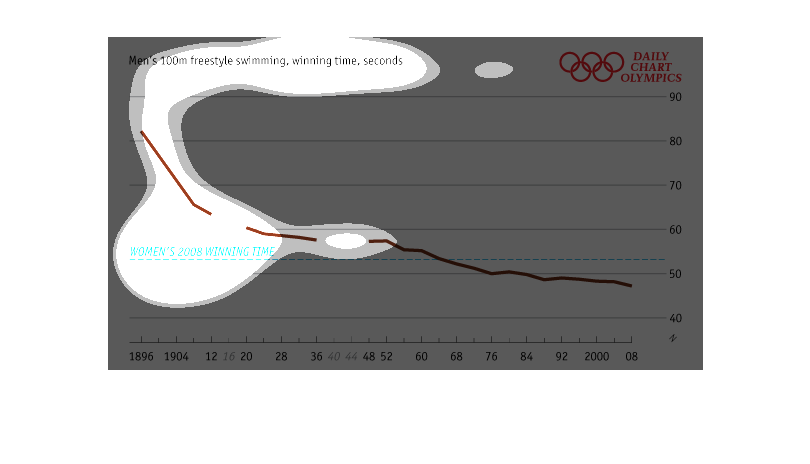
This graph shows men's 100 m freestyle swimming and winning in seconds at Olympics since 1986.
This Graph compares men's winning time since 1986 with women's winning time in 2008. Before
1960, men winning time was more compared to women's winning time in 2008, however, the men's
winning time gradually decreased compared to women's 2008 time since 1960.
The chart shows the how the winning times of the Men's 100 Meter Freestyle in the Olympic
Games has decreased from over 80 seconds in 1896 to under 50 seconds in 2008. The Women's
2008 winning times was also displayed as a reference point (just over 50 seconds)
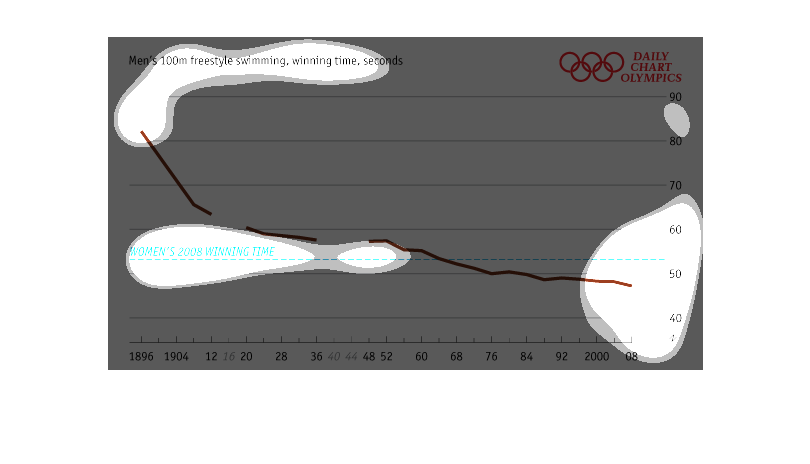
This is a graph that shows the winning time taken by various competing swimmers in the men's
100 meters freestyle swimming completion. This is for the Olympic games.
This chart describes the men's 100m freestyle in swimming. Specifically the winning time in
seconds. The chart covers the years 1896 through the year 2008.
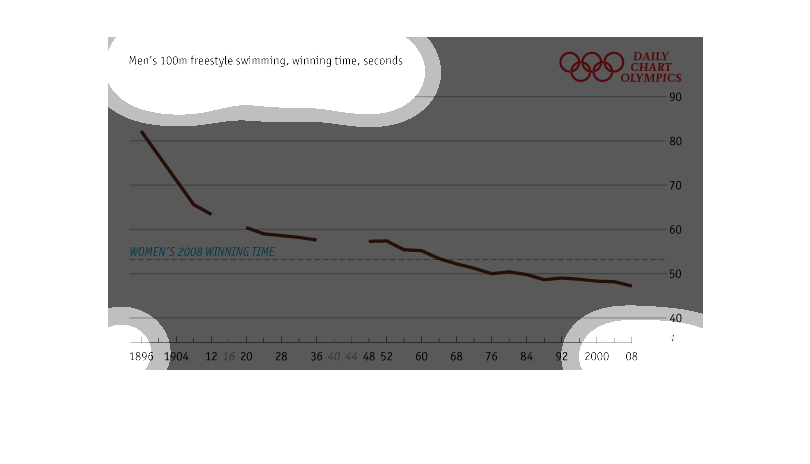
This chart depicts the winning time in the Men's Olympics 100 meter freestyle swimming event
as a function of time.  The women's 2008 winning time is shown as well for comparison.
The graph points out how women a lagging way behind men in swimming lapses. Is it because
of natural strength on the men's part or could it be because of performance enhancing drugs?
The graph is not quite clear on that.