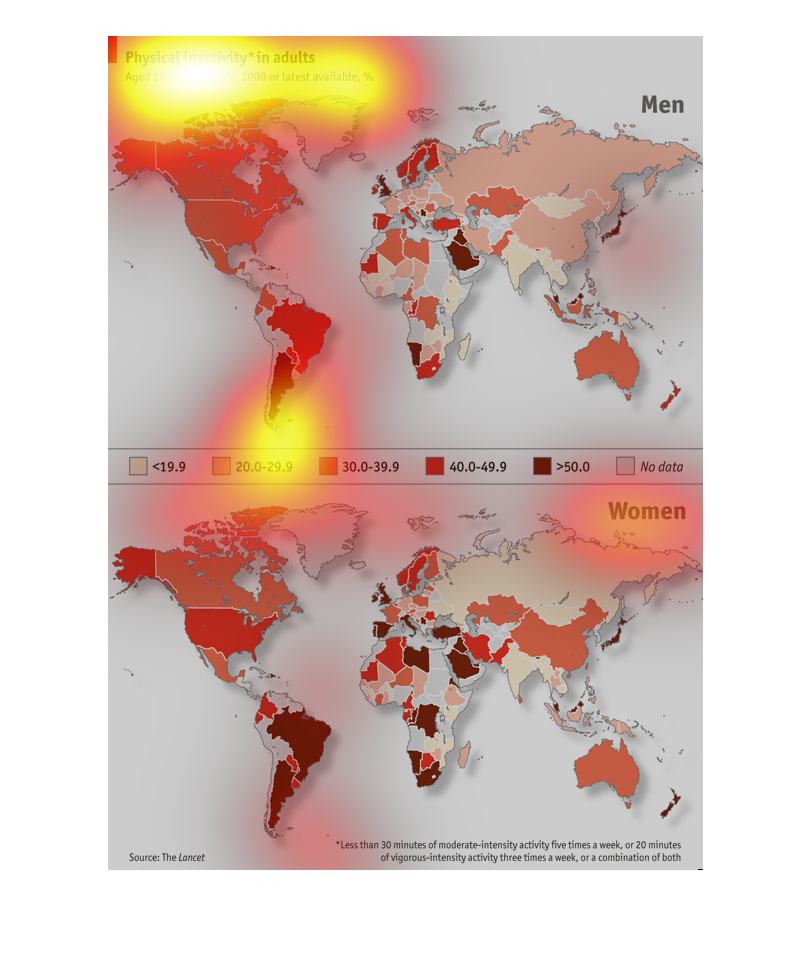
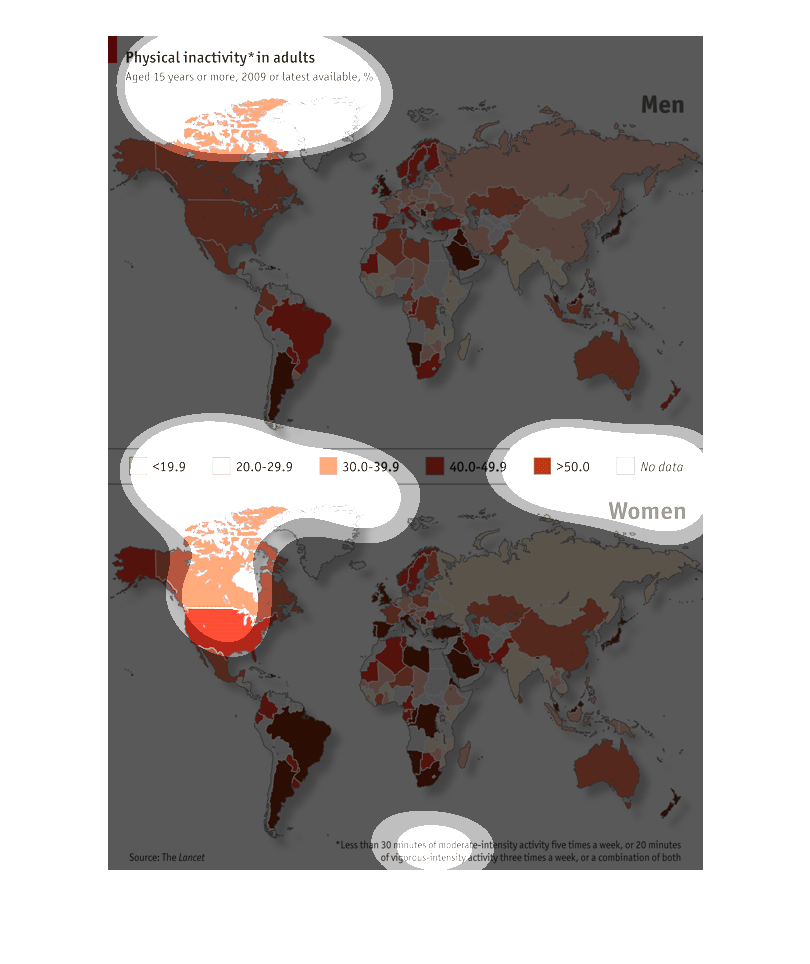
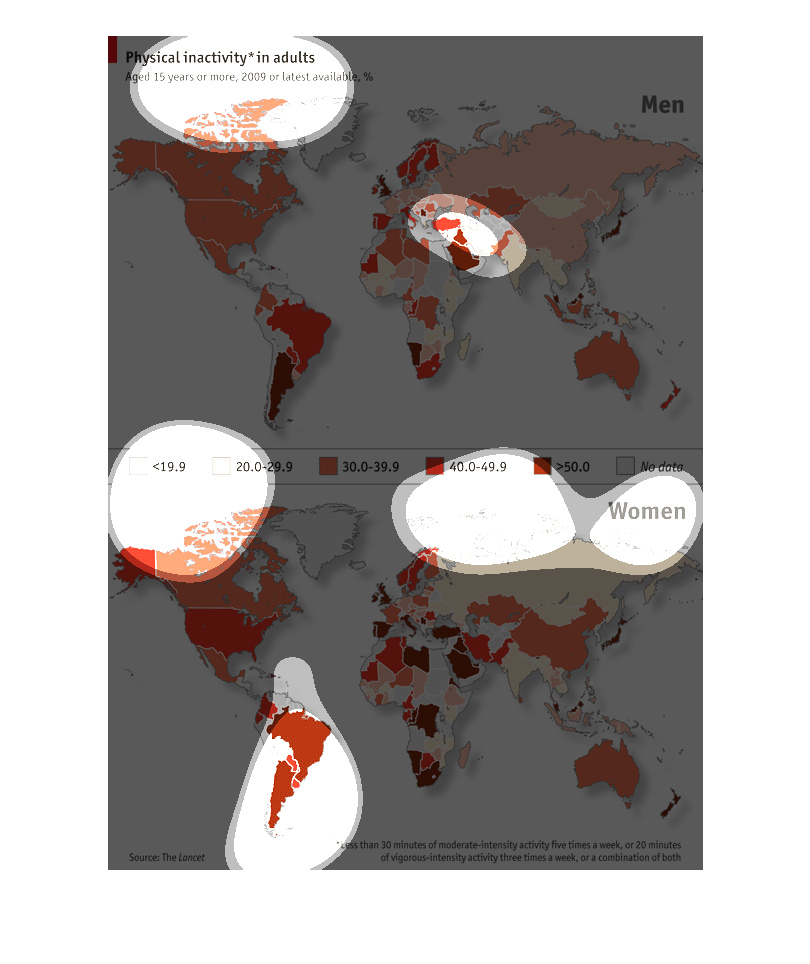
This image shows the concentration of physically inactive adults in different countries. The
color coding represents the percentage of people 15 and older that are inactive in several
different countries.
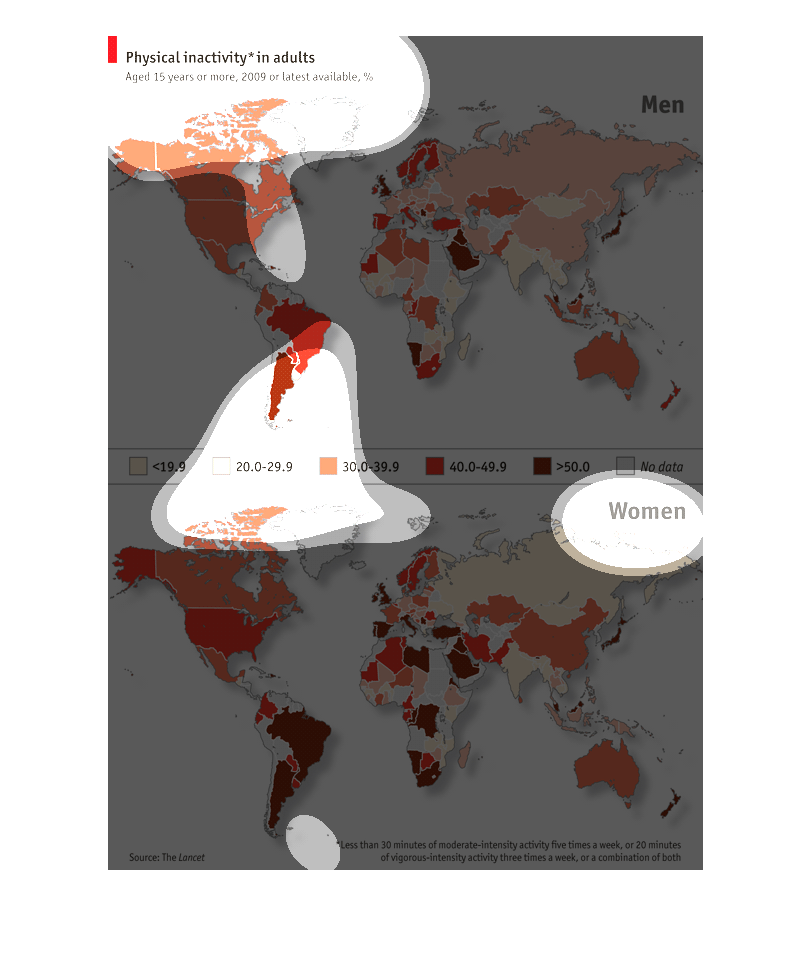
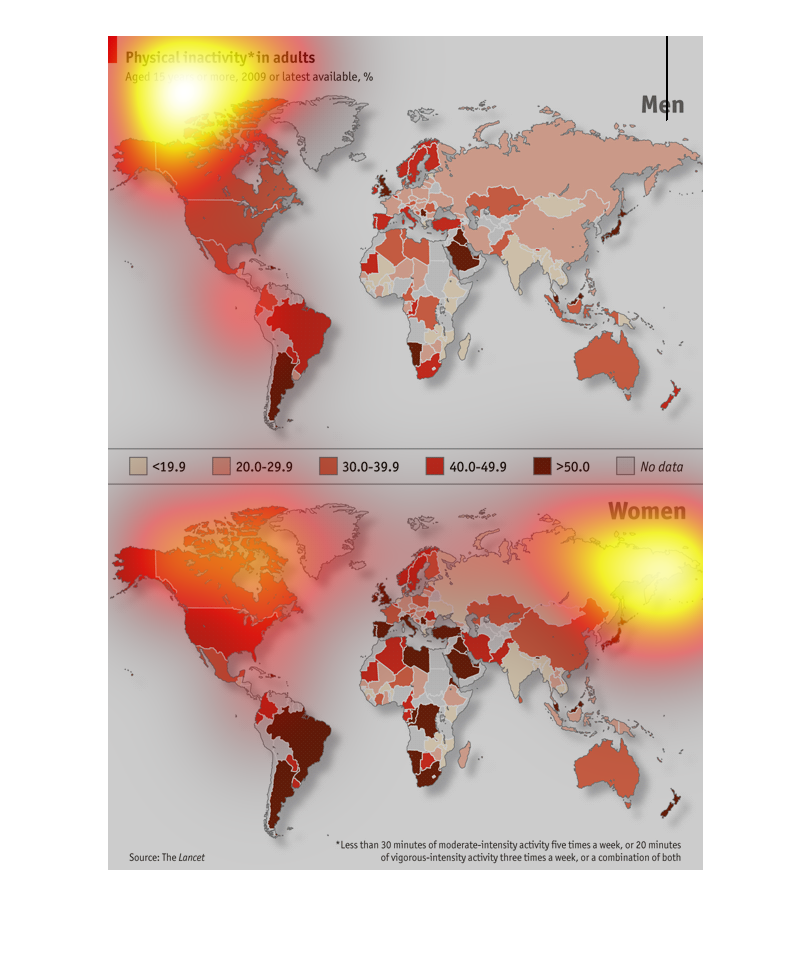
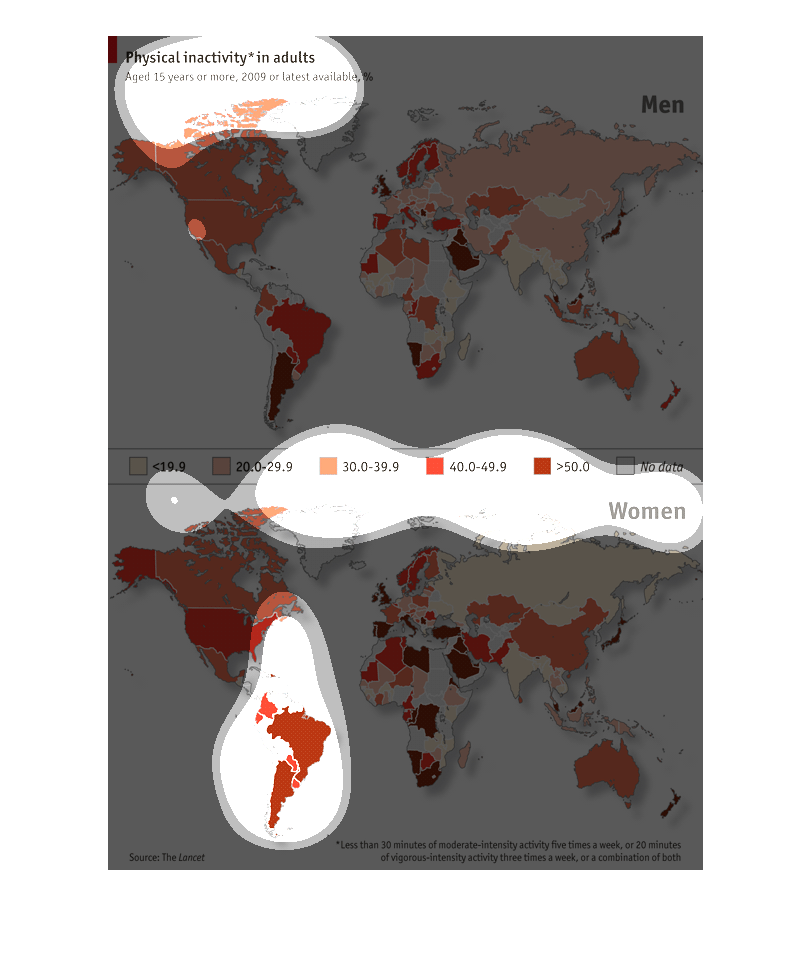
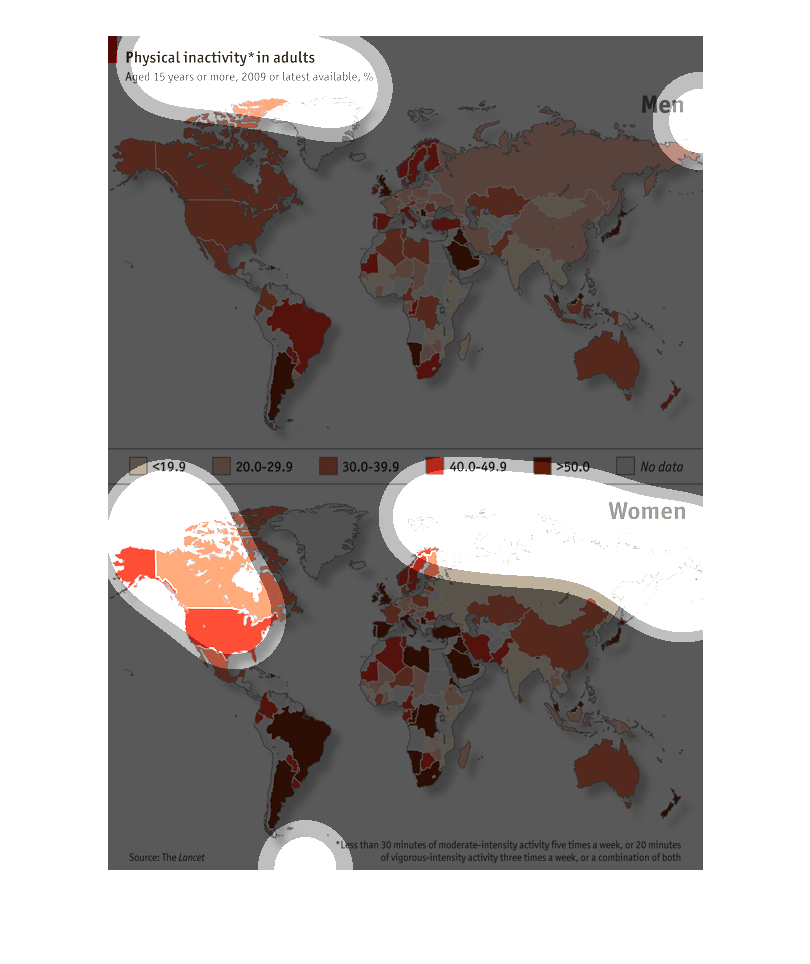
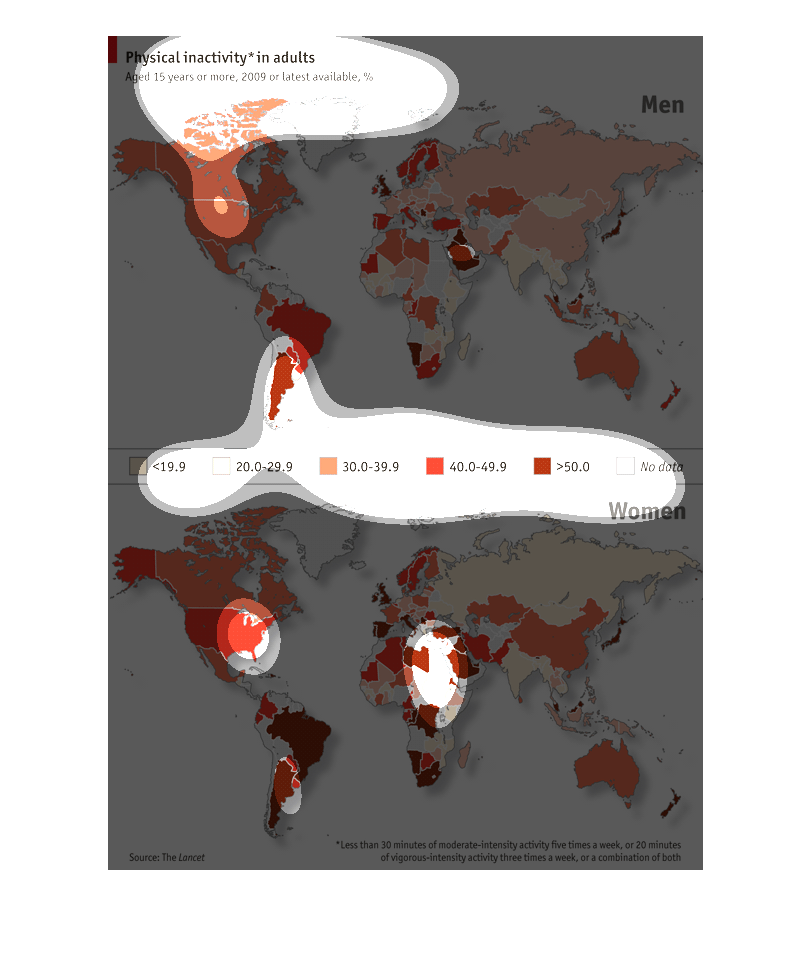
This chart shows Physical Inactivity in adults aged 15 years or older from 2009 until recently.
 The two charts show the quantity of inactive men versus inactive women in various locations
all over the world.  According to the chart, it appears that women are less active than men,
and there are more countries with less active women than men.  It may be due to part of the
culture or society in those areas, with men often being expected to be the "bread winners"
and doing more physical, back breaking work as they tend to be more muscular and stronger
than women.
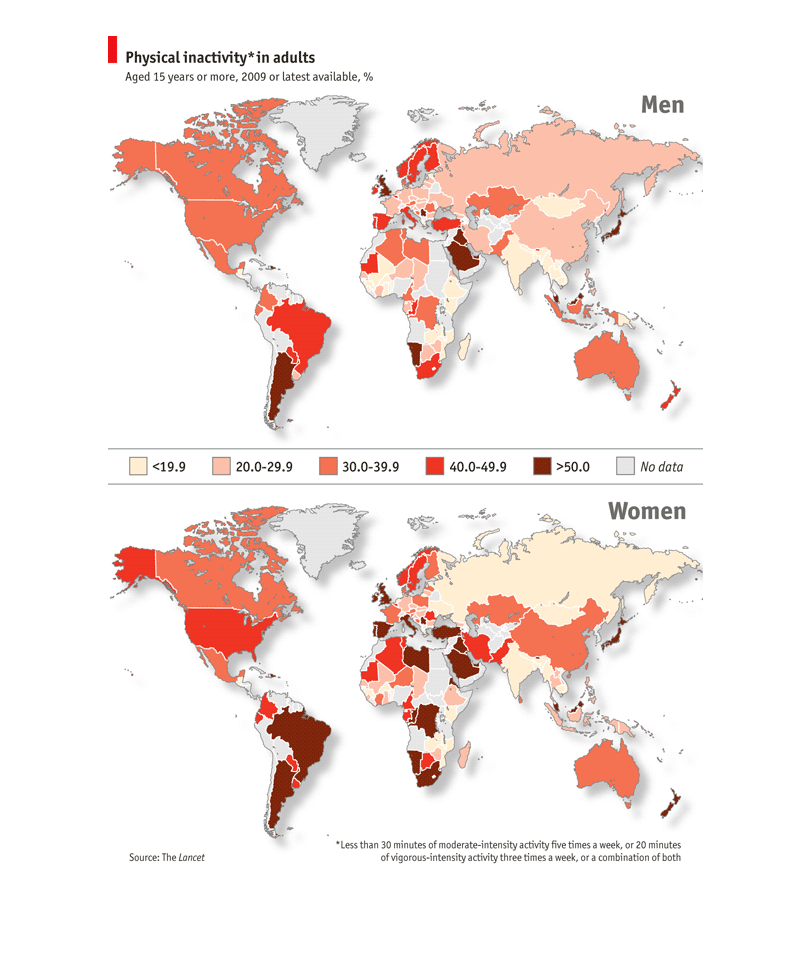
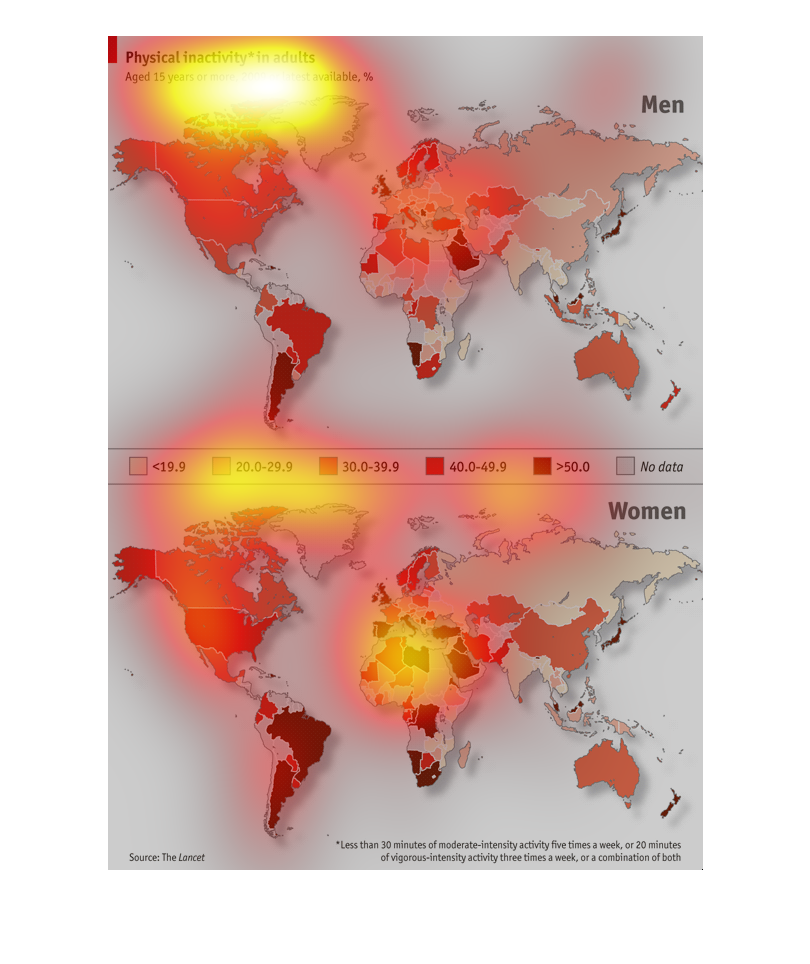
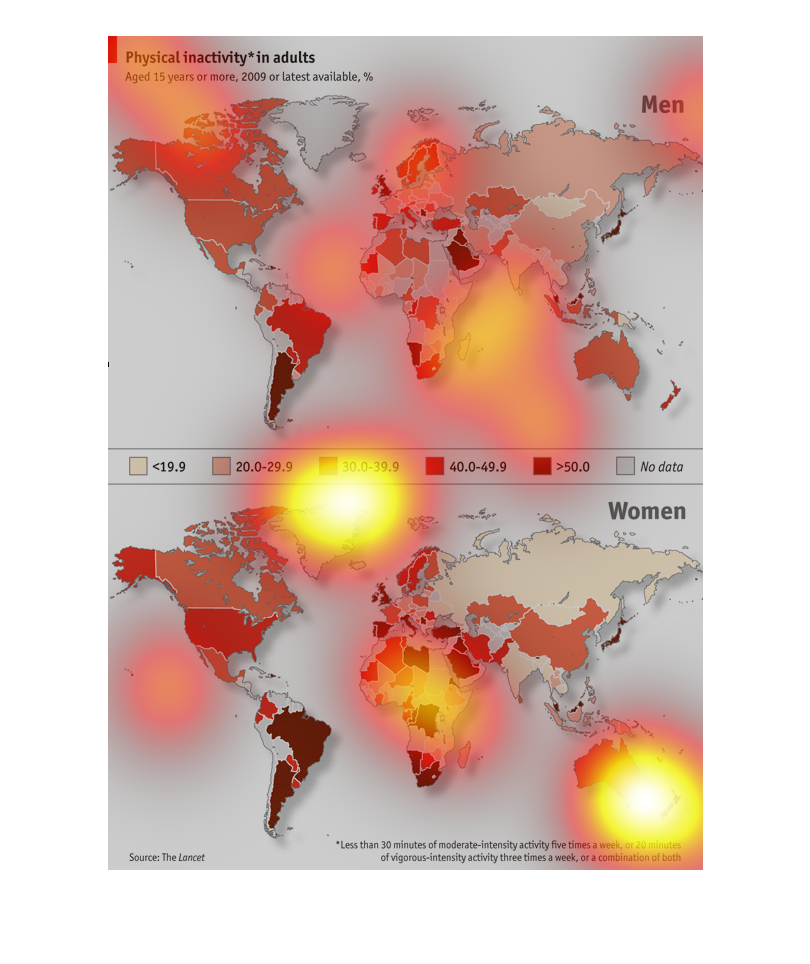
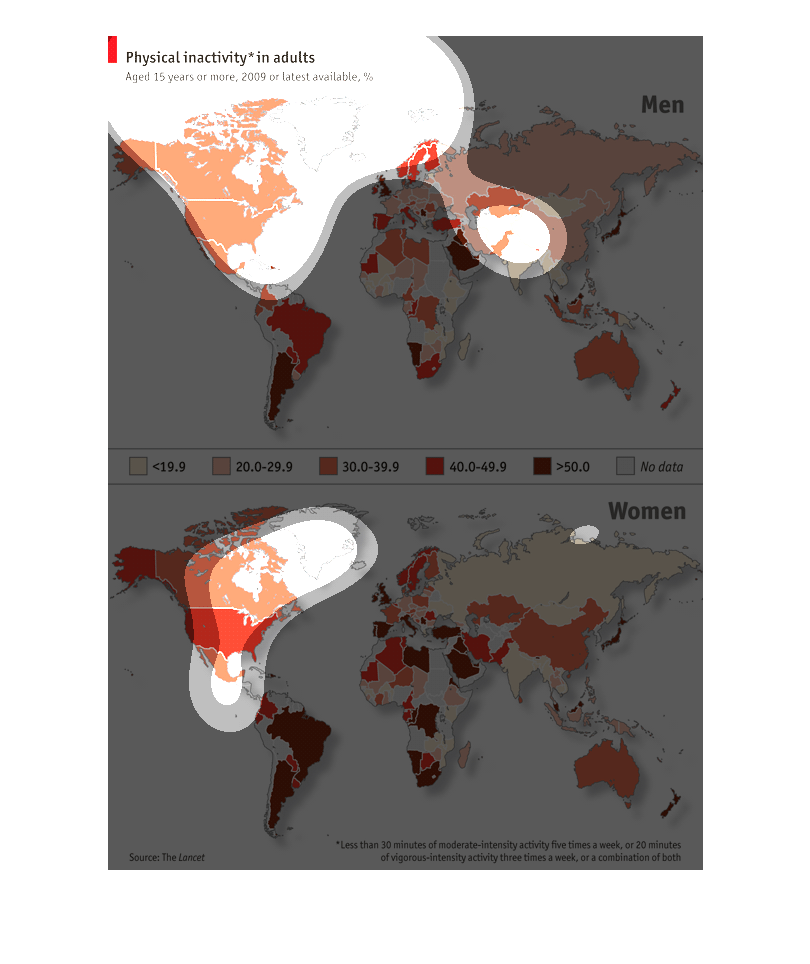
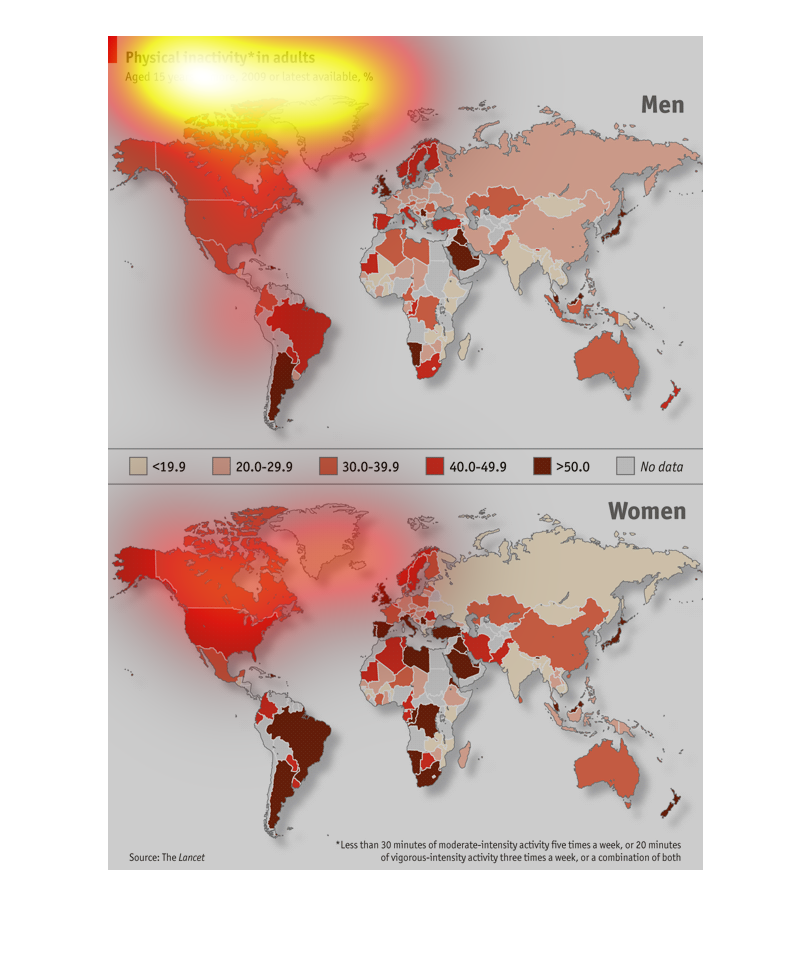
THIS MAP SHOWS THE AMOUNT OF PHYSICAL ACTIVITY FOR MEN AT TOP AND WOMEN AT BOTTOM BASED ON
AMOUNT EXERCISING LESS THAN 30 MINUTES PER DAY. DARKER RED IS MORE INACTIVITY.
This graph shows increased inactivity separately between men and women ages fifteen or older
in 2009. Most inactivity shows with age ranges of 30-39 in North America and 20-29 in Asia
for Men. Women however are more scattered in their age groups. Although there are many areas
lacking data.
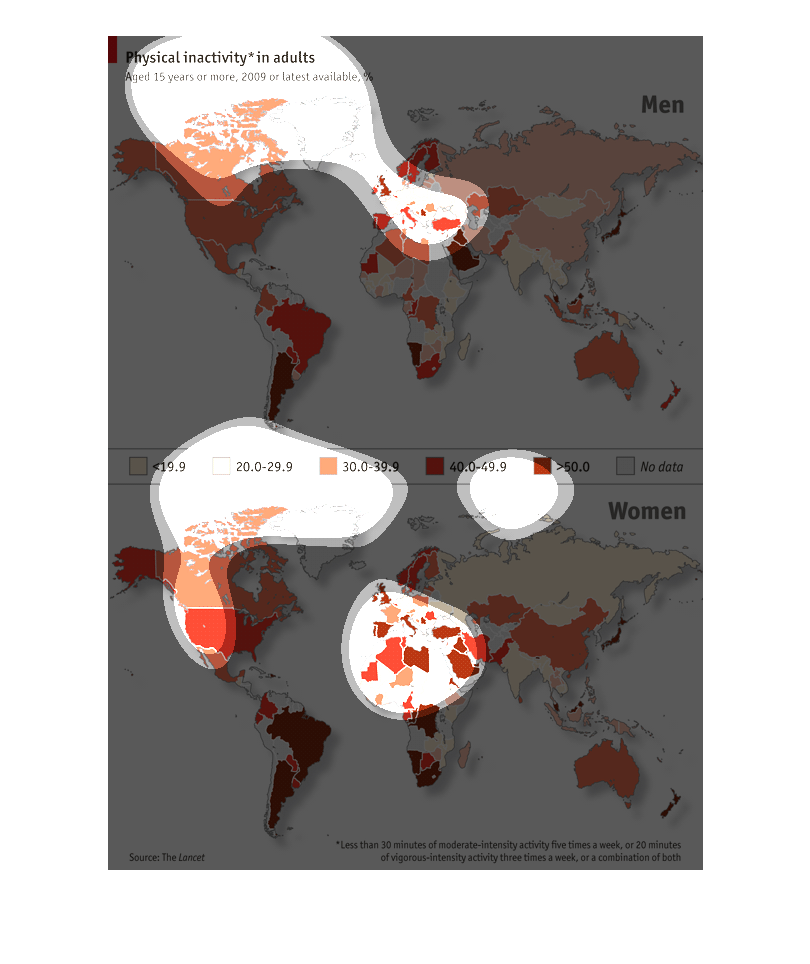
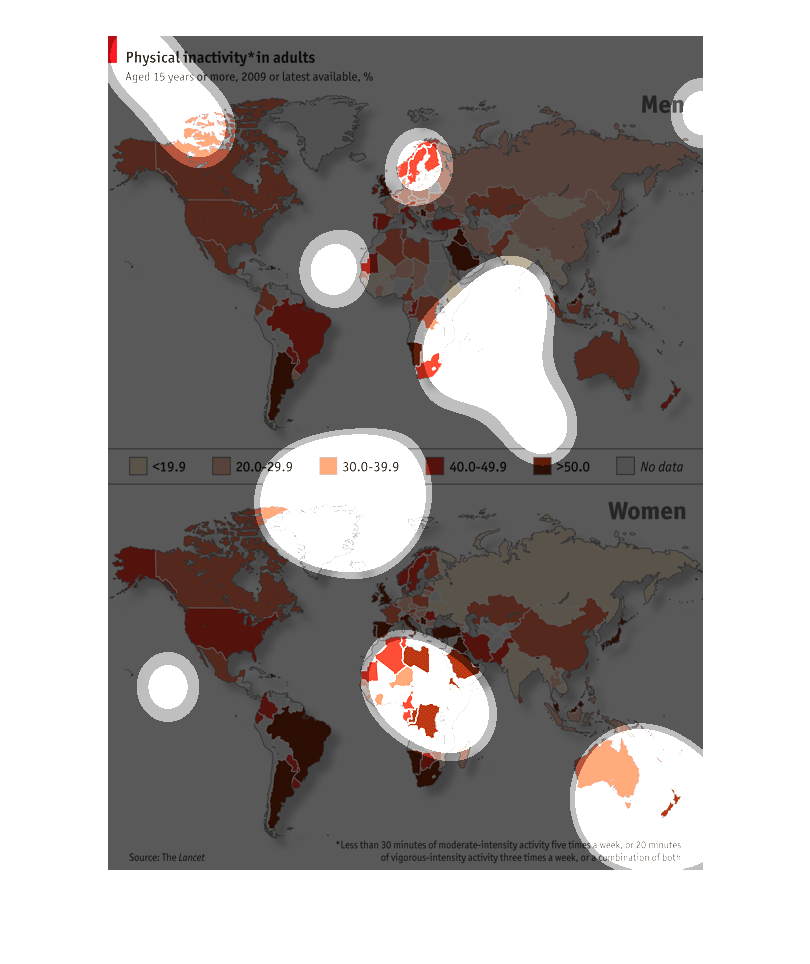
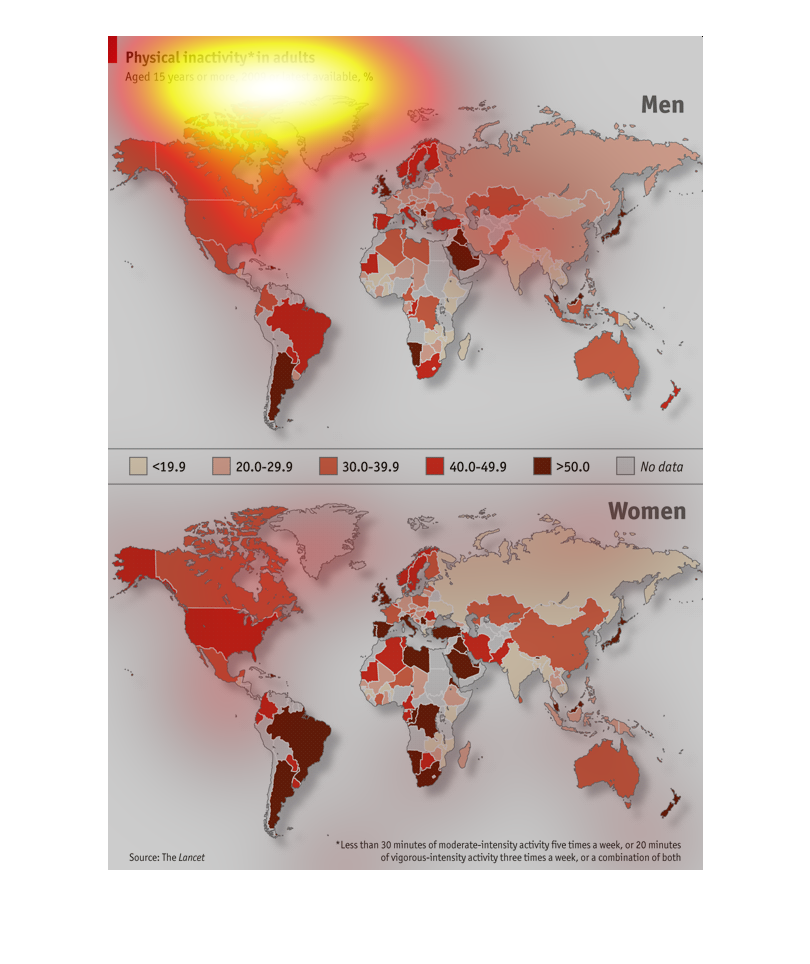
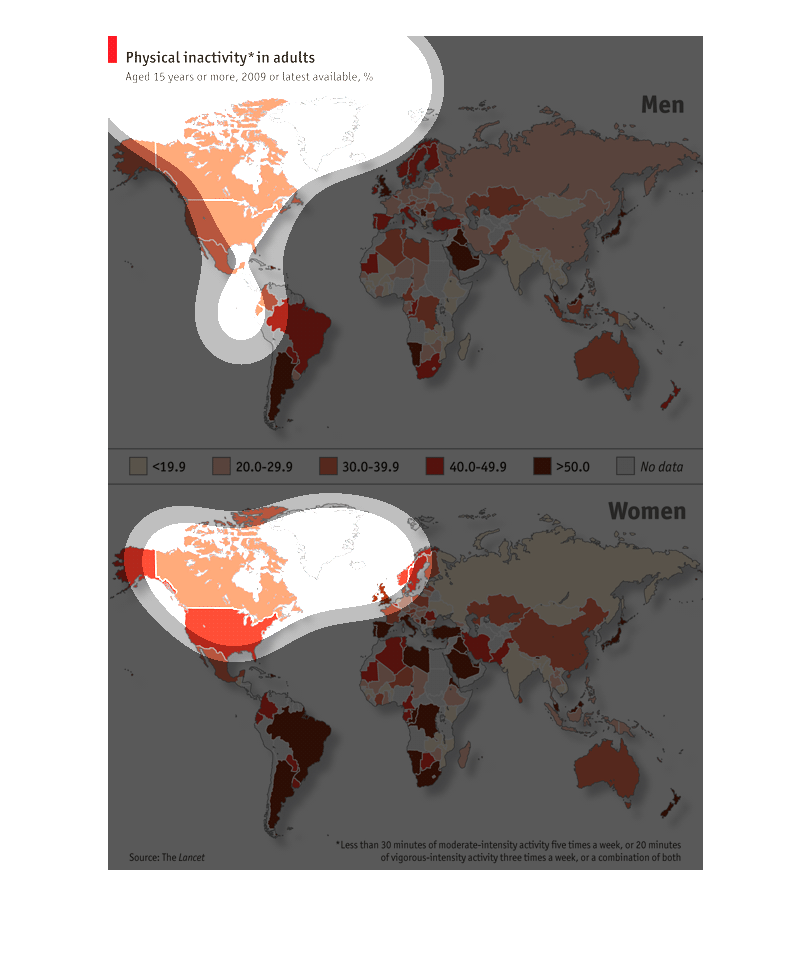
A map infographic showing the physical inactivity in adults throughout the world. It shows
the Western world is generally the most inactive with special cases like Brazil.
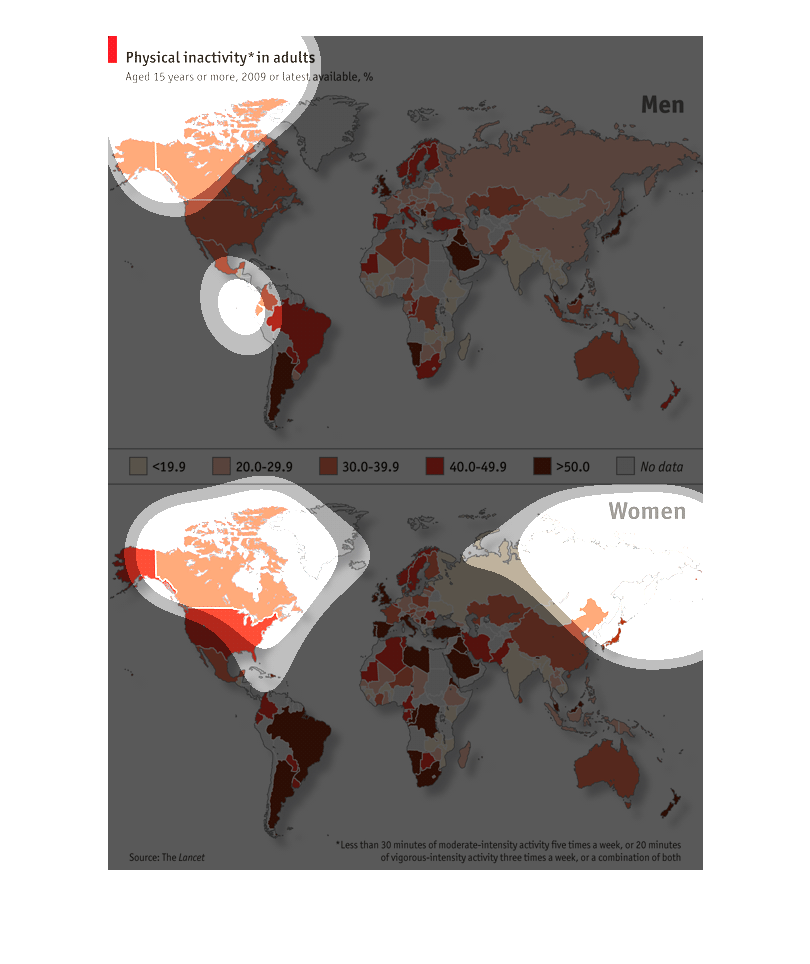
Again the image can only be assumed.  It appears to be a map of the world with different colors
representing different parts of the world.  However, unlike the example at the beginning there
are no circled areas to click on.
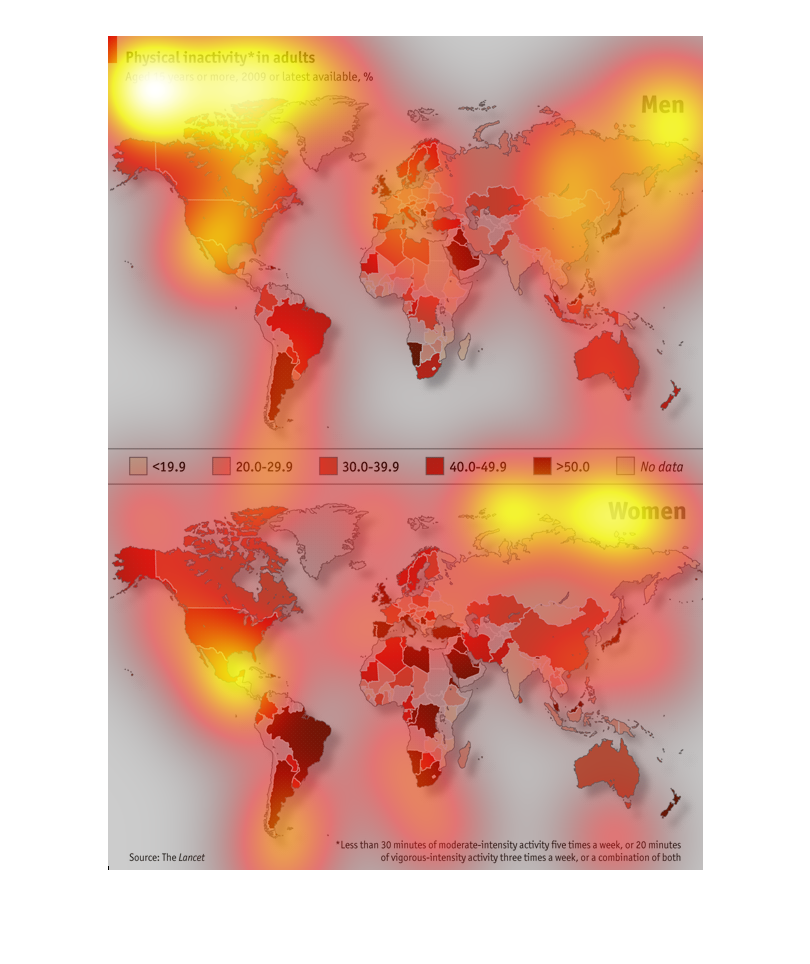
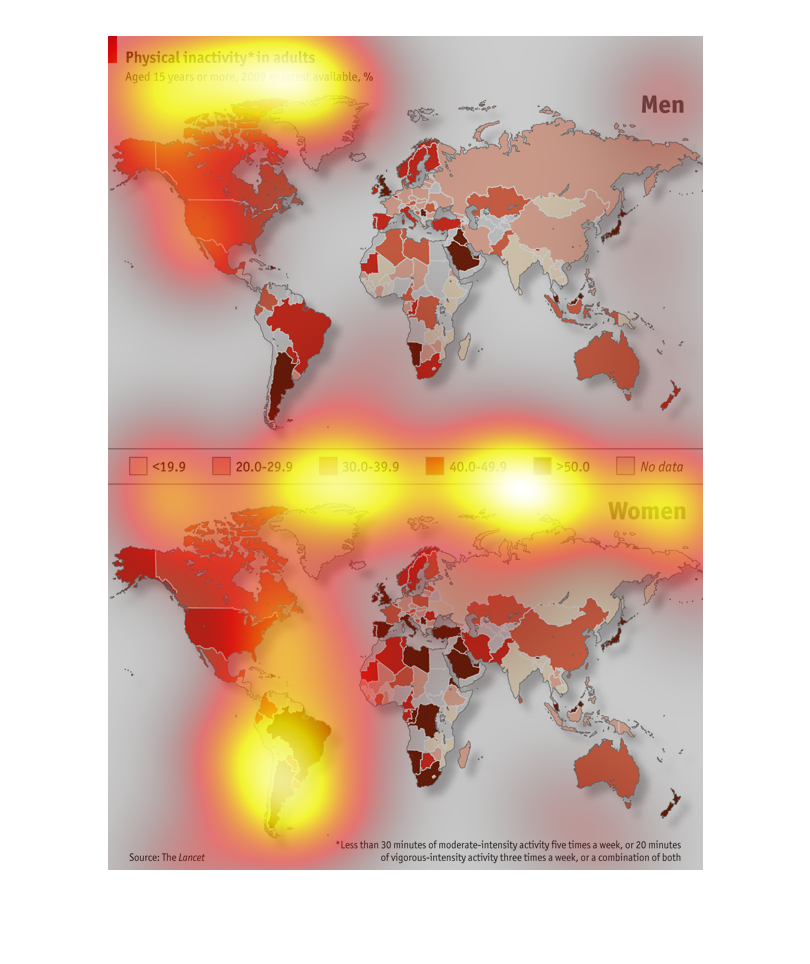
This graph shows the level of inactivity of both males and females in the world. Not surprising
it shows how there is less physical activity in developed nations than in under developed
ones.
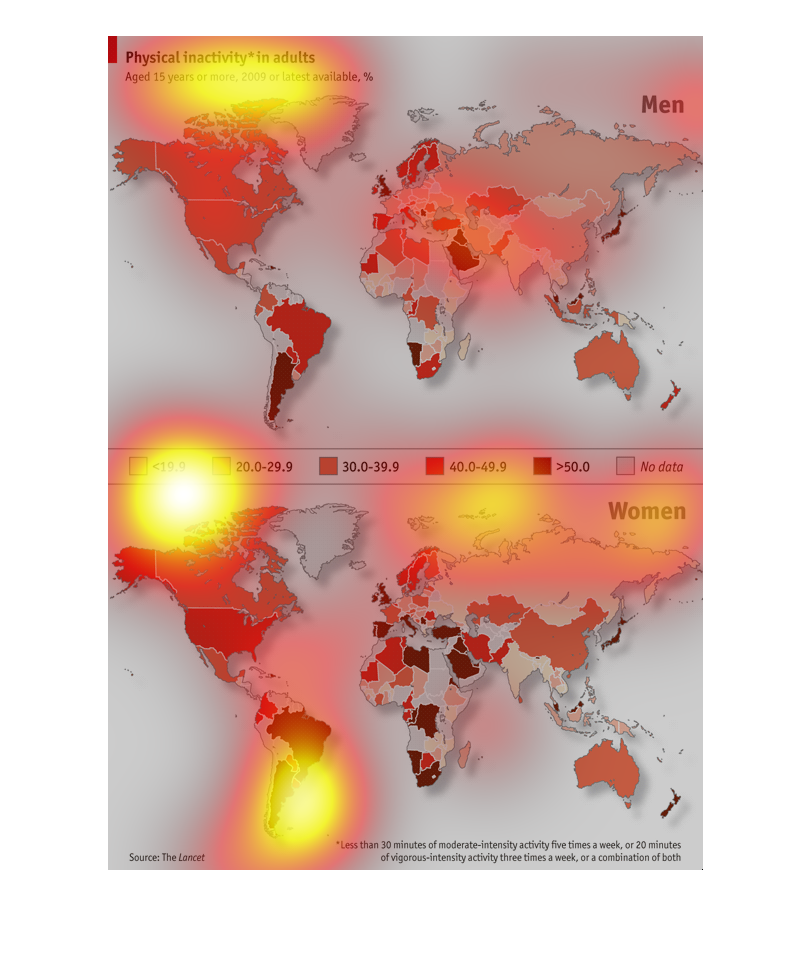
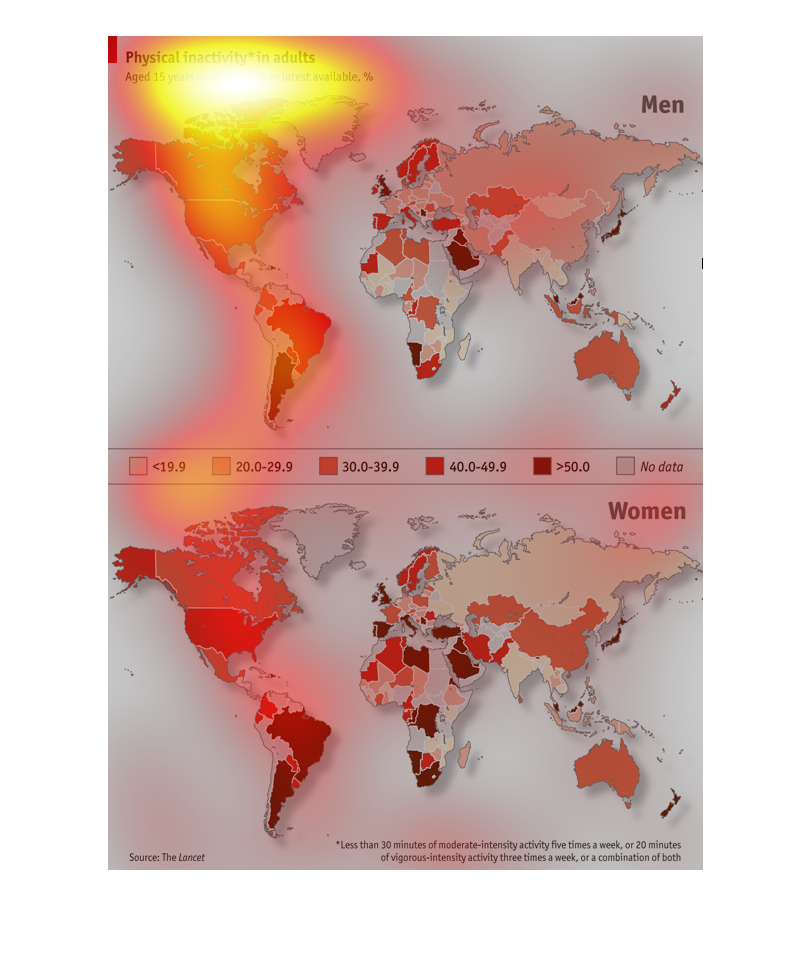
This image shows or depicts in statistical geographical map format the relationship between
various countries around the world physical inactivity among adults ages 15 years or older.
From 2009 to latest available %.
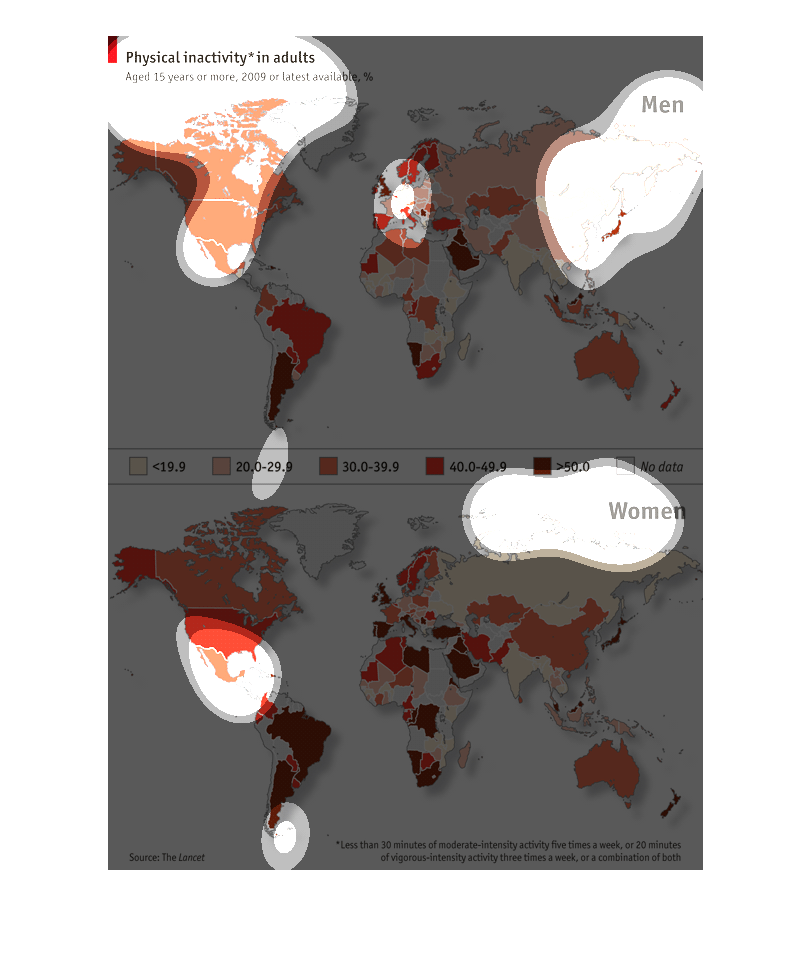
This is a world map displaying physical inactivity in adults.  The top displays men and the
bottom displays women with South America having the greatest percentage overall for both sexes.
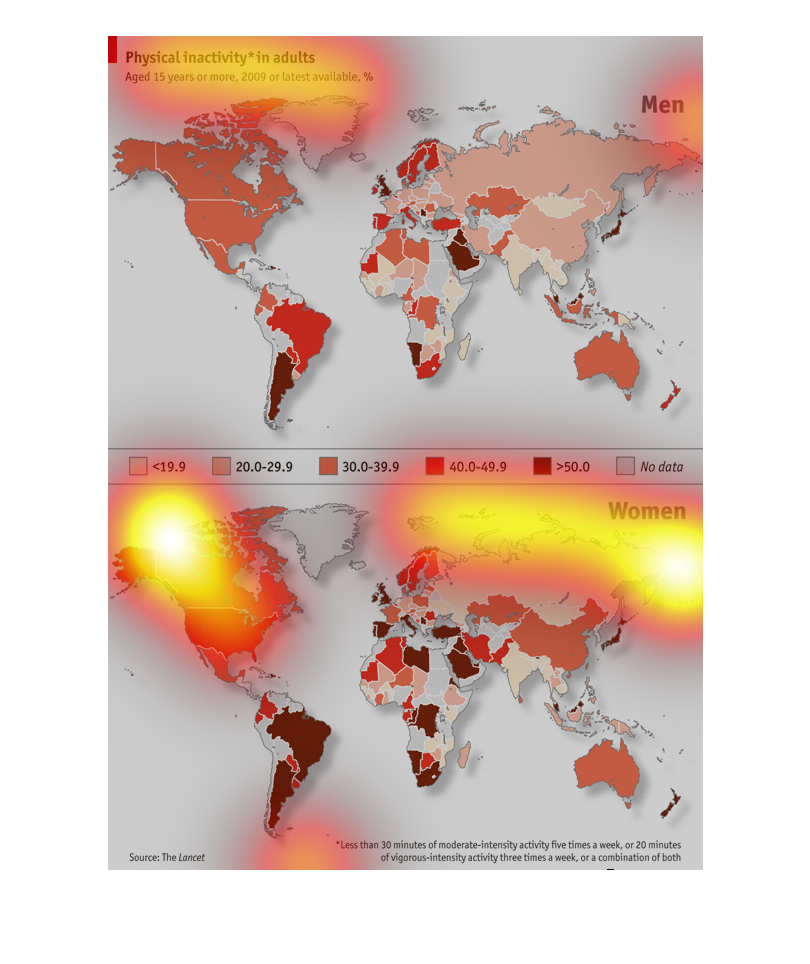
This chart describes physical inactivity in adults aged fifteen years or older, for the year
2009 or latest available percentage. Different percentages are represented by different colors.
The chart shows the physical activity levels of individuals aged 15 years or more throughout
all different locations in the world. The trend appears to be that women are less physically
active than men. Also, it appears that South America has countries with the most amount of
physically inactivity, with Africa behind them, then North America, and then scattered differences
throughout Europe and Asia.
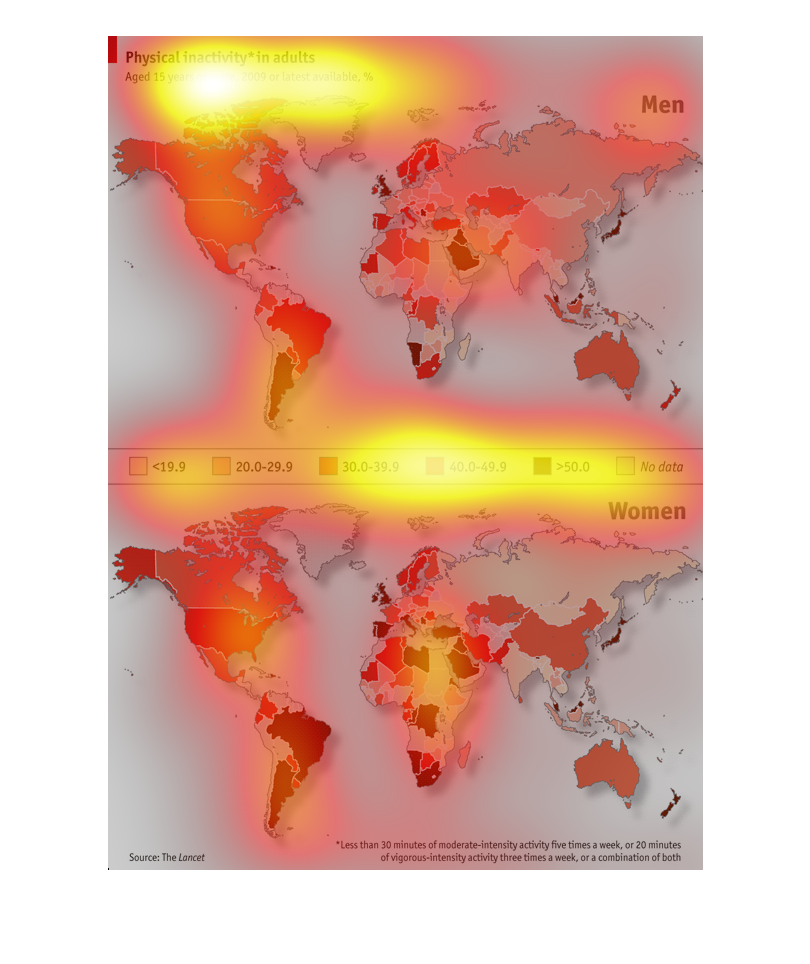
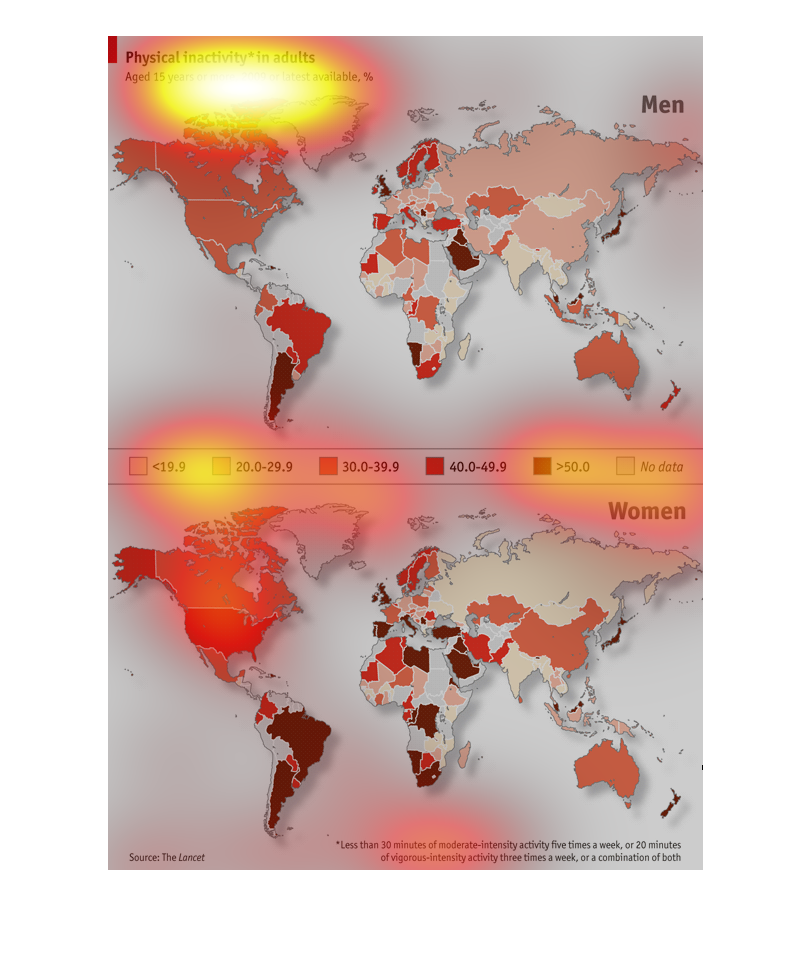
The graphs display physical inactivity based on country and gender of people aged 15 or older
in 2009. South America has the highest concentration of physical inactivity, followed somewhat
closely by North America.
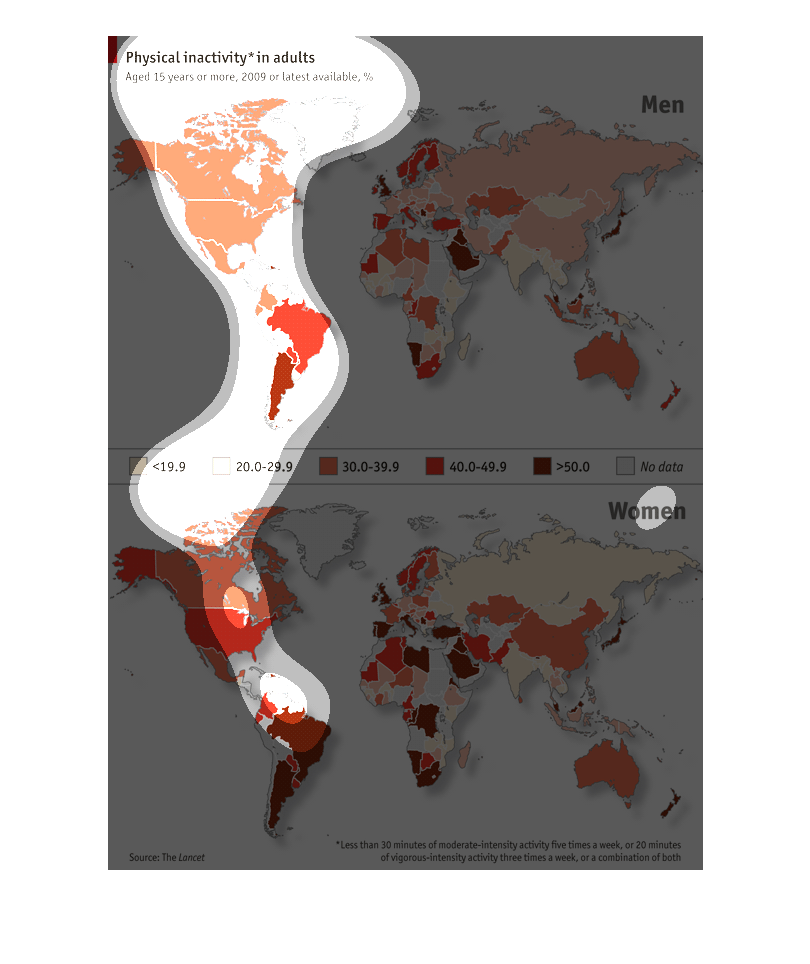
This is a chart that shows physical inactivity for adults. It contains two maps one for men
and one for women. It is a color coded map that goes from less then nineteen percent to over
fifty percent.