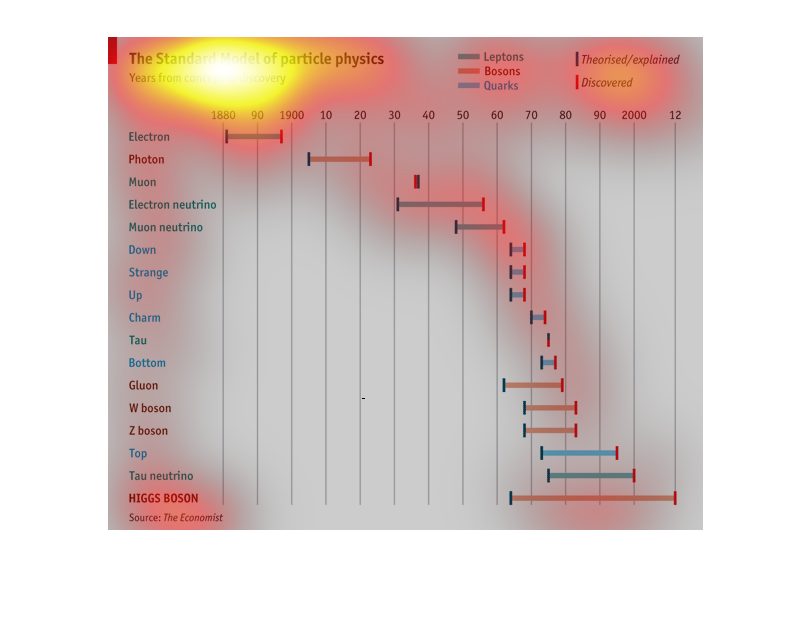
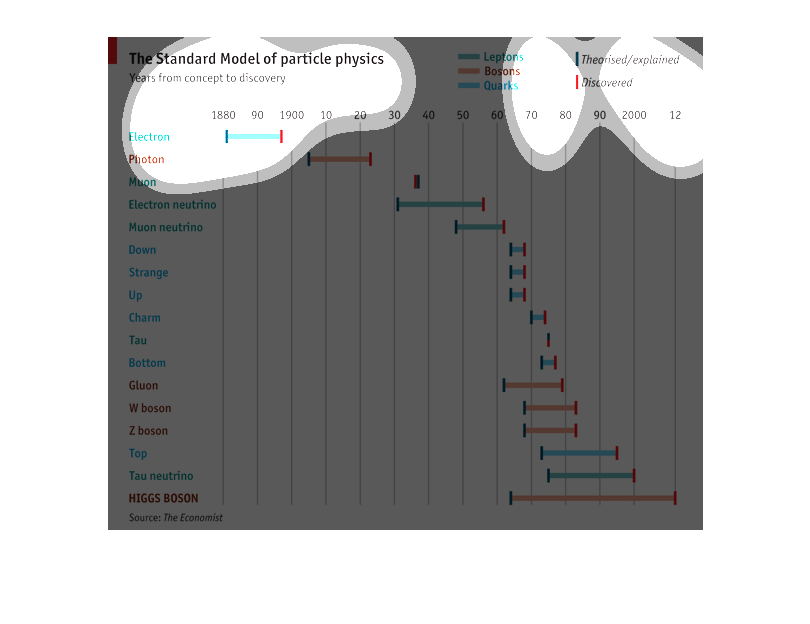
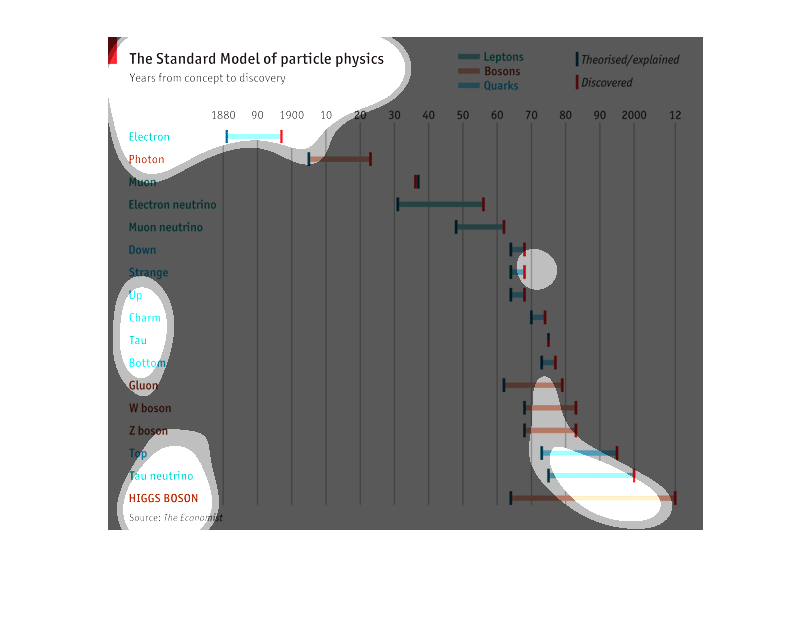
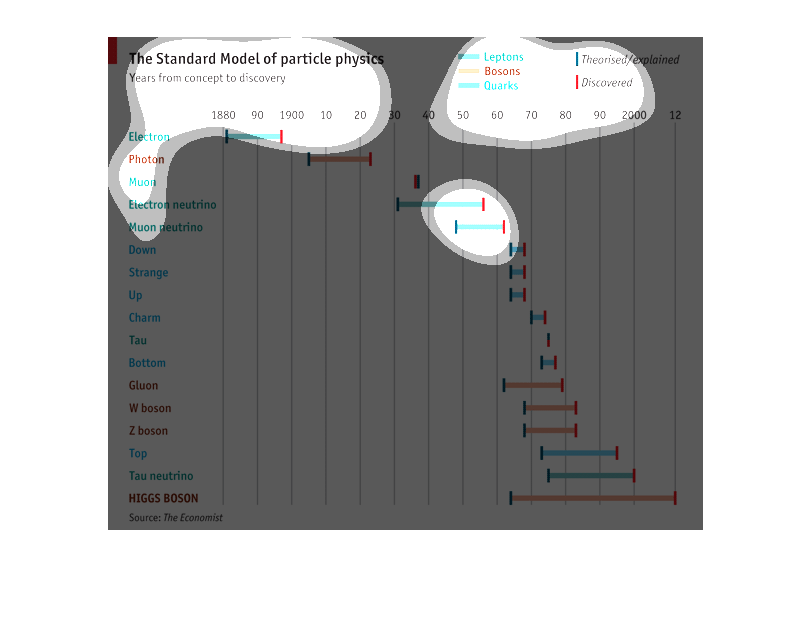
This is a bar graph, or line graph titled The Standard Model of Particle Physics and graphs
out the years from concept to discovery dating from 1880 to 2012

This chart shows the years from concept of particle physics to discovery. The chart goes from
1880 to 2012 for 17 different measured concepts with Higgs Boson taking from 1960 to 2012.

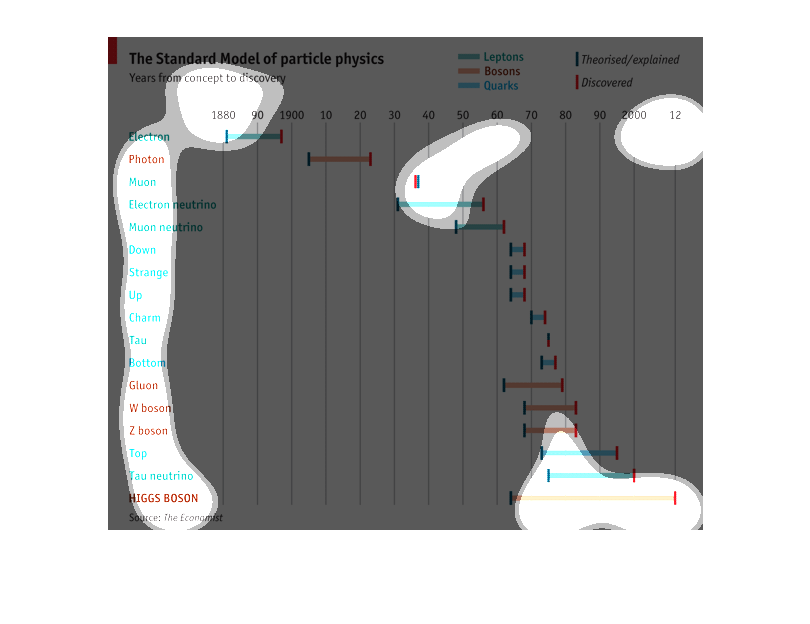
This chart shows the evolution of the standard model of particle physics, from its inception,
in years. Each discovery is charted in color and the length of time from concept to discovery
are shown.

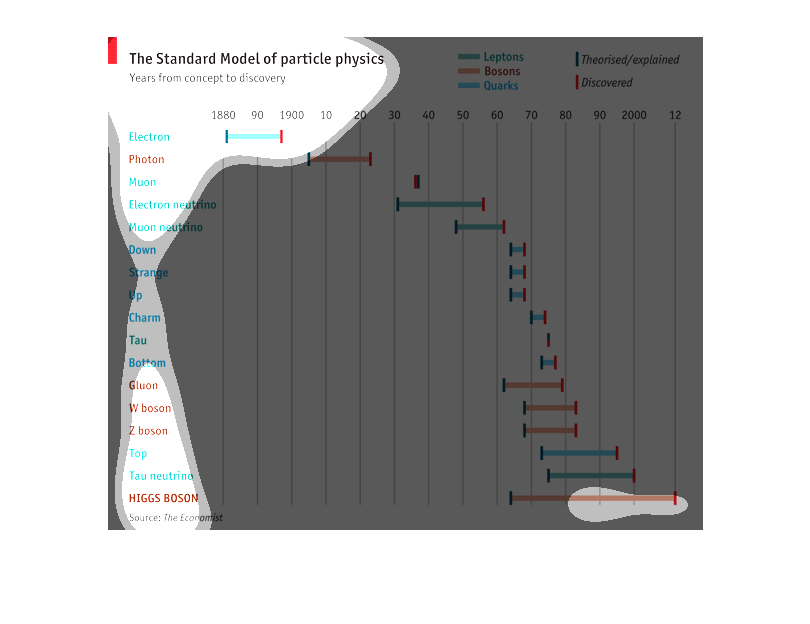
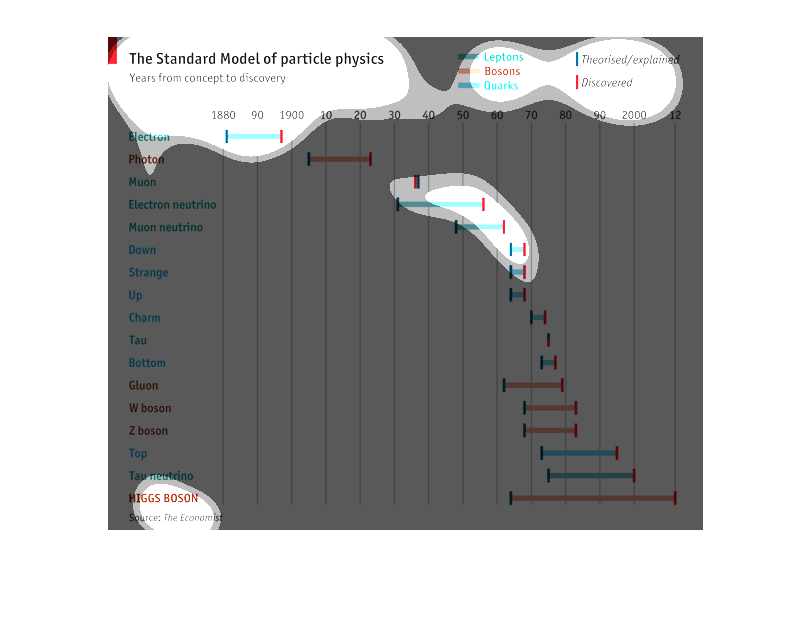
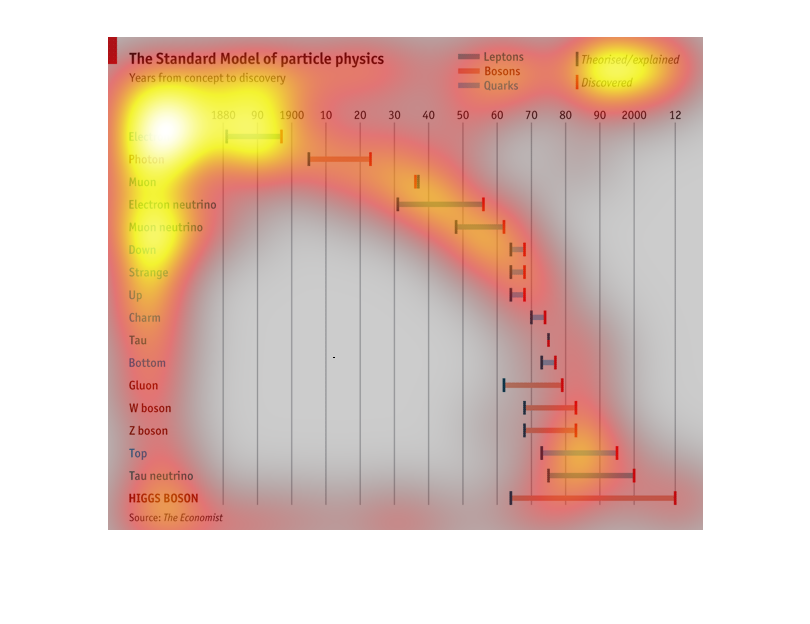
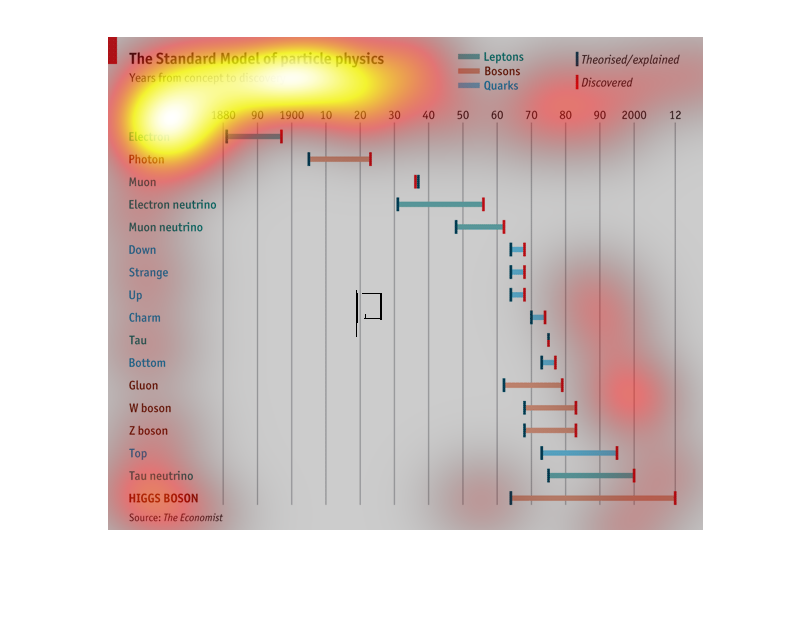
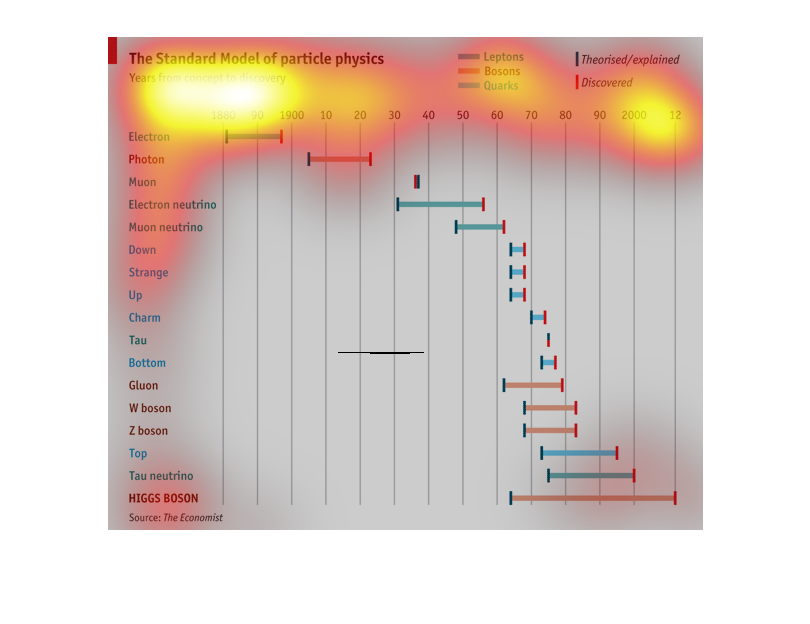
This image shows or depicts in line bar statistical format the many discoveries of various
aspects of particle physics either theorized, explained or discovered over the years.
This graph shows the evolution of the standard model of particle physics.  It displays theorized
and discovered dates for leptons, bosons, and quarks.

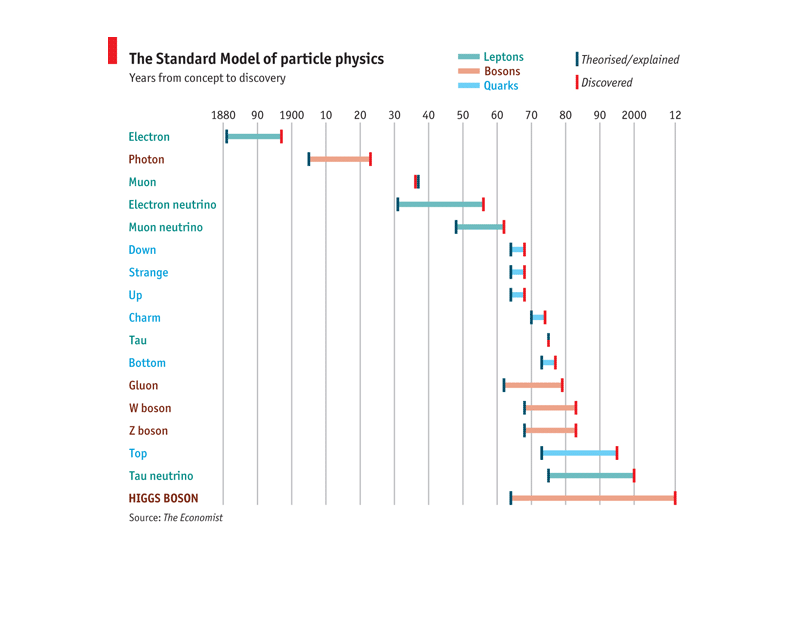
It looks like this is a chart detailing when different particles of physics were theorized,
and the time it took to actually discover the individual particles. Each particle seems to
be grouped into 3 categories: Leptons, Bosons, and Quarks.
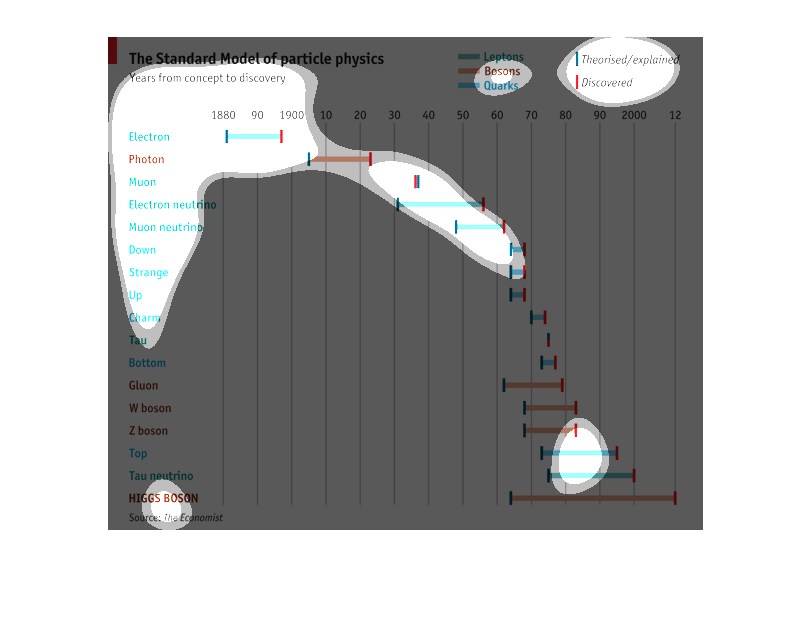
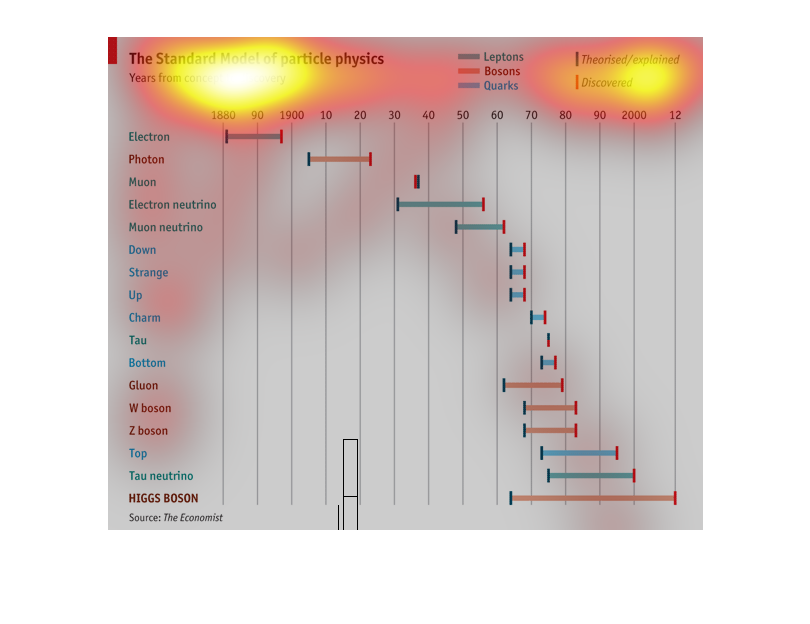
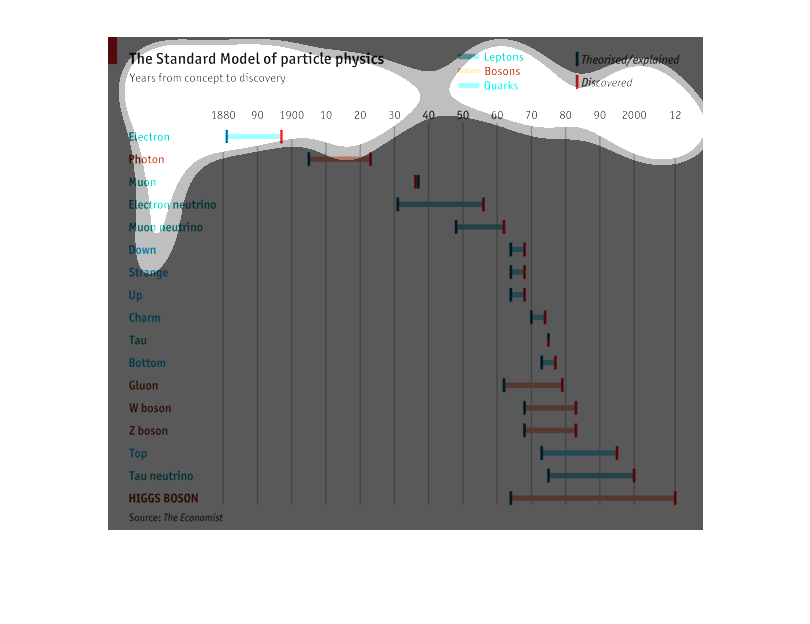
This is a chart describing the amount of time it took from concept to discovery of information
regarding the standard model of particle physics, beginning with the electron and ending with
the HIGGS BOSON.
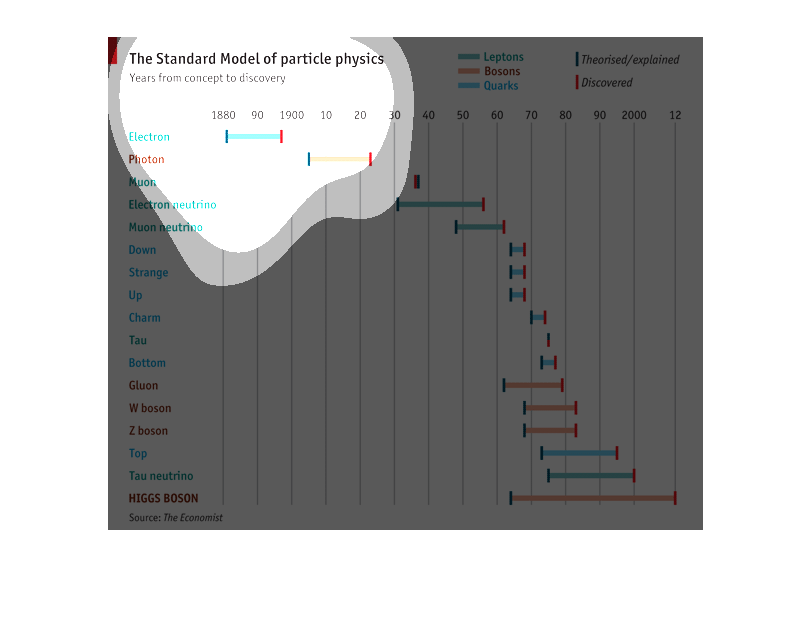
The image displays a graph attempting to visualize the time that lapsed between the conception/theorizing
and the confirmation discoveries for several standard models of particle physics. The names
of the models are listed chronologically along the y-axis with oldest theory listed at the
top and years are listed along the top of the graph, beginning with the year 1880.
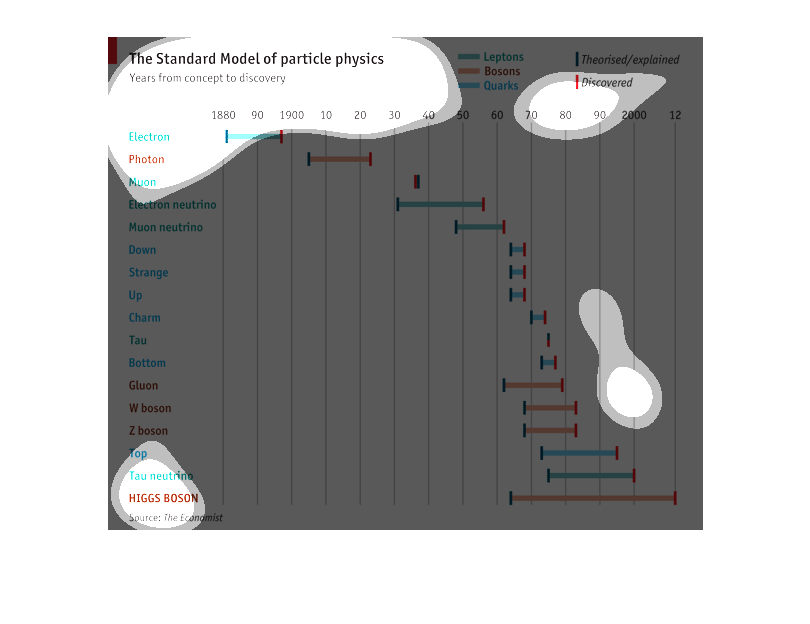
This chart describes the standard model of particle physics. Categories on the chart include
Photon, Muon,  neutrino, Down, Strange, up, Charm, and Bottom.
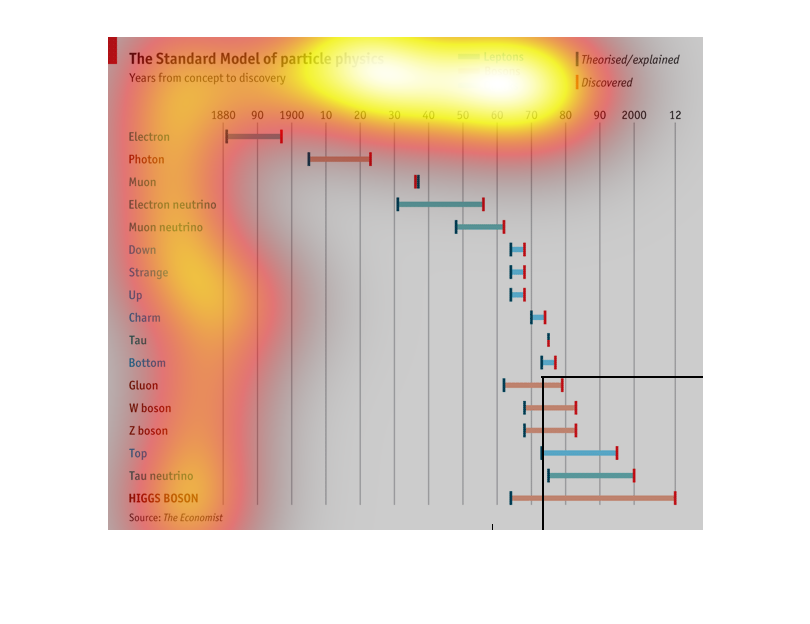
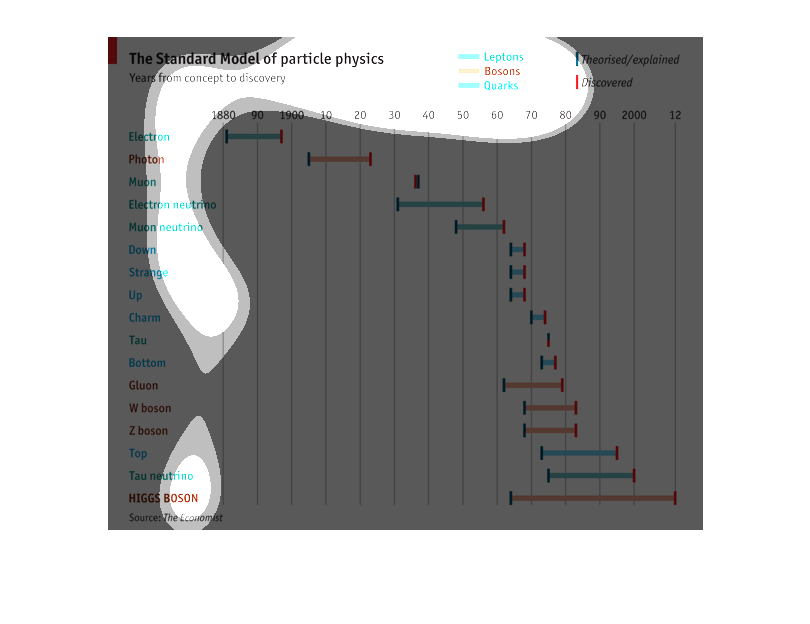
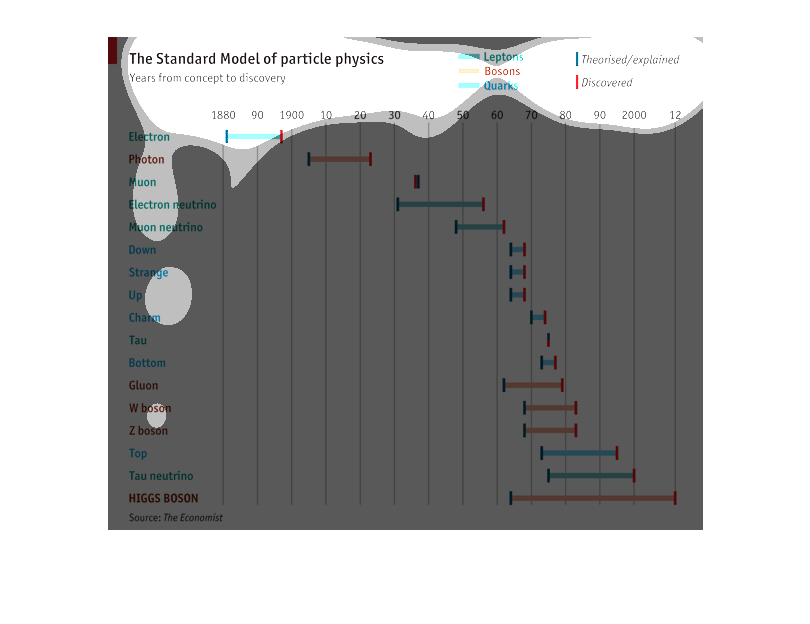
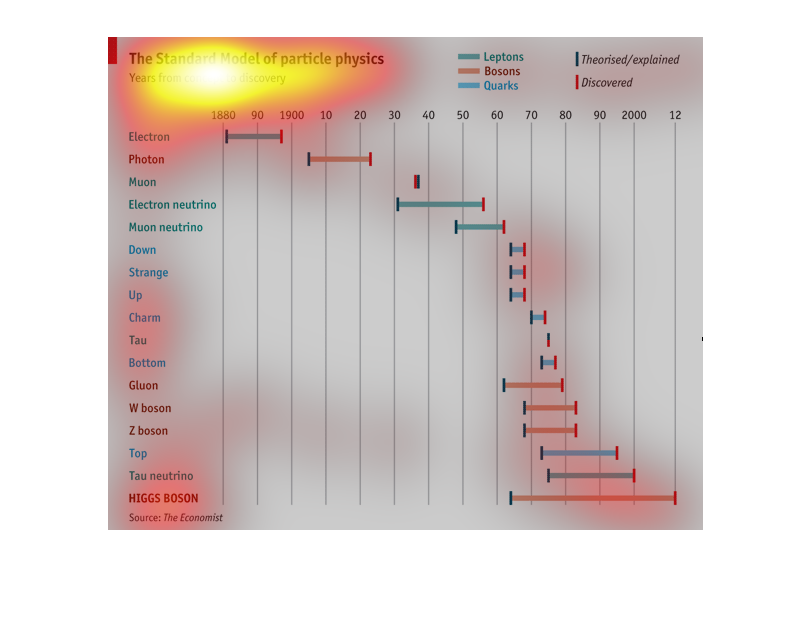
This graph shows the standard model of particle physics. It shows the time frame of particle
discovery by year over time and how it has evolved as well.
This image is showing the Standard model of Particle Physics. The left side is showing the
particle discoverd while the top is showing years from theory to discovery. Showing from theroy
to discovery it covers what size the element was ranging from leptons to quarks.
The title of this graph is, "Standard model of particle physics".  The graph charts about
a dozen particles descending the left hand side of the graph.  The time frame for the graph
runs from 1880-2012.
This chart shows the standard model of particle physics, showing how long in years it took
each part to become part of the official science, from original concept (theorized or explained)
to official discovery. Some particles took longer than others. Particles include everything
from electrons and photons (discovered long ago) to more recent discoveries like the tau neutrino
and HIGGS BOSON.
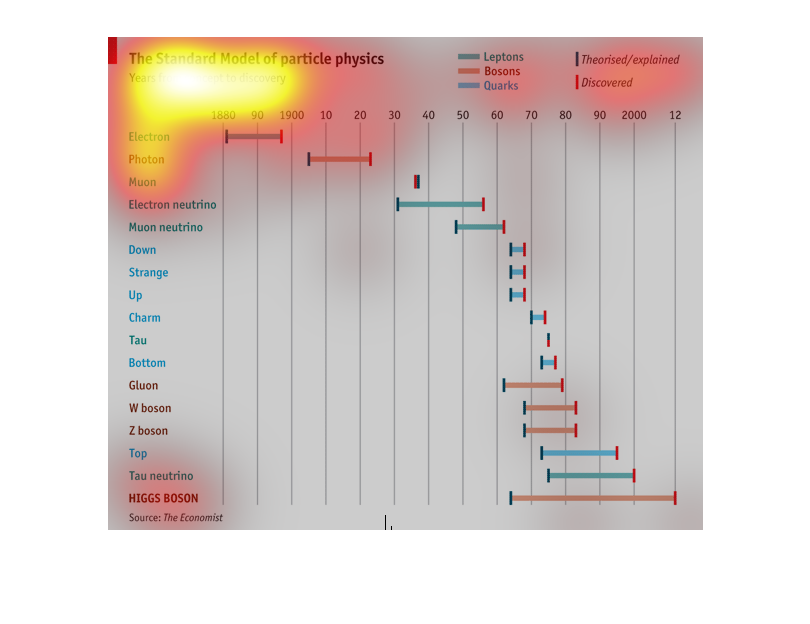
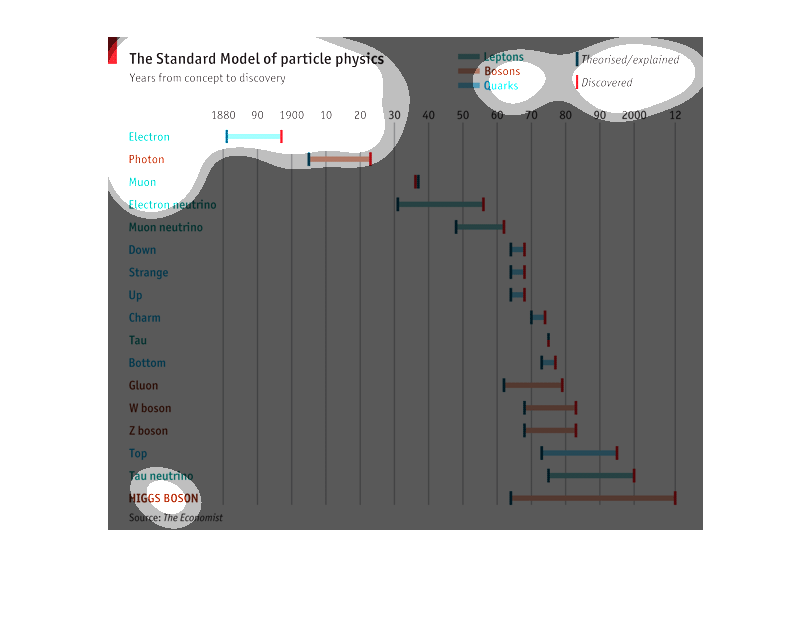
This chart describes the standard model of particle physics. It lists all the different particles
(bosons, quarks, electrons, protons, etc), with when they were theorised/explained and when
they were discovered. The oldest particle, the electron, was theorised in 1880; the youngest,
the Higgs Boson, was theorised in the 1960s, but as of 2012 was not discovered (has been discovered
recently).
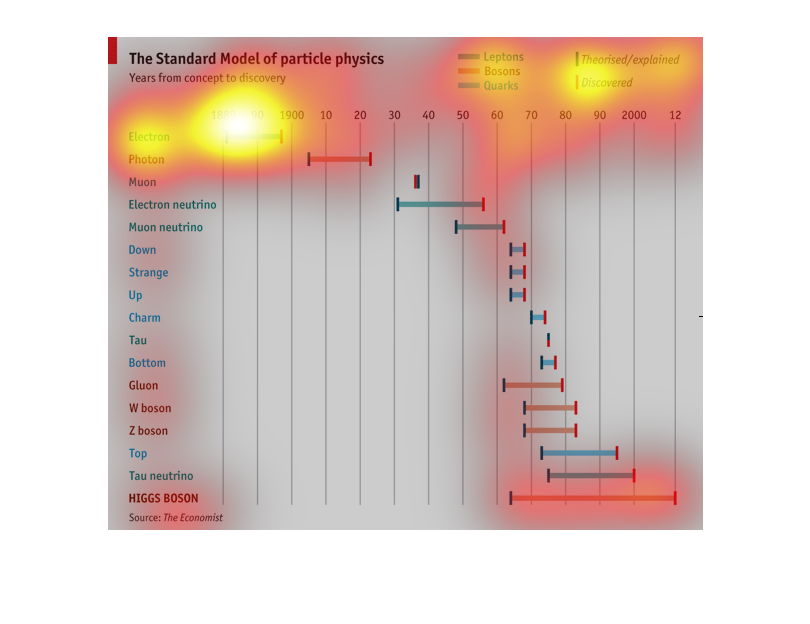
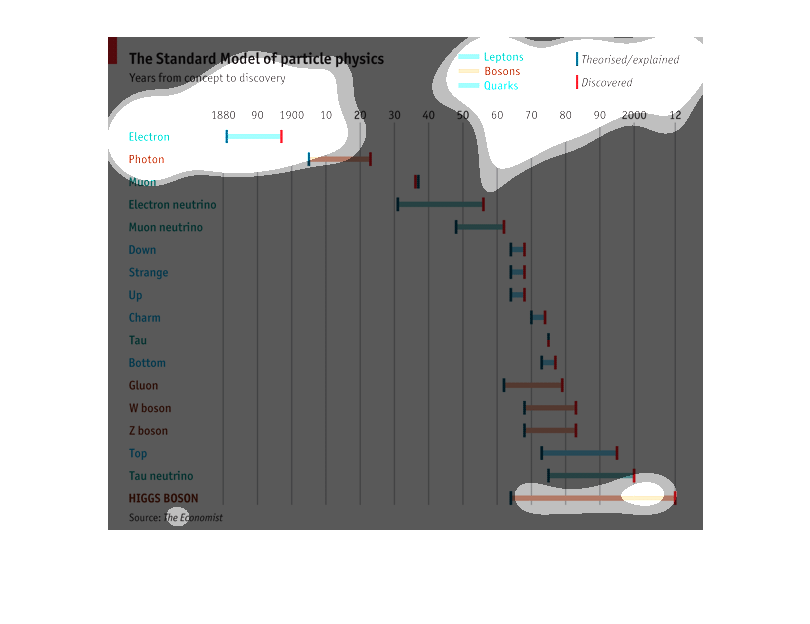
This is a graph that shows particle physic concepts and how compares how long they took to
be discovered. They include theorized concepts and actual discovered concepts. The chart goes
from 1880 to 2012.