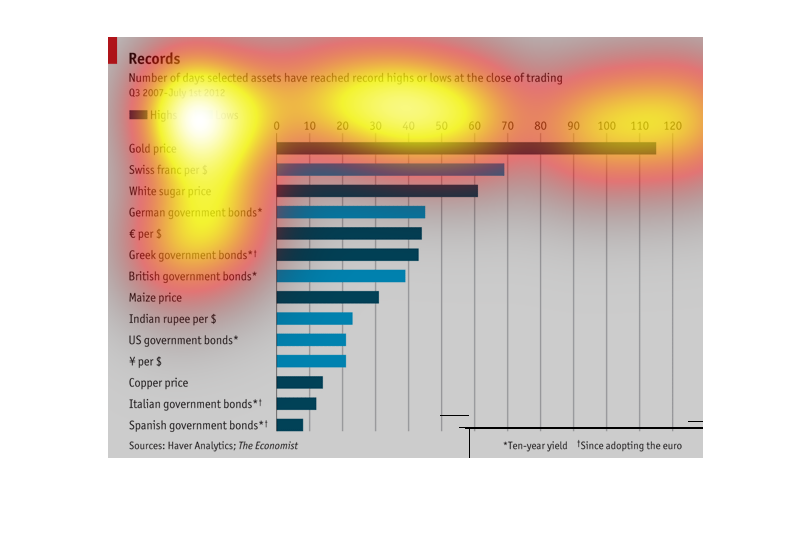
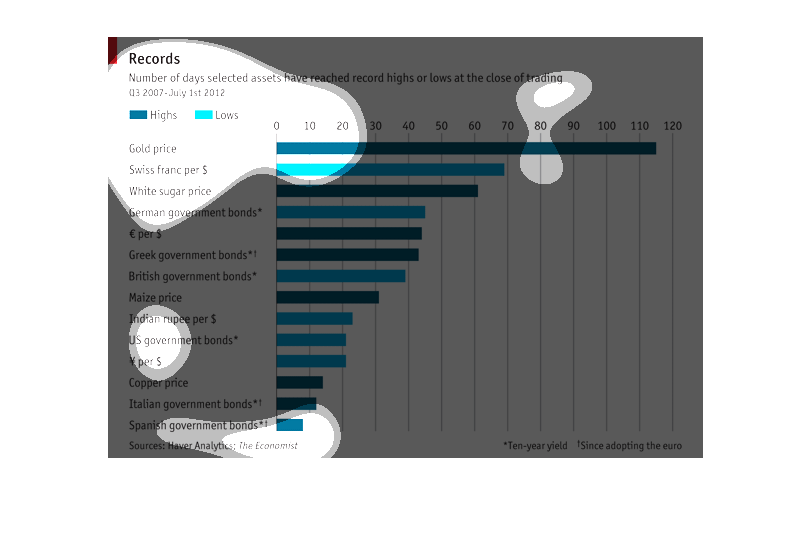
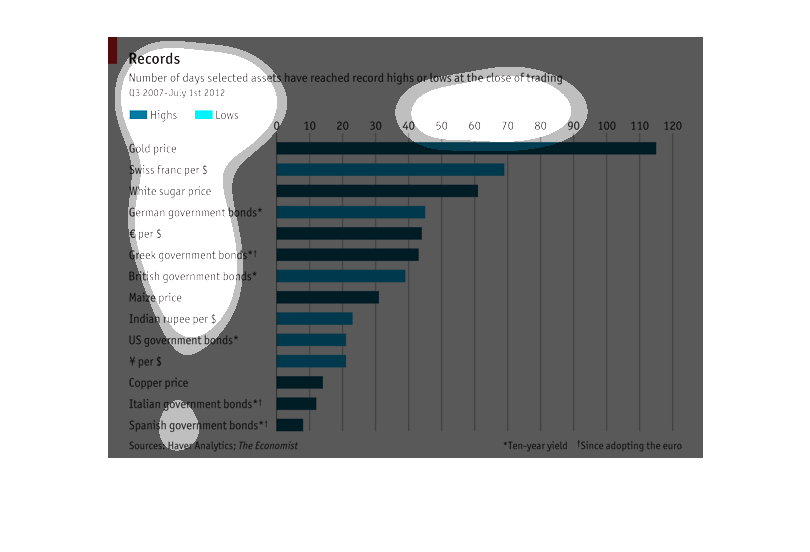
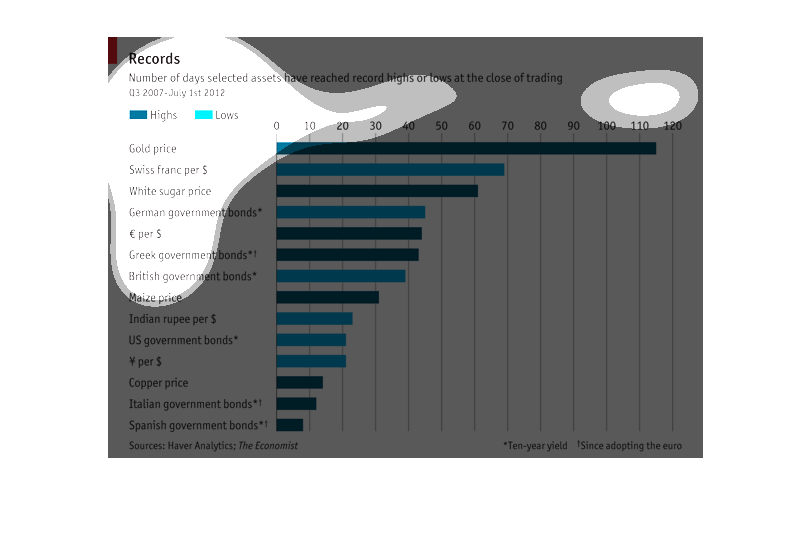
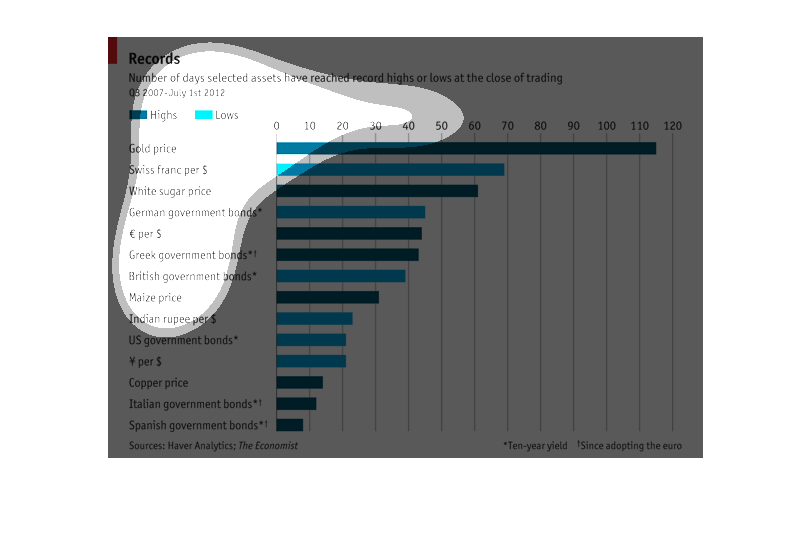
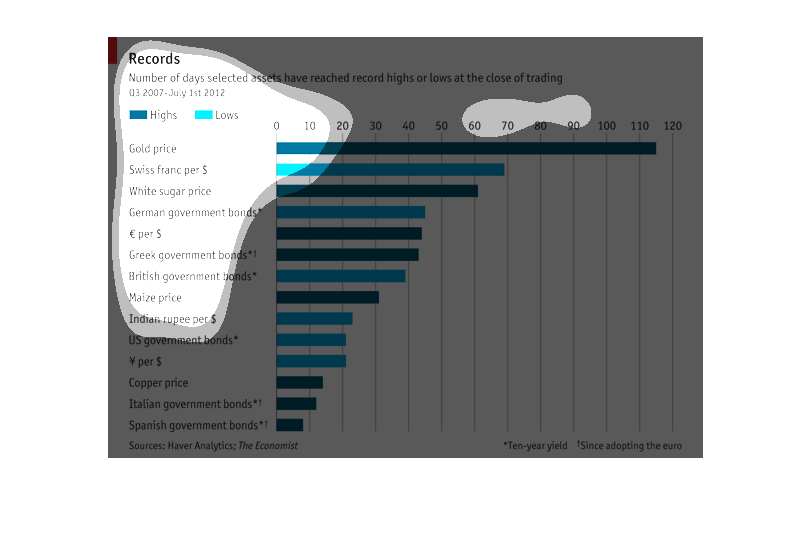
This graph shows the number of days various selected assets that have reached record highs
or lows at the close of trading.  Such assets include gold, white sugar, and US government
bonds.  Spanish government bonds are at a 10 day high and gold price is at a 115 day high.
 Swiss francs, on the other hand, are at a 70 day low.
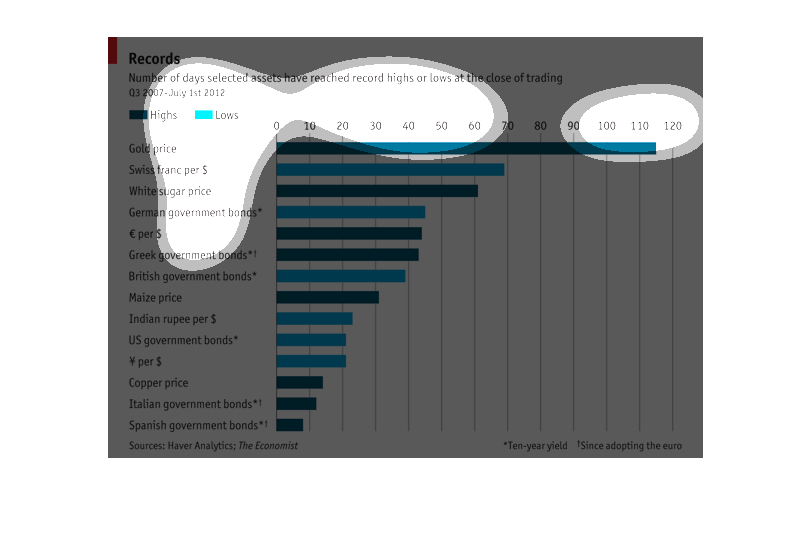
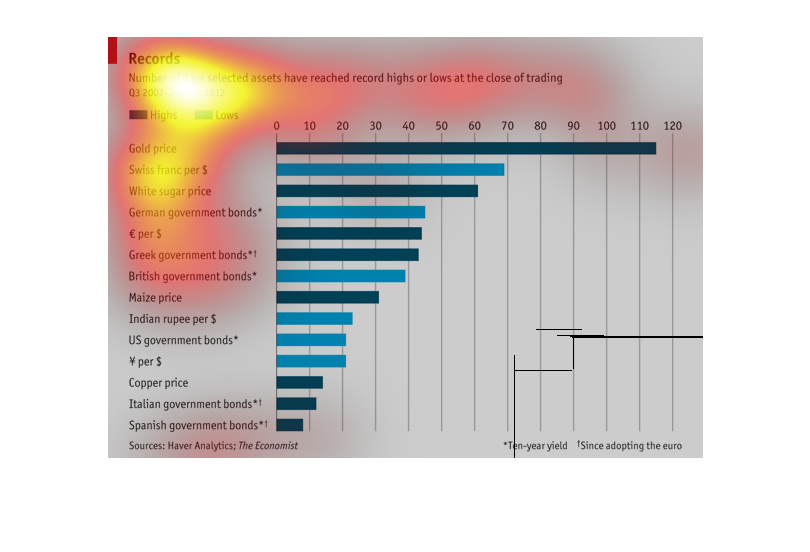
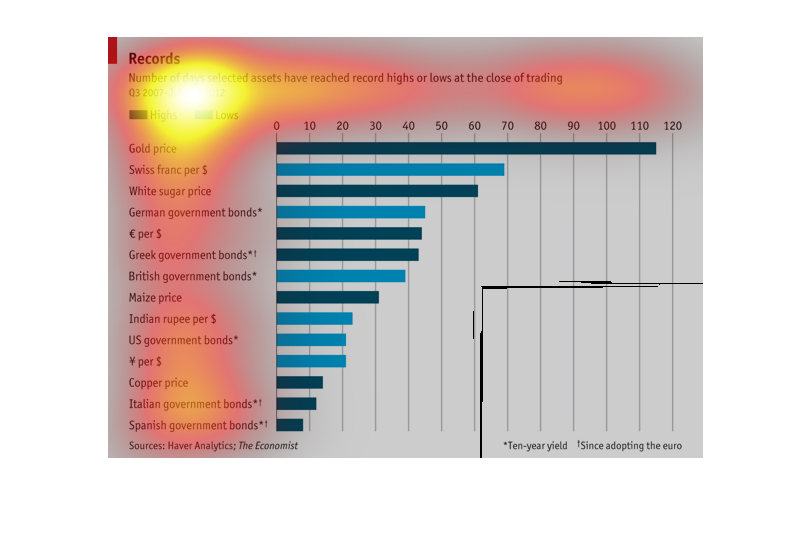
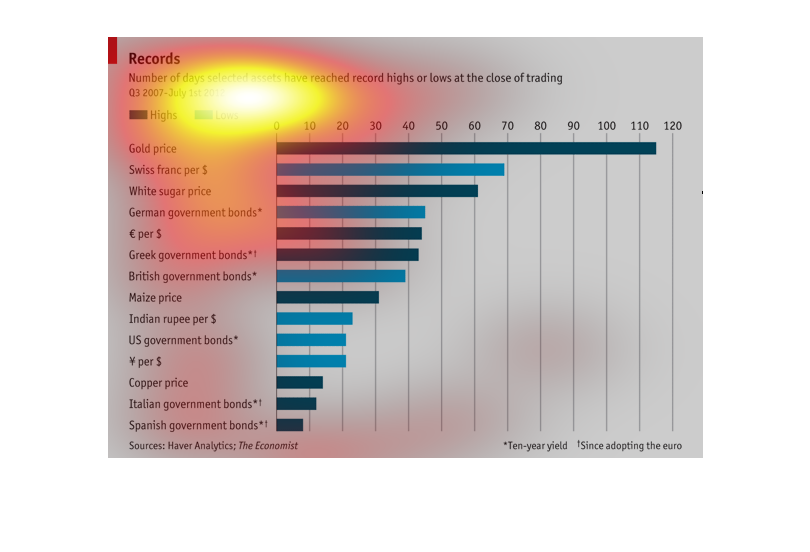
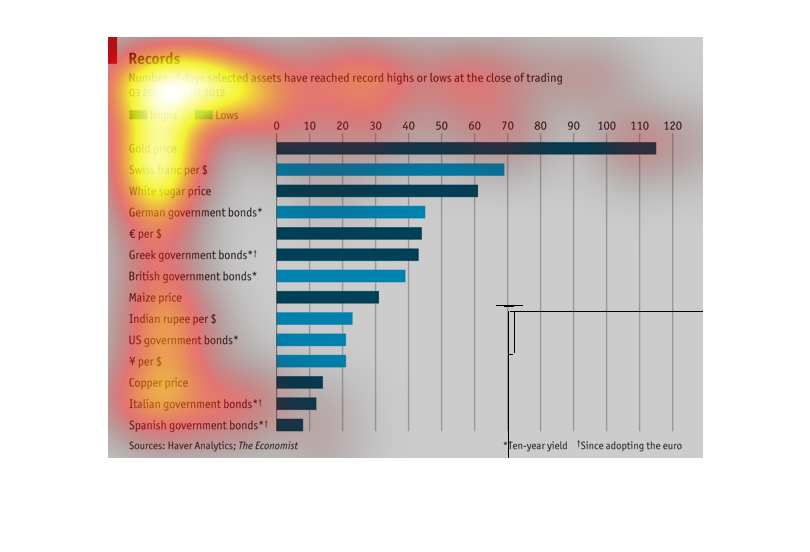
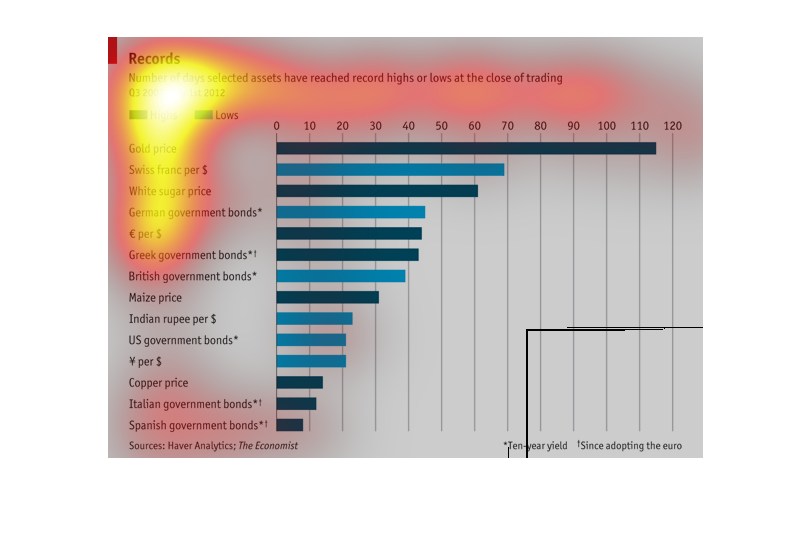
This graph shows how many times the highs or lows have been reached for selected currencies
from the third quarter of 2007 to July 2012. Gold is number one at above 110 while Spanish
government bonds is at less than 10.
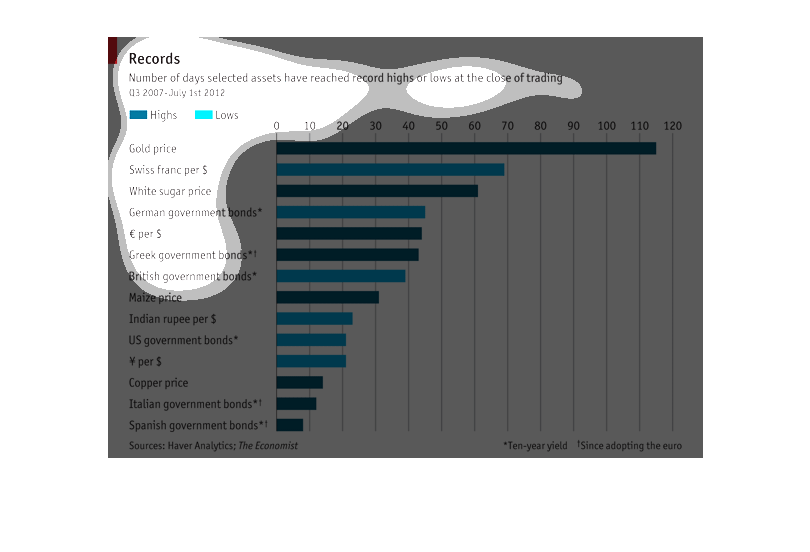
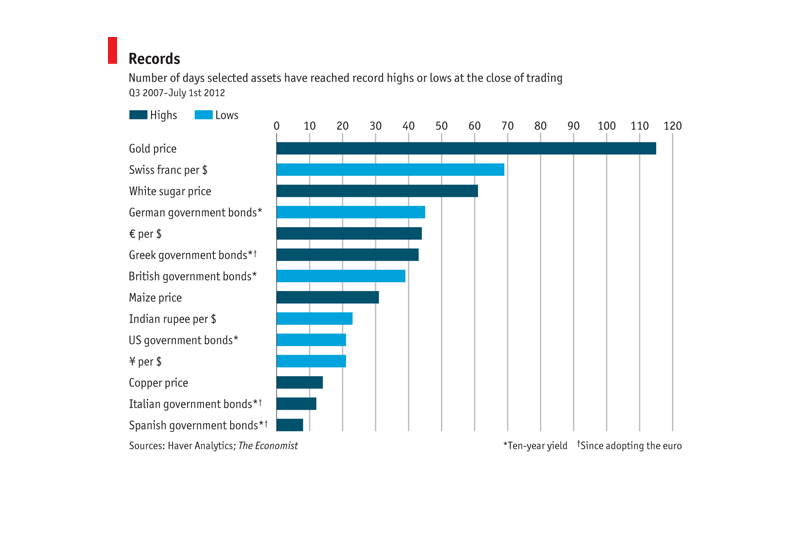
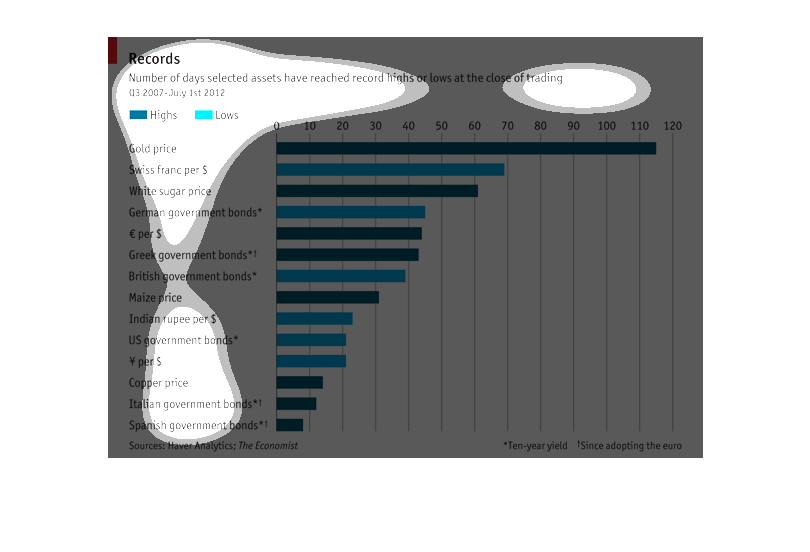
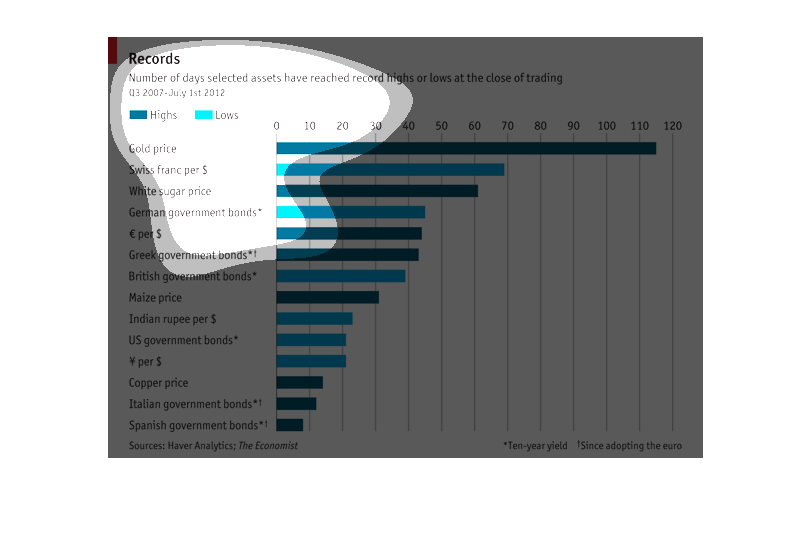
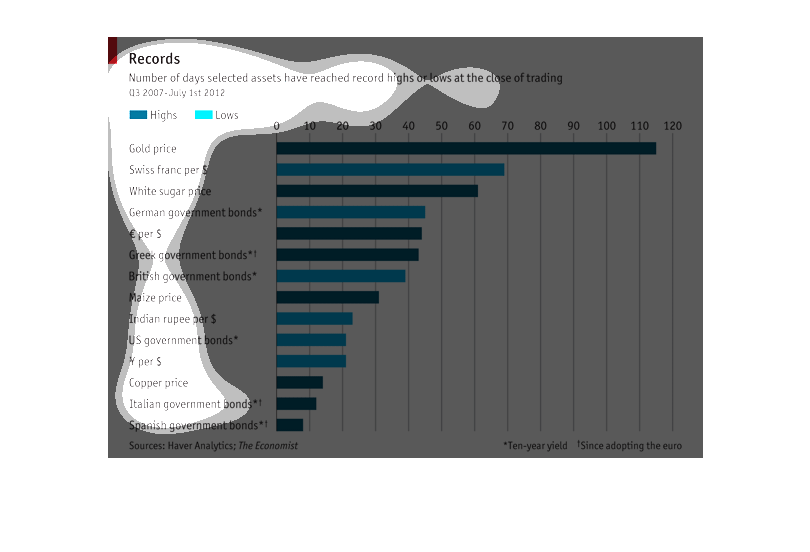
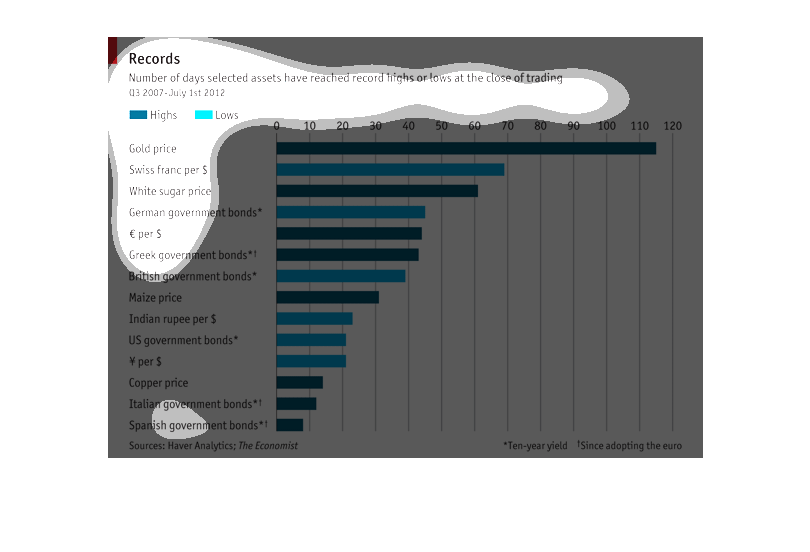
This a a graph depicting the records for the number of days selected assets have reached record
highs or lows at the close of trading in selected commodities, bonds, etc.
The title of this graph is, 'Records'.  The subtitle of this graph is, 'Number of days selected
assets have reached record highs or lows at the close of trading.  Descending the left hand
column of the graph are various assets, precious metals, government bonds, and foreign currencies.
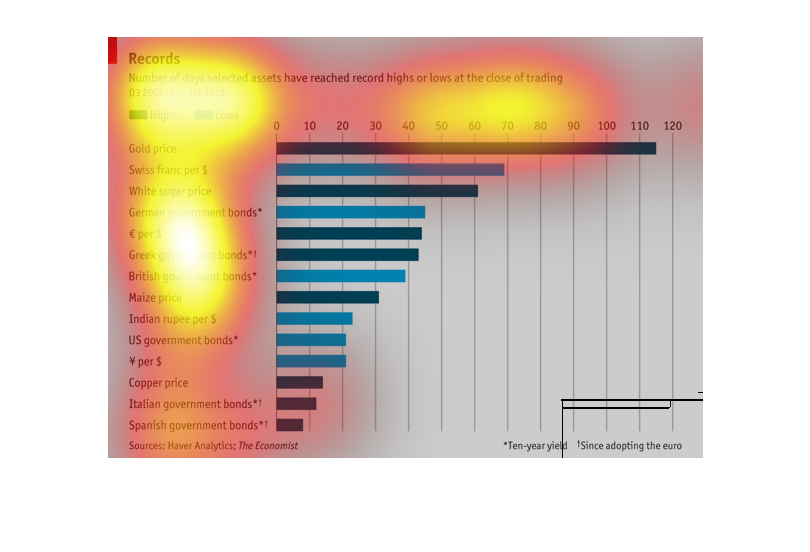
This chart describes records. Specifically the number of days selected assets have reached
record highs or lows at the close of trading. categories include gold price.
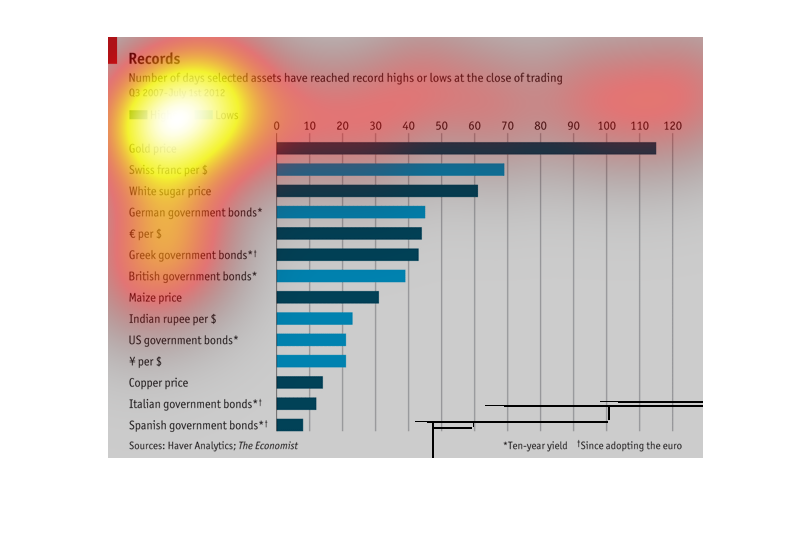
This graph shows "Records. Number of days selected days have reached.". Dark blue indicates
Highs and light blue indicates Lows. Along the left side in a column are monetary currencies
and prices for various items.
An infographic showing the number of days selected stock market assets have reached record
highs or lows at closing. Gold tops the chart showing it is the most volatile
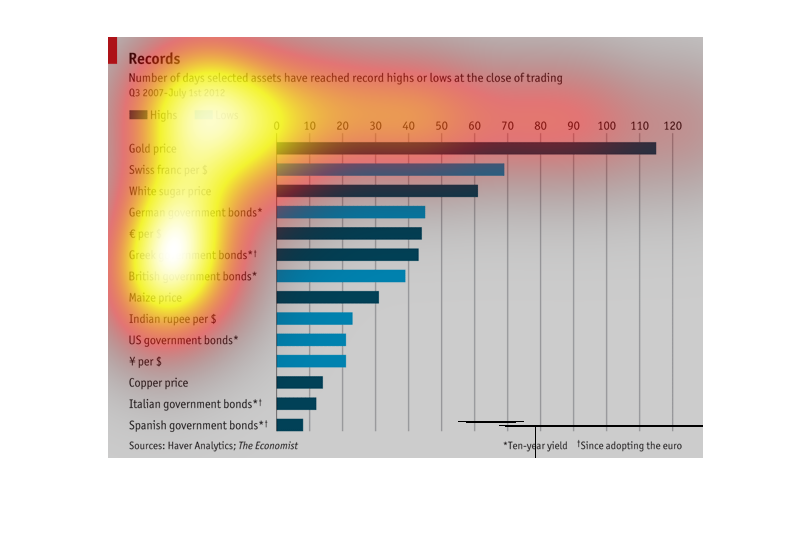
This is a chart showing record highs and lows of assets being traded. It shows various country
bonds, sugar, copper, corn, and gold. Gold is leading the pack, and Spanish bonds are at the
bottom.
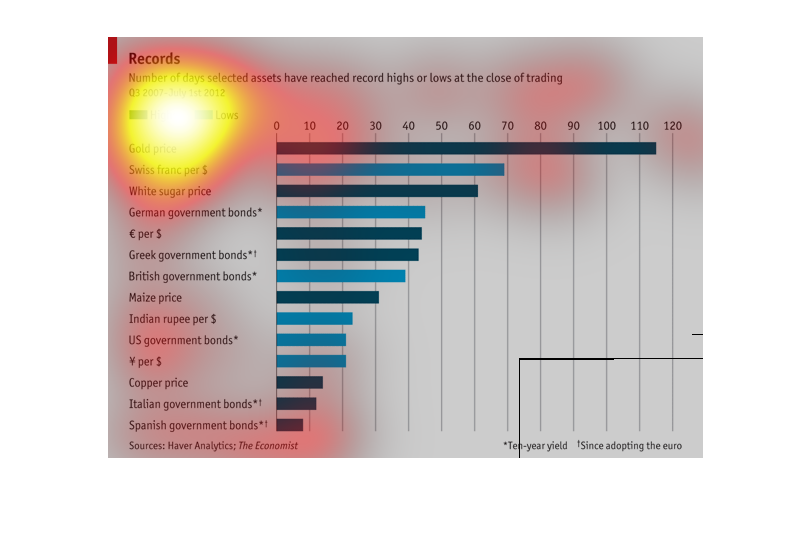
This image shows bars representing the number of days an asset reached a record high or low.
Gold is at the top for record lows followed by the Swiss franc per US dollar.
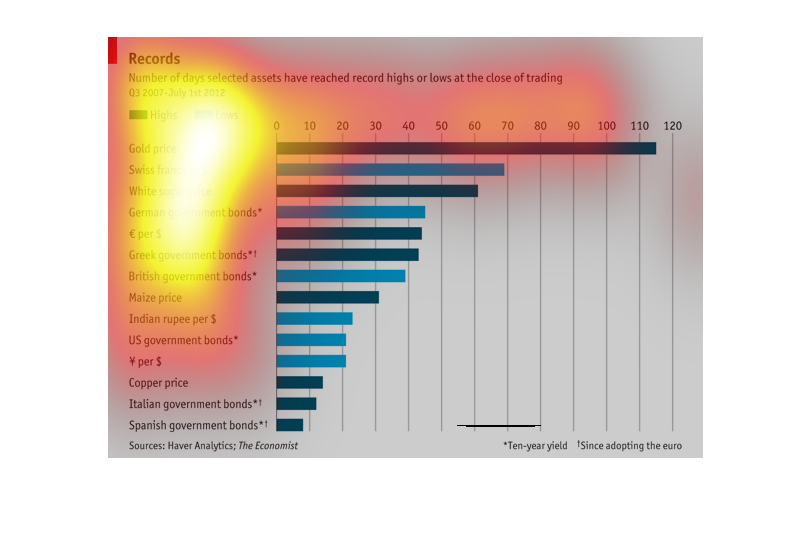
This graph shows the level of high and low level trades on any given day on such varied things
as Gold being very high to Spanish government bonds, which were regularly quite low.
this is a bar graph and the name is records and it shows which countries reached the highs
and the lows in trade and the graph shows that the price of gold is the highest.