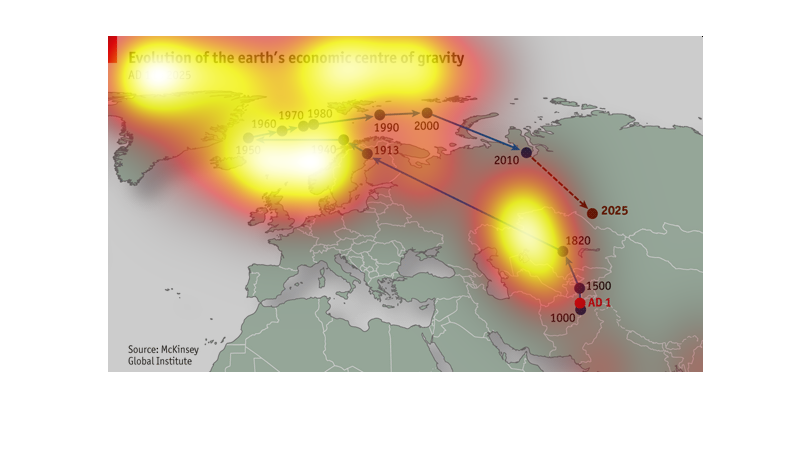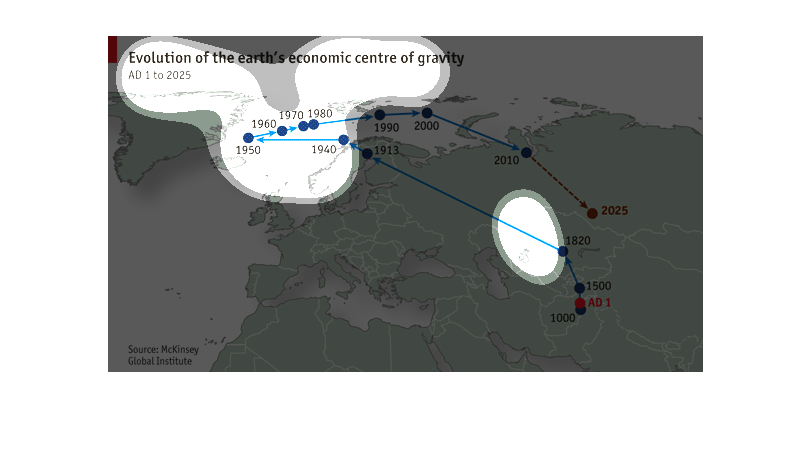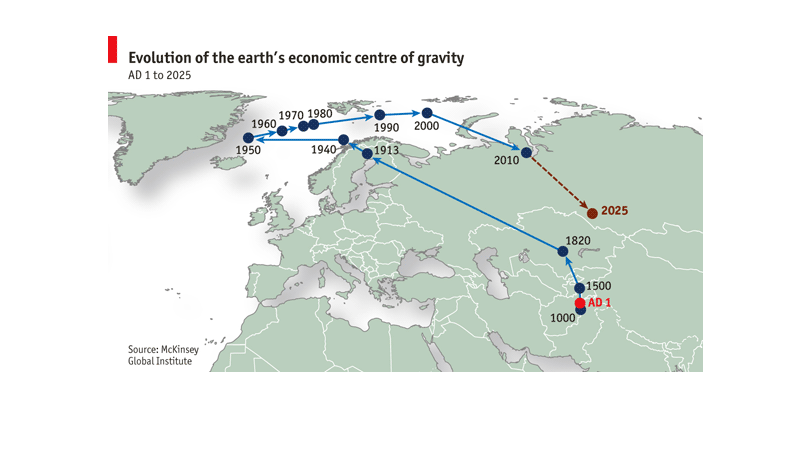
The image describes the economic "center of gravity" from AD 1 to the year 2025. Essentially,
it is displaying the changes in the economy of Europe through a little over 2,000 years.
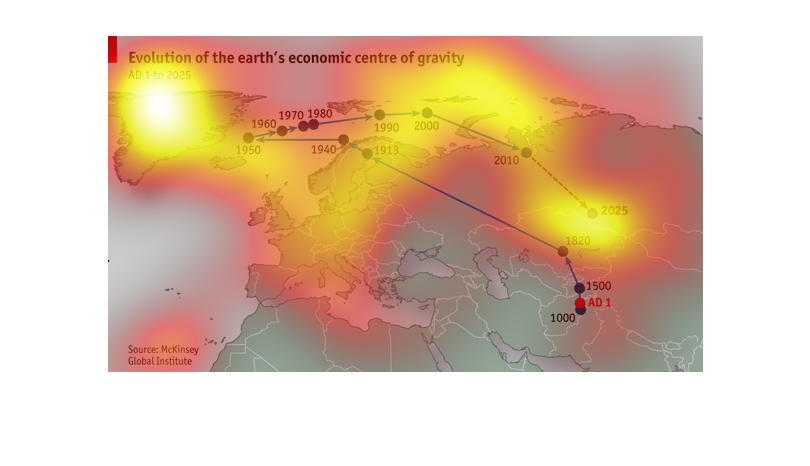
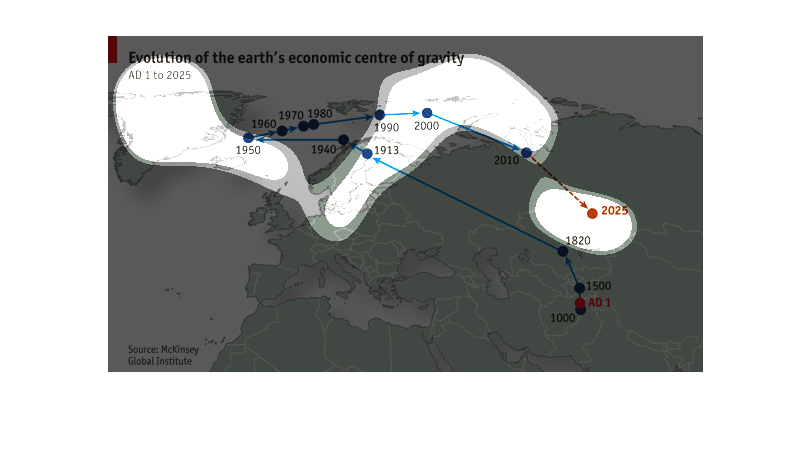
This picture shows how the economic center has shifted from 1000AD to 2025. It is slowly returning
to the same place that it started in 1000. This takes place in Europe all the way to Greenland
This is a map that shows the changes in the changes of the economic economic center of gravity
for the earth. This is a view of western Europe and North America.
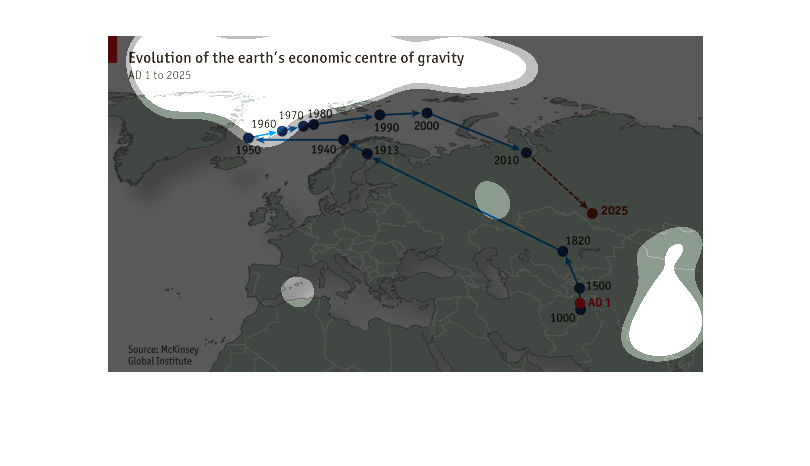
This graph shows the evolution over the years AD 1- 2025 of the world's economic center of
gravity on a map that shows the different countries in the world.
This is a European map depicting the evolution of the earth's economic center of gravity from
the years AD 1 and forecast through 2025 according to the McKinsey Global Institute.
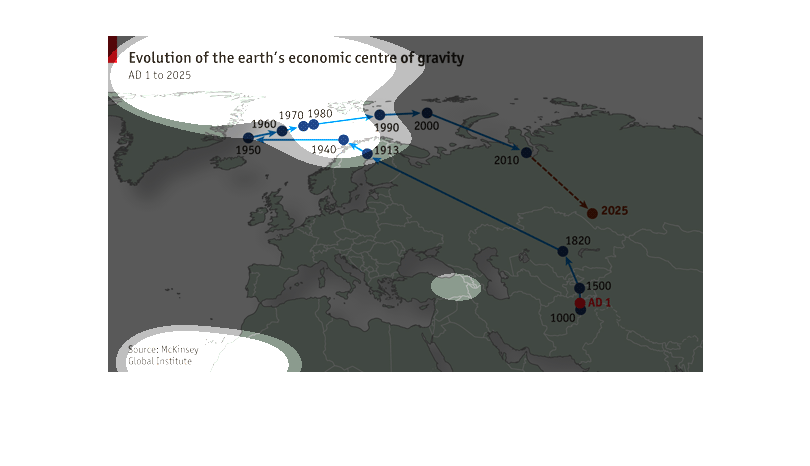
This is a chart showing the "Evolution of the earths' economic center of gravity."  It starts
at 1000 AD, and goes to 2025 showing it going back to the east north of the start.
This image shows how the Earth's economic center of gravity has changed from the year 1AD
to 2025 (apparently they read the future). The economic center started in the middle east/asia
and remained there until the 1800's. Suddenly, by the 1900's it had moved far northwest to
northern Europe, and then lastly moved to toward Greenland and back to Asia (north). It is
projected to be very close to where it was in 1820 again in 2025.
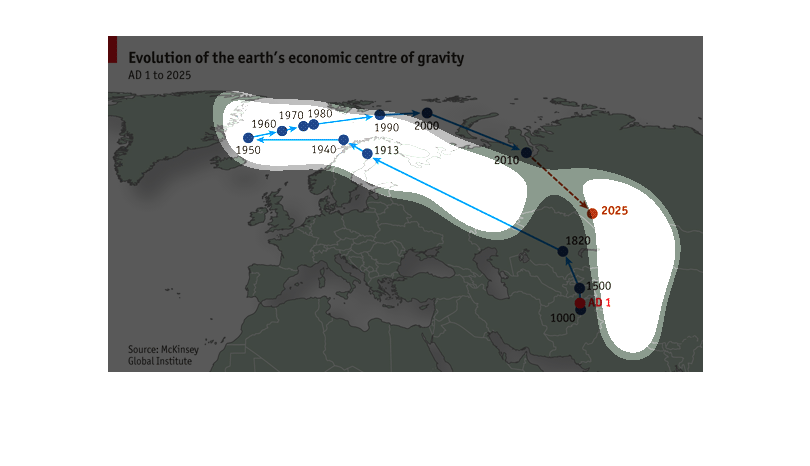
This chart describes evolution of the earth's economic center of gravity from the year AD
1 through 2025. Active years include 1950, 1960, 1970, and 1980.
This chart shows the evolution of the earth's economic centre of gravity from a time period
of AD 1 to 2025. The area of reference is part of North America and Europe. According to information
shown on the map, it looks like the economic centre began in Europe in AD 1 and by the year
1950 had shifted to the North American continent. Following 1950, the centre shifted back
to Europe, where it is predicted that by the year 2025, the centre will have shifted close
to where it began. The shift appears to be gradual except between the the years of 1-1500,
when it took a very long time to shift a short distance and between the years of 2000-2025
when it is expected to take a shorter period of time to move a much larger distance.
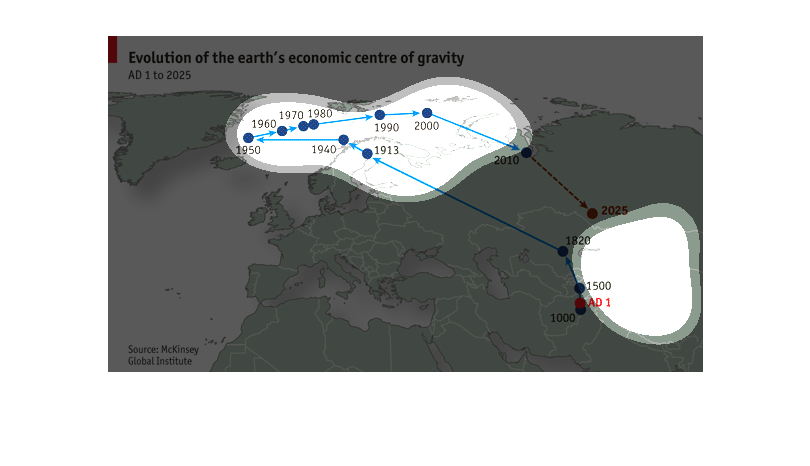
This chart is a map of Europe. It shows the Evolution of the Earth's economic centre of gravity.
It is very interesting, and I learned quite a bit from it.
This graphs shows a representation of where the economic shifts have happened throughout history
in the world. Most has occurred in the European area; while the earlier time periods have
been in the Middle Eastern countries.
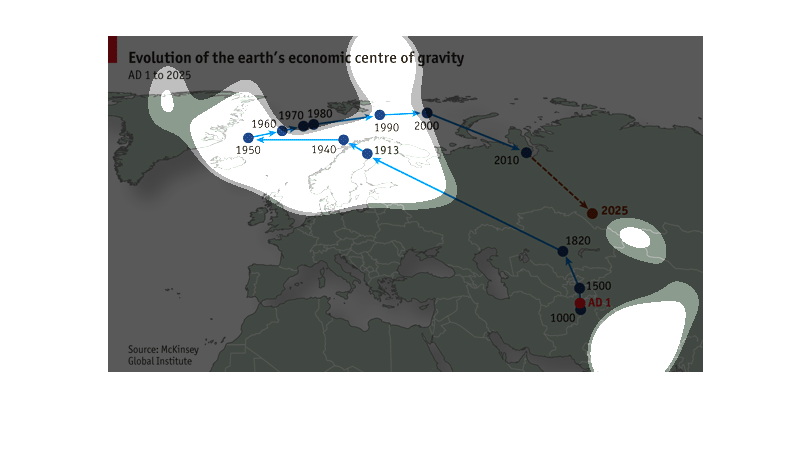
This map shows the evolution of the earth's economic center of gravity from AD 1 to 2025.
 Based on the information displayed on the map it looks like the centre of gravity is returning
back to the region from AD 1.
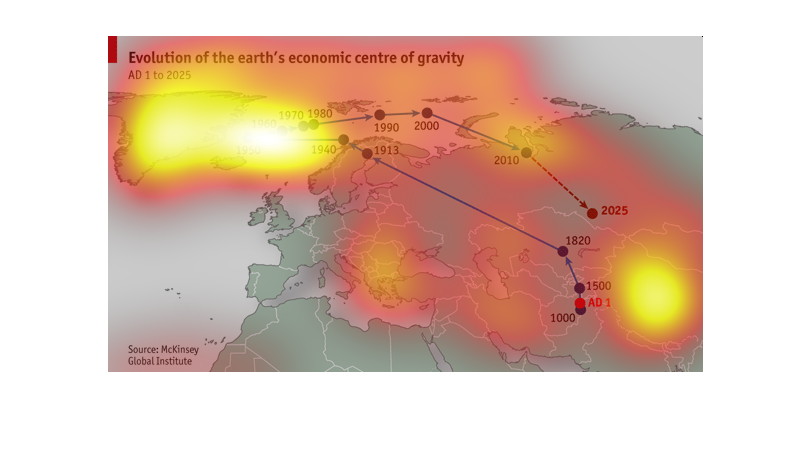
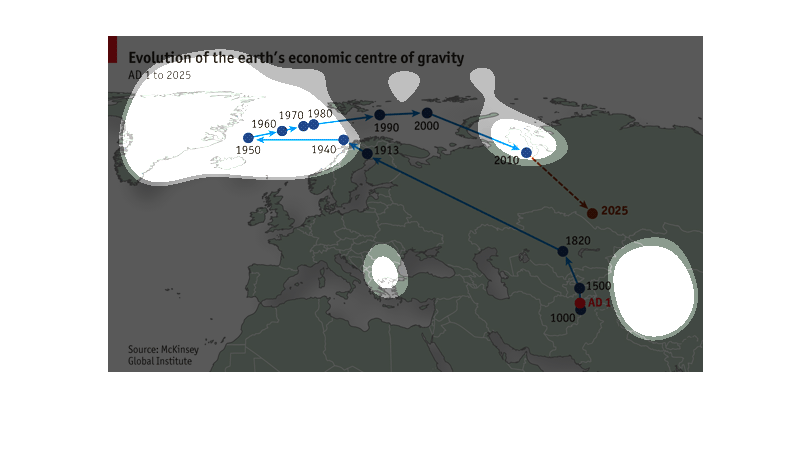
This is a map chart with curved lines that shows a flow of measurement against time and within
the globe. It is measuring the earth economic centre of gravity. It begins in 1500AD and is
projected to the year 2025.
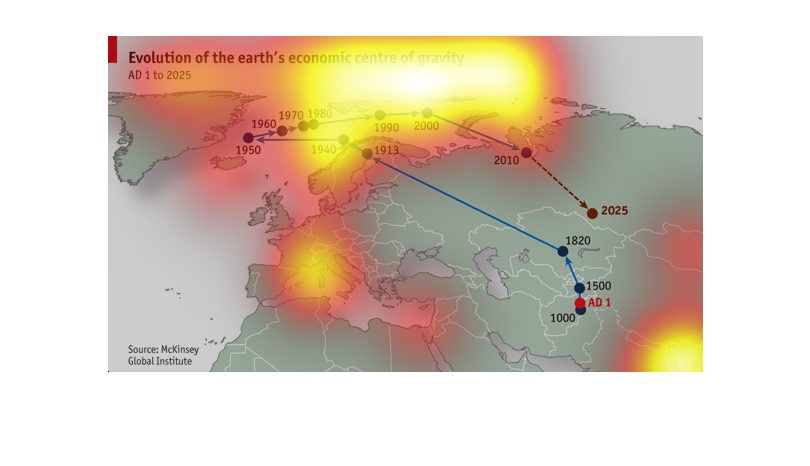
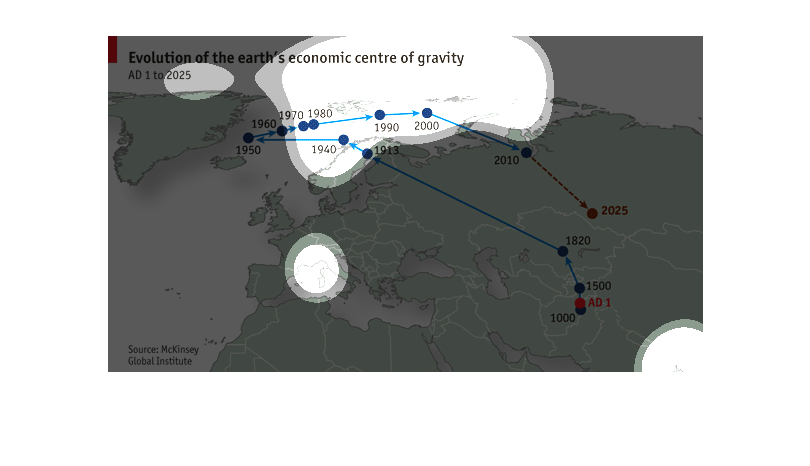
This graph shows "Evolution of the Earth's economic centre of gravity. AD 1 to 2025.". In
this graph it shows the world map with line depicting the evolution. On the lines it has the
year that it corresponds with.