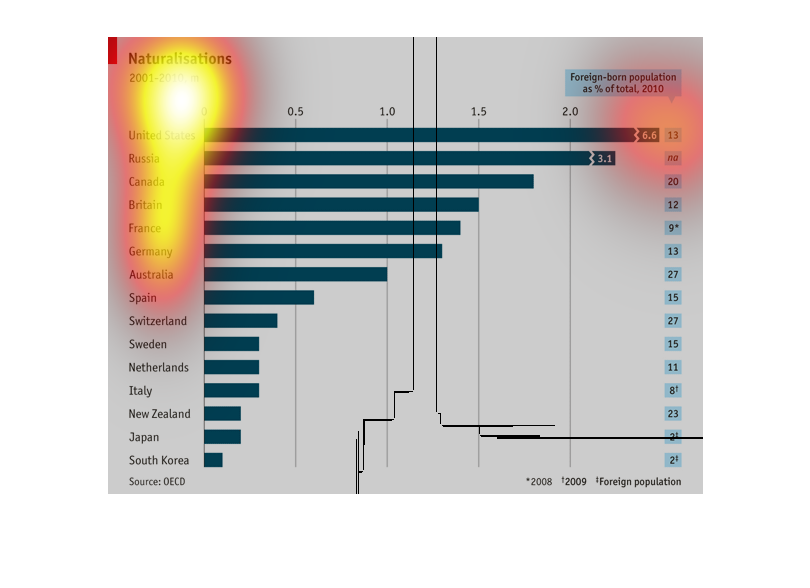
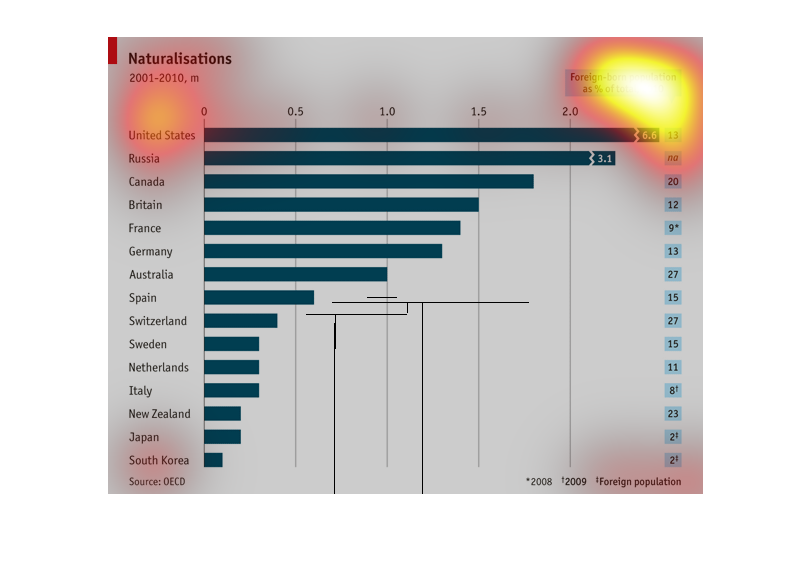
this chart shows the number of people who are natural born residents of the country they are
from ie not immigrants. This is represented by bars that have varying length based upon the
number of the population of that country that are natural citizens
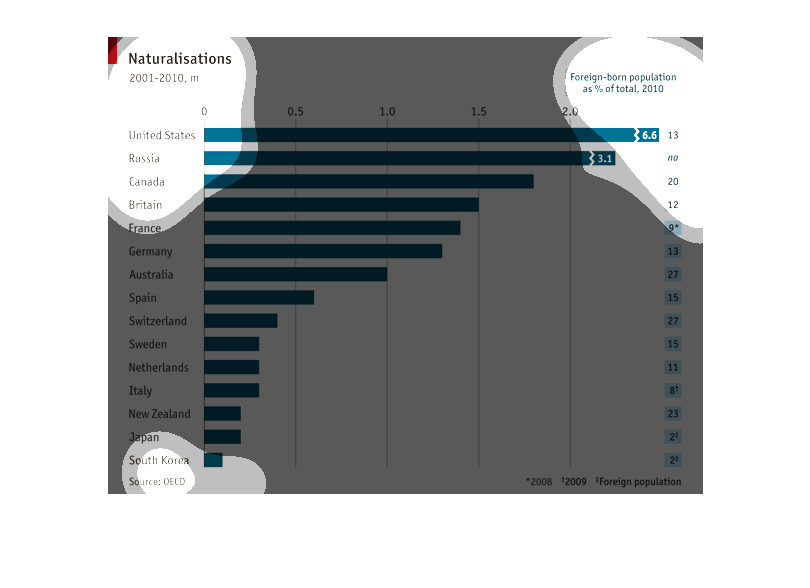
This chat shows the naturalizations for foreign born population from 2001 to 2010. South Korea
being the lowest population and the United States being the highest population. While Australia
fall in the middle for foreign born population.
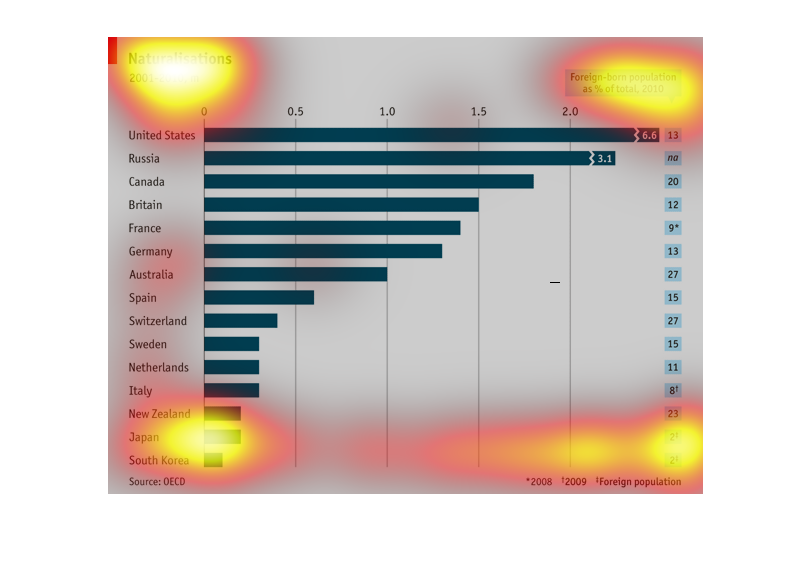
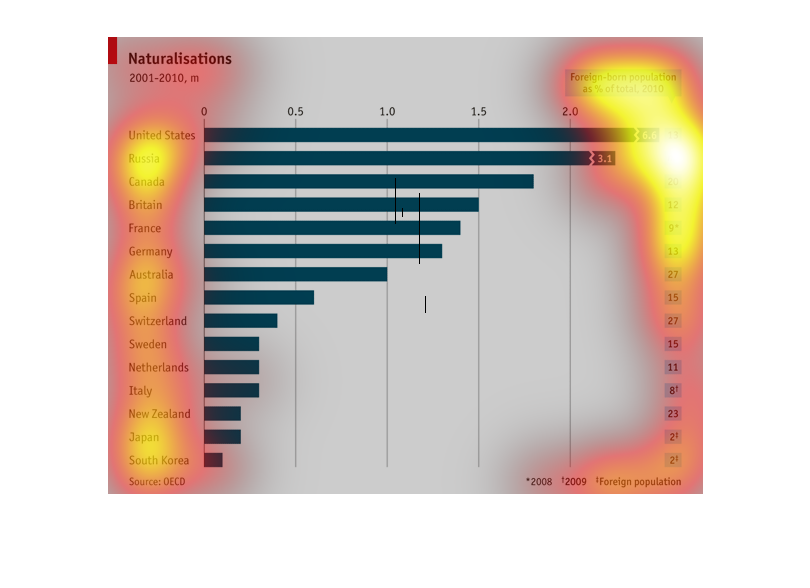
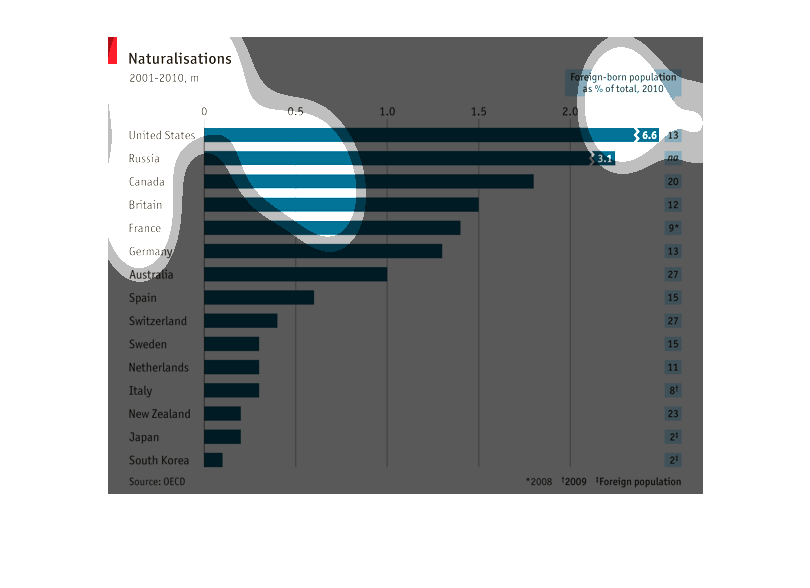
This image shows or depicts in statistical bar graph format the countries that have Naturalisations
from the years 2001 to 2010. The countries that top the list is United States, Russia, and
Canada.
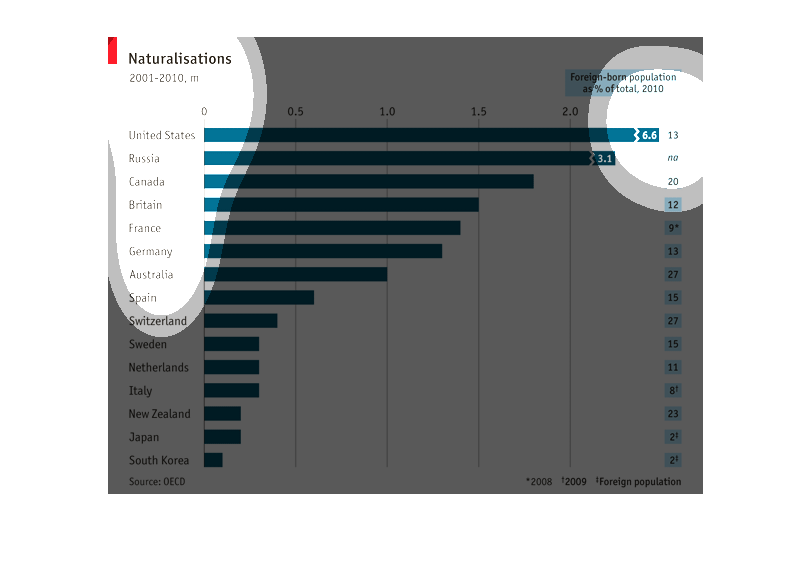
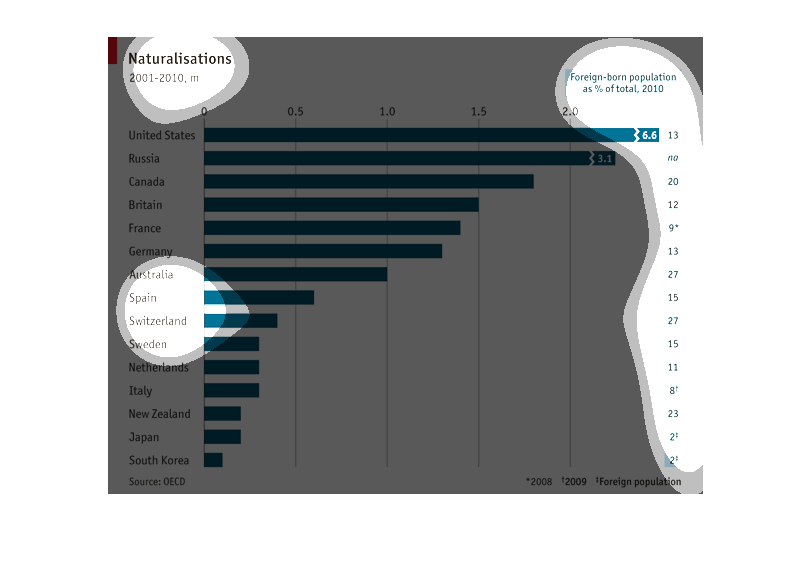
number of foreign born citizens that have been naturalised in different countries around the
world, between 2001 and 2010, foreign born populations in percentages
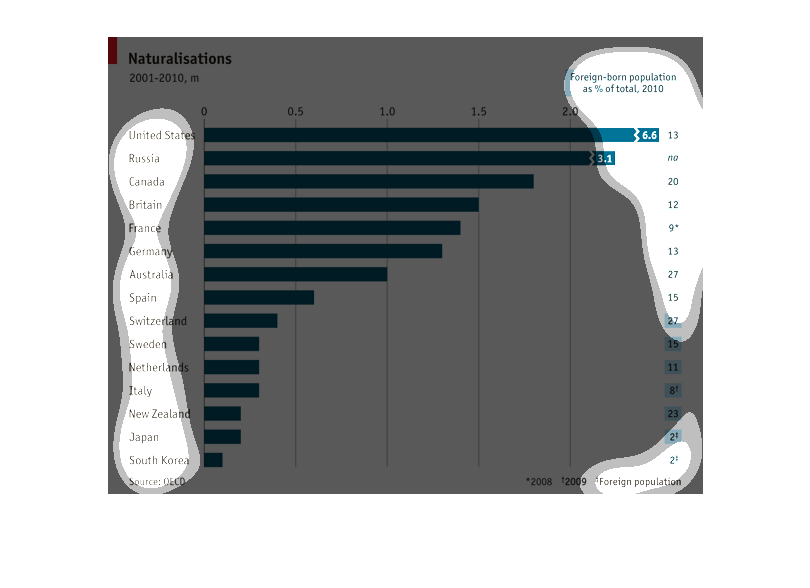
This is a graph of naturlization number in several different countries from the years 2001
to 2010. The highest number of foreign born population naturalized in any one country being
the United States at 6.6 percent.
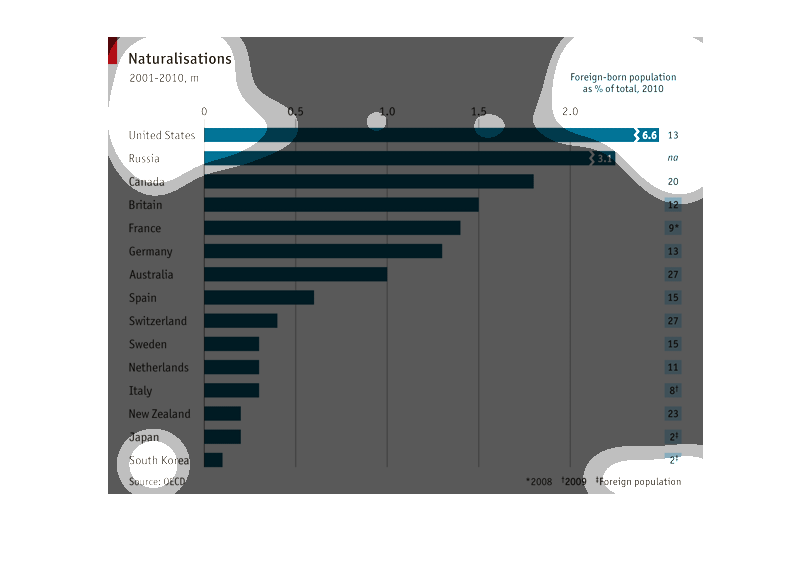
This is a chart of naturalization from 2001 to 2010. It shows the US on the top with 6.6 million
and 13% of the population and on the bottom South Korea on the bottom with less than half
a million and less than 2%.
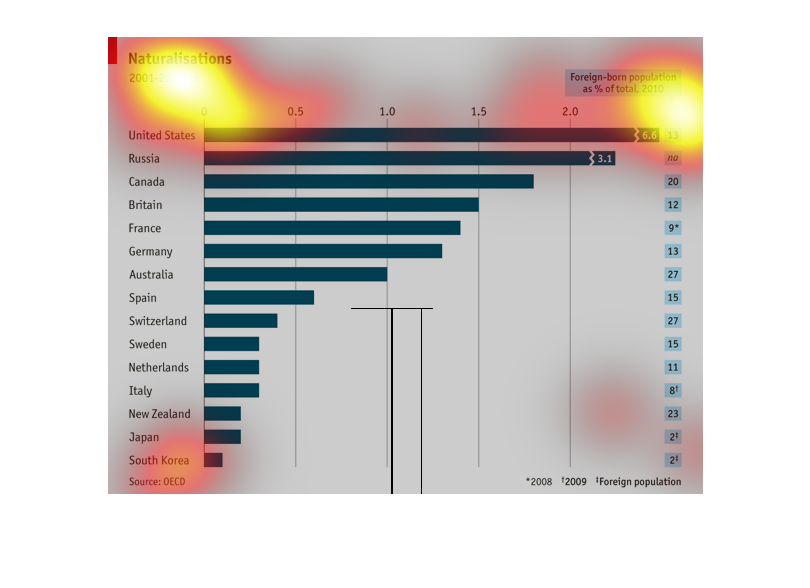
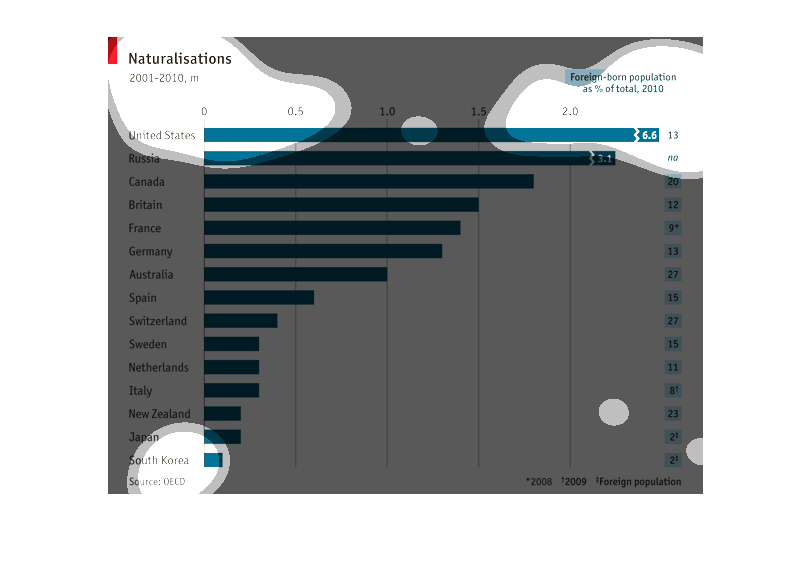
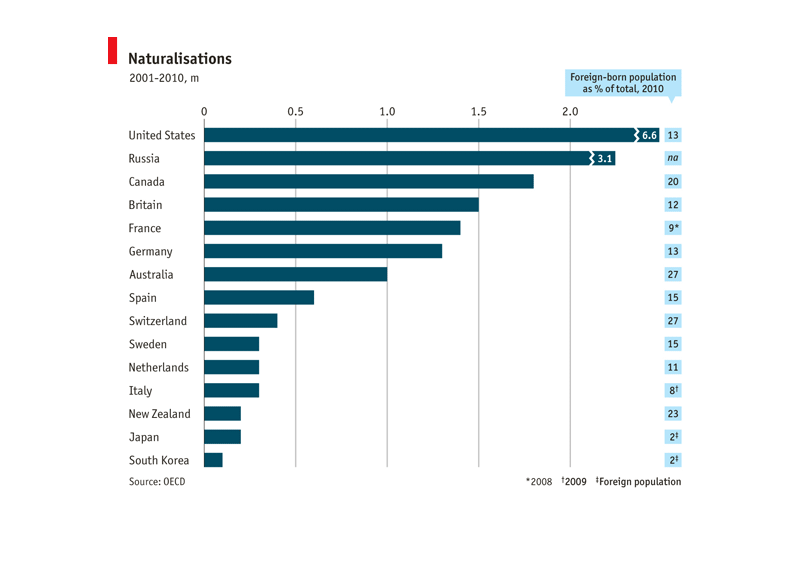
This graph displays the number of naturalizations per country and the percentage of the population
that is foreign born. Australia and Switzerland lead with twenty seven percent of their populations
being foreign born.
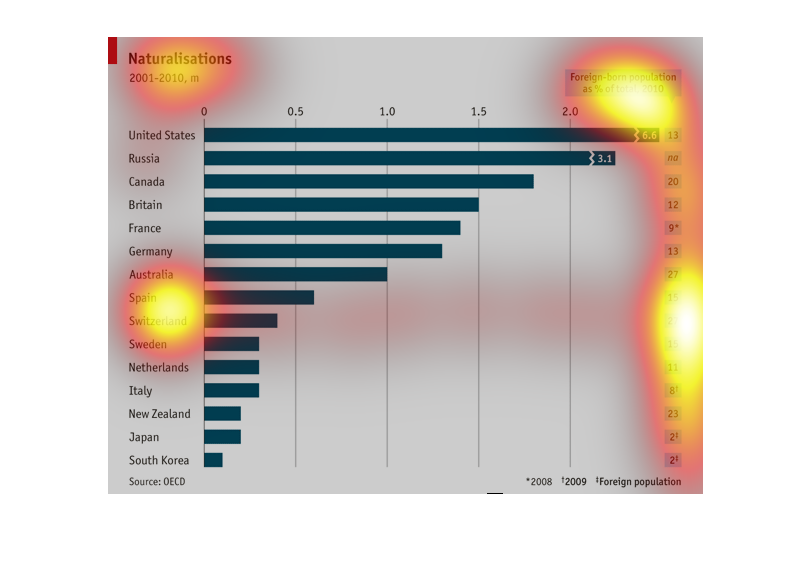
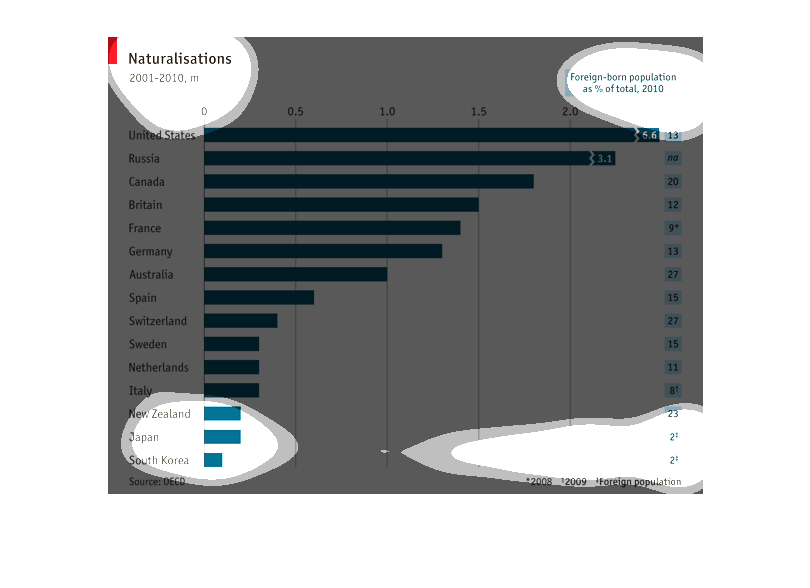
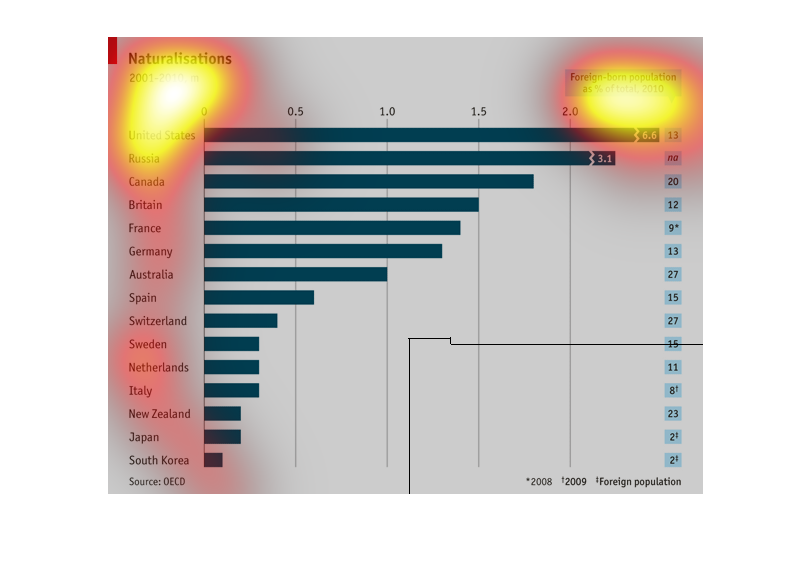
This graph depicts the number of naturalizations which have been granted from 2001-2010 for
various countries.  For each country, the percentage of foreign born is also tabulated.
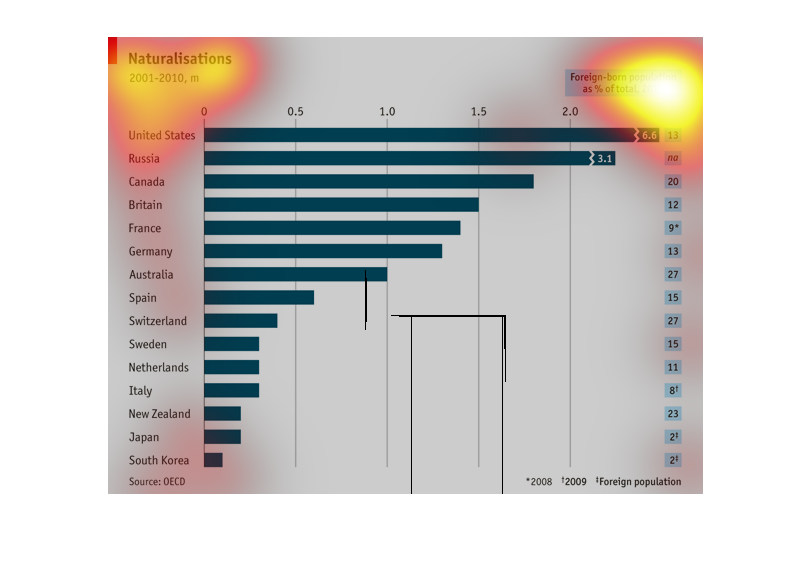
Naturalisations from the years 2001 to the year 2010. This is a graph of the amount of naturalisations
per country. United states and russia seem to have the highest number
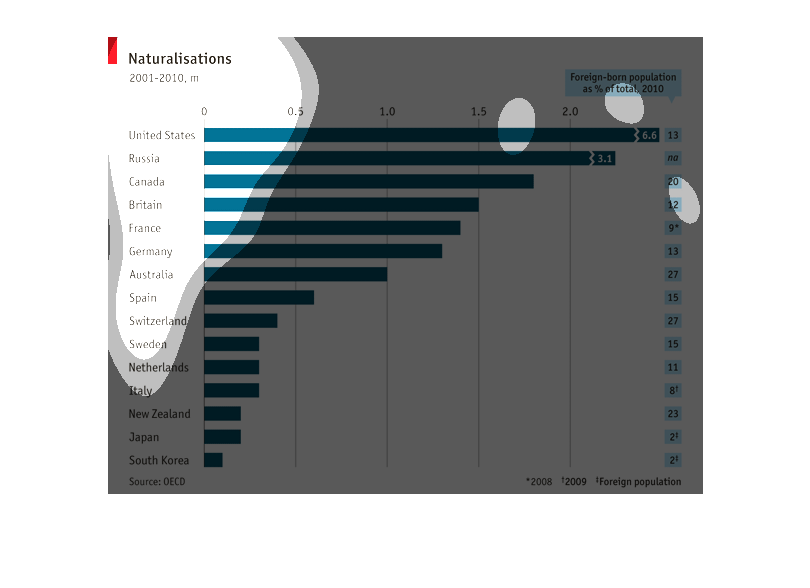
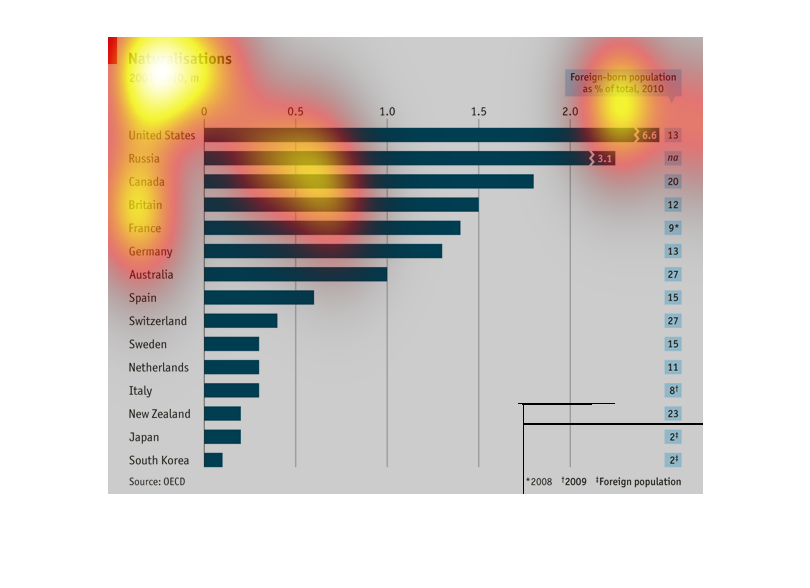
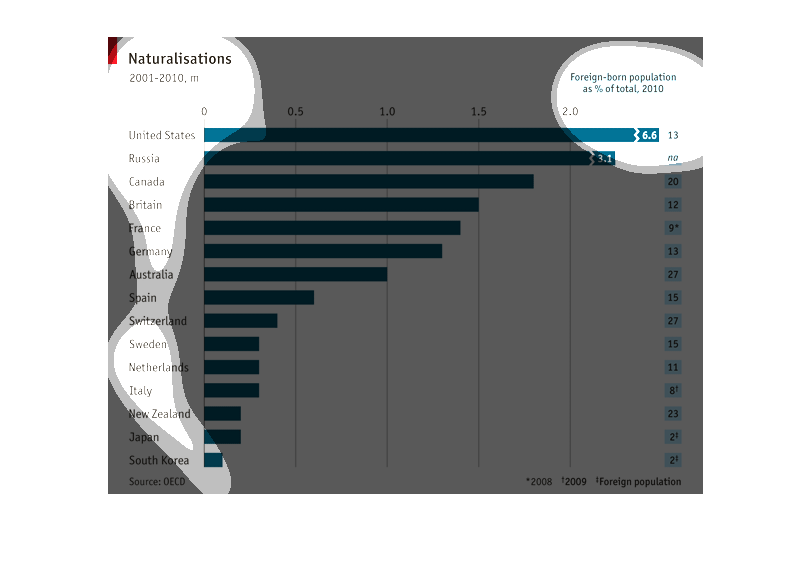
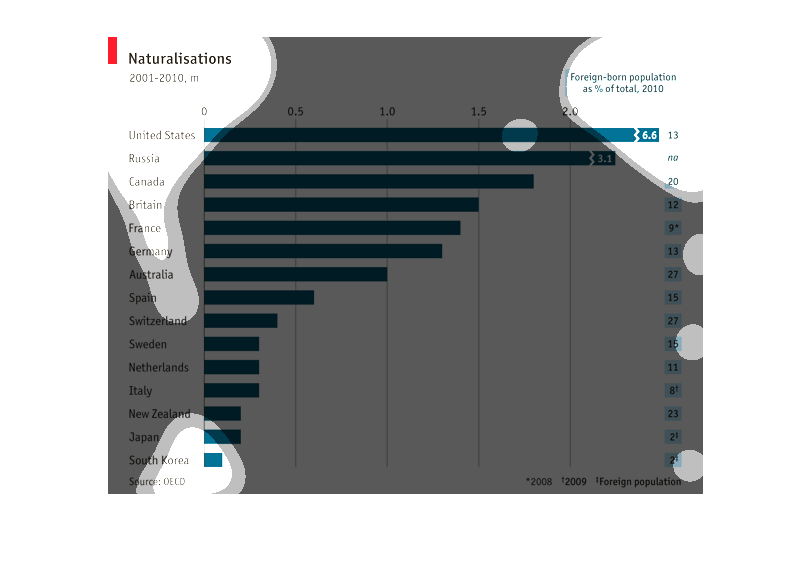
This graph shows "Natrualisations. 2001-2010, m.". Along the left side of the graph in a column
lists countries from the United States to South Korea. Corresponding their number value with
the blue bar.
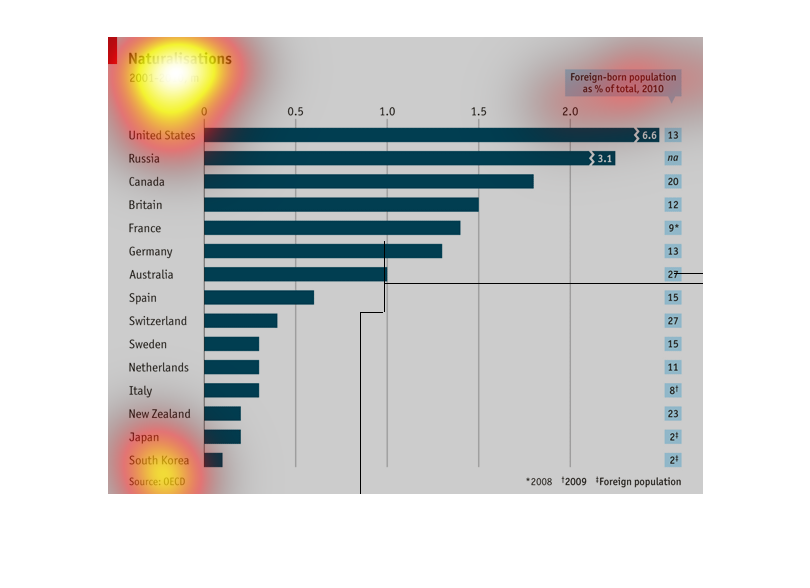
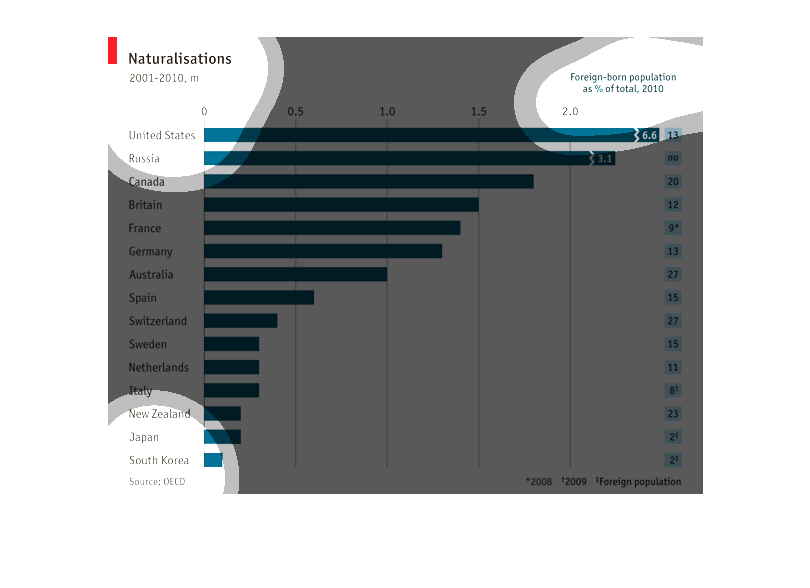
This graph shows the top countries with the largest naturalisations. According to the chart,
the United States has the highest number, with Russia and Canada following.
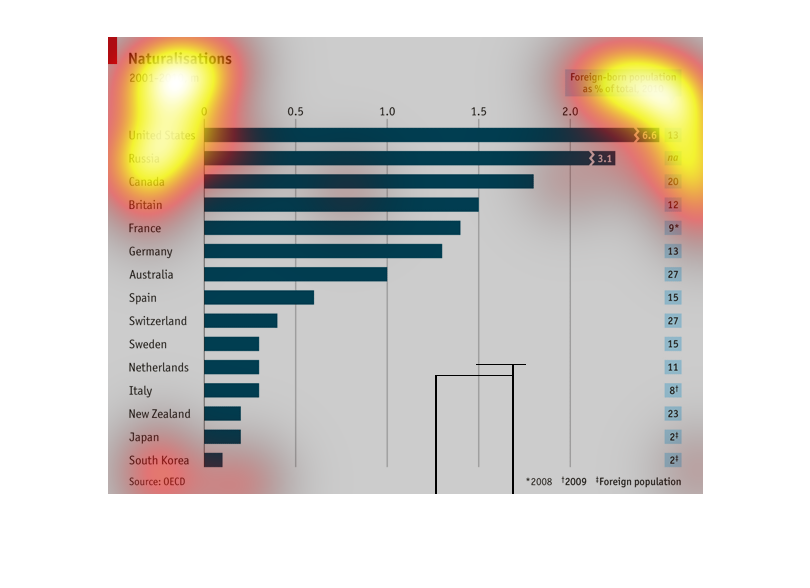
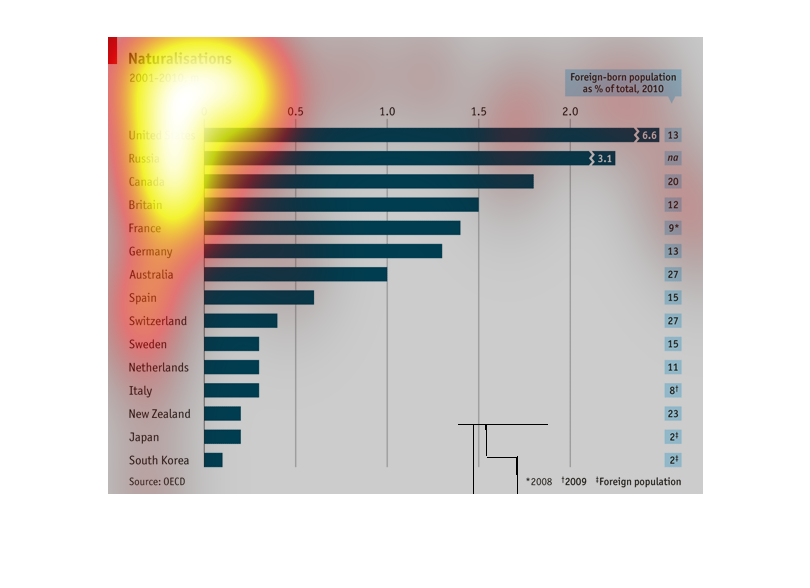
Though the United States has a large population it has a low percentage of foreign born population.
 Australia and New Zealand have smaller populations but higher percentage of foreign born
individuals.