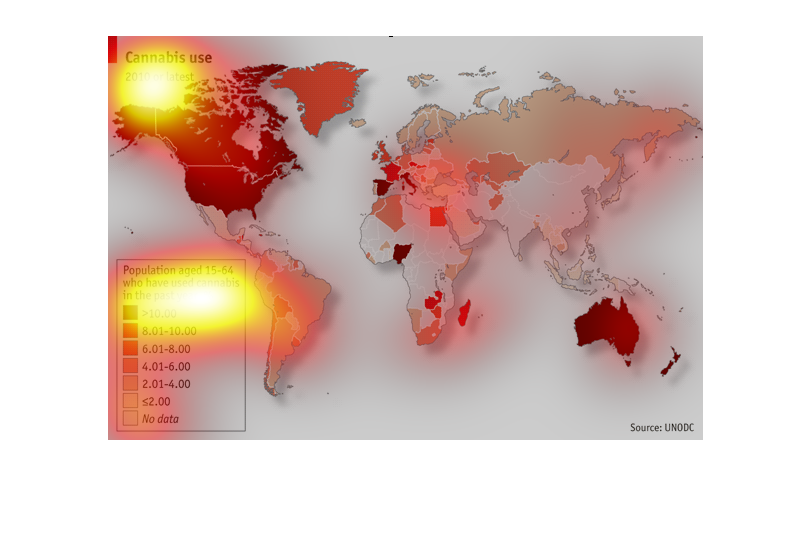
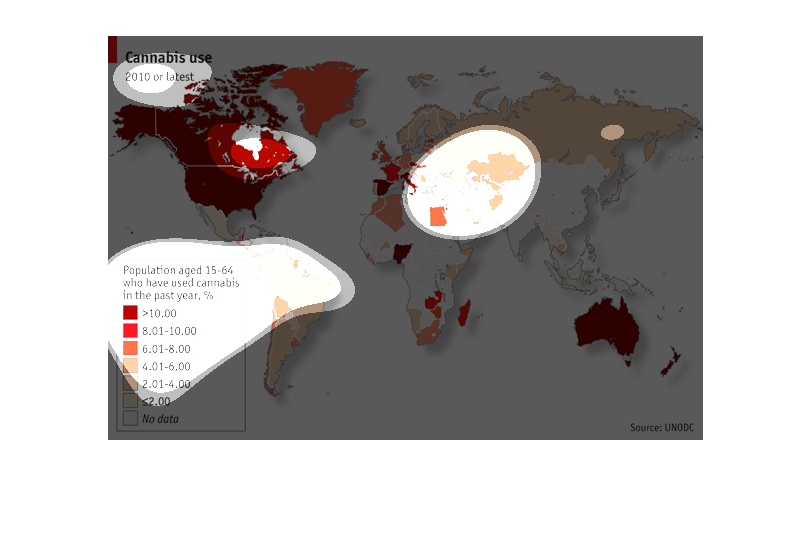
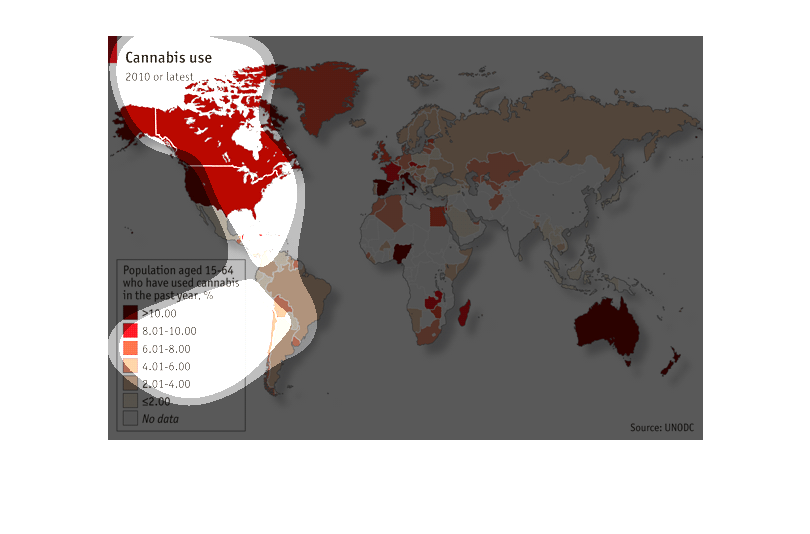
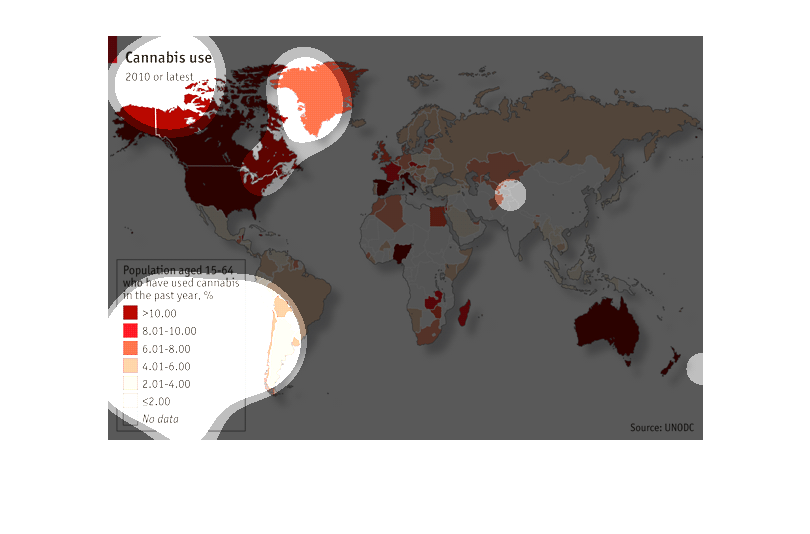
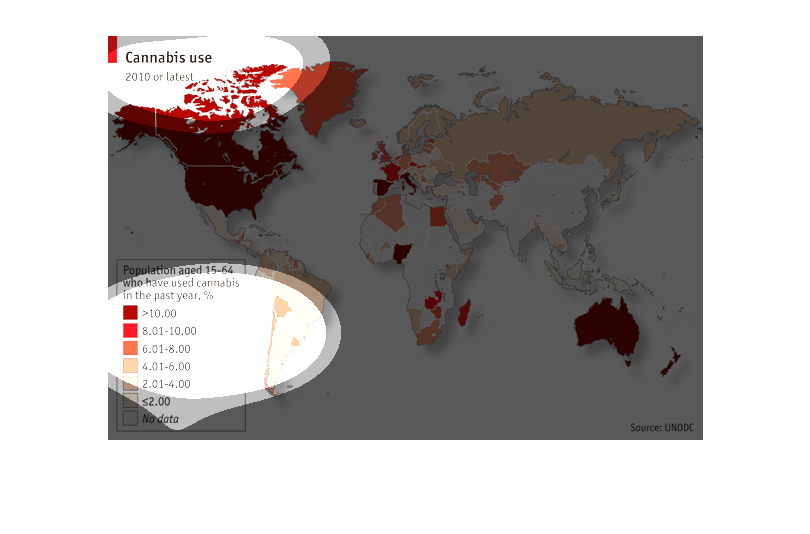
This picture shows the usage of cannabis on a global scale. It indicates usage by using different
colors. The darker the color, the heavier the usage of cannabis in that region.
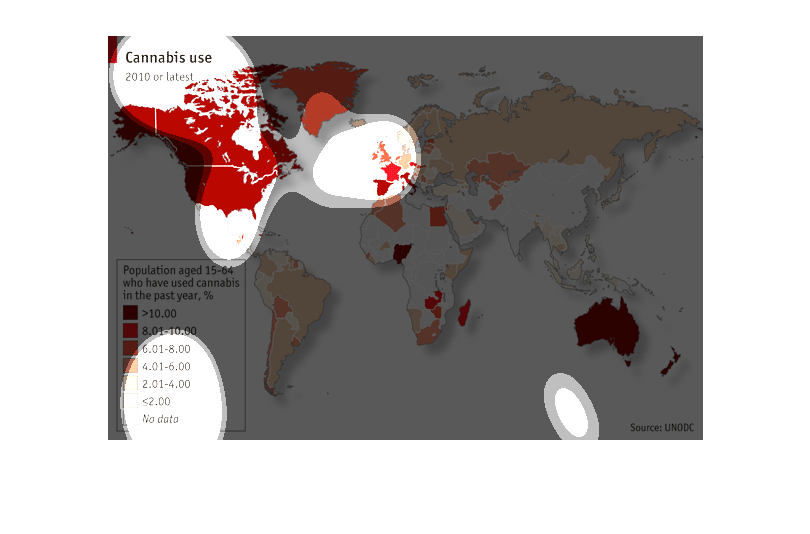
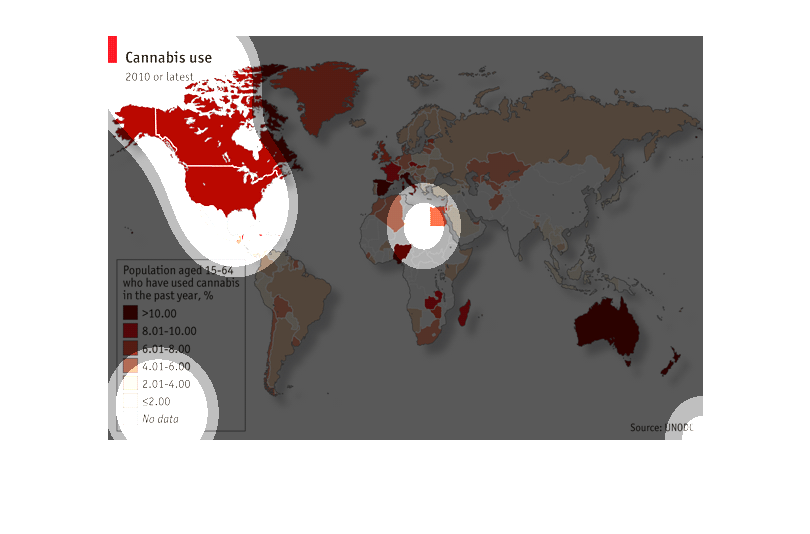
THIS MAP SHOWS GLOBAL CANNABIS USE BY COUNTRY. COUNTRIES COLORED IN DARKER RED HAVE A HIGHER
PER CAPITA CANNABIS USE IN THE PAST YEAR COMPARED TO COUNTRIES IN LIGHTER RED, WHICH HAVE
A LOWER USE.
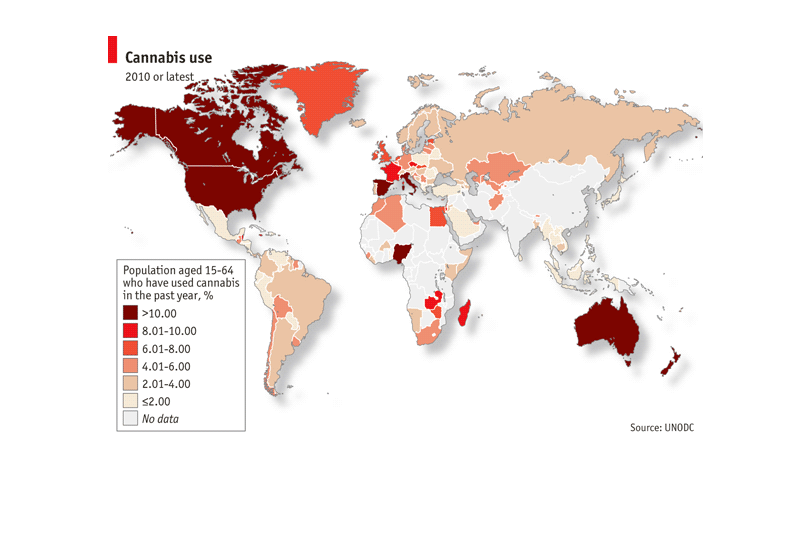
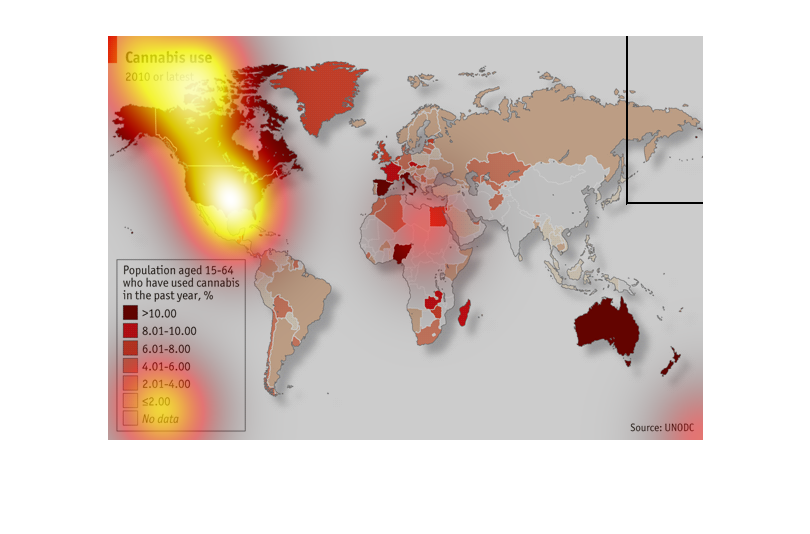
This is a world map showing the popularity of cannabis use.  The darker red the area, the
higher percentage of instances of cannabis use.  The United States and Canada, along with
Australia, are some of the larger dark red areas. Spain and Italy were also dark red.  It's
worth noting that The Netherlands did not receive a high score.  In addition, I'm going to
guess that it's hard to calculate cannabis use in a country like Guinea, West Africa because
it's harder to poll people in rural third world countries, and if cannabis is highly illegal,
people will not report their use honestly.  So while this map does say that it reports cannabis
use, I would need to examine its data collection process before I accept it as factual.
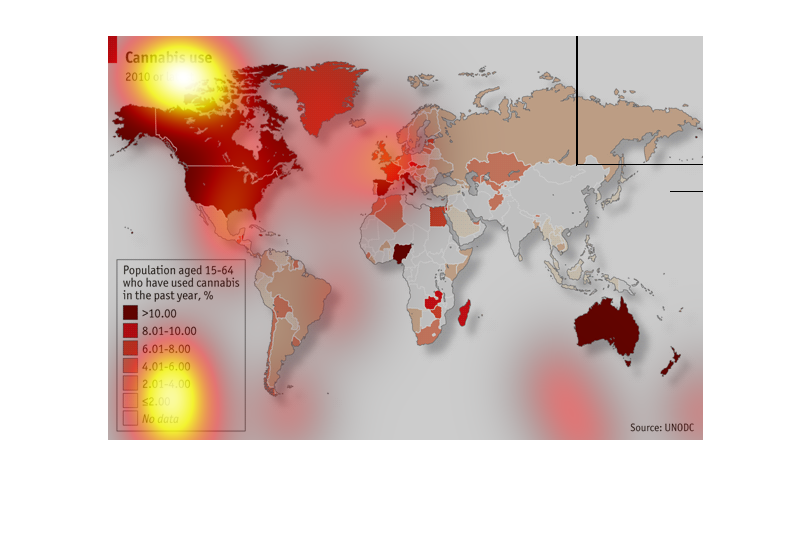
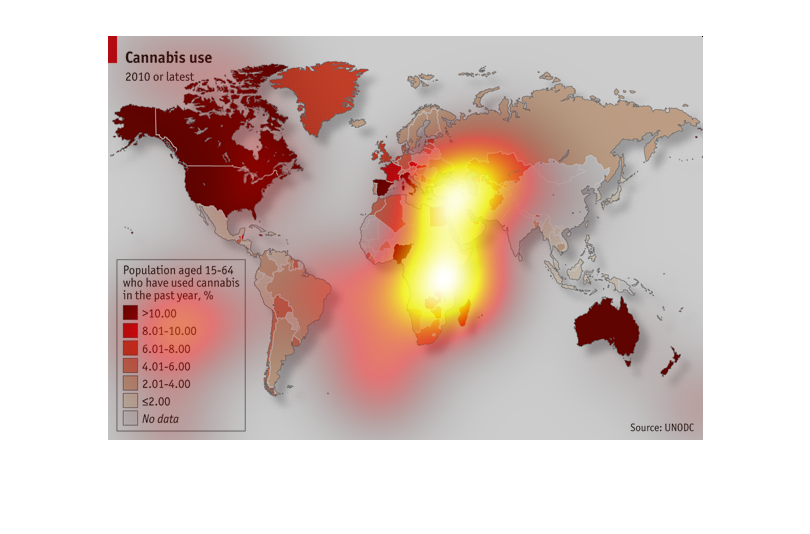
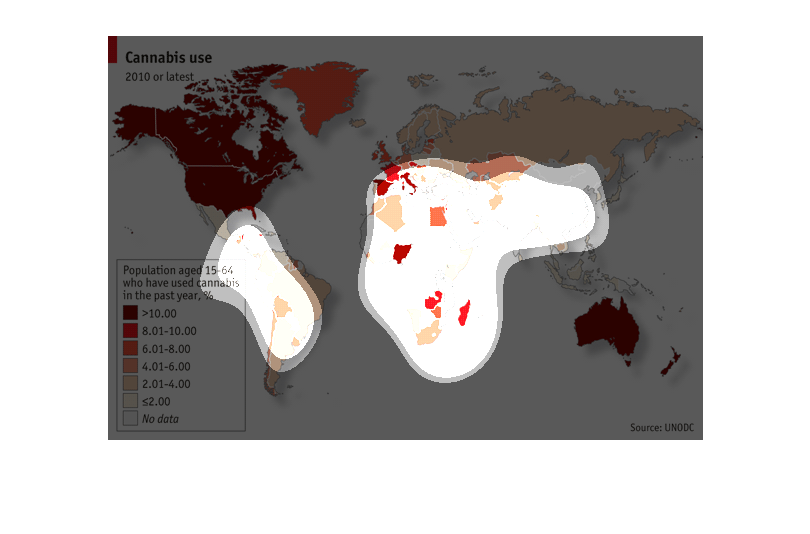
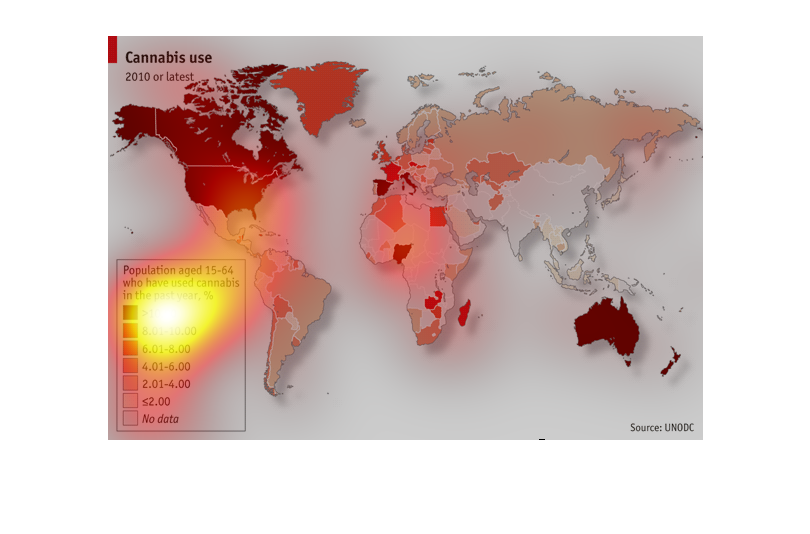
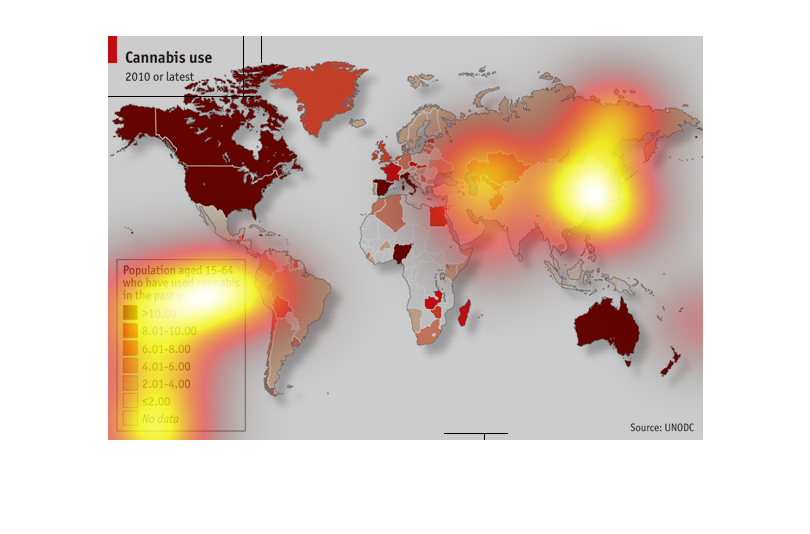
This map of the entire globe displays the percentage of the population that has used cannabis
in the past year, based on data collected from 2010 or later.
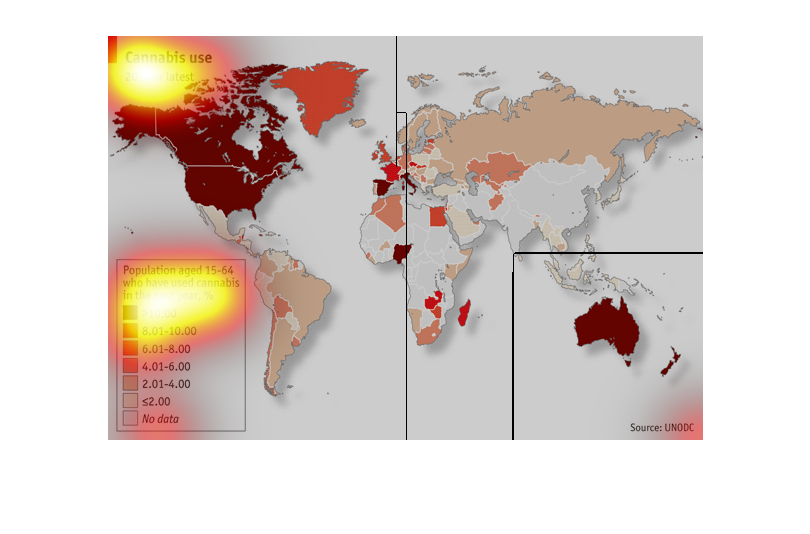
This is a global map of Cannabis usage.  It depicts the  percent of each country's population
that has used cannbis in the past year.  The country's with more than 10% usage are displayed
in dark red, the scale slides down so that country's with less than 2.0% are depicted in a
pale pink.  The United States, Australia, and portions of Western Europe have the most cannabis
use as a percent of population.  South American countries reported usage of less than 5% of
the population.  Usage in Europe and African occurs mostly in the wealthier nations.  Almost
no data is available for Asia.
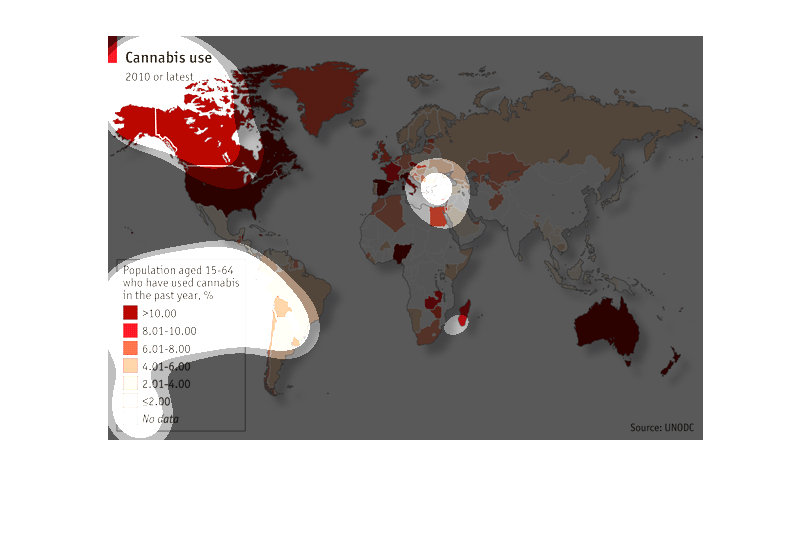
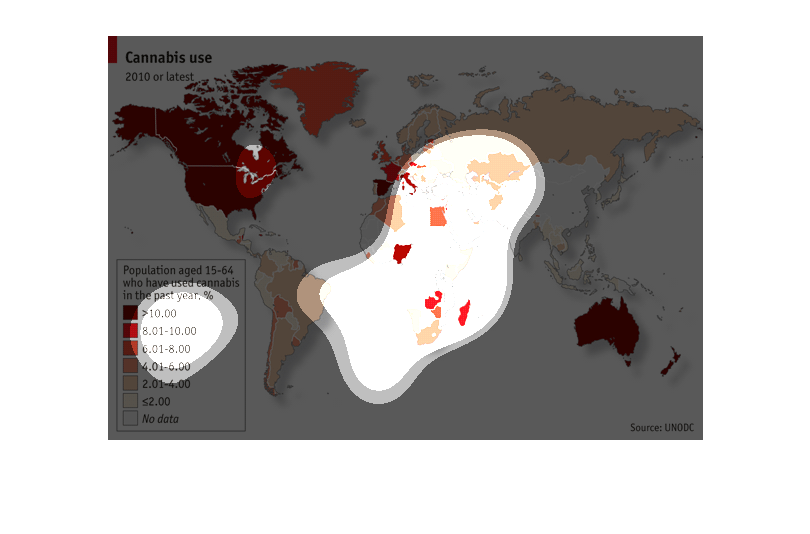
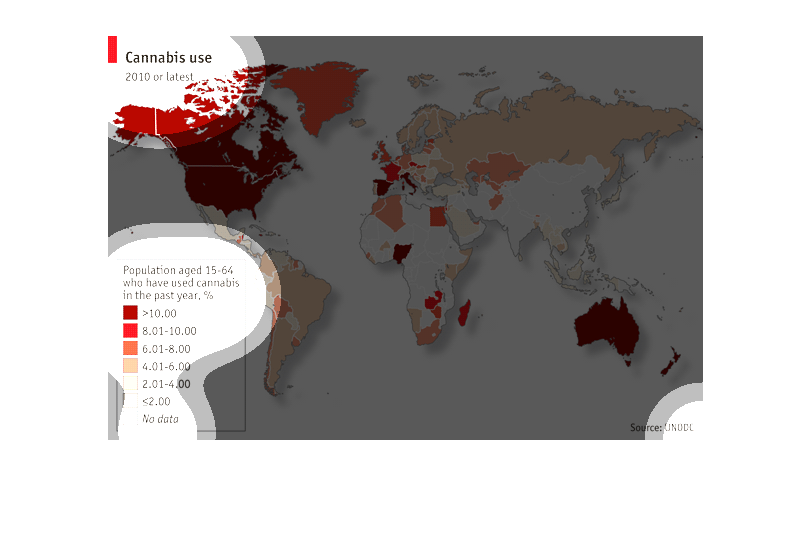
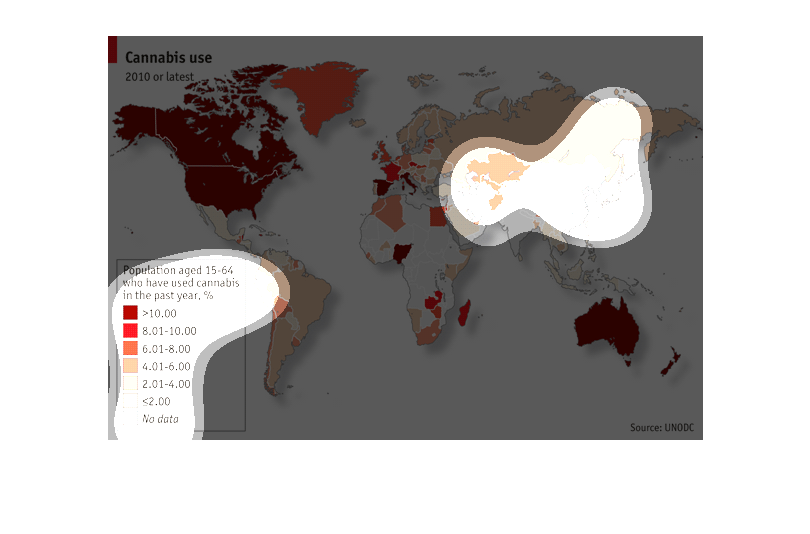
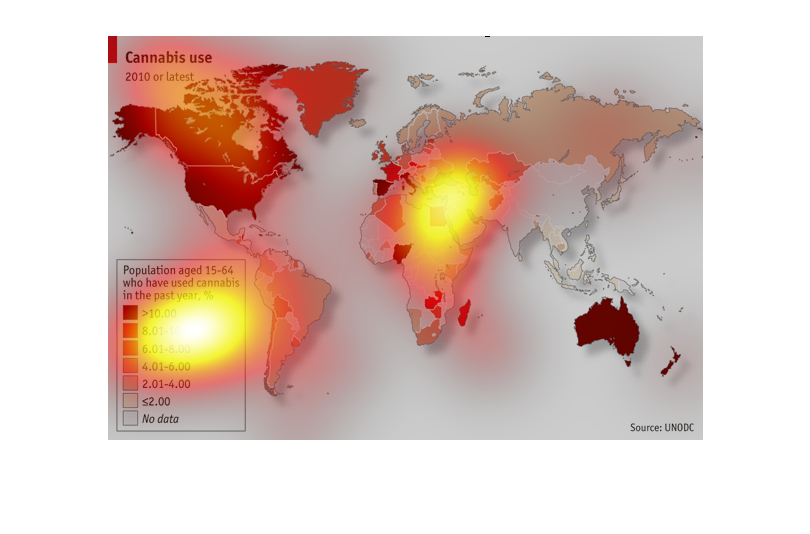
This is a color-coded world map depicting the use of cannabis as of latest data available
in 2010. The regions shown to have the highest occurrence of use are North America and Australia.
Graph describes cannabis use globally. In the year 2010 or later. Most heavy users are United
states, Canada, and Australia. This measures populations between 15 - 64
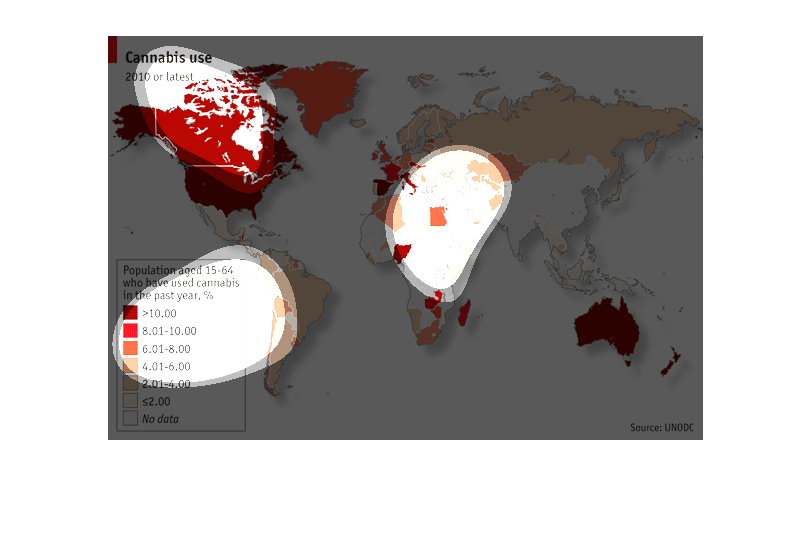
This is a chart showing global cannabis usage by nation. Darker red indicates a higher usage
while the lighter shades indicate less usage. It appears industrialized nations have the highest
usage.
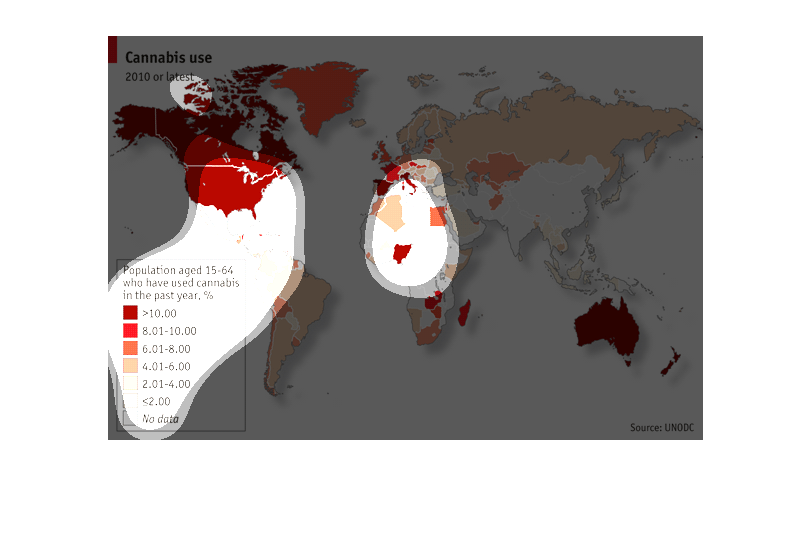
This chart shows the amount of people between fifteen and sixty four that have used cannibis.
It's broken down by country and the darker shades represent higher use.
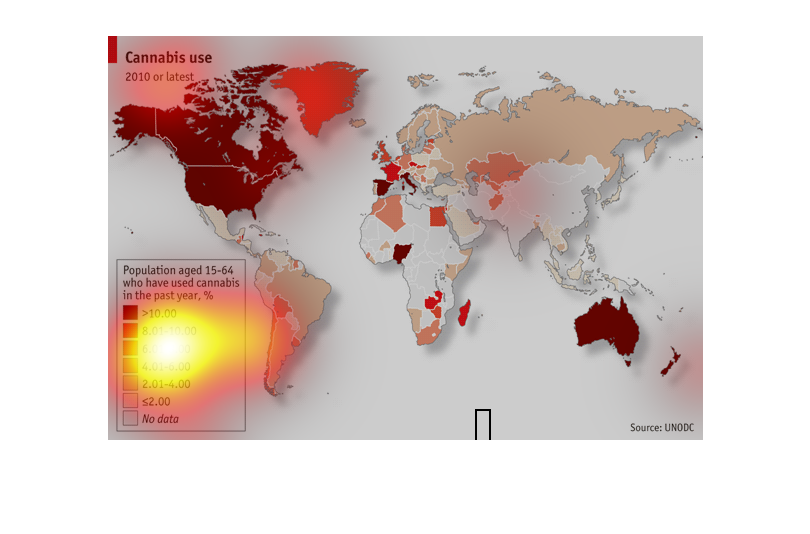
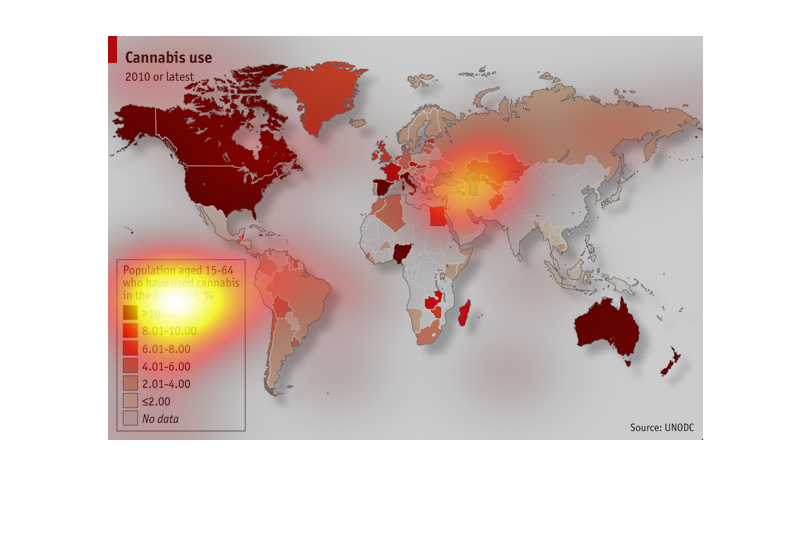
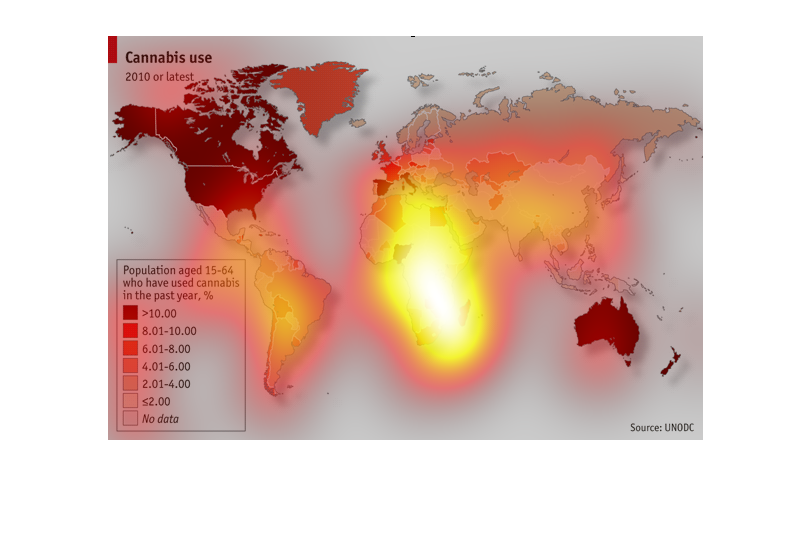
This map shows the number of people that have tried cannabis in each country in the world.
The graph shows that the United States and Australia have the most people that have tried
Cannabis.
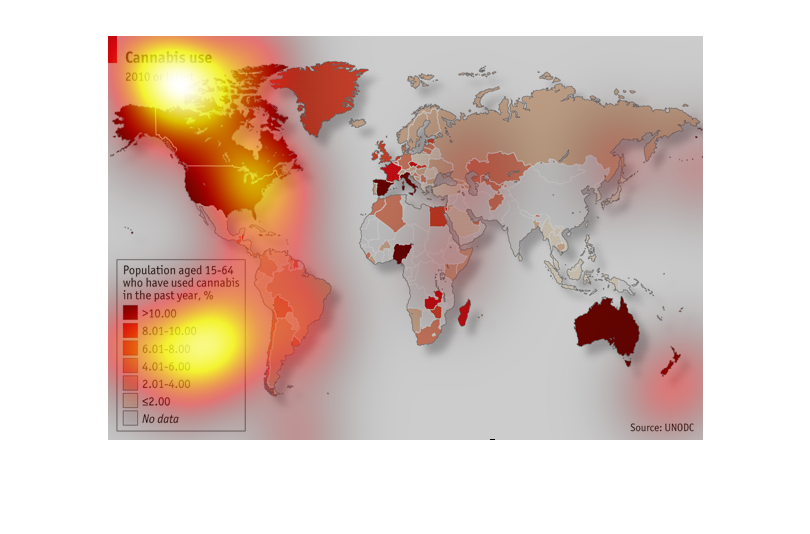
This chart describes cannabis use in 2010 by the population aged 15-64 who have used cannabis
in the past year. Different age groups on the chart are represented by different colors.
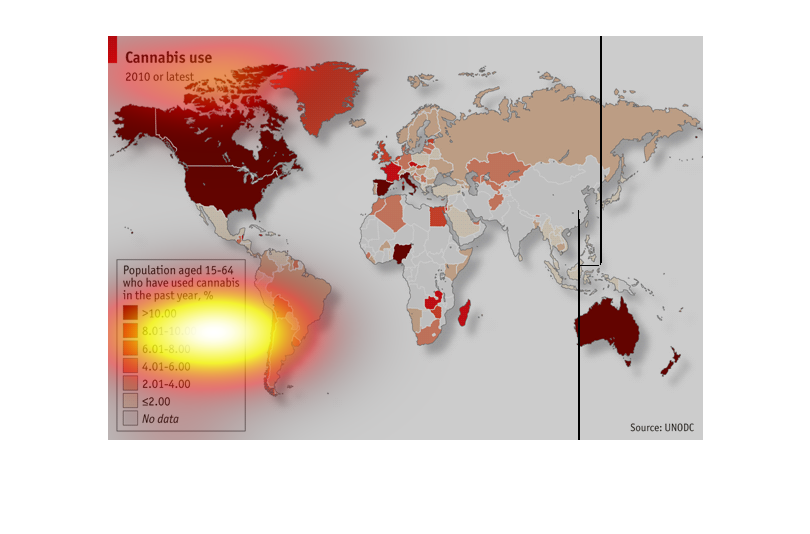
This graph shows the use of Cannbis throughout the world according to each country (population
ages 15-64 who have used Cannibis in the past year).  The United State and Australia along
with Spain and Italy have the highest amount of users in the past 10 years.
This is a map of the world's use of cannabis.  The data focus' its findings on the cannabis
users from a base population of people aged 15-64 who had consumed cannabis in the last year.

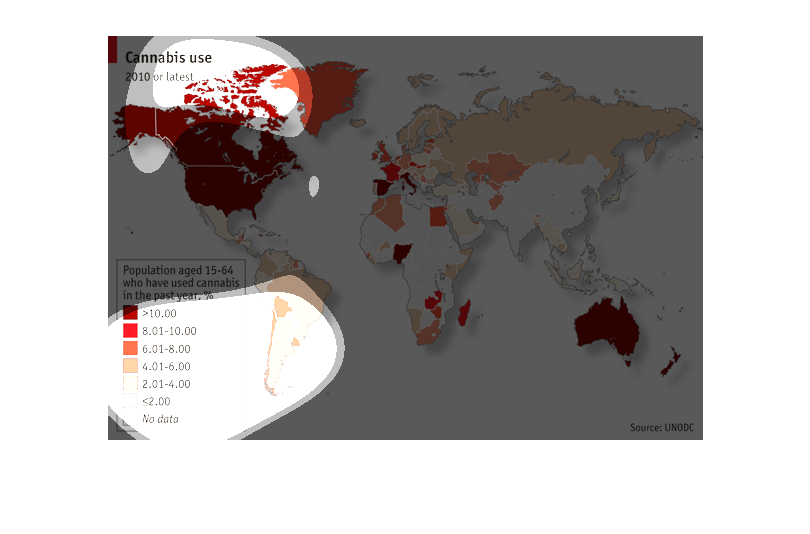
This chart is showing data on cannabis use from the year 2010. More specifically it shows
the percentage if cannabis use in people between the ages of 15-64 who have used cannabis
in the last year. It seems cannabis is most heavily used between those ages in North America,
Canada and Australia. It is barely or not at all used over in Asia and South America.