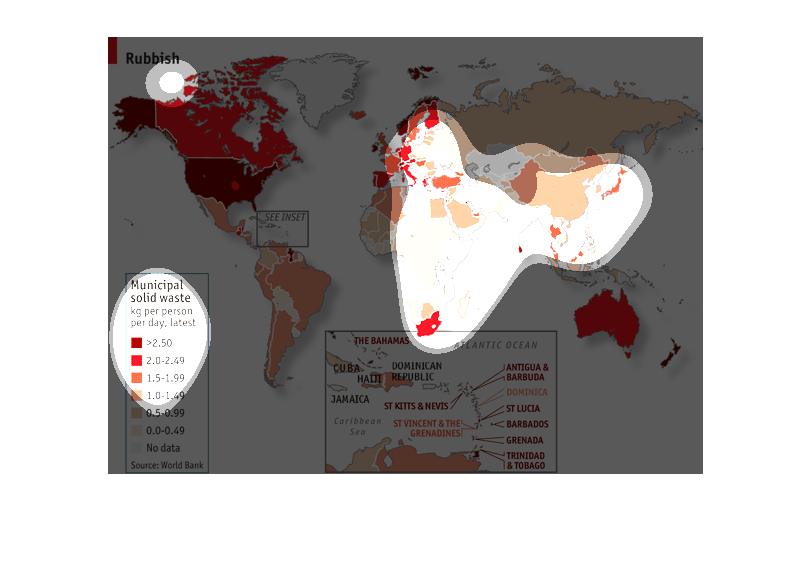
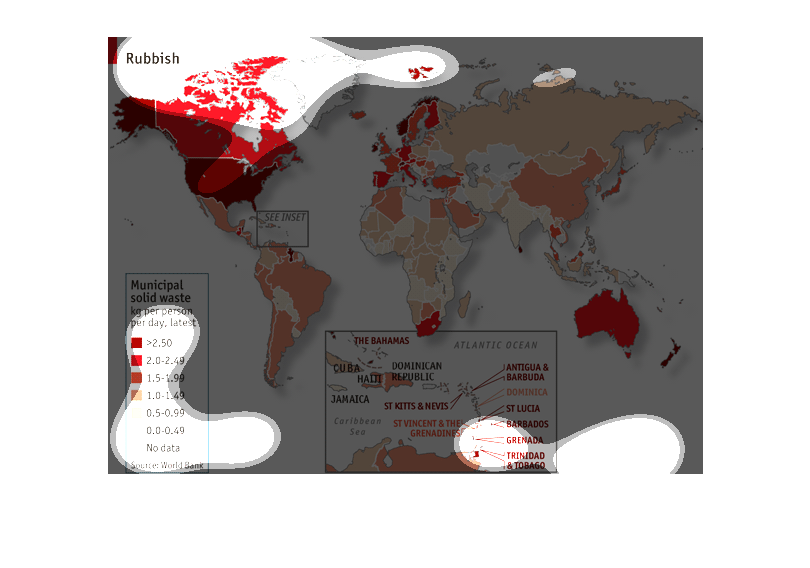
The charts show Municipals solid waste per day. The map is of the world and all of the countries
with colors associated with the chart levels. The colors varied by country and placement in
the world. The chart went as high as >2.50 to as low as 0.0
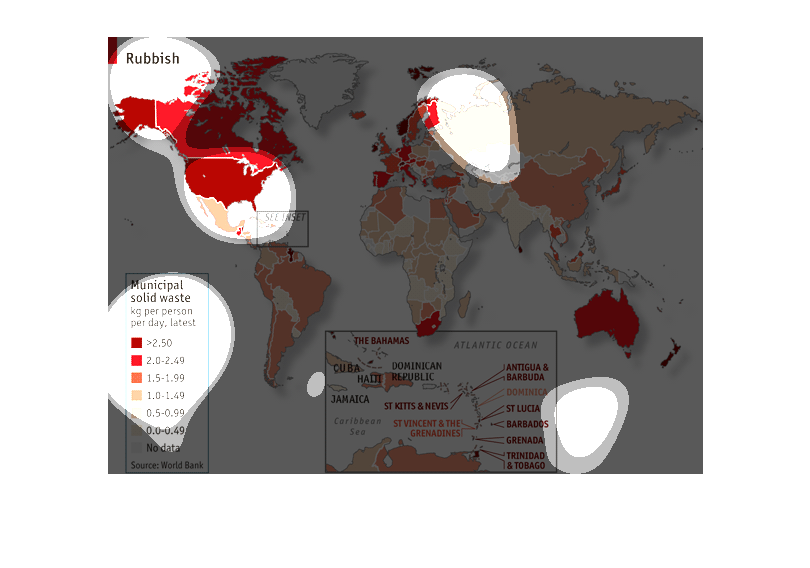
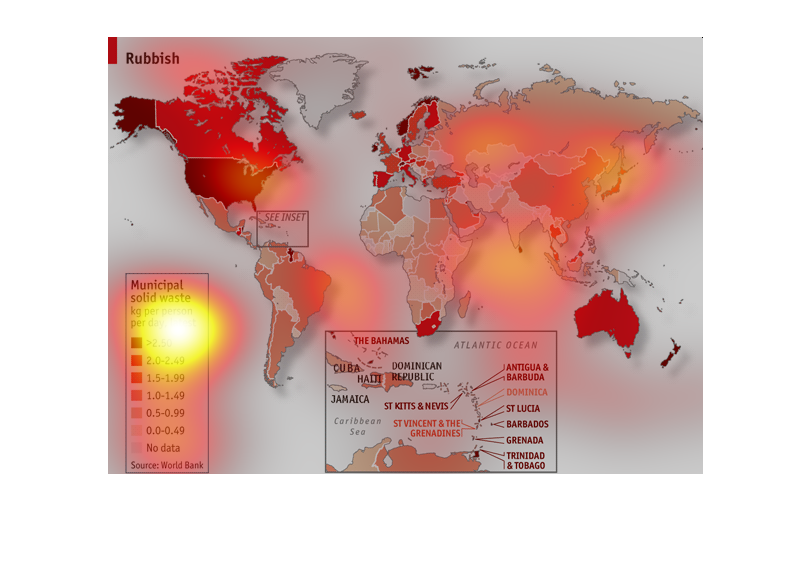
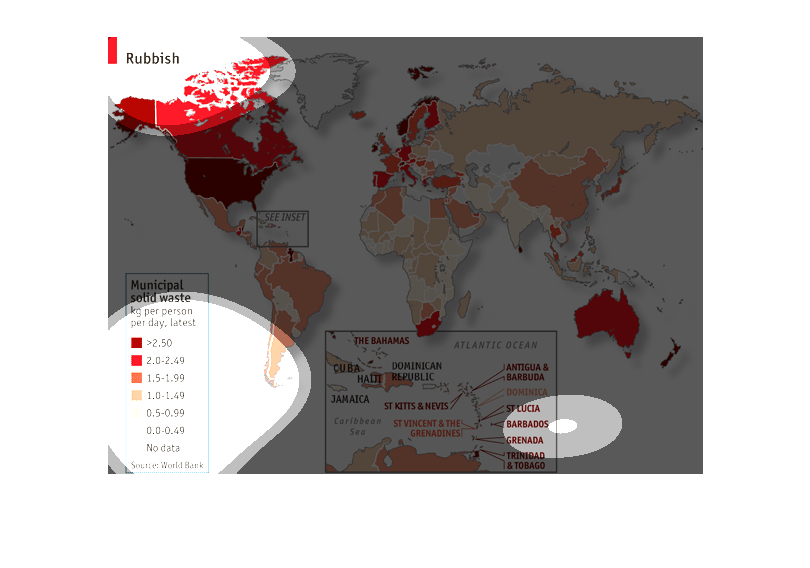
This is a chart showing global rubbish production. This color coded map shows the  US as one
of the largest producers of trash and is colored dark red for 2.5 kg per person per day.
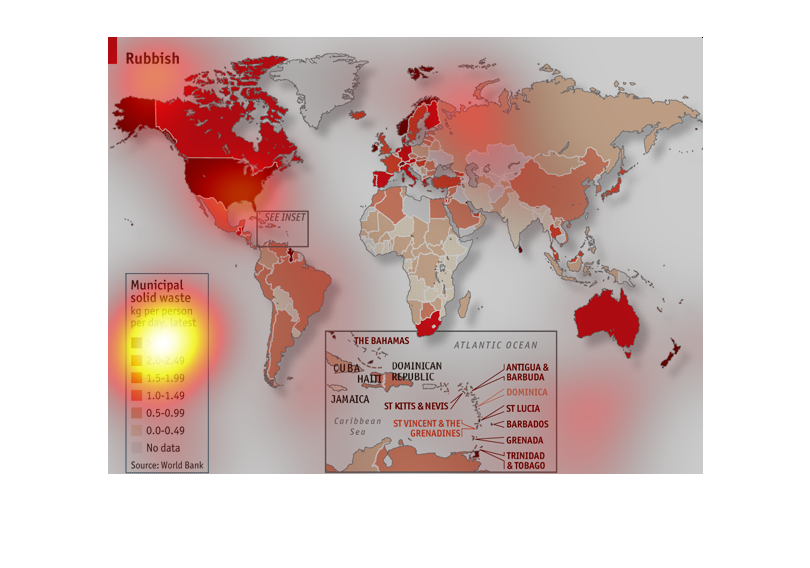
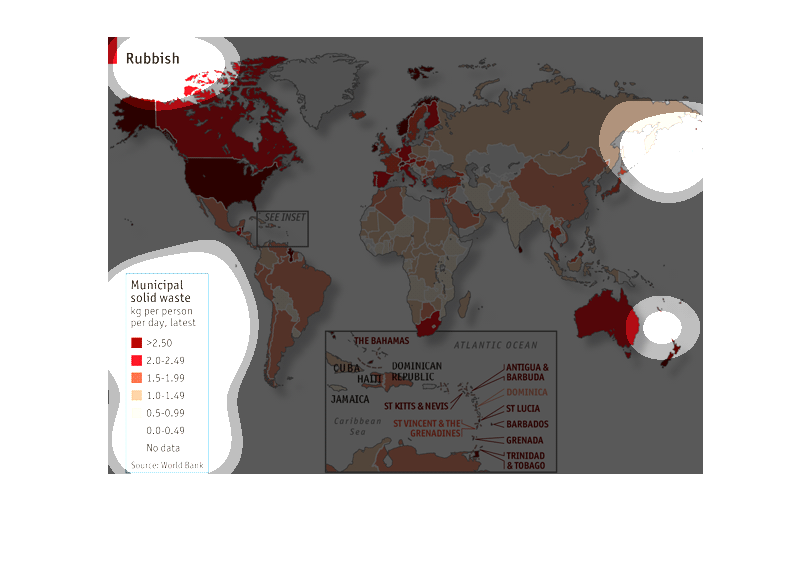
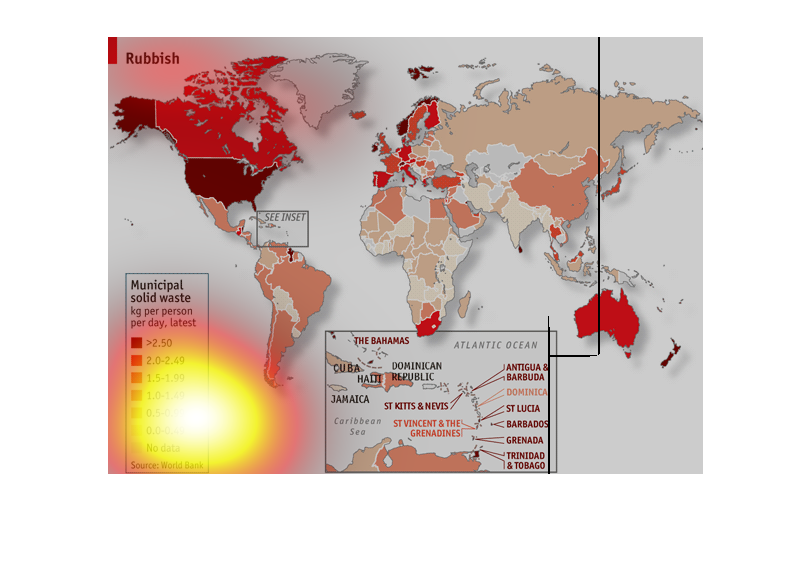
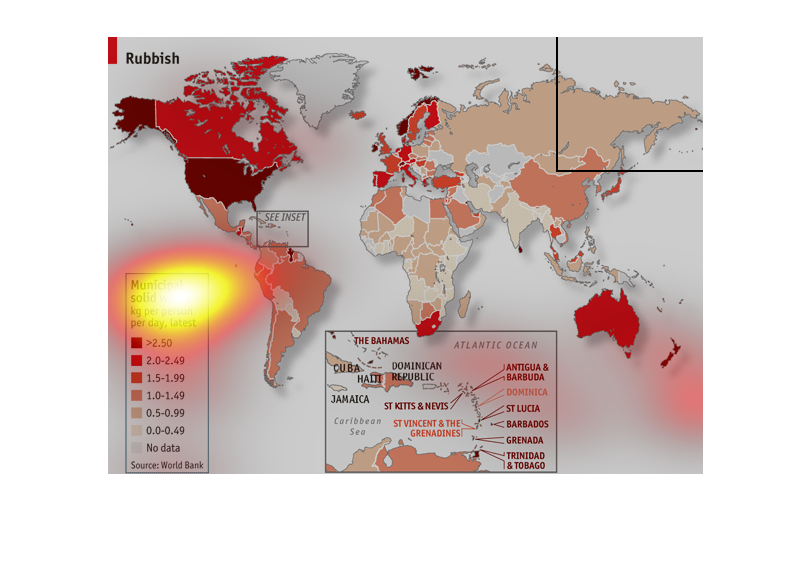
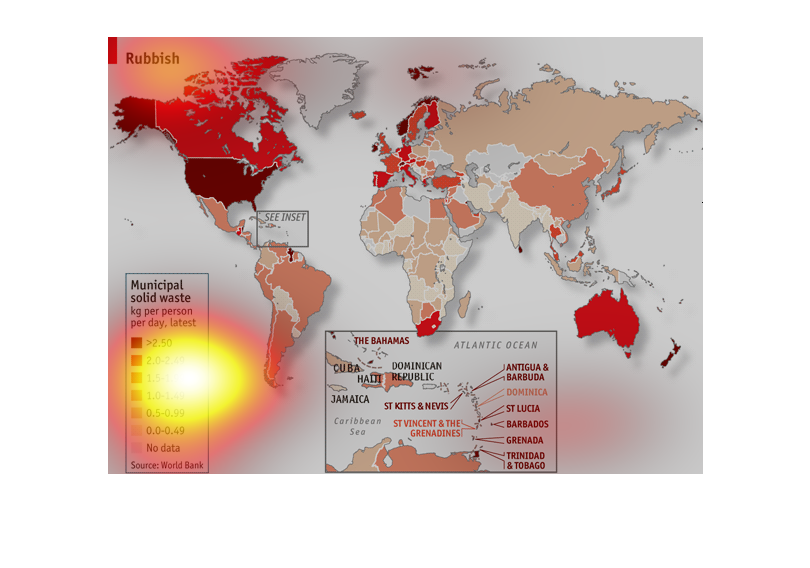
This graphic details how much solid waste (in kg per person, per day) is produced by countries
around the world. The largest wast producers include the United States and New Zealand. Many
Central African nations rank among the lowest waste producers in the world.
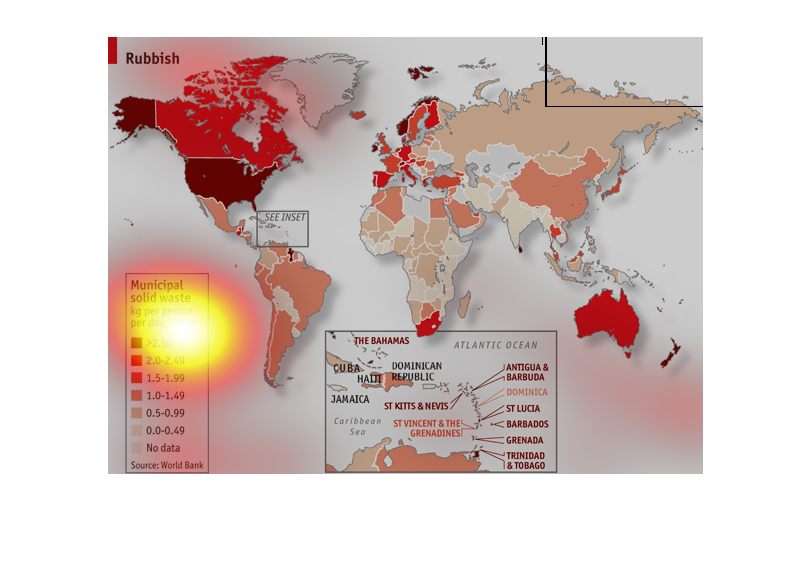
The map shows the relationship between the amount of rubbish that the average person puts
into the munciple waste per day based on country.  The map shows that America and some other
european countries are at the top of the list.
This picture gram seems to be a representation of the amounts of rubbish (municipal waste)
that each country has. The continent of North america seems to have the most
This chart describes rubbish. Specifically municipal solid waste in kg per person. Different
percentages on the chart are represented by different colors.
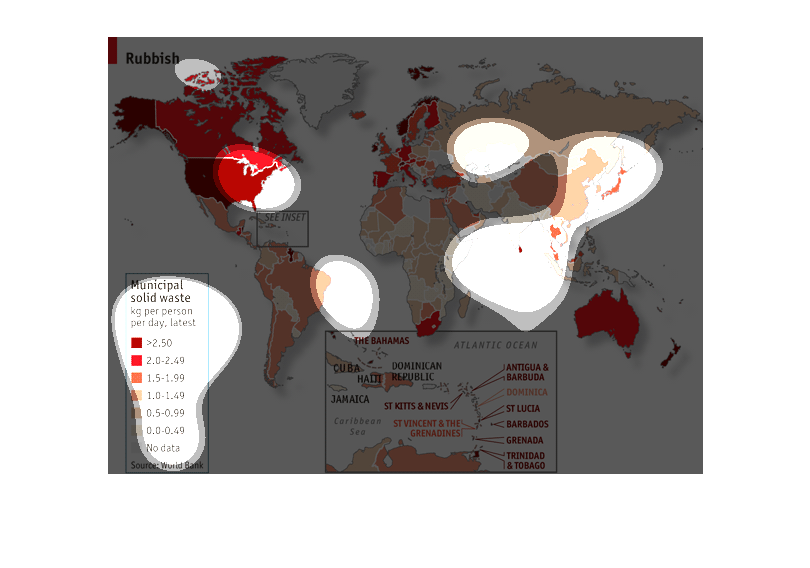
This image shows or depicts in a statistical geographic format the various amounts of rubbish
that countries around the world have accumulated. Leading the world seems to be the US.
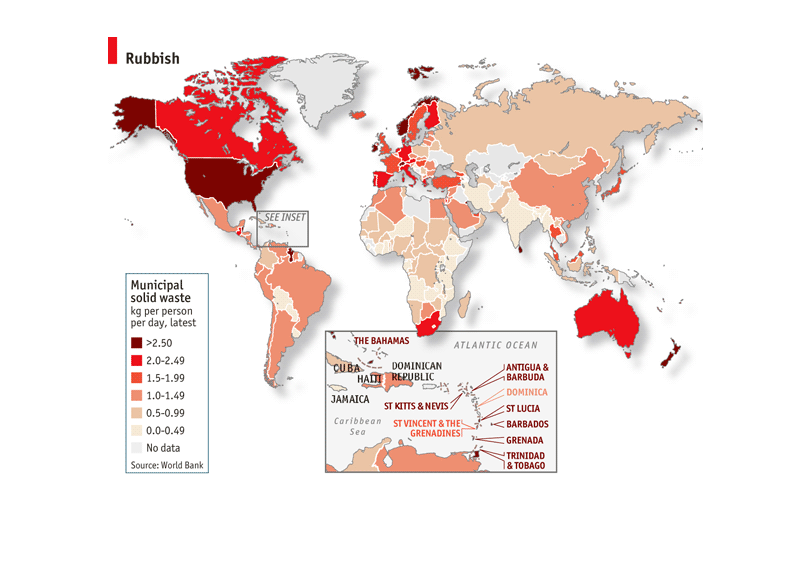
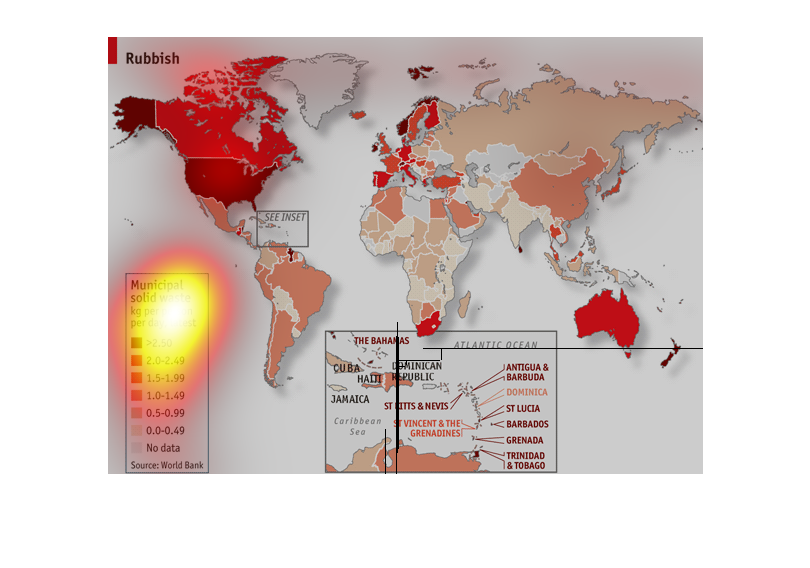
THIS MAP SHOWS THE AMOUNT OF MUNICIPAL SOLID WASTE GENERATED PER PERSON, PER DAY. COUNTRIES
ARE LABELED WITH DARKER REDS FOR MORE KILOGRAMS OF GARBAGE PER CAPITA PER DAY.
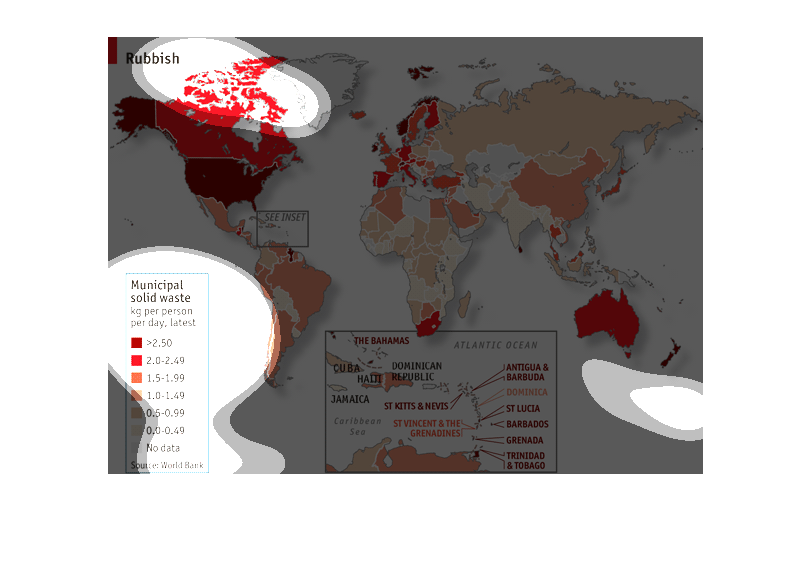
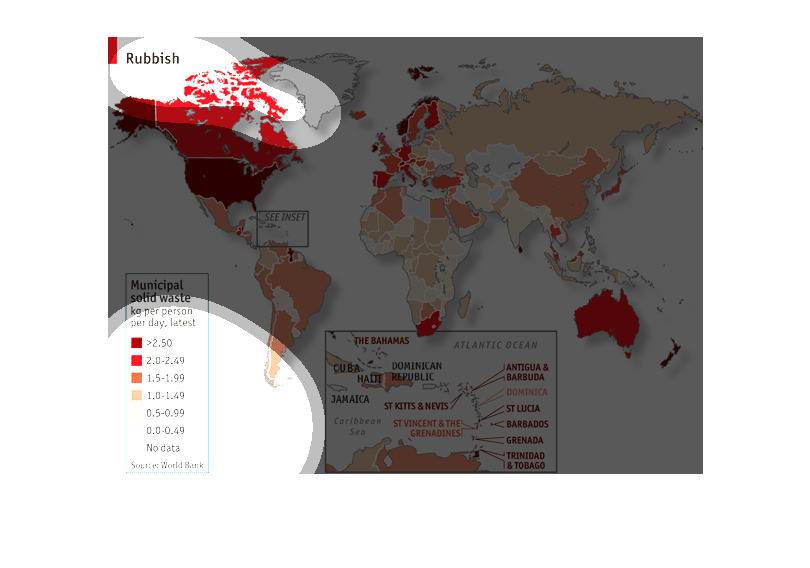
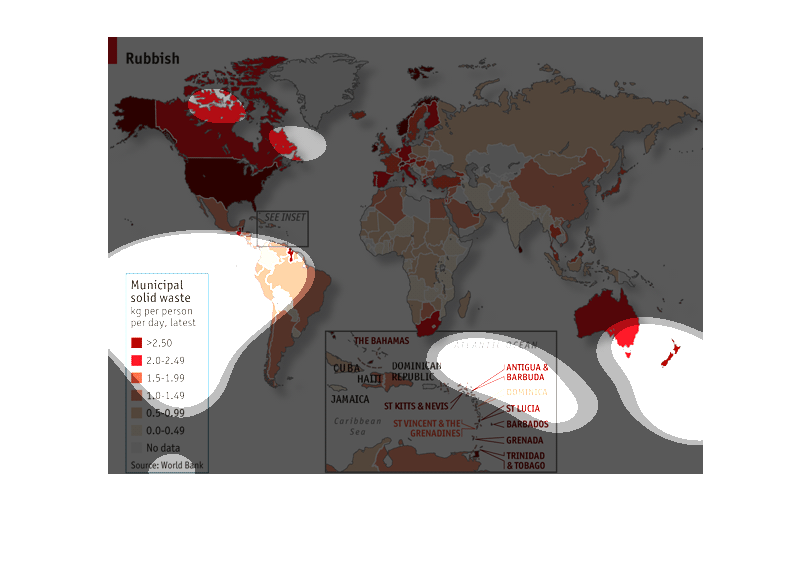
This chart depicts the municipal solid waste generated on a per capita basis, for most of
the world's nations.  The United States is among the world's leading solid waste producers,
on a per capita basis.
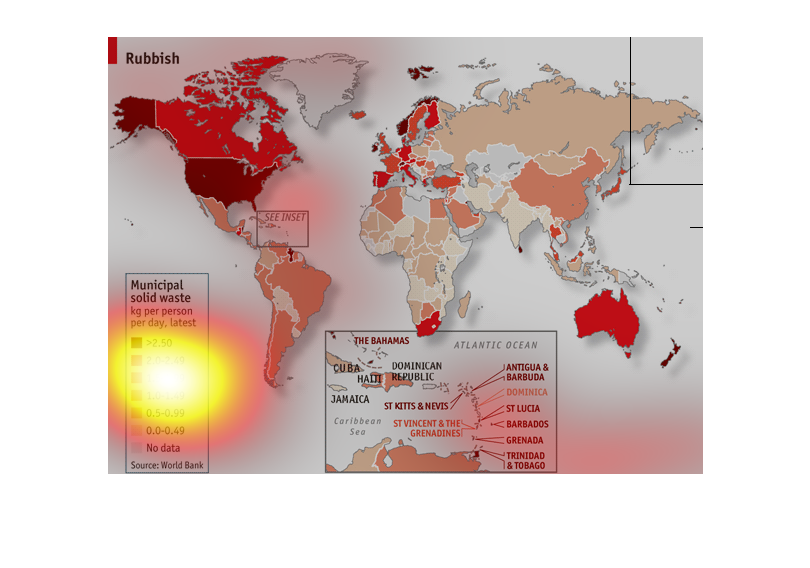
This is a chart showing how much municipal waste per person is created per day.  It seems
that more developed countries create a lot more waste than underdeveloped countries.
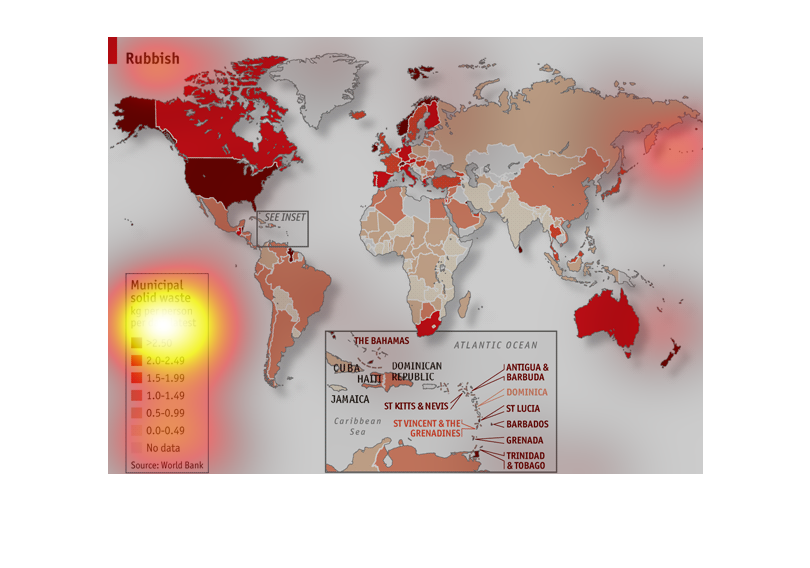
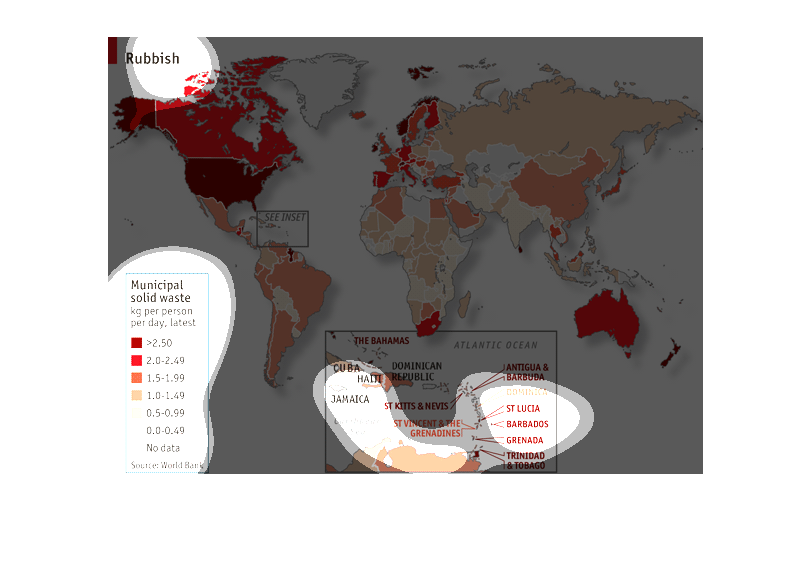
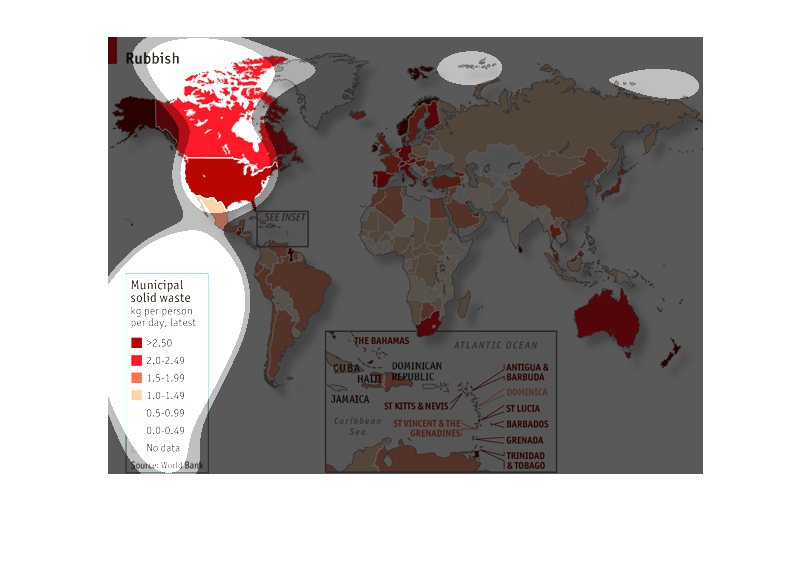
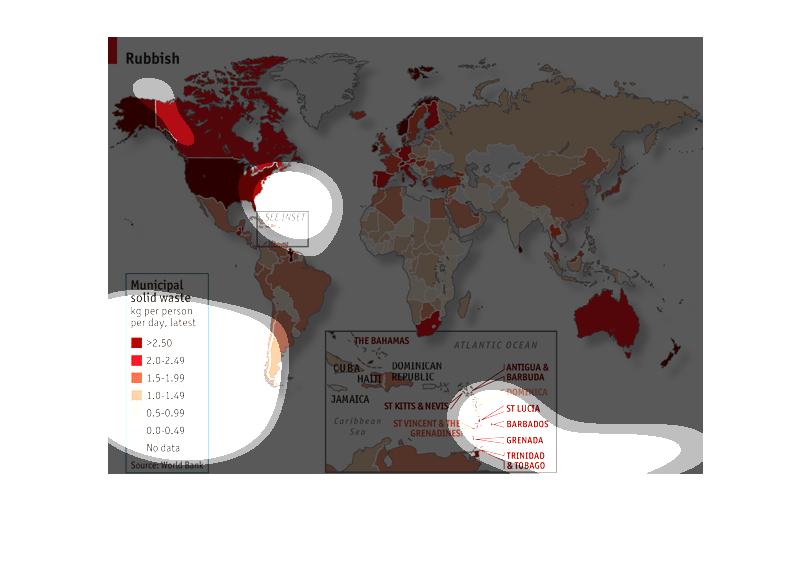
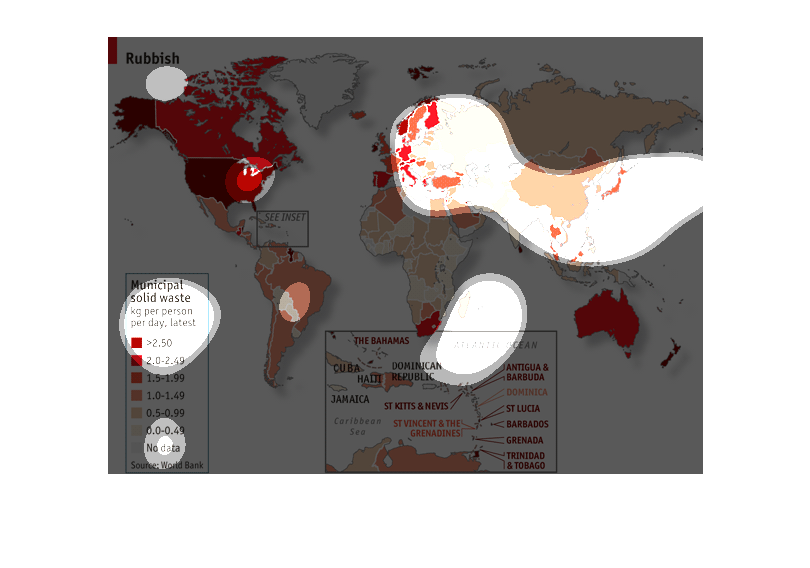
This is a world map depicting municipal solid waste in kg per day by country. Values range
from greater than 2.5 kg to 0, with some countries having no data available. The US, Europe,
South Africa, South Korea and Austraila produce greater volumes of waste compared to developing
countries in South America, Africa, the Middle East and Southeast Asia.
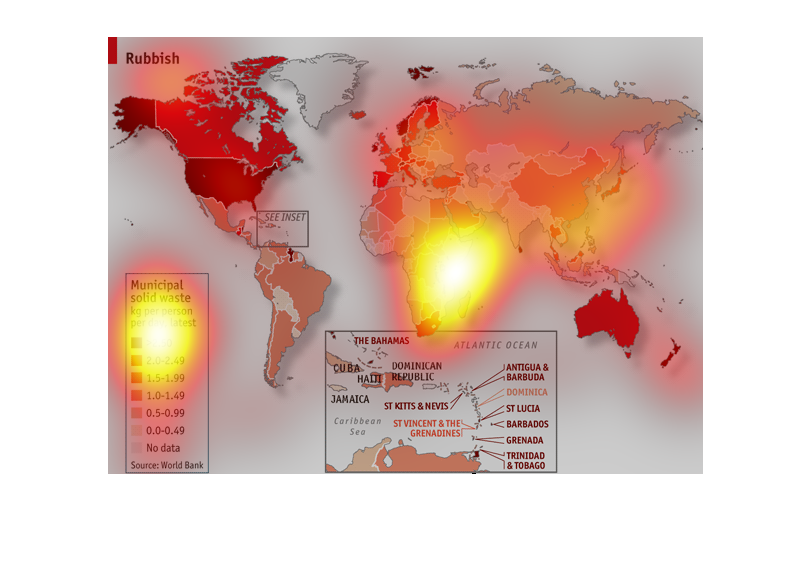
Rubbish, solid waste distribution across the world in KG per person per day. It is very evident
that westerners, and westernized countries produce much more rubbish
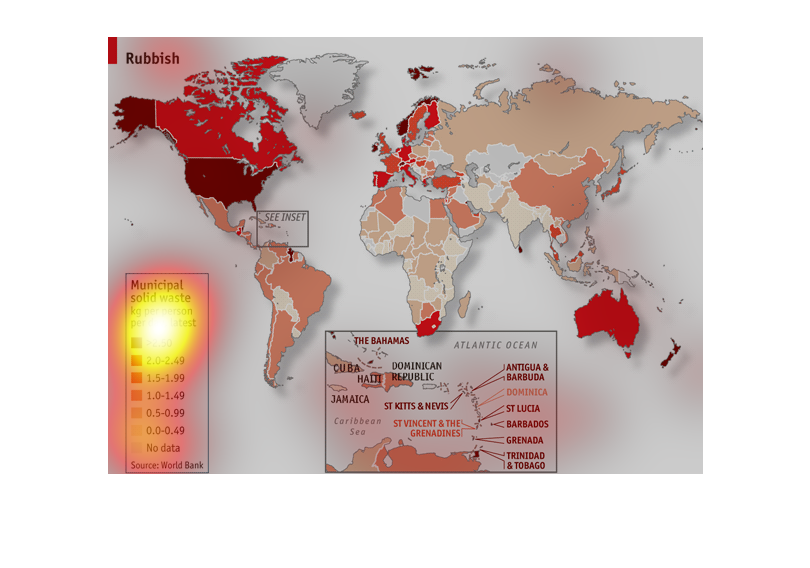
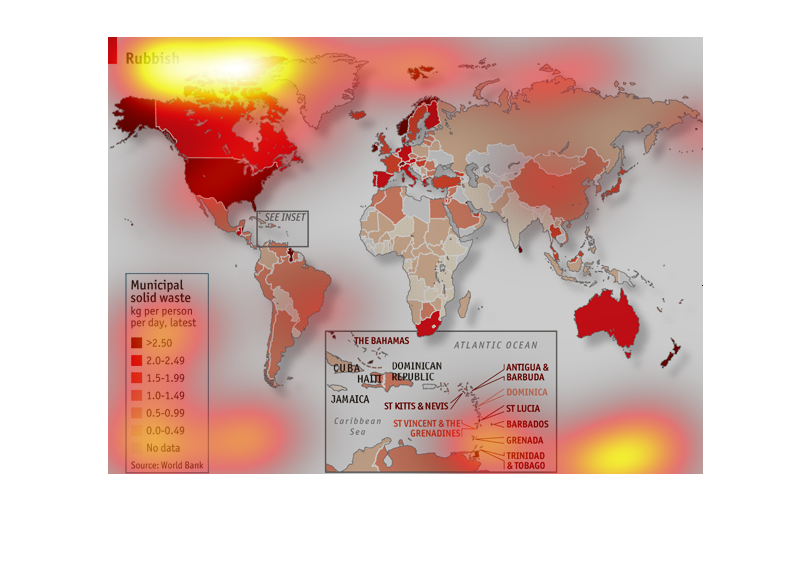
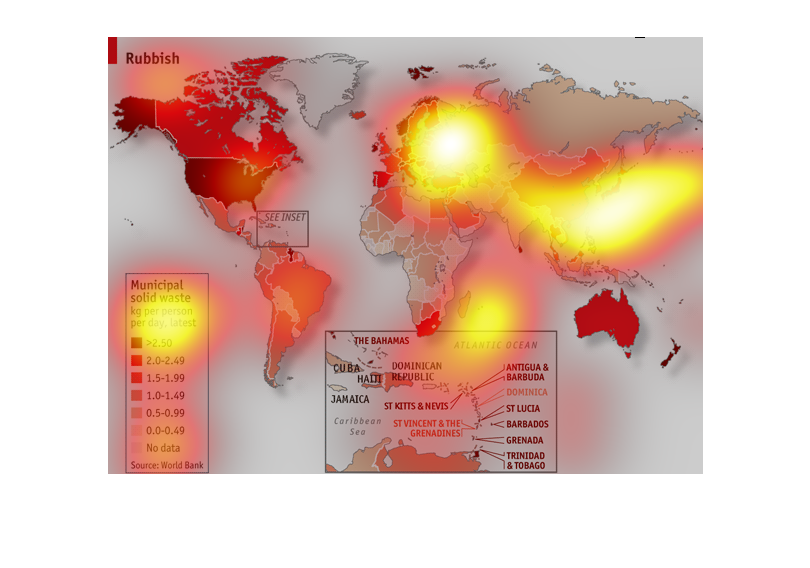
The image is that of a world map depicting daily solid waste disposal per person.  The US
clearly has the most waste disposal, with Asia either not reporting or reporting misleading
numbers.  Australia and western Europe fall close behind the US.