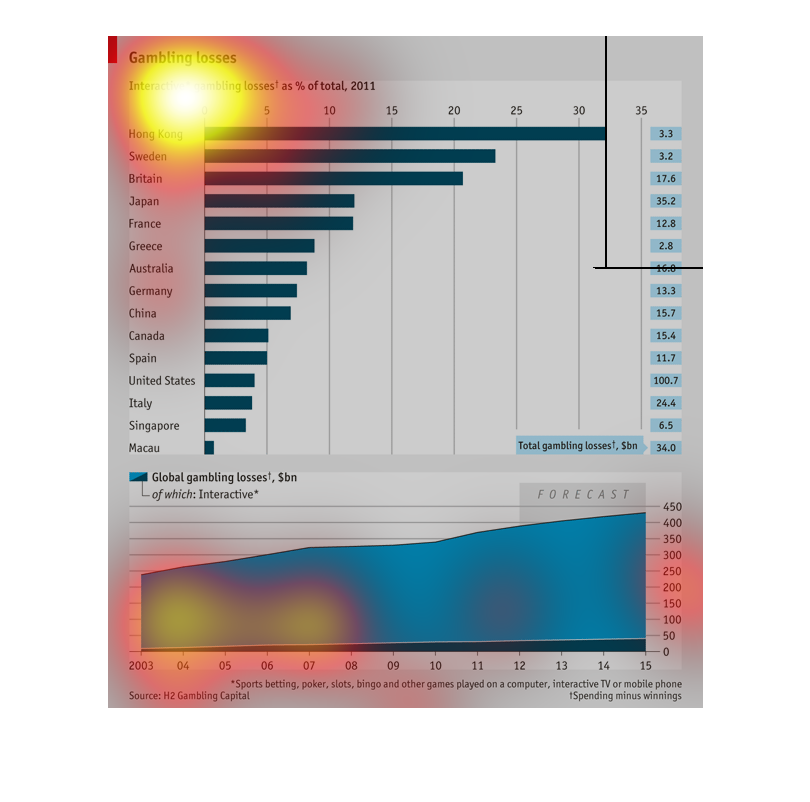
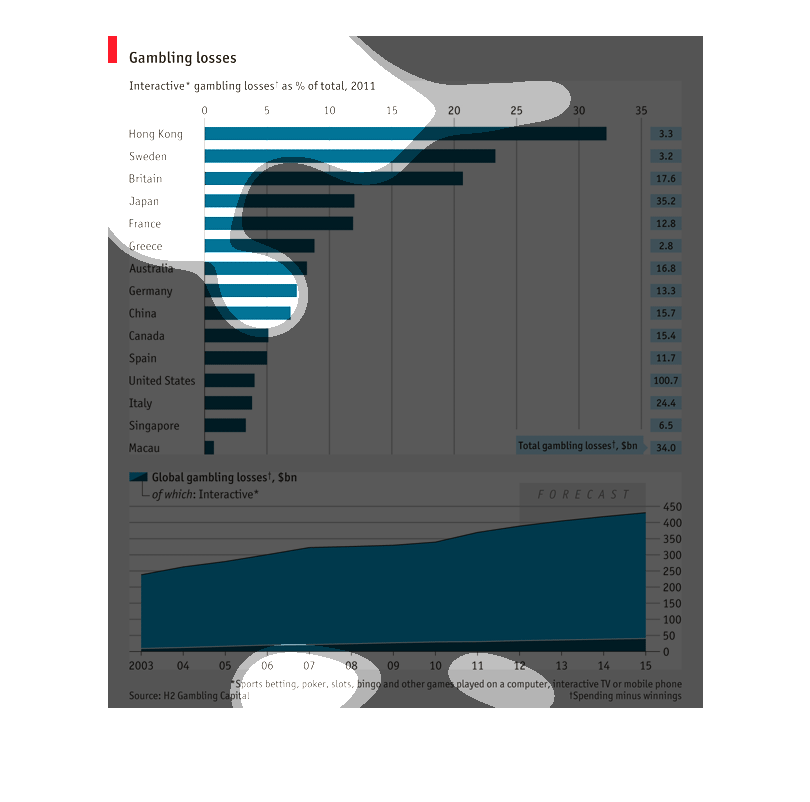
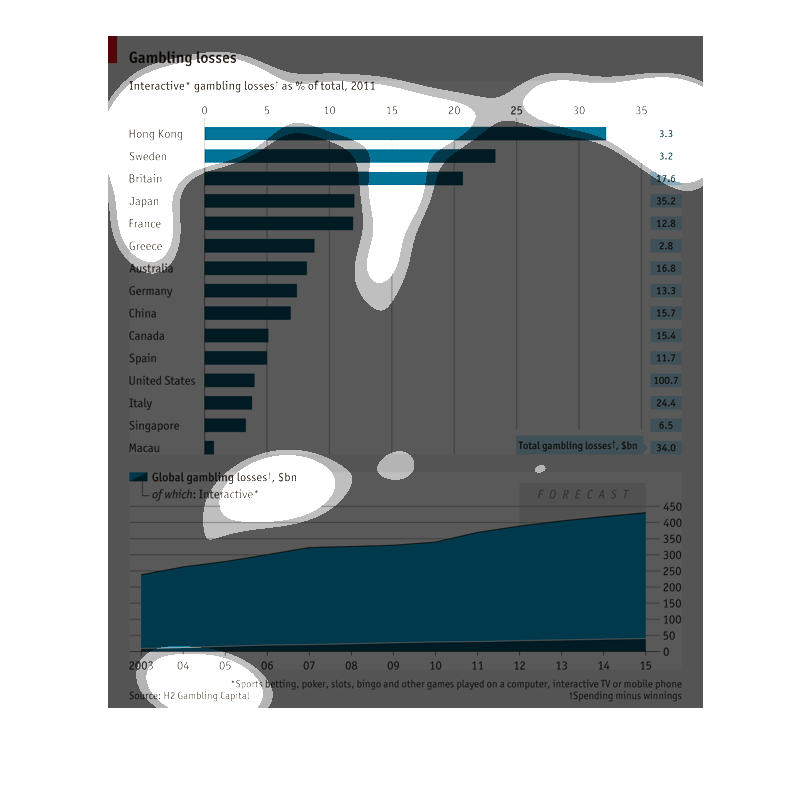
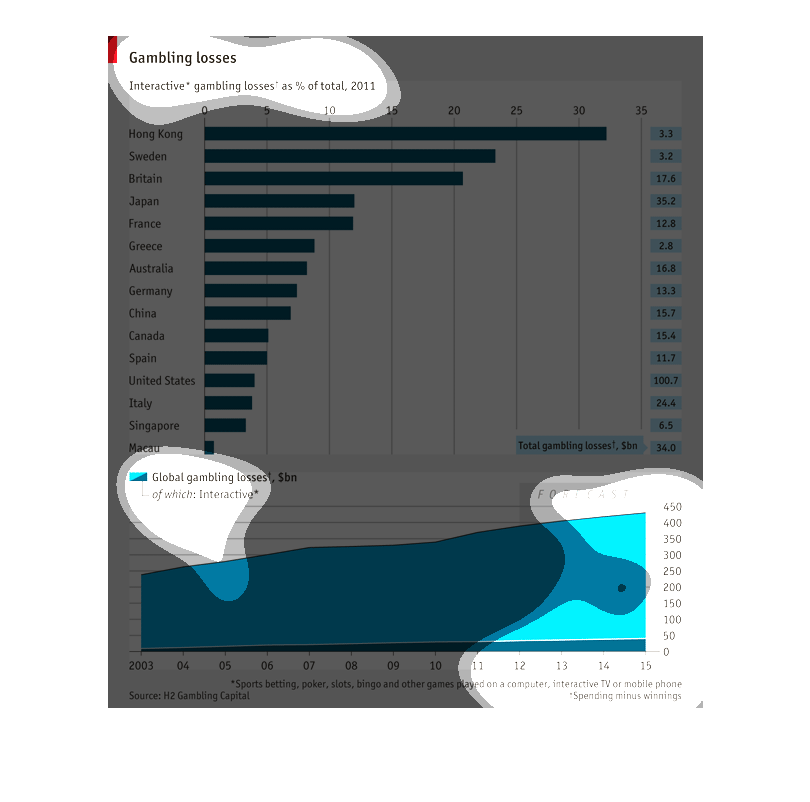
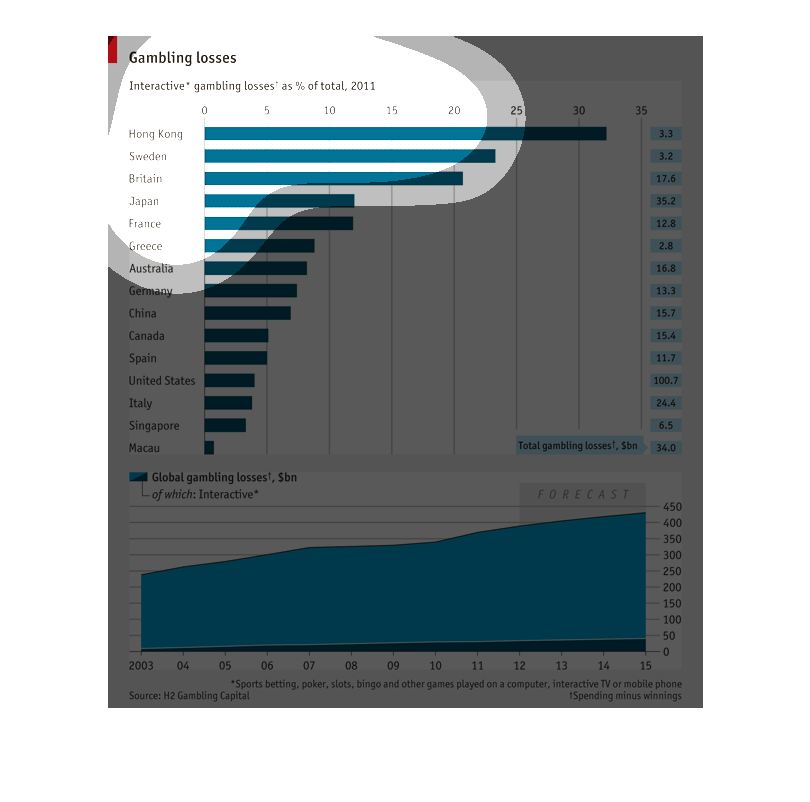
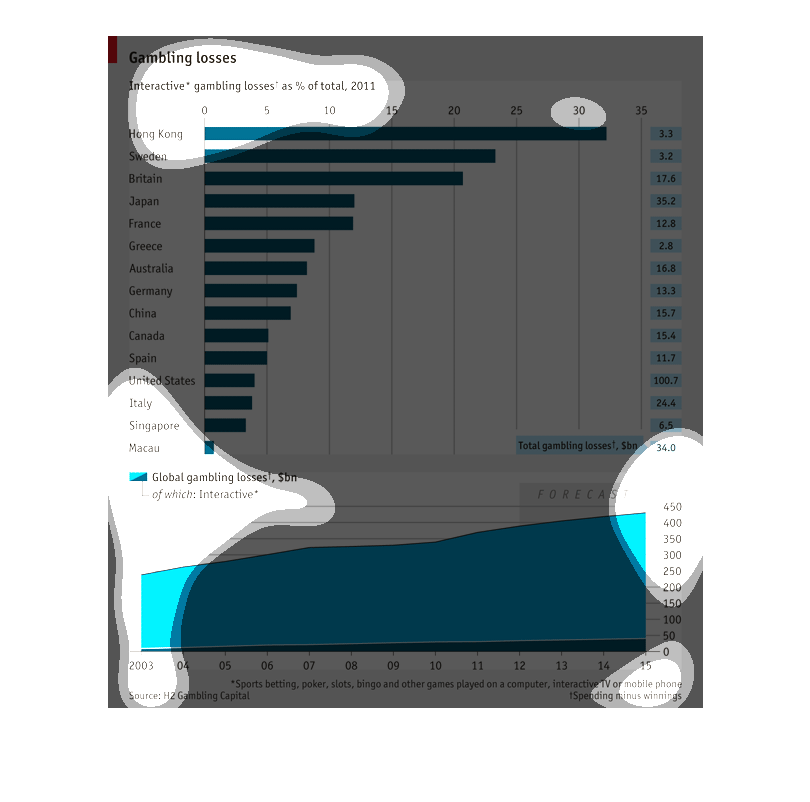
These charts show the interactive gambling losses in a percentage for the year 2011. The chart
on the bottom shows the global gambling losses in billions of dollars in light blue, dark
blue on the graph shows the percentage of interactive gambling.
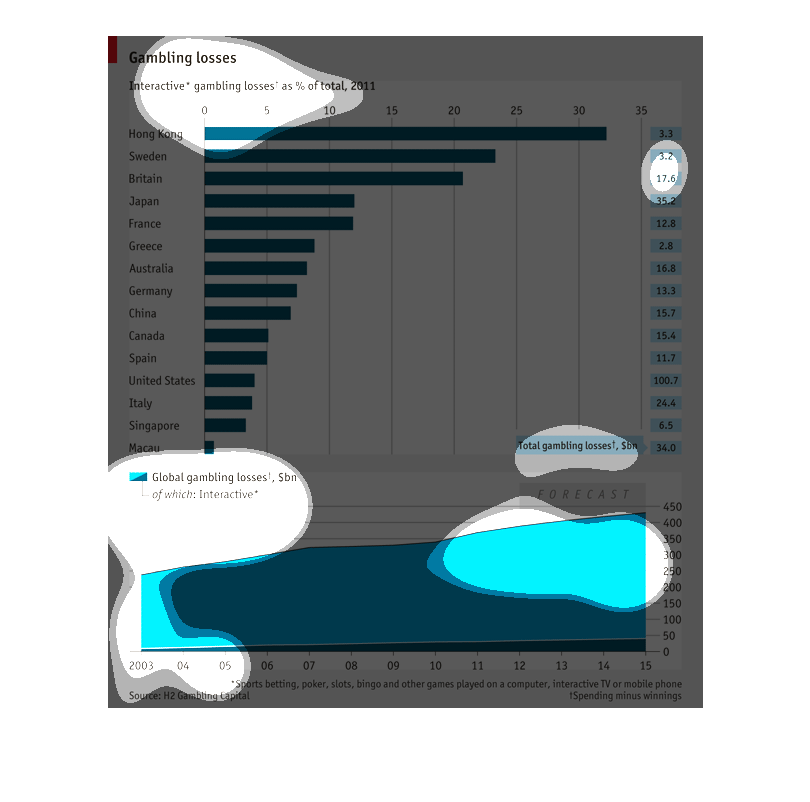
This chart shows gambling losses as percent of total by country in 2011. Hong Kong had the
highest percentage of loss at 33 percent followed by Sweeden at  23 percent. The US total
loss was below 5 percent. It also shows total gambling loss for the world in billions. It
has steadily increased since 2003 and is now at 440 billion.
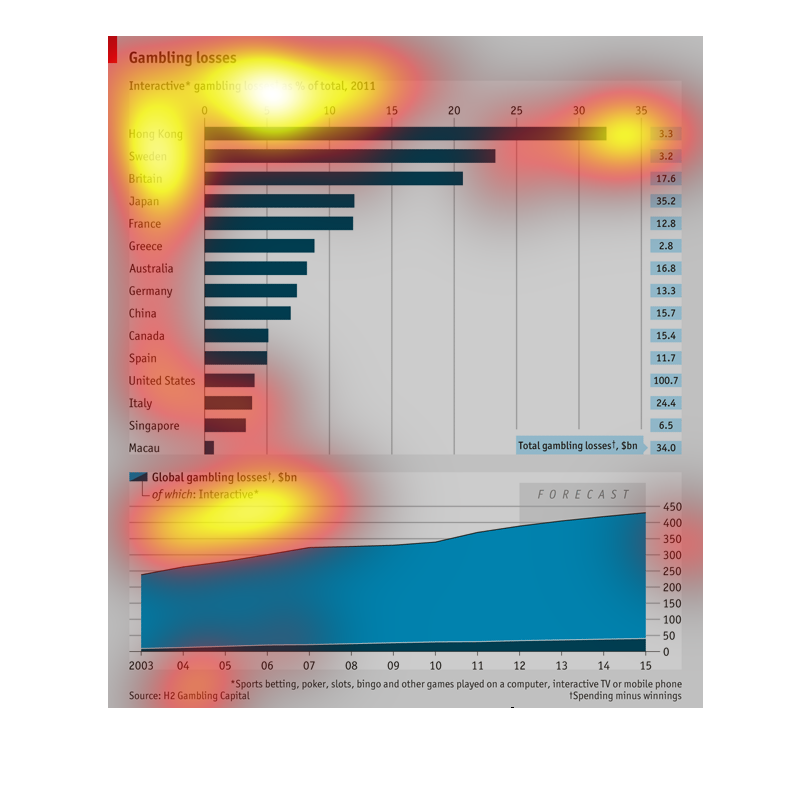
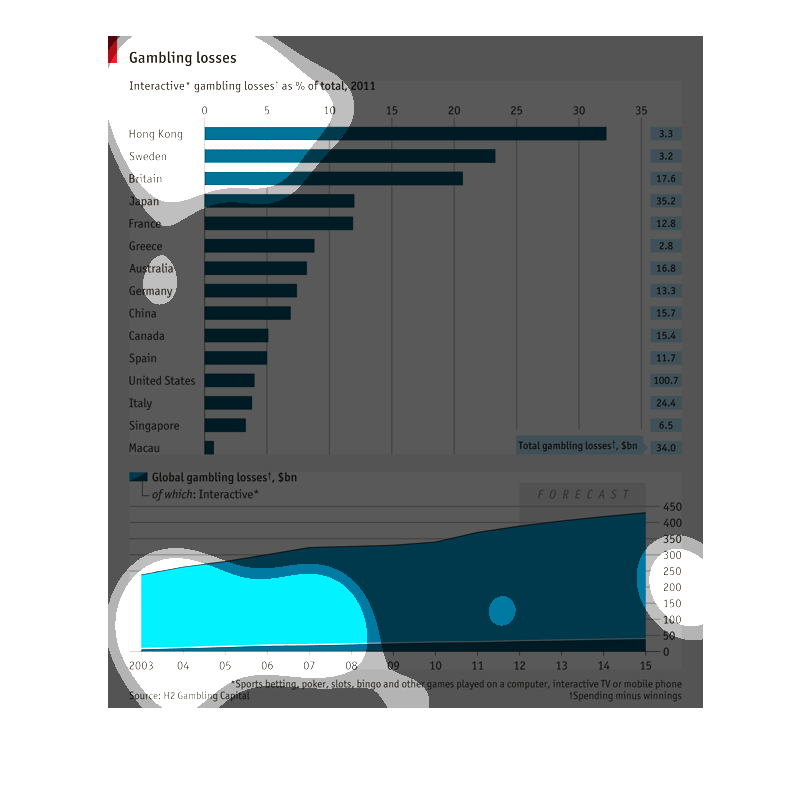
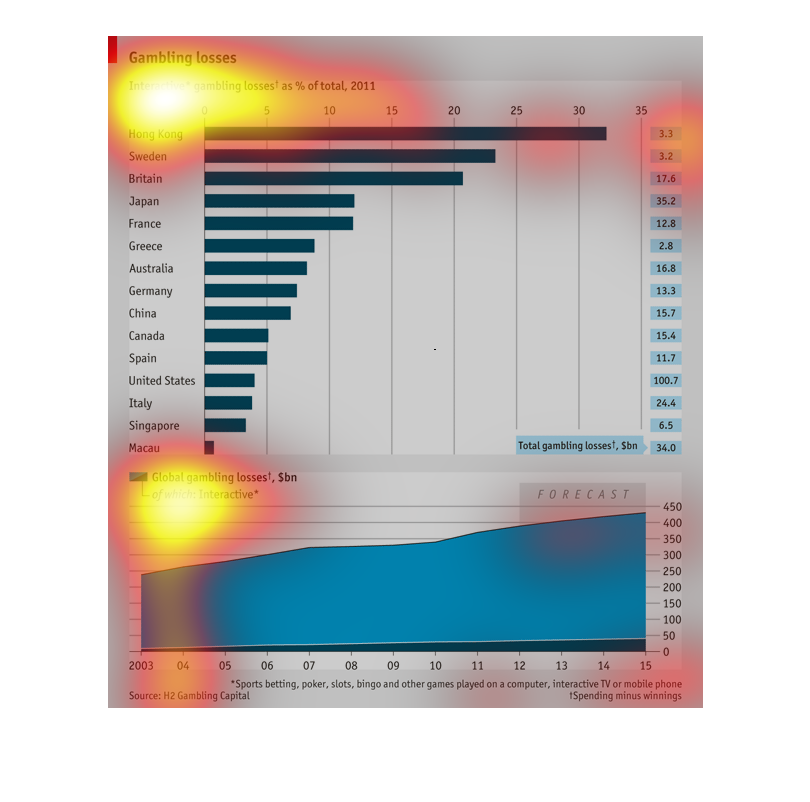
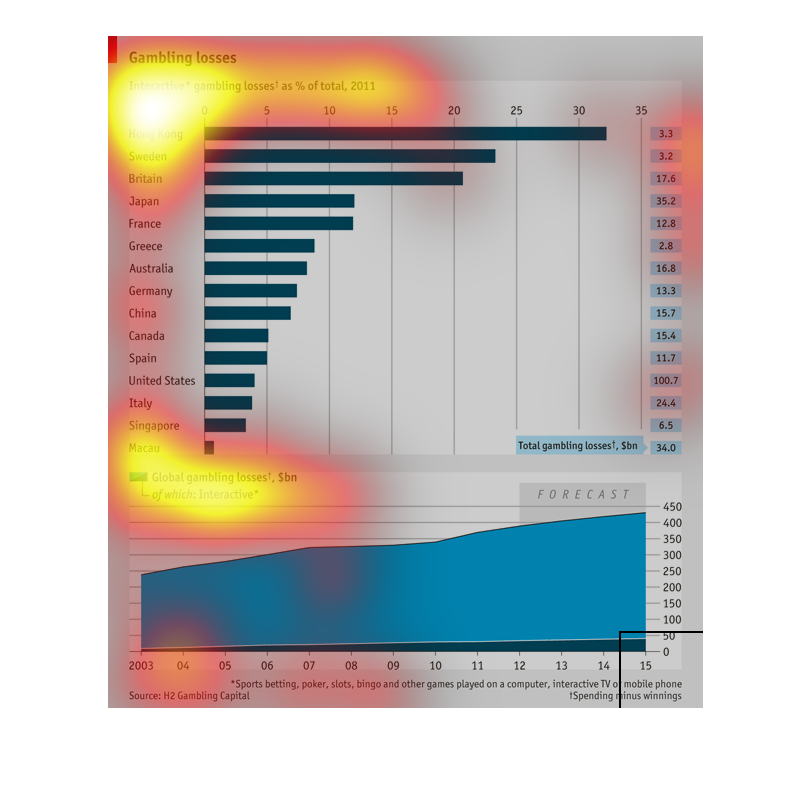
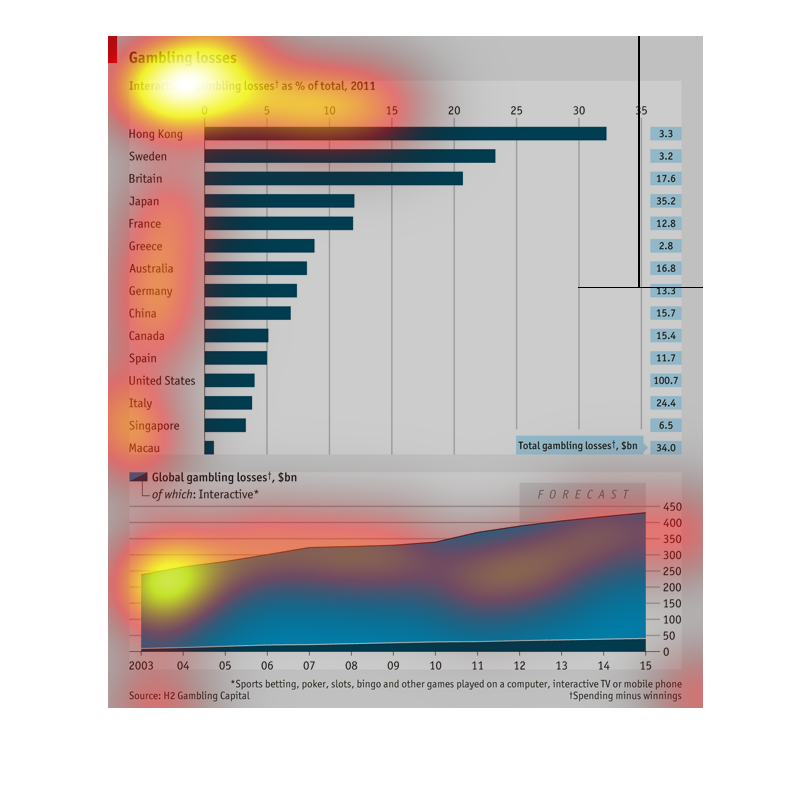
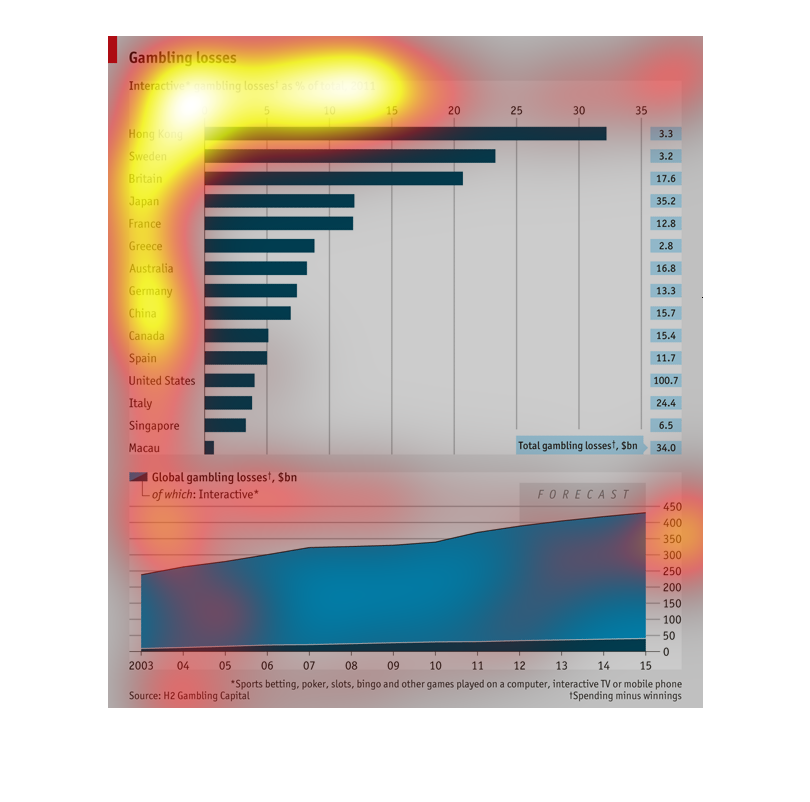
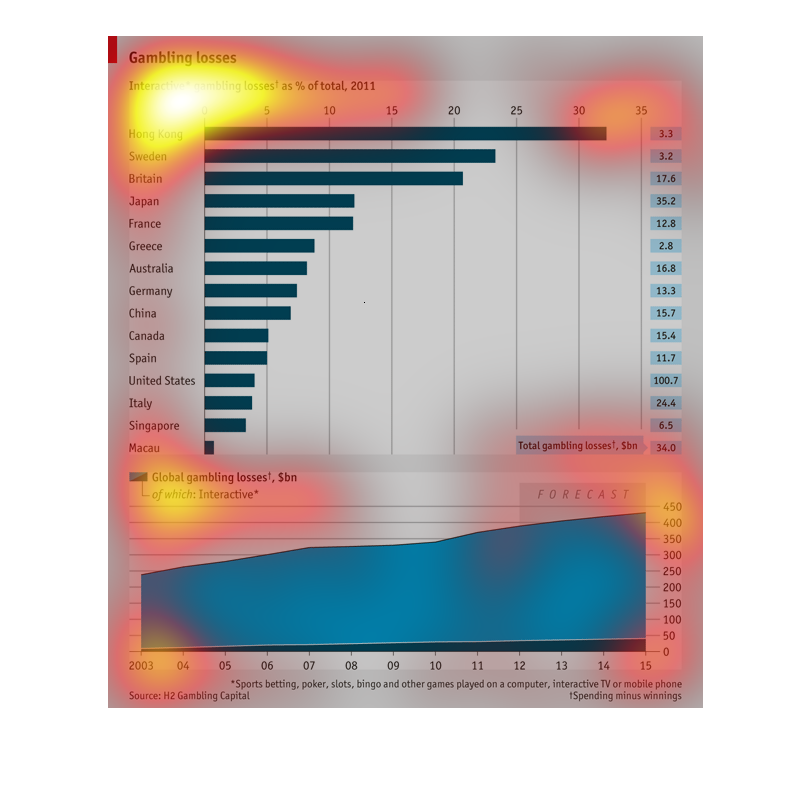
This image shows or depicts in statistical bar graph formats showing countries around the
world who lead in gambling losses. Top countries on list are Hong Kong, Sweden and Britain.
This is a graph of interactive gambling losses, from 2011, ranked by country from low to high,
with a global trend of gambling losses overall forecasted below.
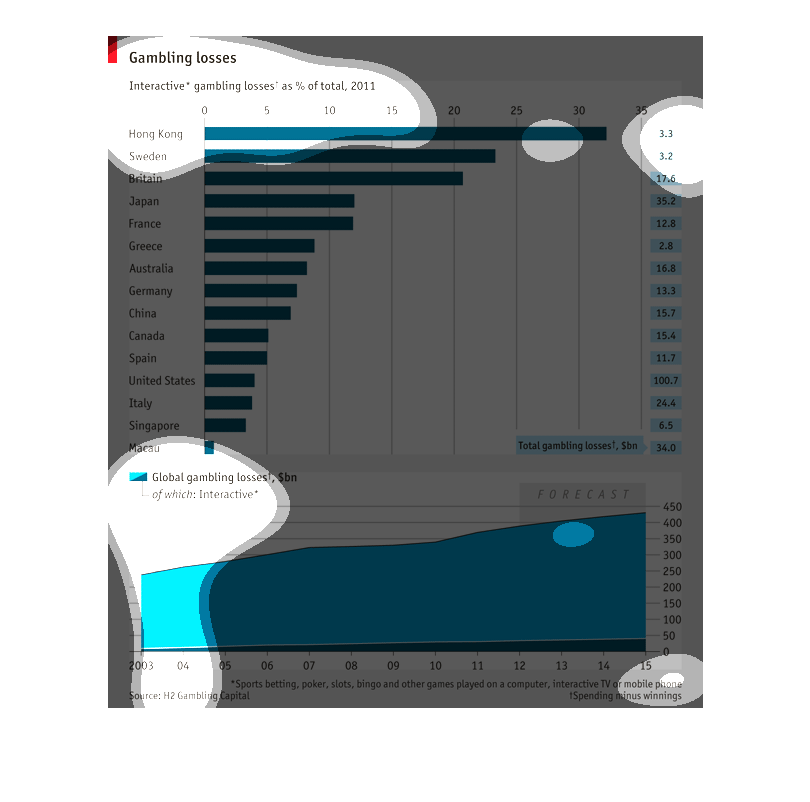
This study tries to show the immense expenses of global gambling. From race horses, sports
betting and other similar activities, the countries mentioned have spent billions over the
years.
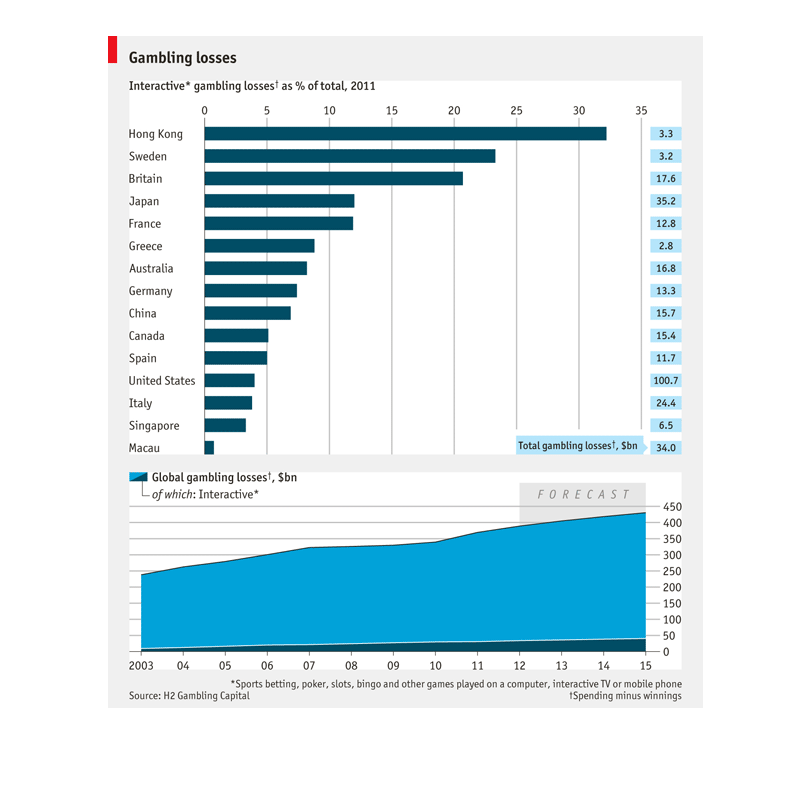
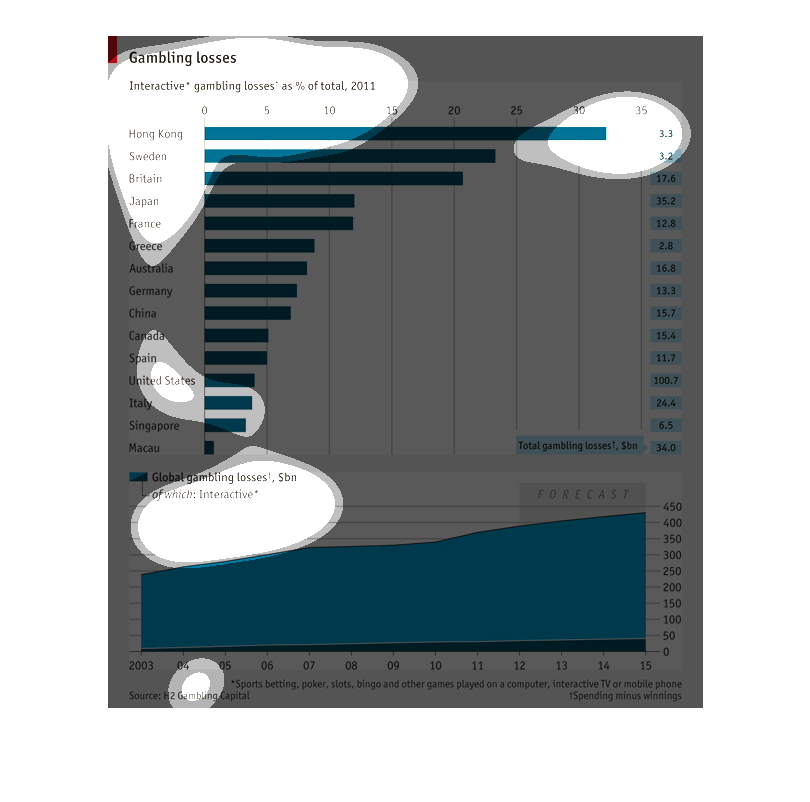
This chart depicts gambling losses for various countries.  Included is the percentage of interactive
gambling losses.  Global gambling losses have accelerated vs. time.
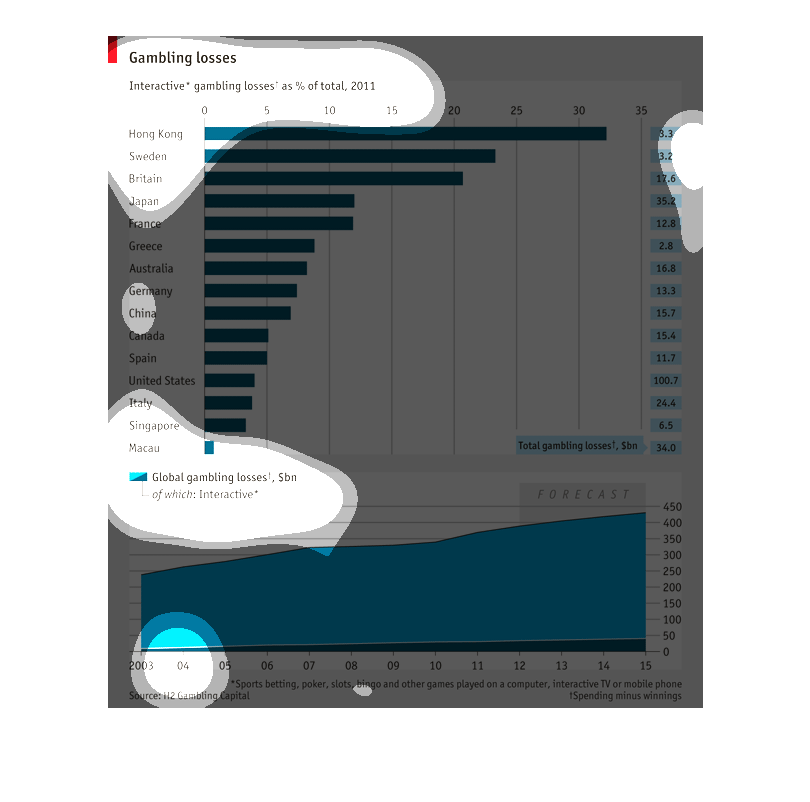
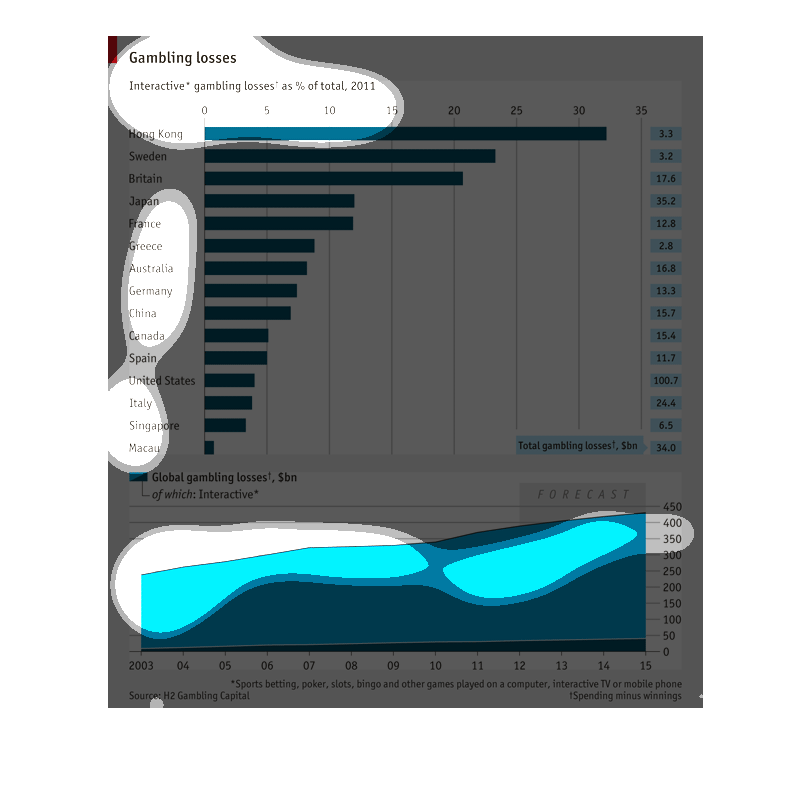
This chart describes gambling losses as a percentage of total gambling losses.  It shows different
countries in relation to the year 2011.  It also provides a forecast of the trend for 2012
to 2015.
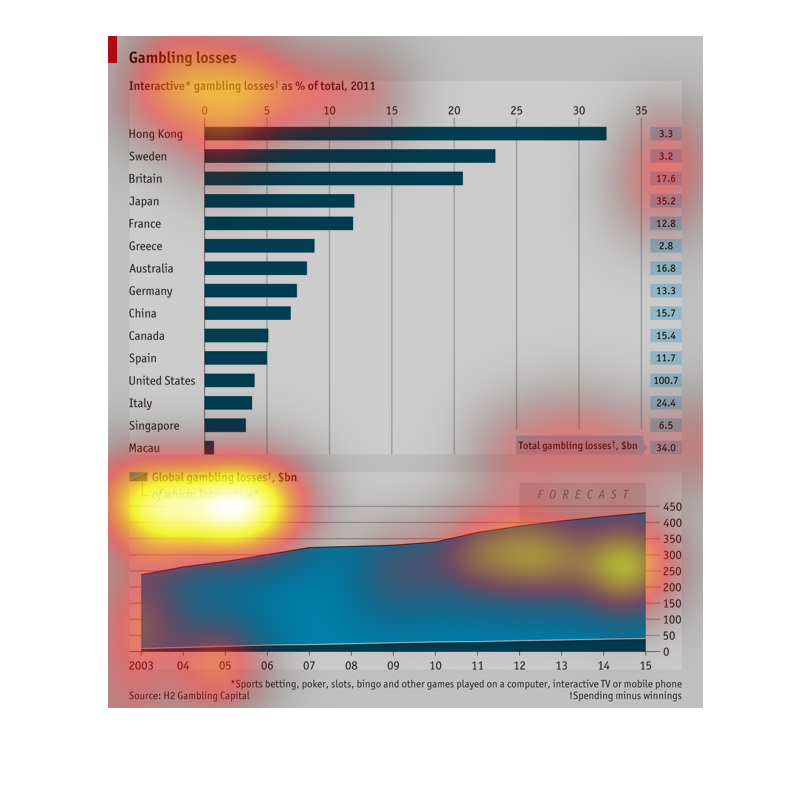
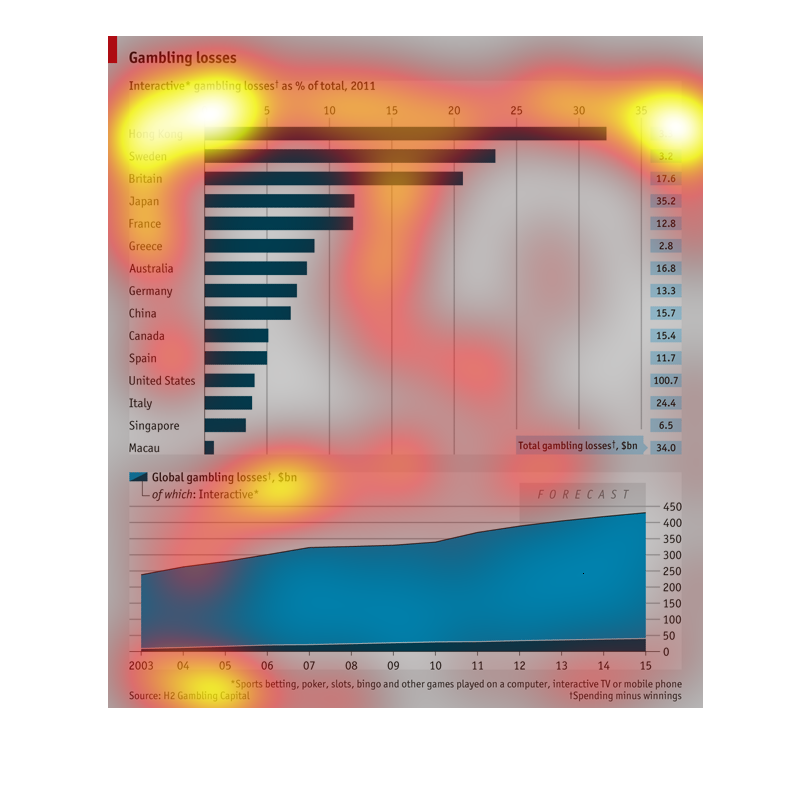
This shows us what percentage of gambling losses in 2011 were interactive in nature.  It canaries
several different countries. It also shows results over several years and a forecast for projected
losses.
This chart clearly displays the amount of gambling losses as a percentage in the year 2011,
grouped by country. Hong Kong is credited with having the largest amount of gambling losses.
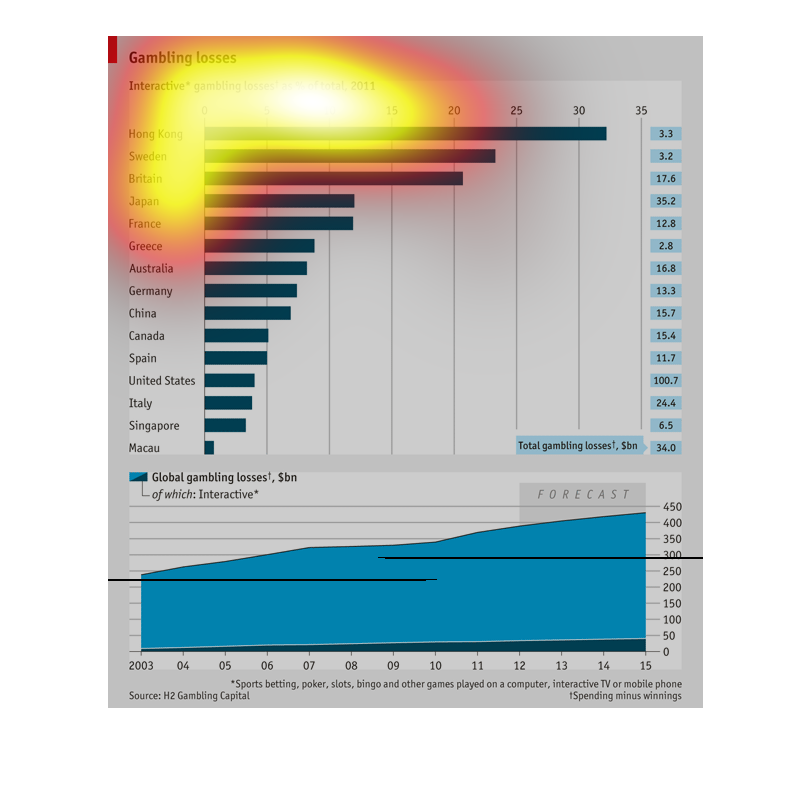
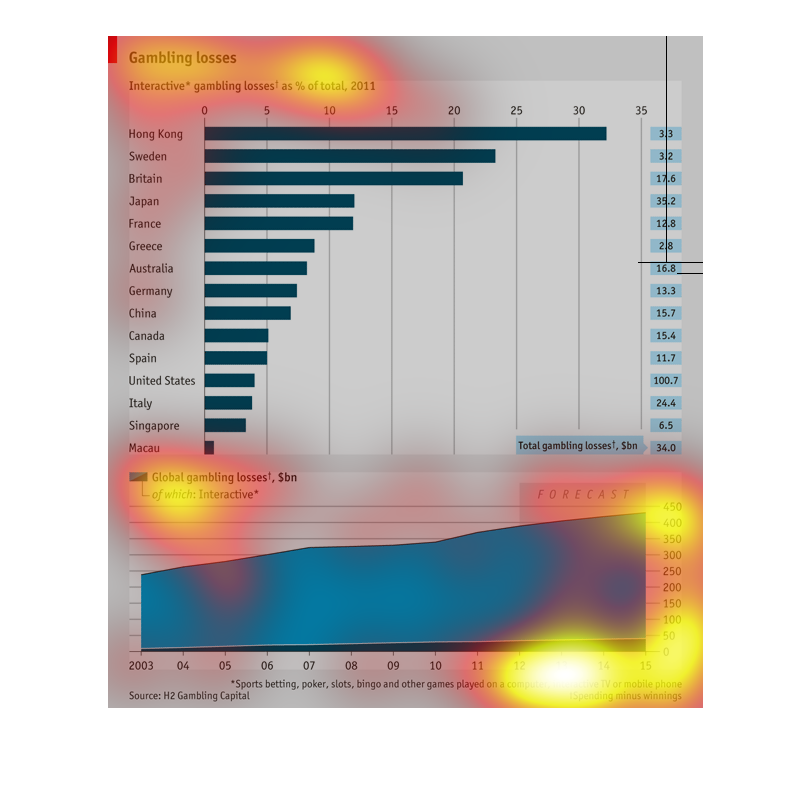
The following chart list the total amount of money lost in Gambling in the year 2011. Hong
Kong had the highest number of loss per country. Followed by Sweeden, Britain, Japan, France,
Greece, Australia, Germany, China, Canada, Spain, United States of America, Italy, Singapore,
Macau, It shows that the total amount of money last has gone up each year from 2004.
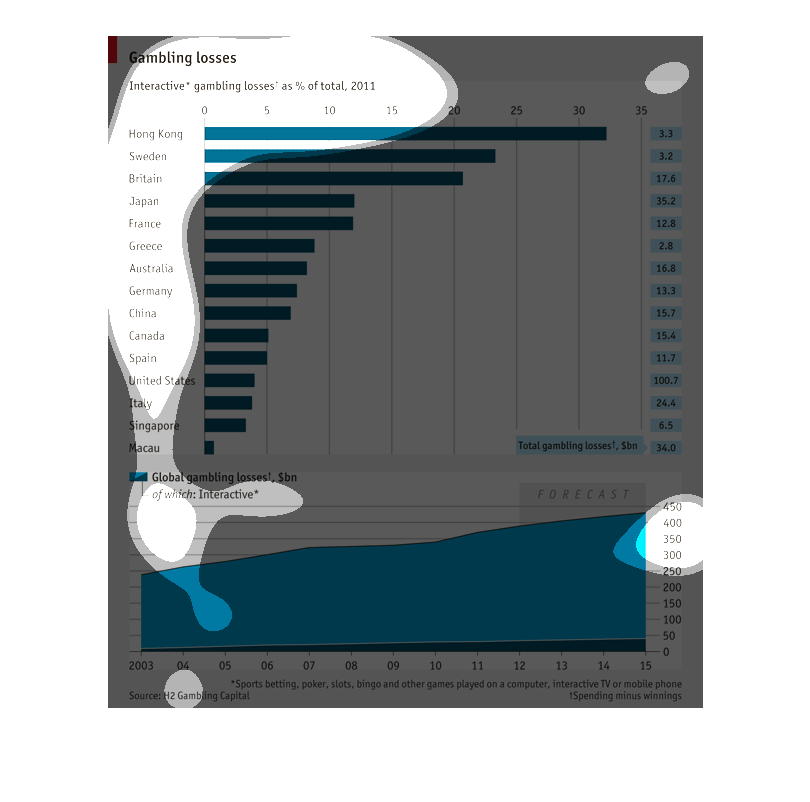
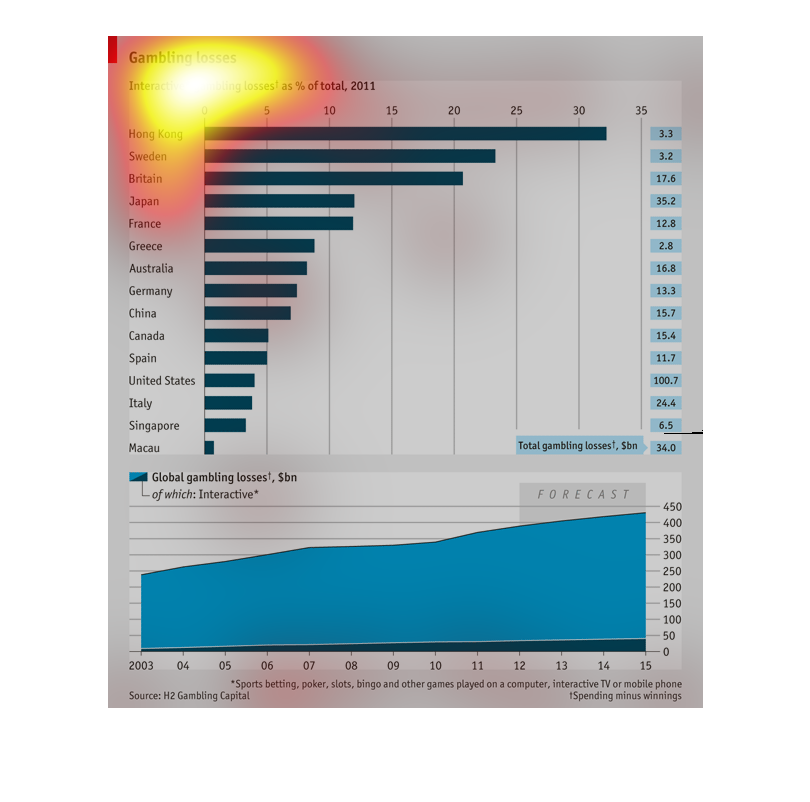
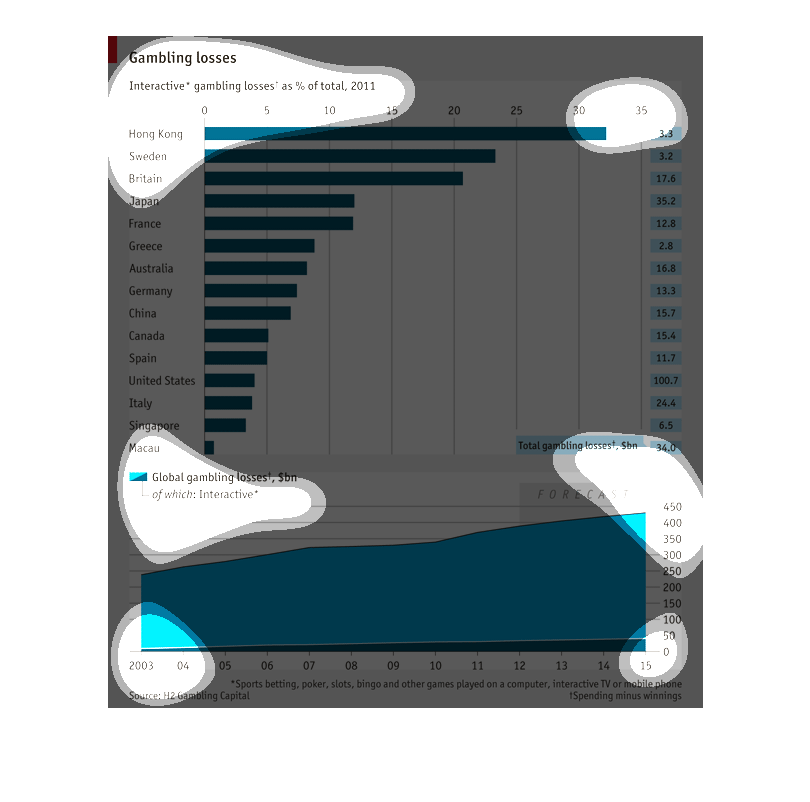
The first part of the graph shows gambling loses for each country. Hong Kong has the highest
gambling losses at almost 33%. Macau has the lowest gambling losses with close to 1%. The
bottom part of the graph shows gambling losses on a global aspect. From 2003-2015 the number
of losses rose to 400.
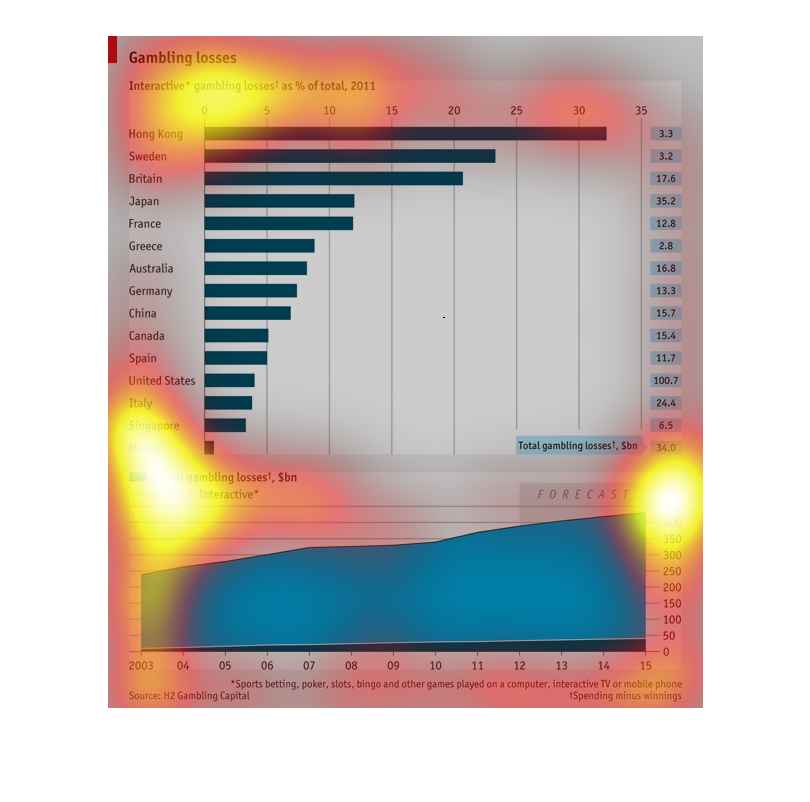
This chart is about interactive gambling losses.  It shows that Hong Kong has the highest
losses.  The chart also shows that the interactive gambling losses have continually increase
from 2003 to 2015.
The image shows gambling losses from interactive games being played in such countries as France,
Japan, and Greece.  It also shows the global affects of interactive gambling