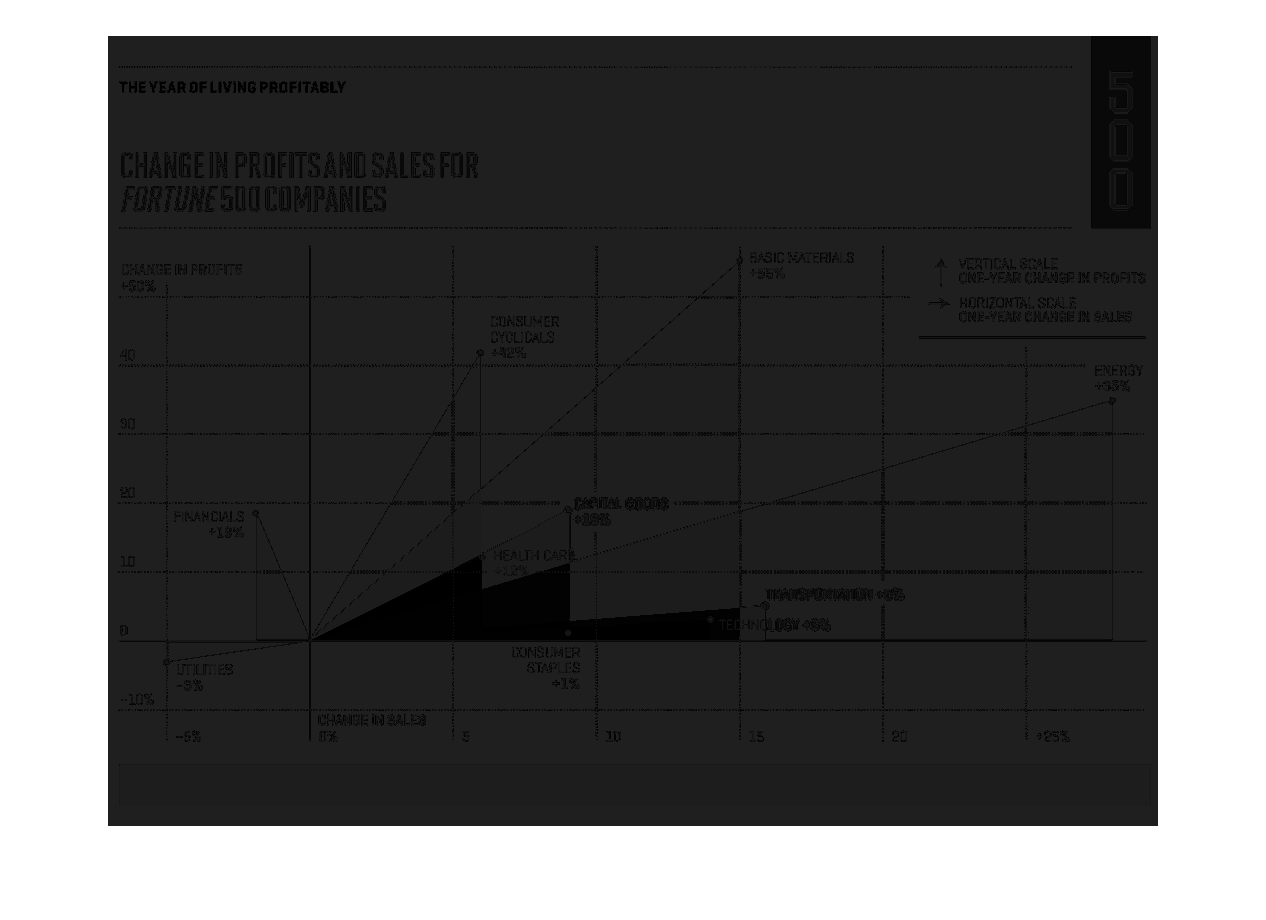
The graph shows the relationship between the 1-year change in profits (y axis) and the change
in sales (x axis) of Fortune 500 companies split out by industry. The Energy sector had the
highest increase in sales (+35%). The Basic Materials industry had the highest increase in
profits (+55%).  Utilities had the lowest increase in both sales (-3%) and profitability (-3%).
Error using .*
Matrix dimensions must agree.

Error in plotSpotlight (line 30)
    output = repmat(a,[1 1 3]).*single(im)/255;

Error in plot_individual_user_maps (line 49)
        [heat] = plotSpotlight(im,heatmap,3);