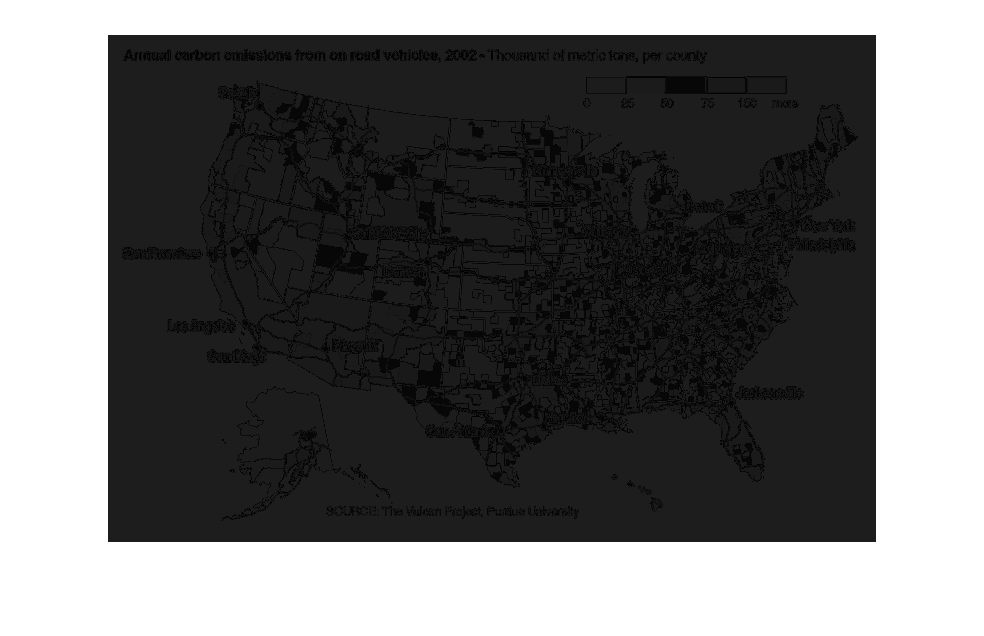
It looks like a population map of the United States. The colors are in shades of orange with
darker orange indicating denser population areas. The areas of lesser populations are indicated
with light orange to white.
Error using .*
Matrix dimensions must agree.

Error in plotSpotlight (line 30)
    output = repmat(a,[1 1 3]).*single(im)/255;

Error in plot_individual_user_maps (line 49)
        [heat] = plotSpotlight(im,heatmap,3);