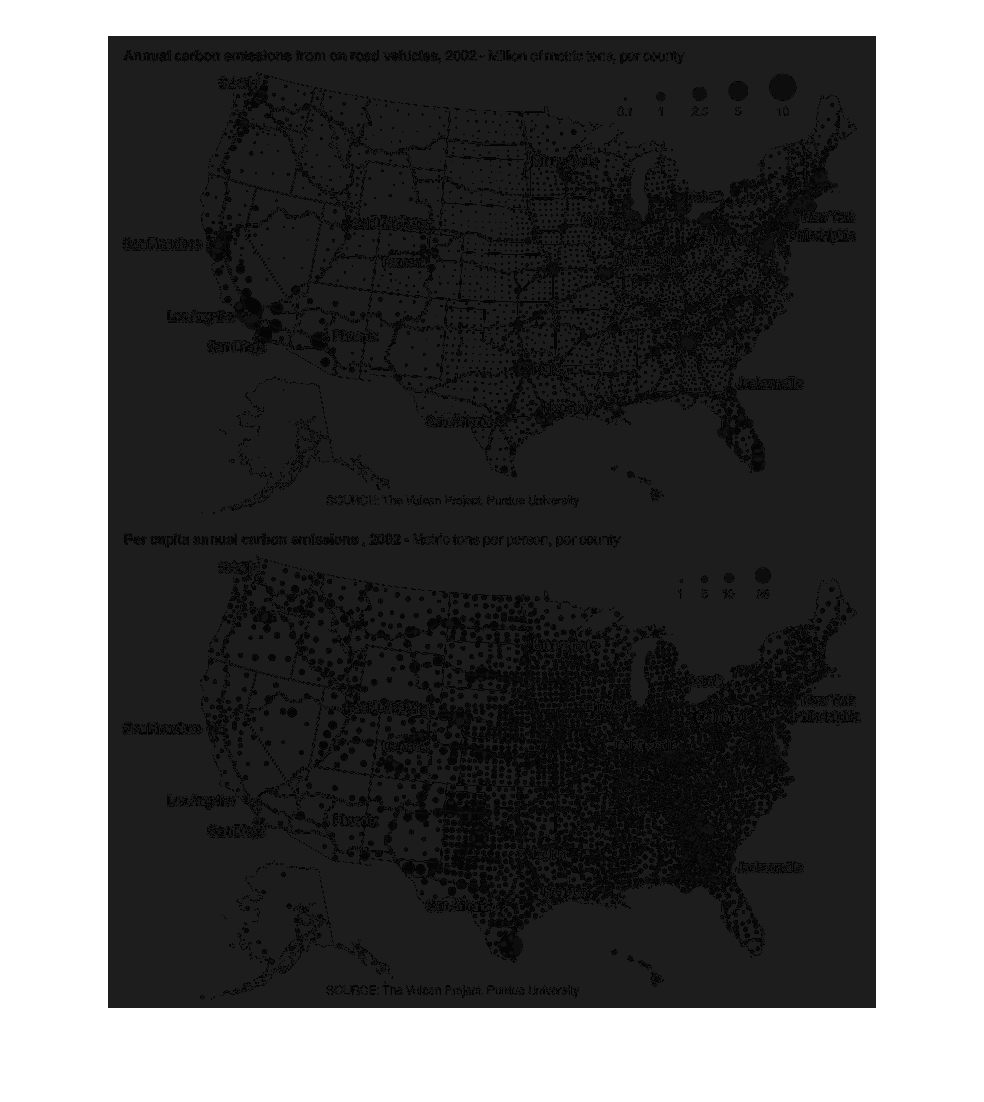
This graphic looks at the annual automobile carbon emissions both per capita and total in
the individual regions of the United States. Not surprisingly, the biggest emissions numbers
are coming from the larger cities in the United States.
Error using .*
Matrix dimensions must agree.

Error in plotSpotlight (line 30)
    output = repmat(a,[1 1 3]).*single(im)/255;

Error in plot_individual_user_maps (line 49)
        [heat] = plotSpotlight(im,heatmap,3);