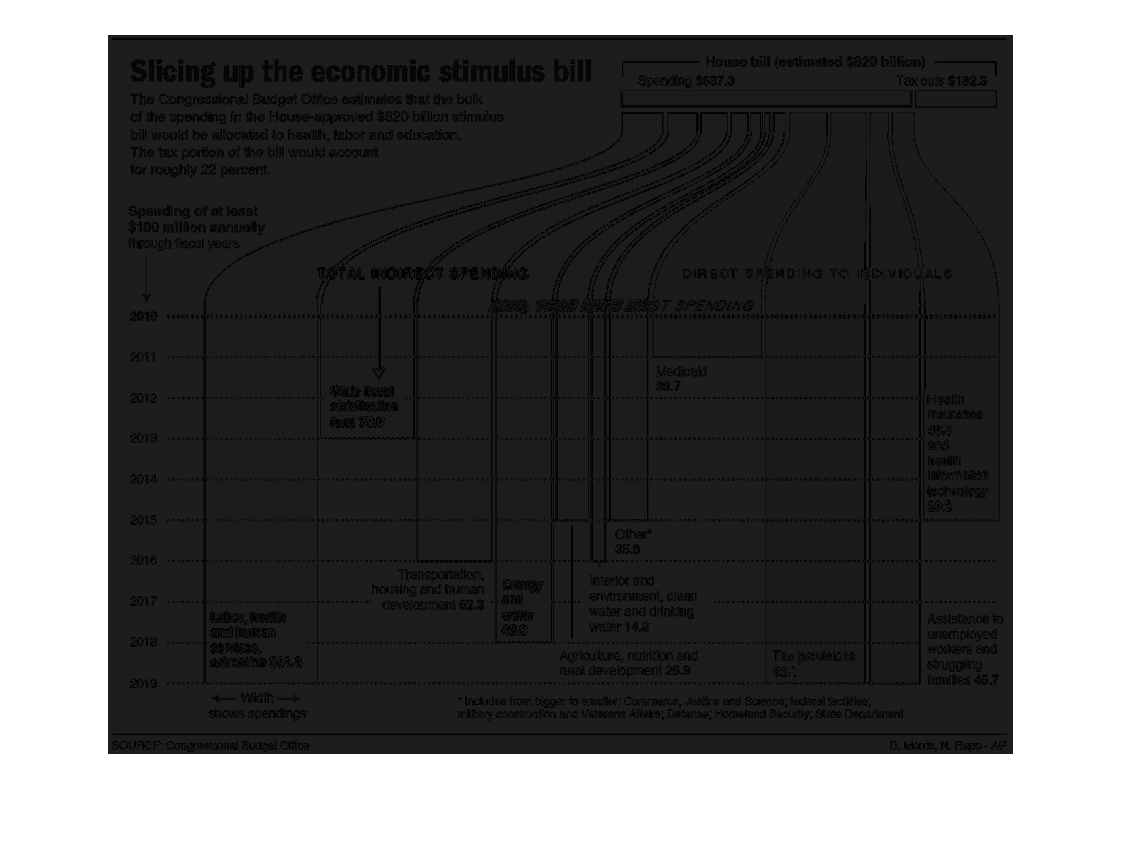
The graph on the right is deciphering the economic stimulus bill. It shows where the money
will be going to throughout the year 2019. The dark blue represents spending, while the light
blue represents tax cuts.
Error using .*
Matrix dimensions must agree.

Error in plotSpotlight (line 30)
    output = repmat(a,[1 1 3]).*single(im)/255;

Error in plot_individual_user_maps (line 49)
        [heat] = plotSpotlight(im,heatmap,3);