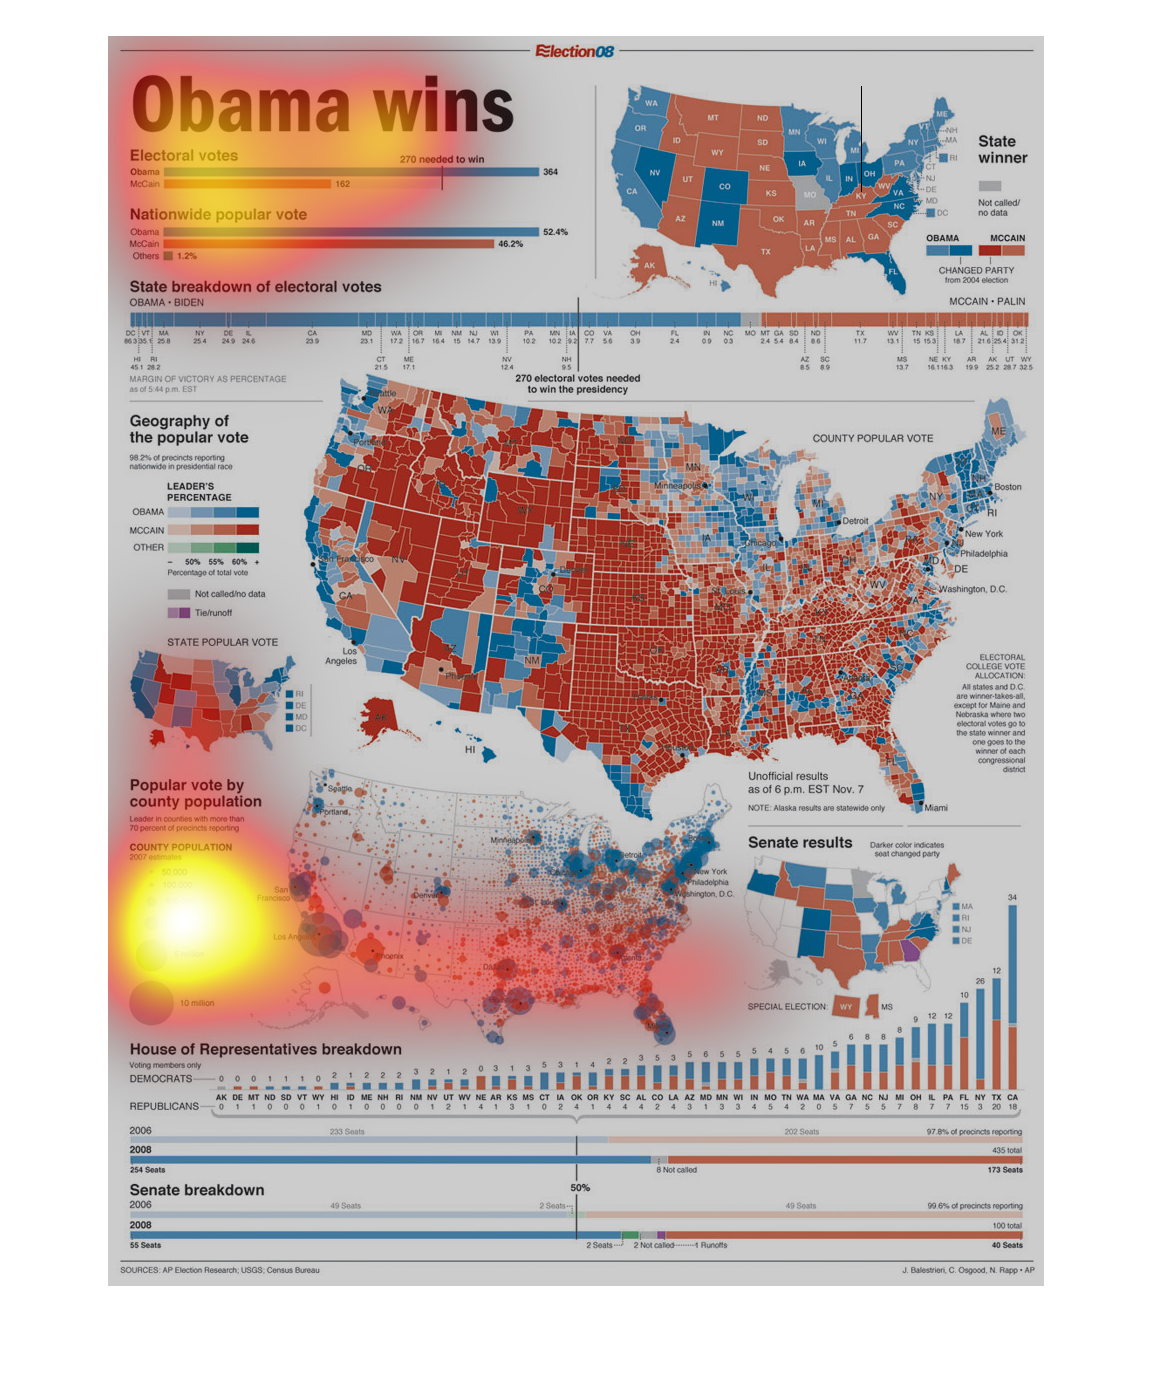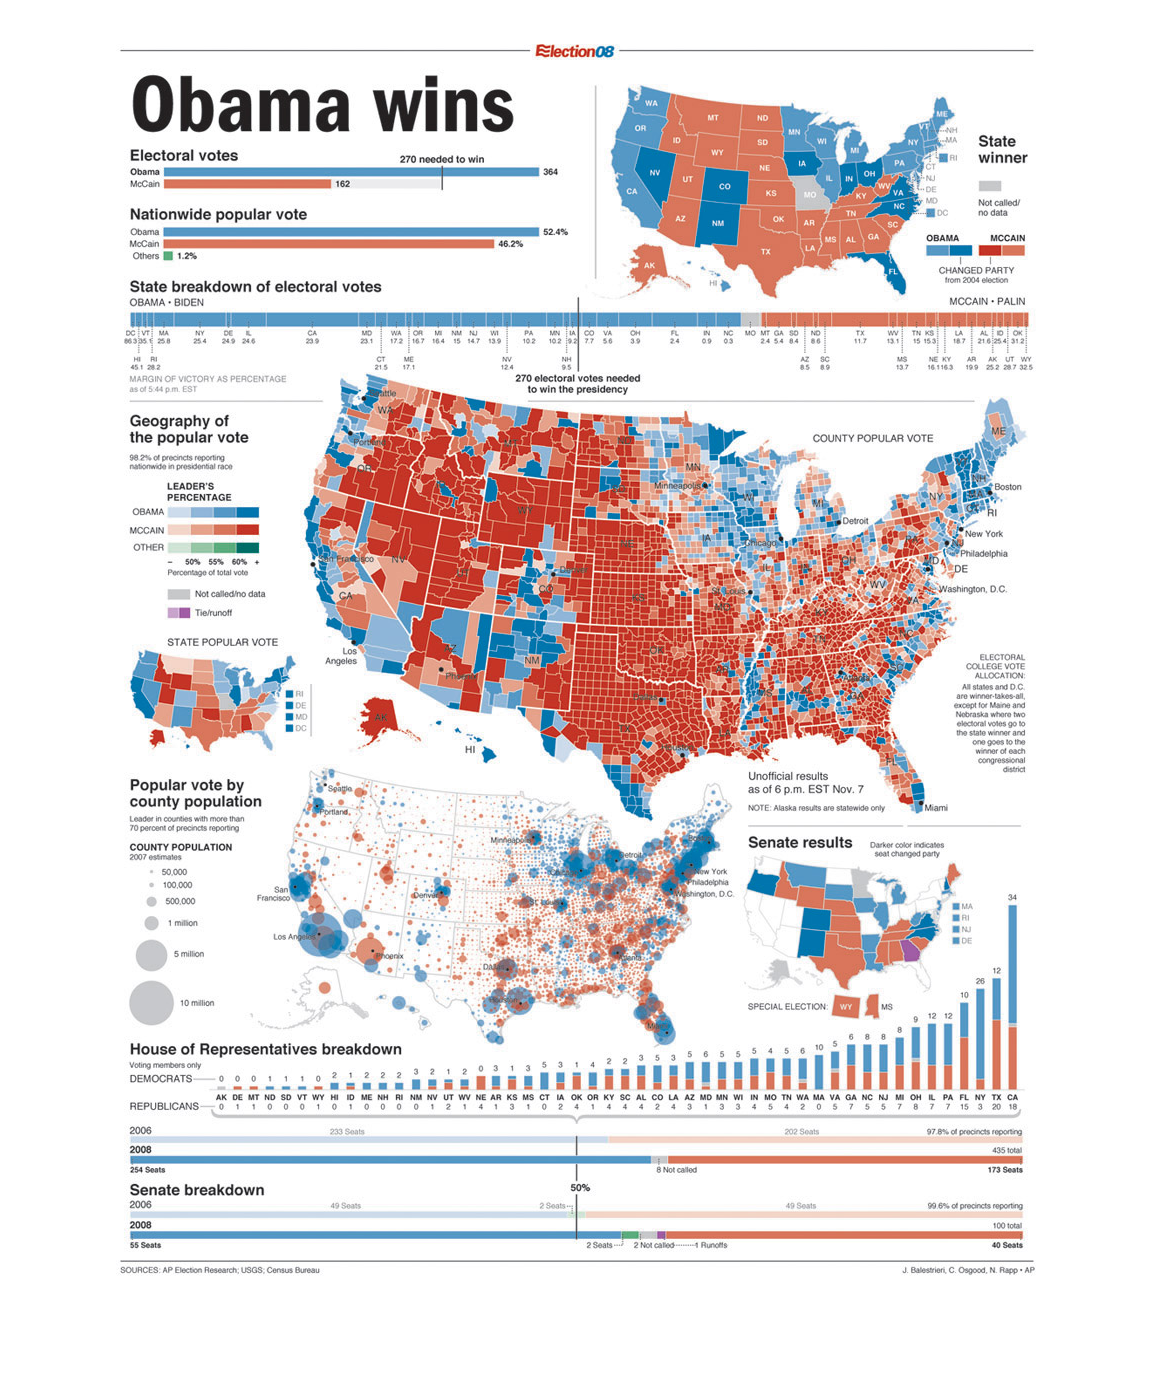
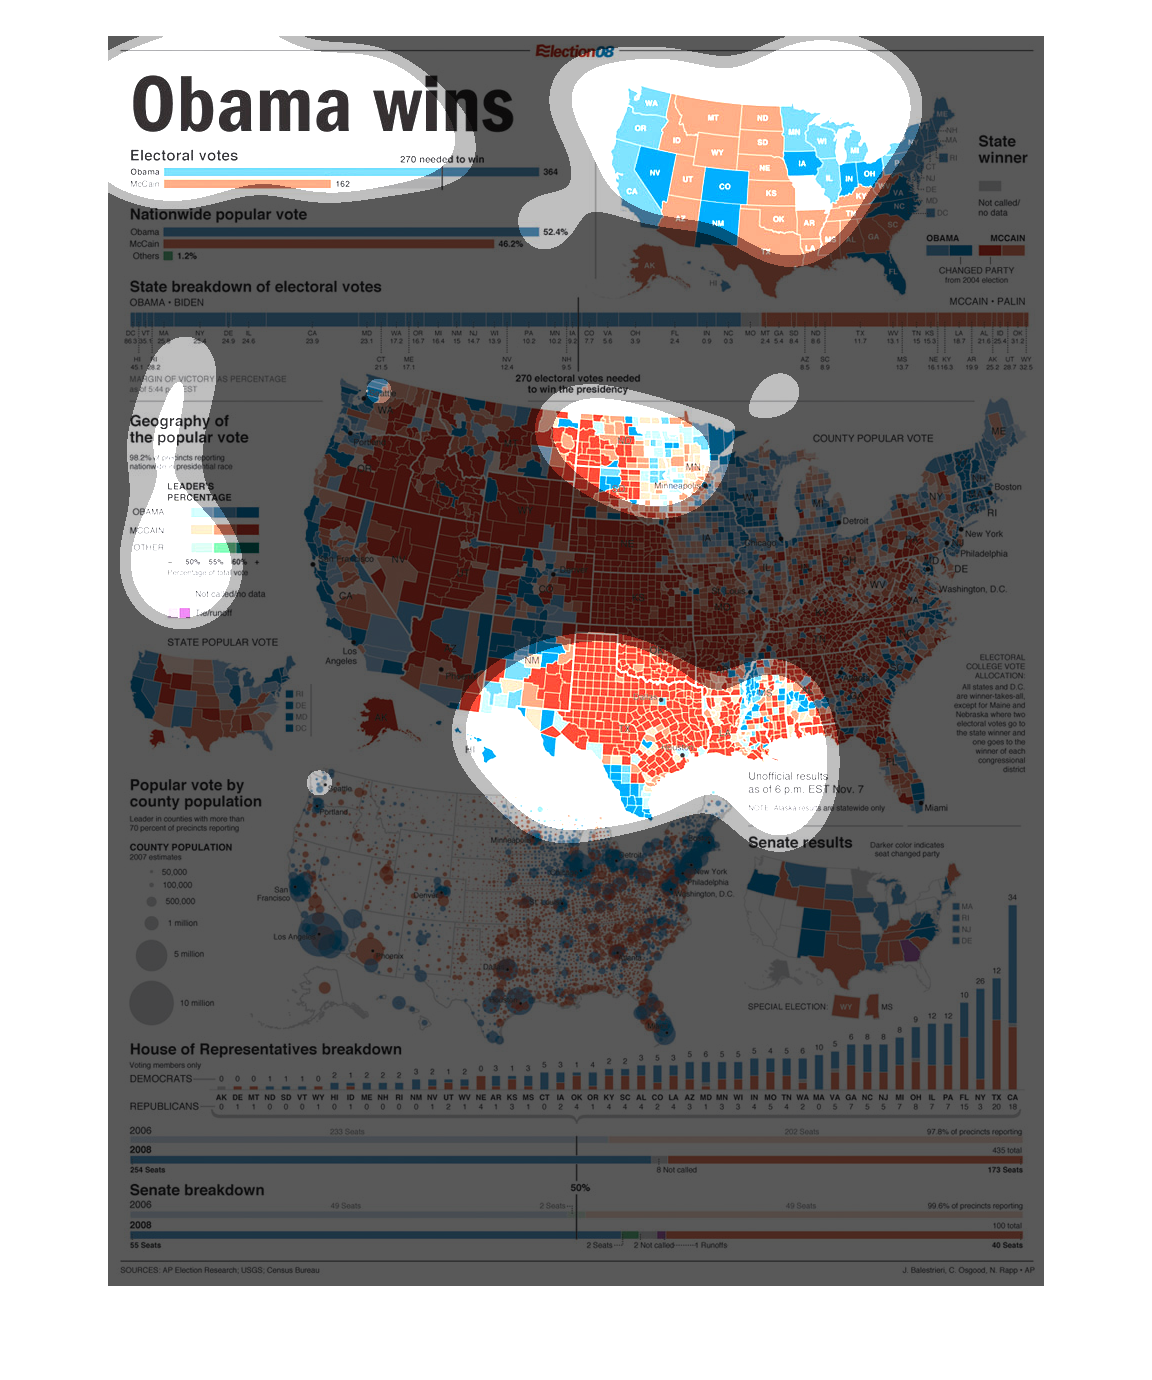
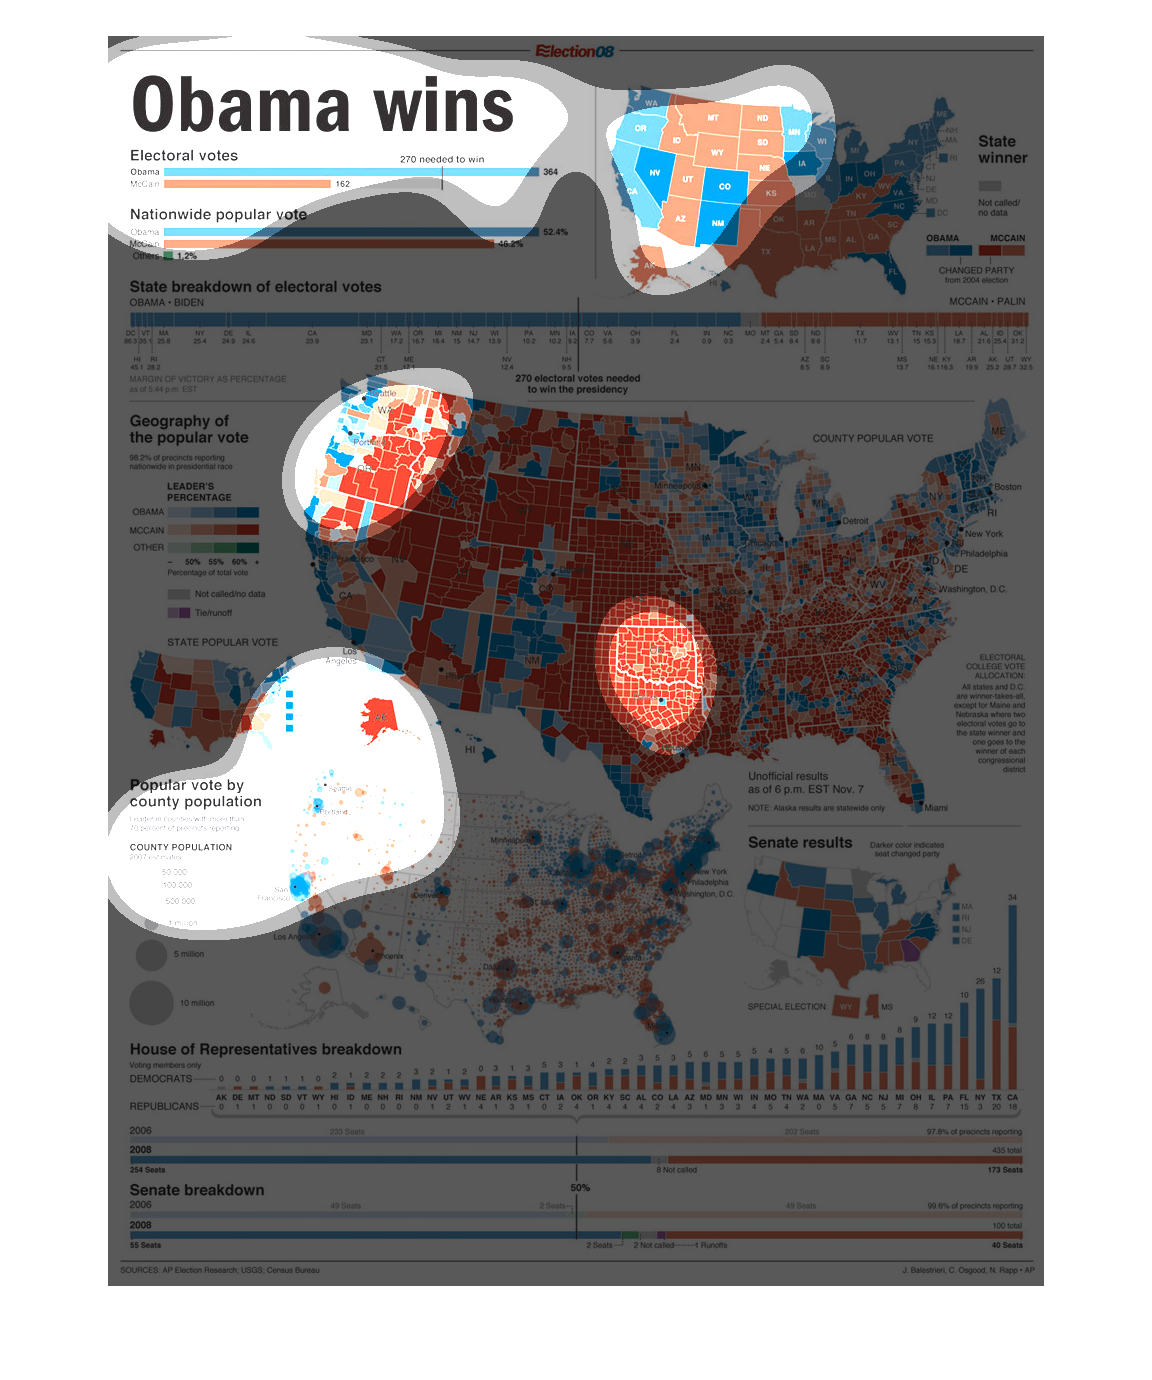
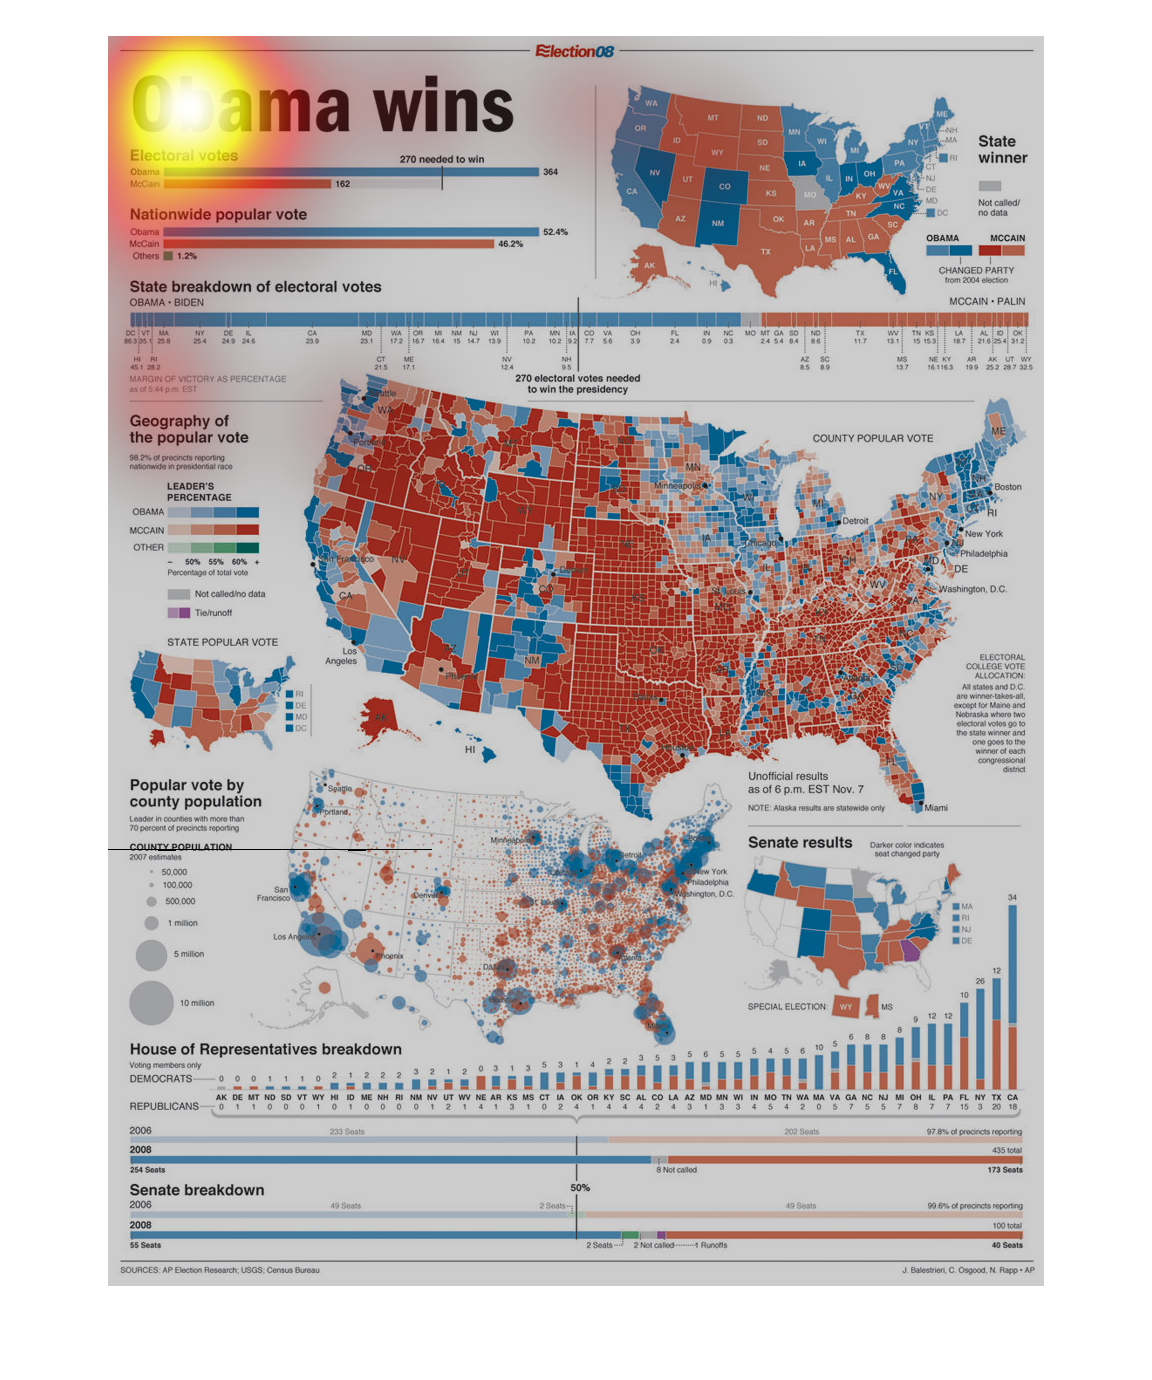
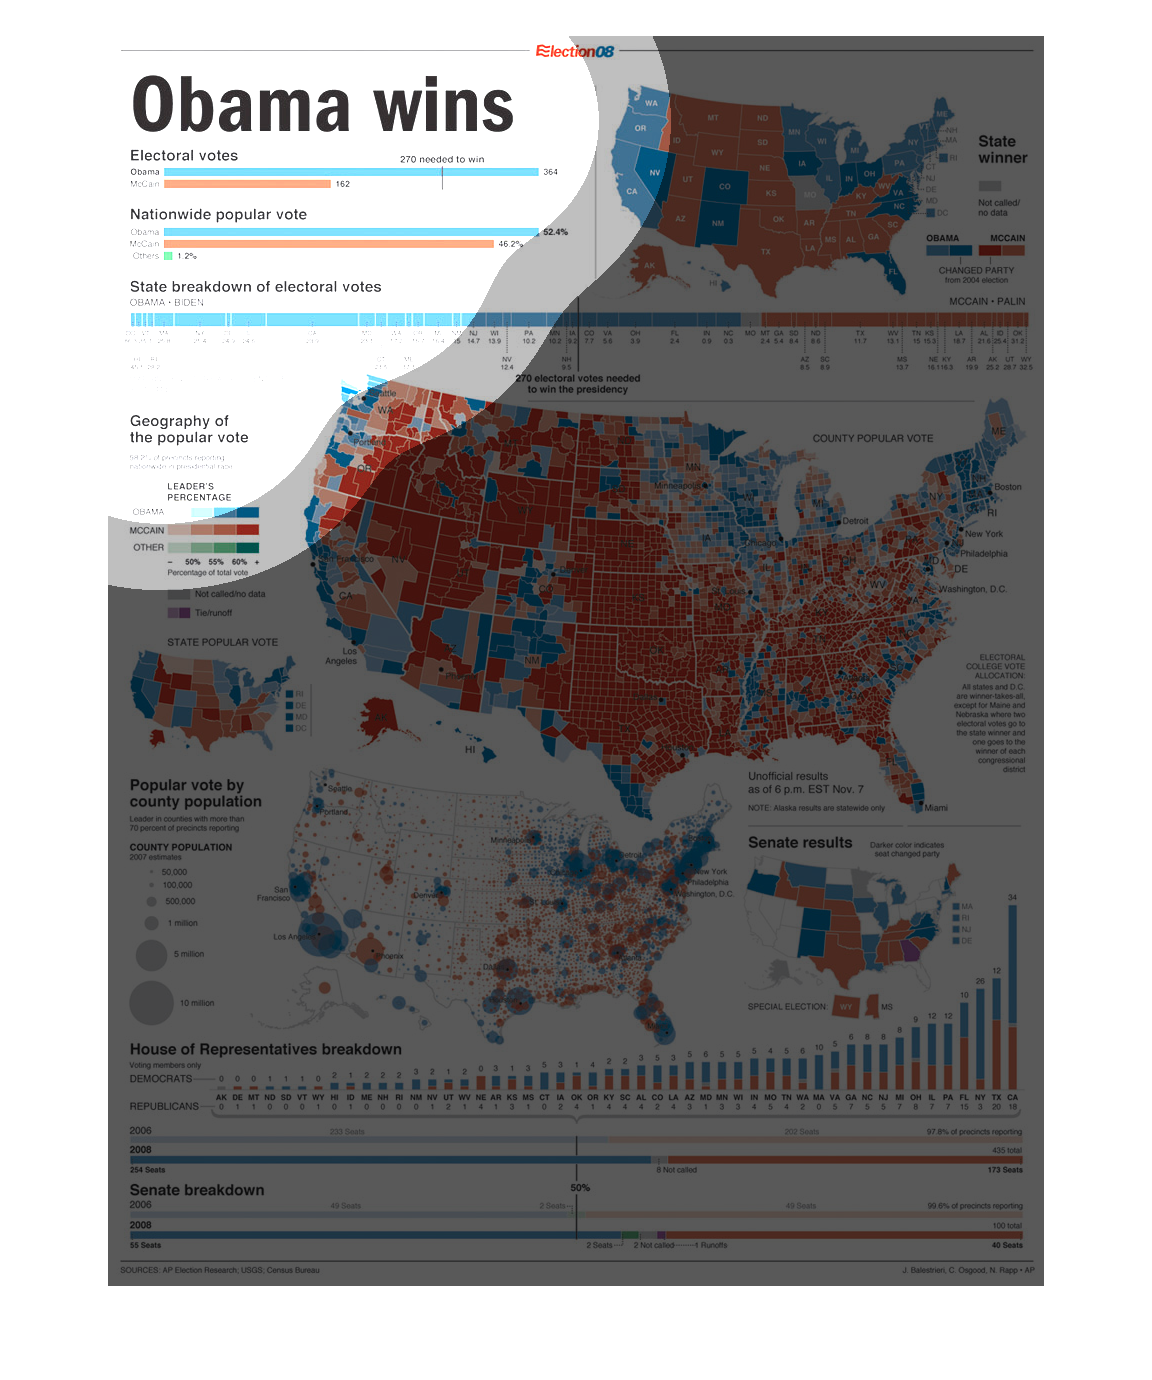
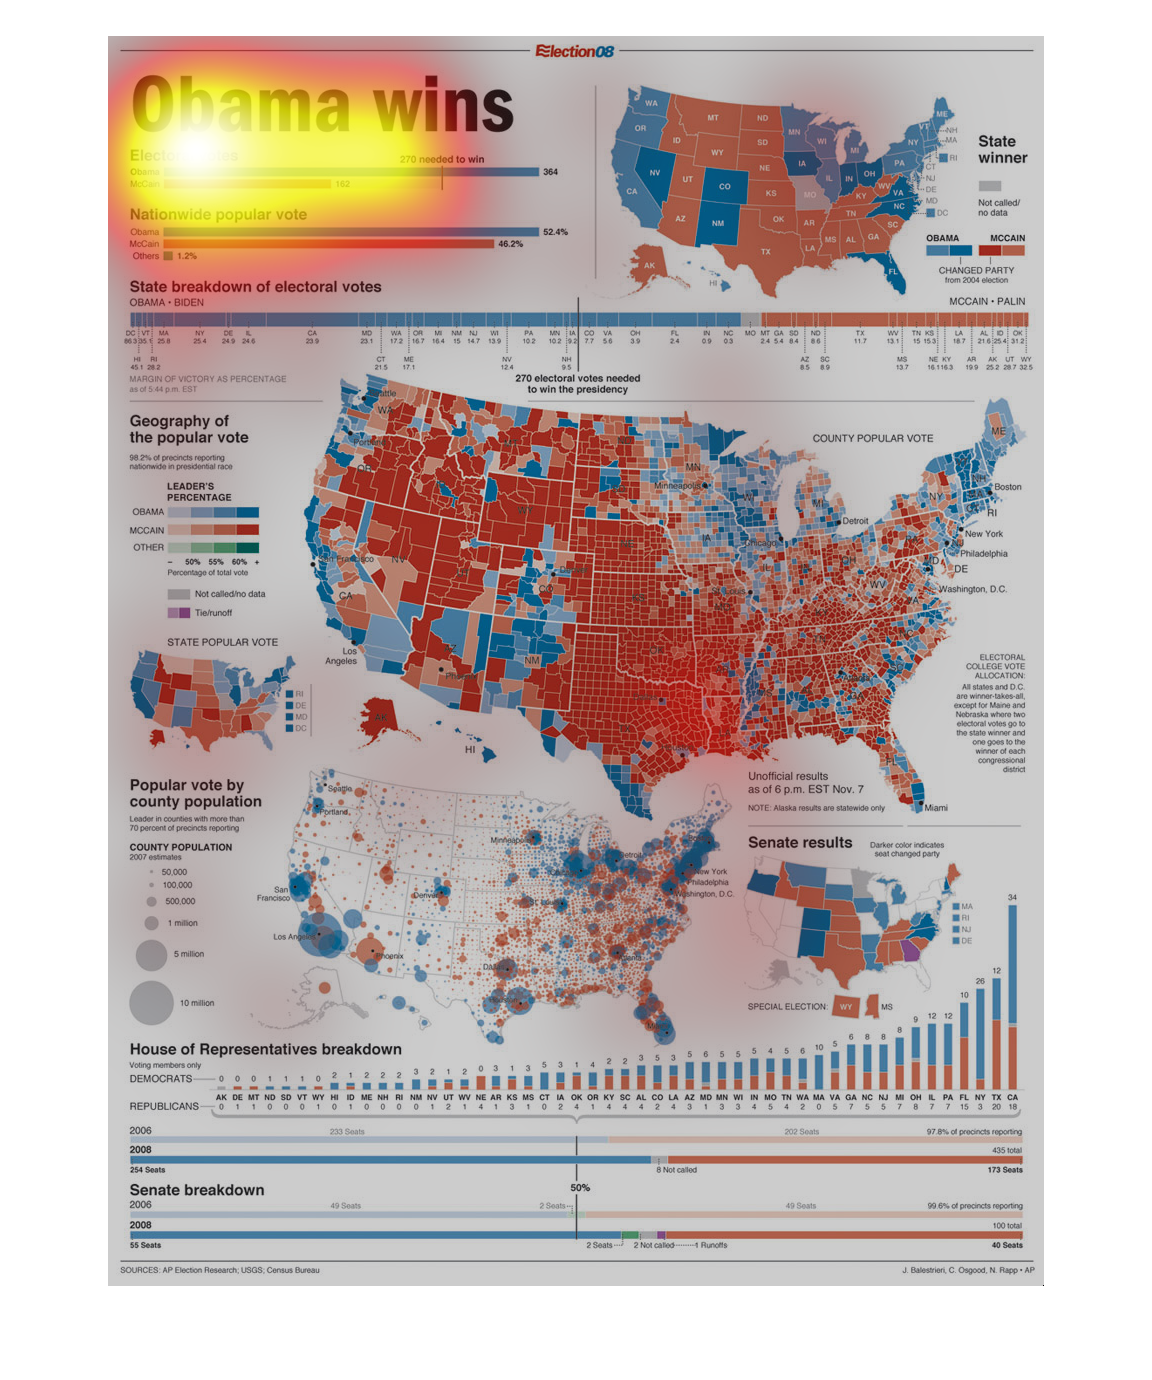
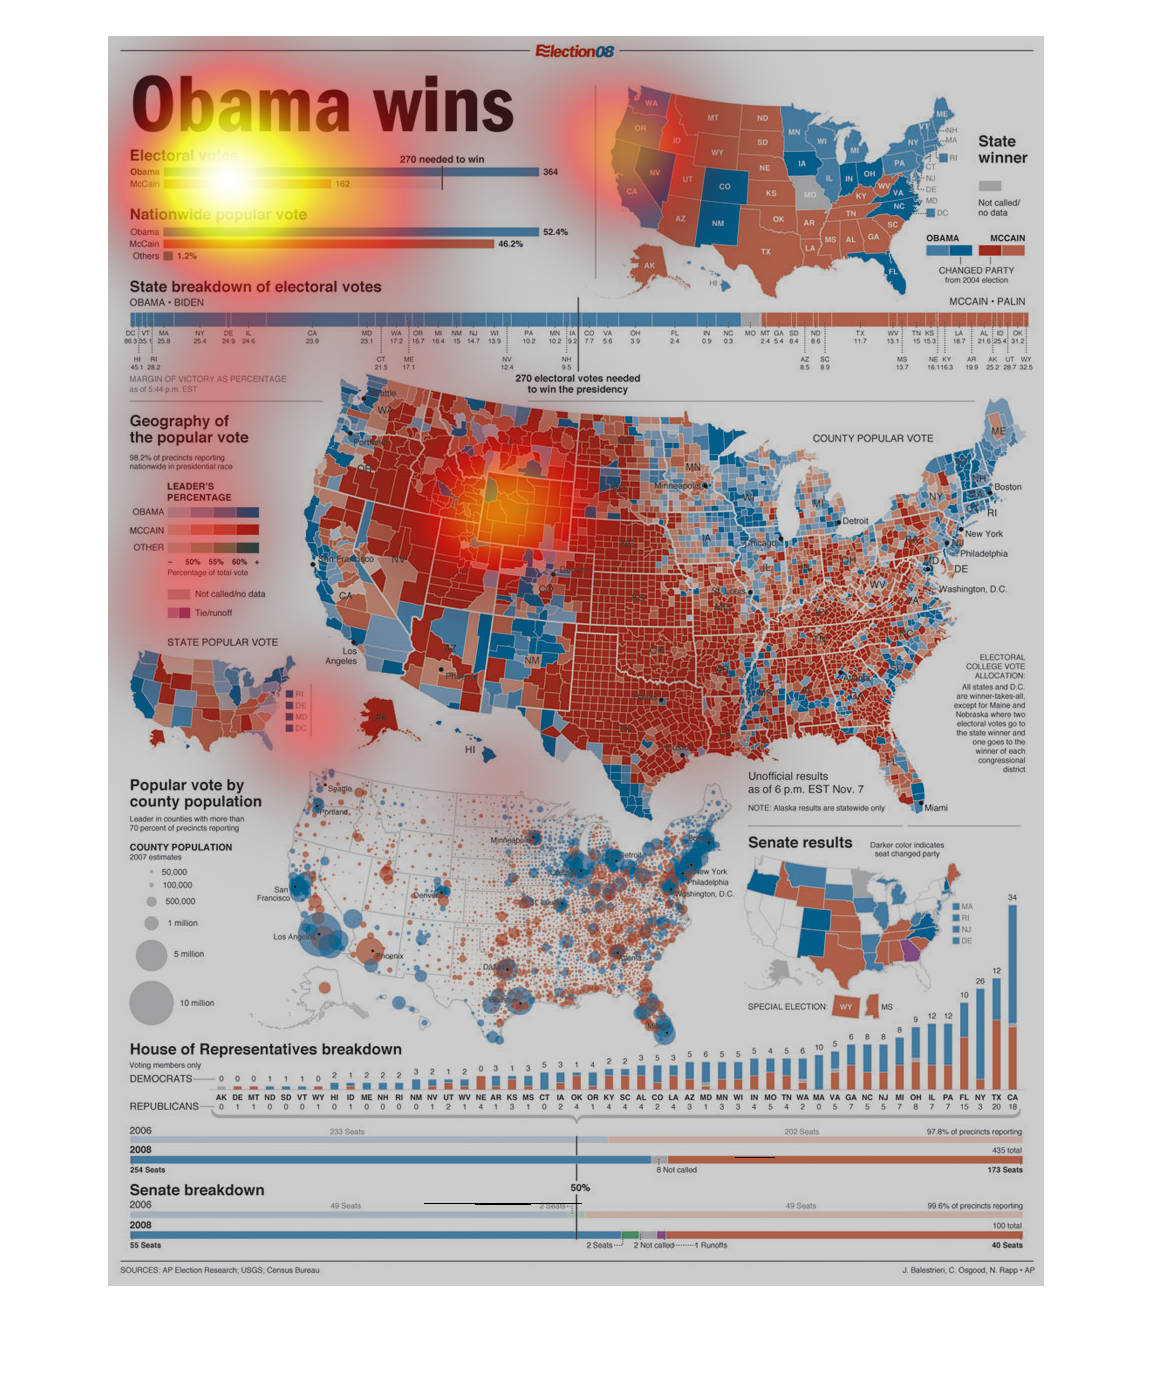
THIS PLOT SHOWS FIRST, THE ELECTORAL VOTE BY STATE FOR THE 2008 ELECTION, FOLLOWED BY A COUNTY
MAP BROKEN DOWN BY PARTY, FOLLOWED BY A MAP WHICH SHOWS WHICH PARTY WON EACH COUNTY WITH CIRCLES
TO EXPRESS COUNTY SIZE.

This is a map of the election results. A map by state is in the top right corner. The main
map in the center is split into counties. Blue means democrat and red means Republican. Several
other smaller maps show different details.

This is a map that shows the wins that the current president Barack Obama had in the election.
It shows the various states and the wins that the president got against the republican opponent.
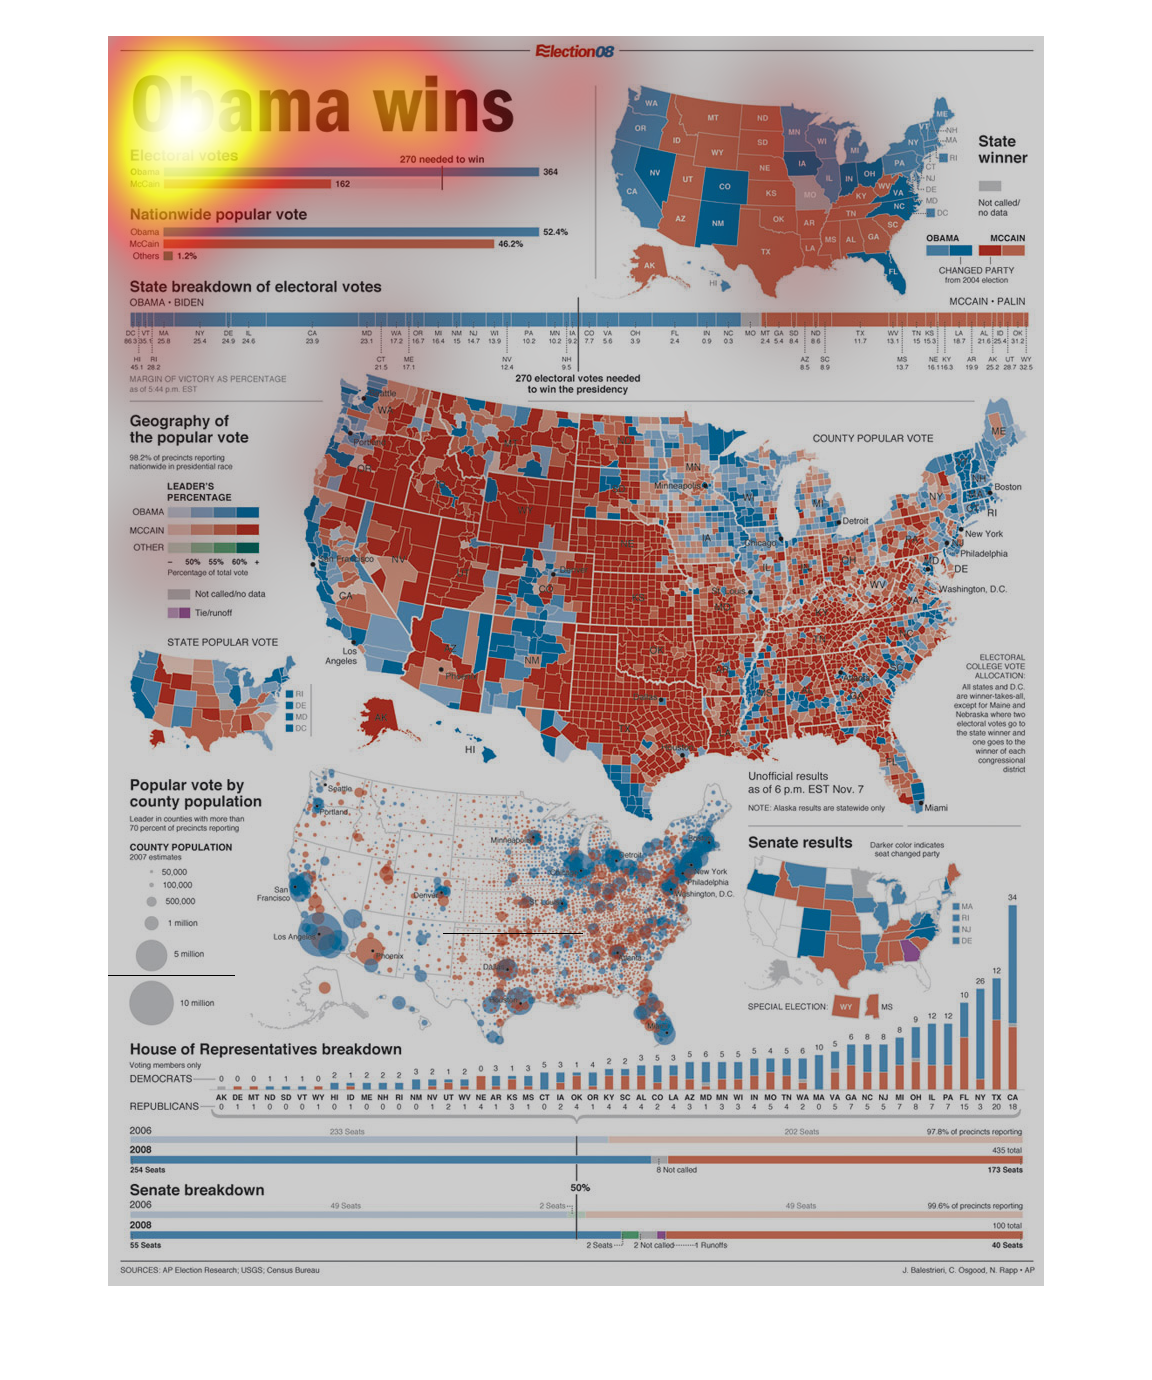
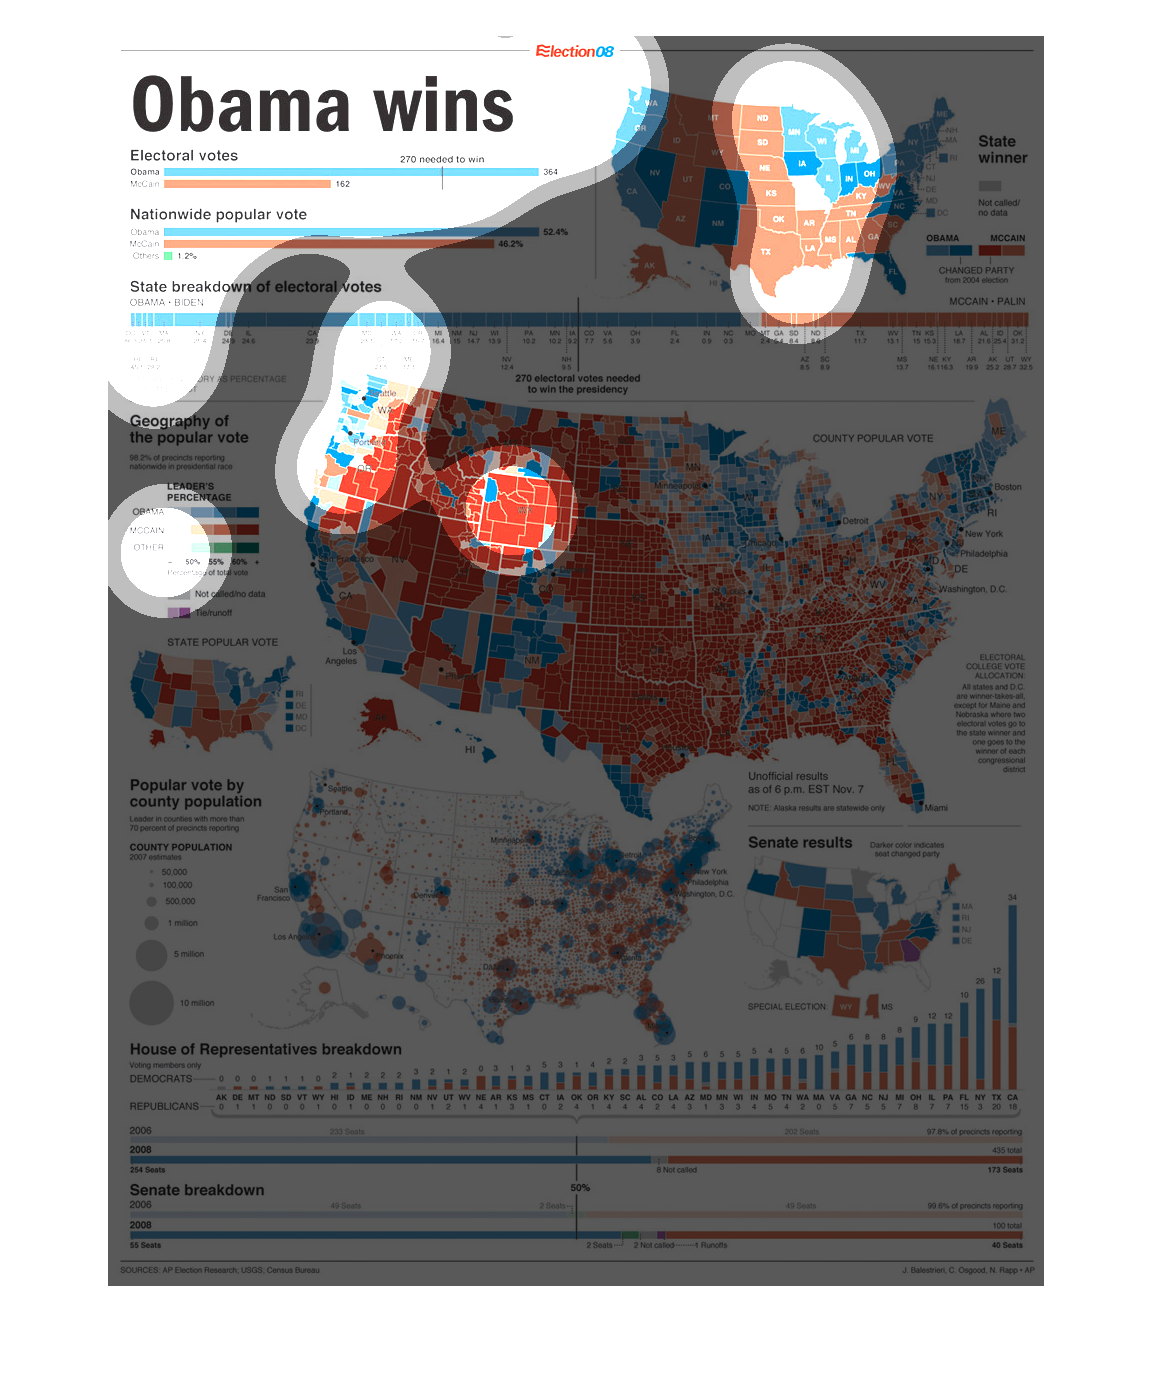
A map infographic of Obama wins for the election. It shows US map and cities and counties
with coloring showing winning candidates. Shows rural aread didn't vote for him

Obama wins as detailed on a color coded geomap of the united states, red and blue used to
highlight wins and losses. Electoral and popular votes are accounted for. unfortunately the
words are too small for me to read


This chart is very interesting, and shows Obama wins by nation. It shows the electoral votes
in bars. It also shows the geography of the popular votes.
This is a series of charts, graphs and maps depicting the victory of Barak Obama in the 2008
presidential election broken down by state and then individual districts.

This chart describes Obama wins in electoral votes in a state break down of the electoral
votes. It also includes a geography of the popular vote in the country,
This chart shows the results of the 2008 election between President Obama and John McCain.
It reveals that Obama had a very definitive lead over McCain in the Electoral College as well
as in the popular vote.

This image shows or depicts in statisical bar graph and geographical formats about the various
areas of the US in which Obama won to become the president.

The information displayed covers the 2008 US election where Obama won.  The text is very small,
but I can tell that a lot of information is displayed in detail.
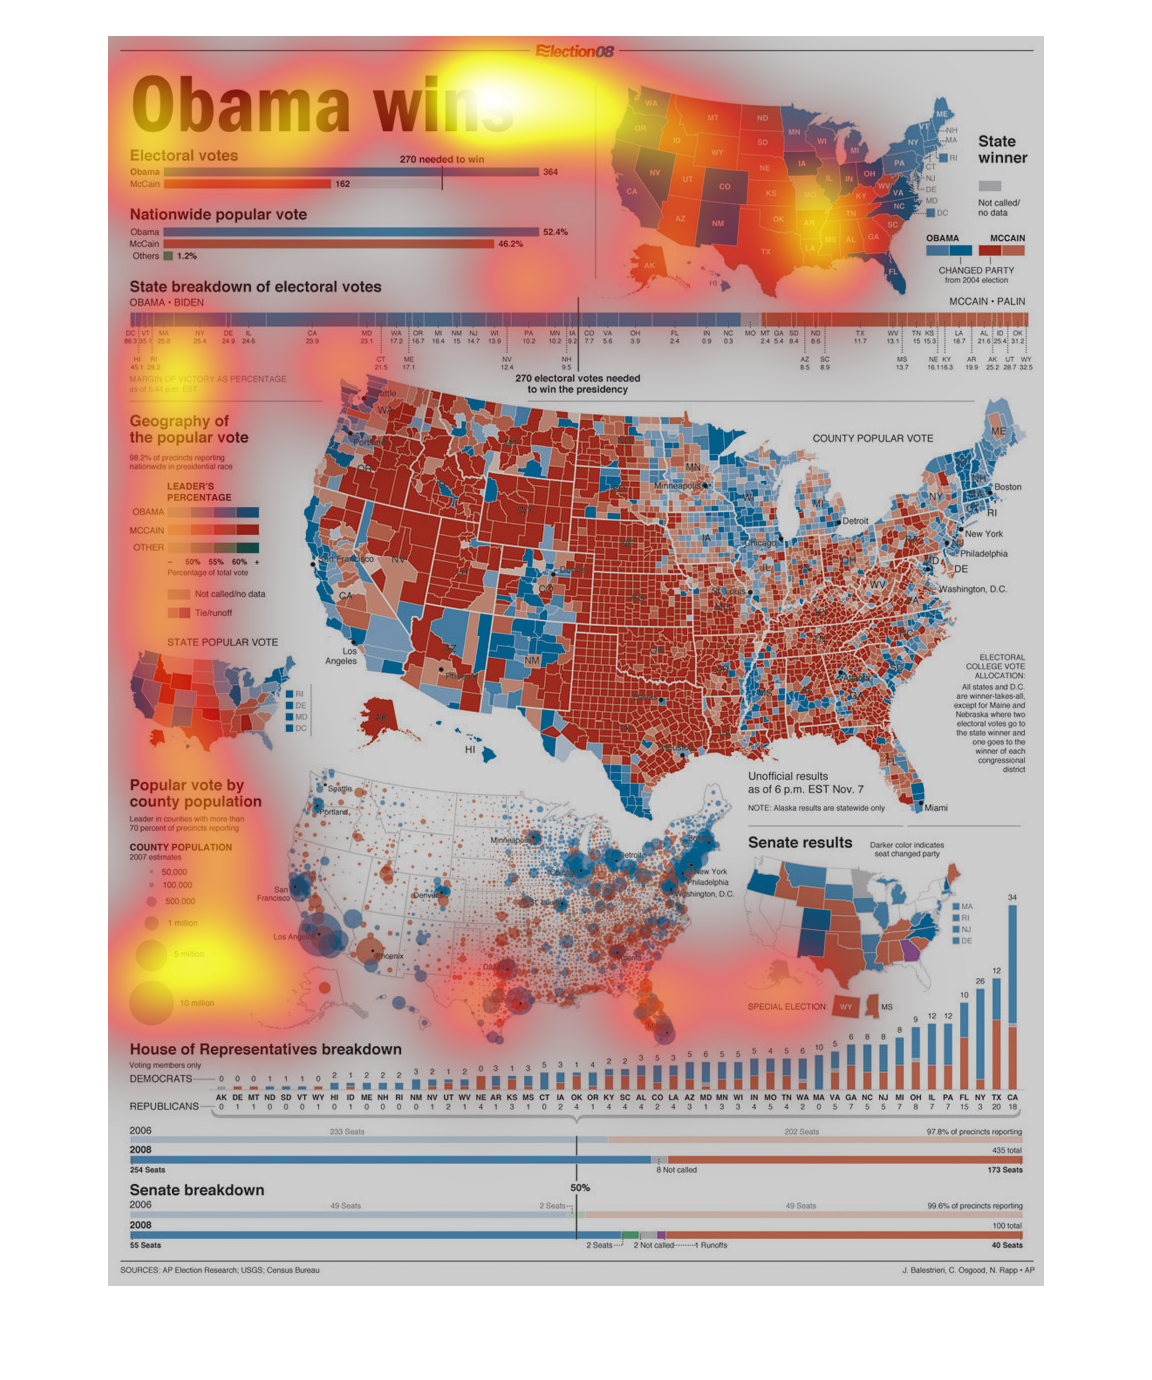
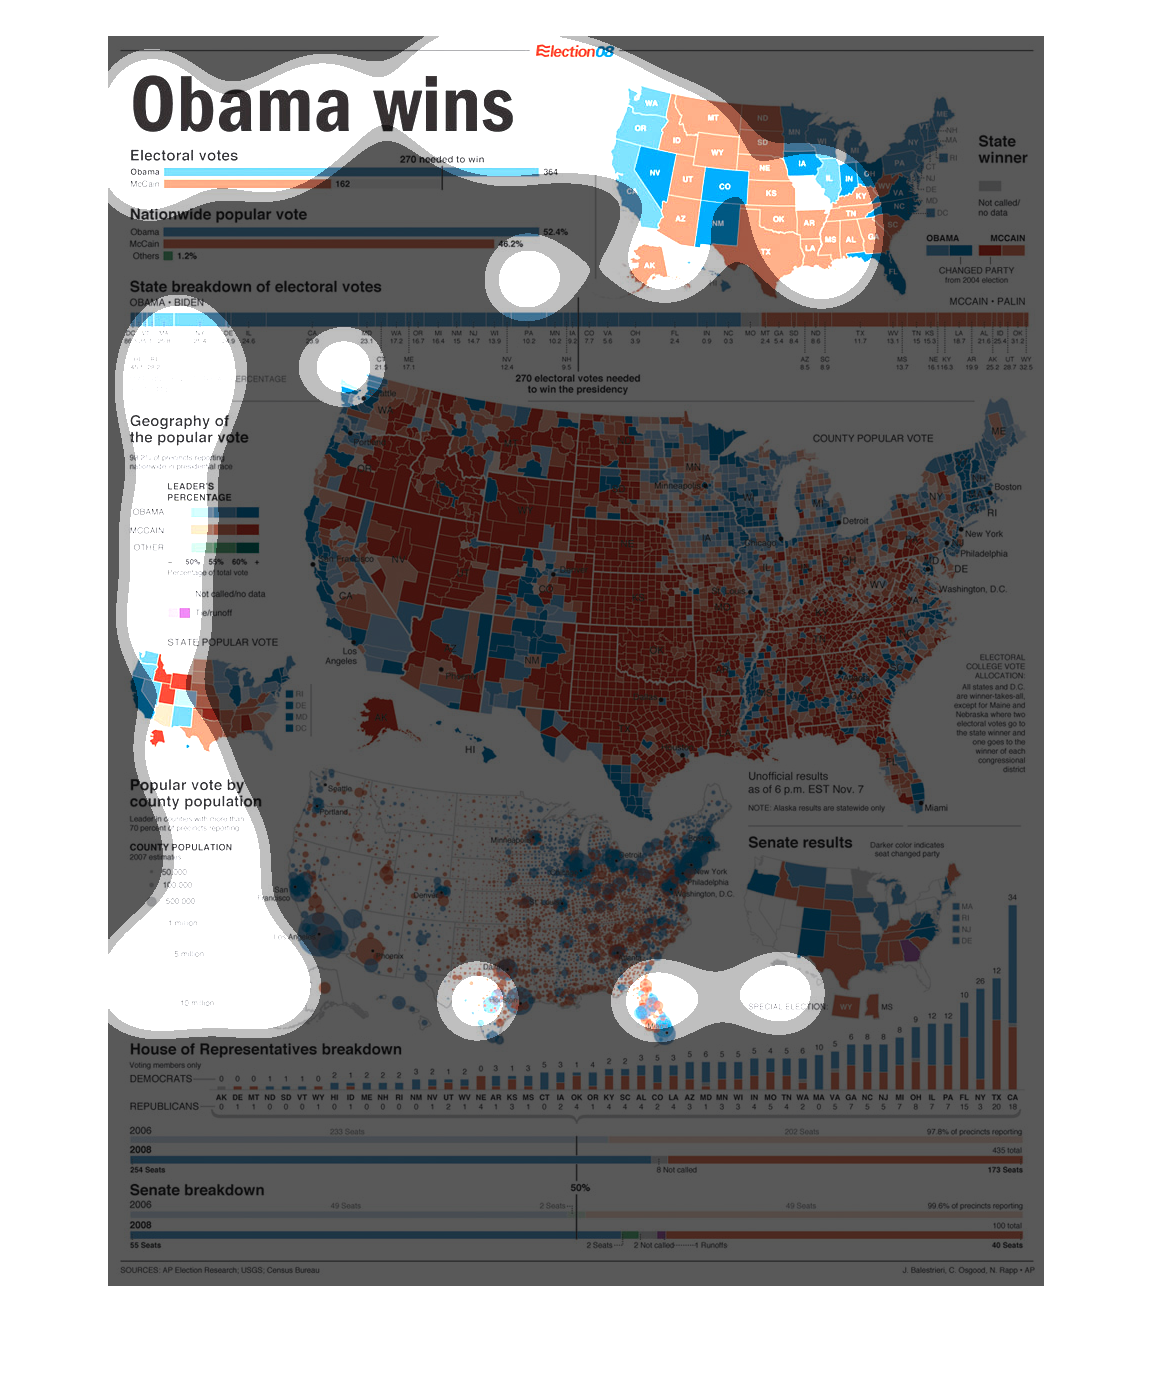
This is a chart showing Obama won the Electoral vote, as well as the popular vote in 2008.
It also shows the senate breakdown, and the House of Representatives breakdown.