this graph show the descrectionary spending of american have been going down recently and
over time has been grdaual compared to how experts see the spending
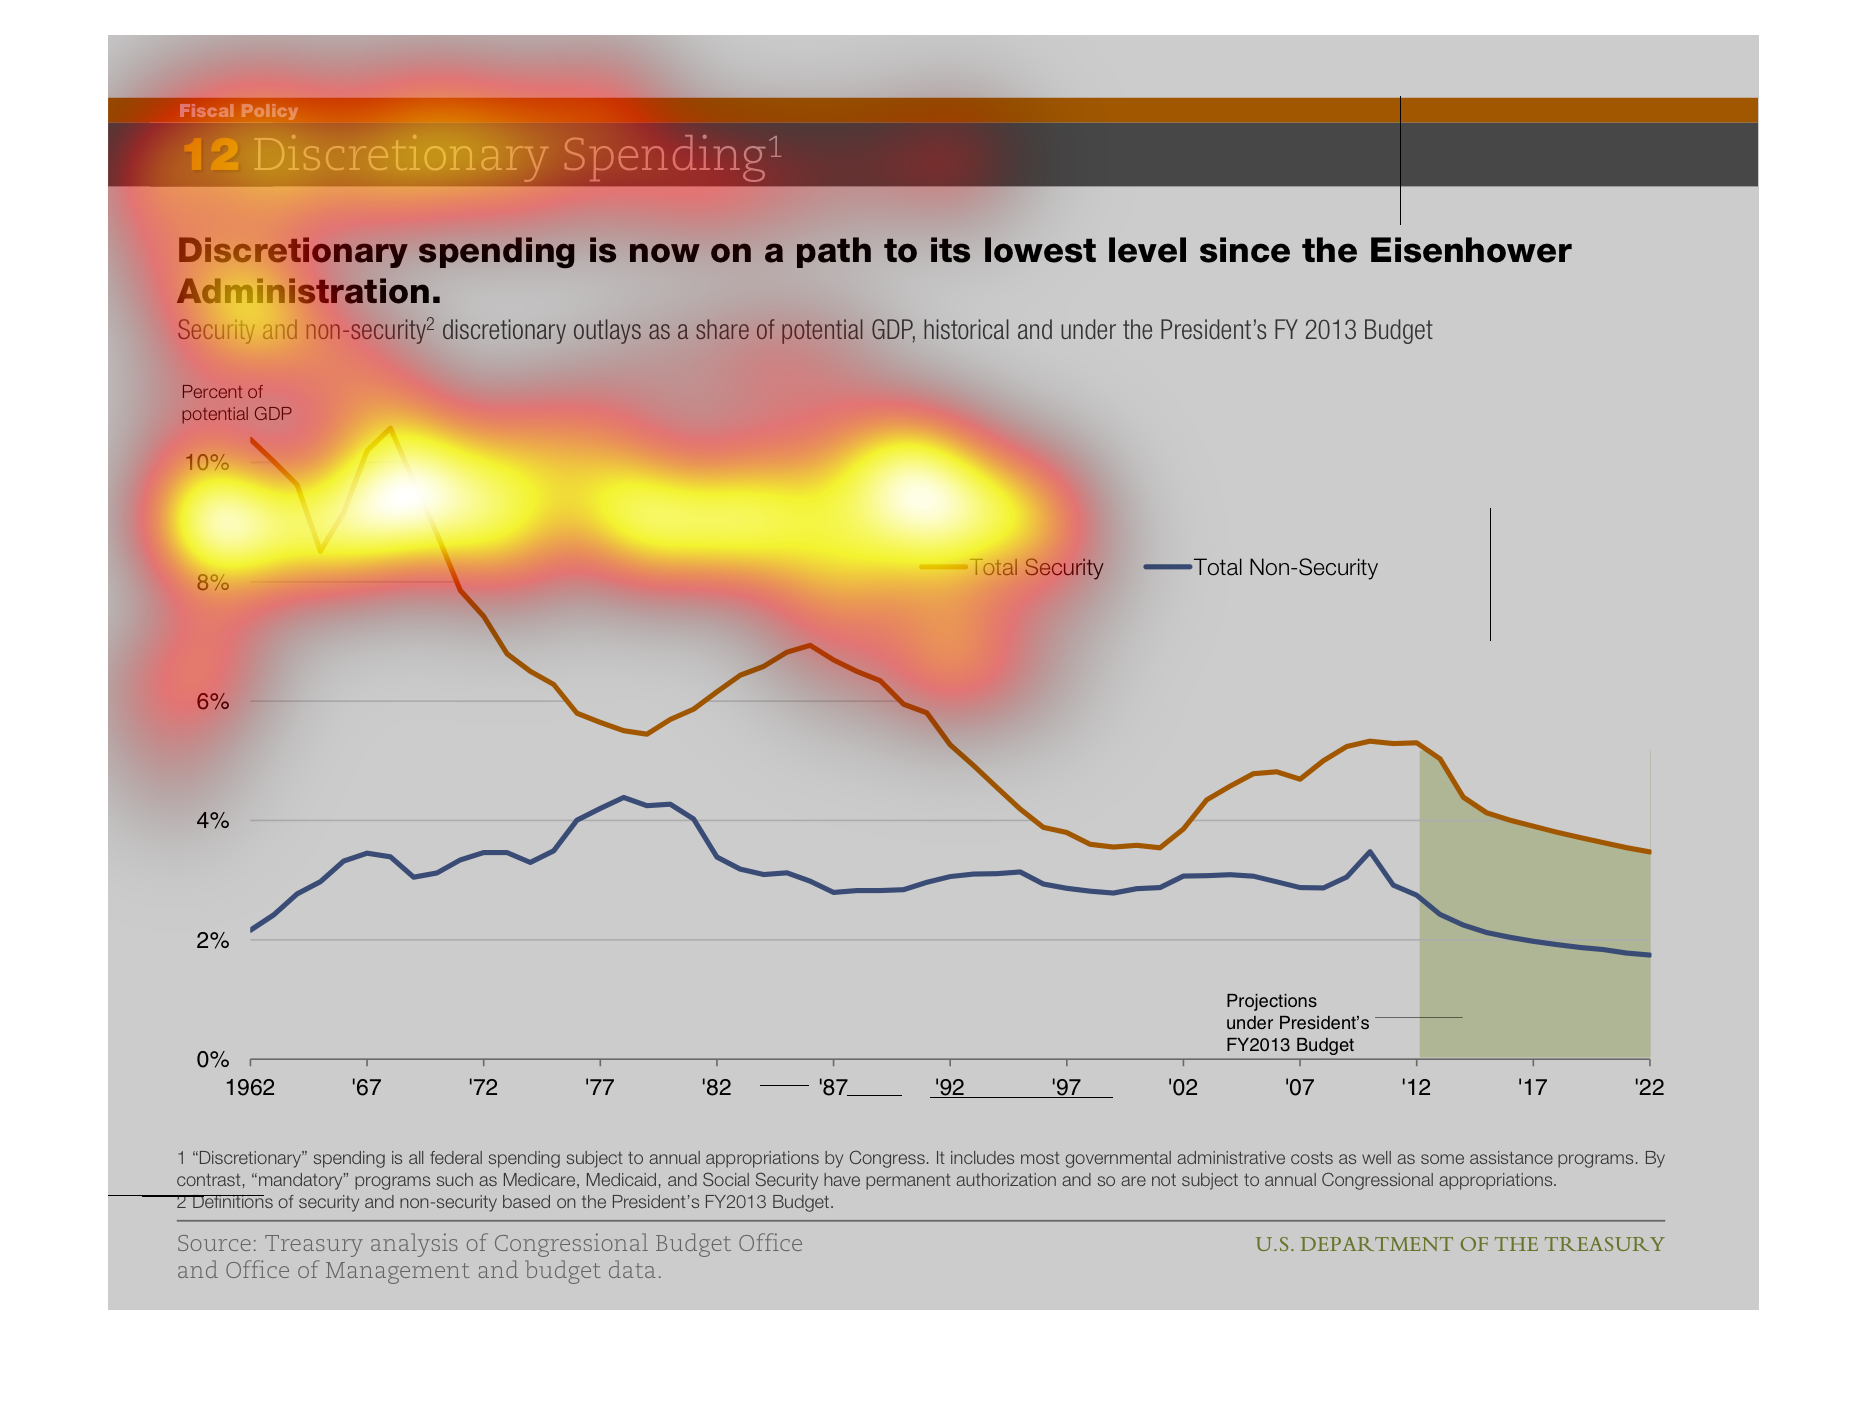
This says discretionary spending is now at its lowest level since the Eisenhower administration.
 It is illustrating discretionary spending from 2007 to 2017.
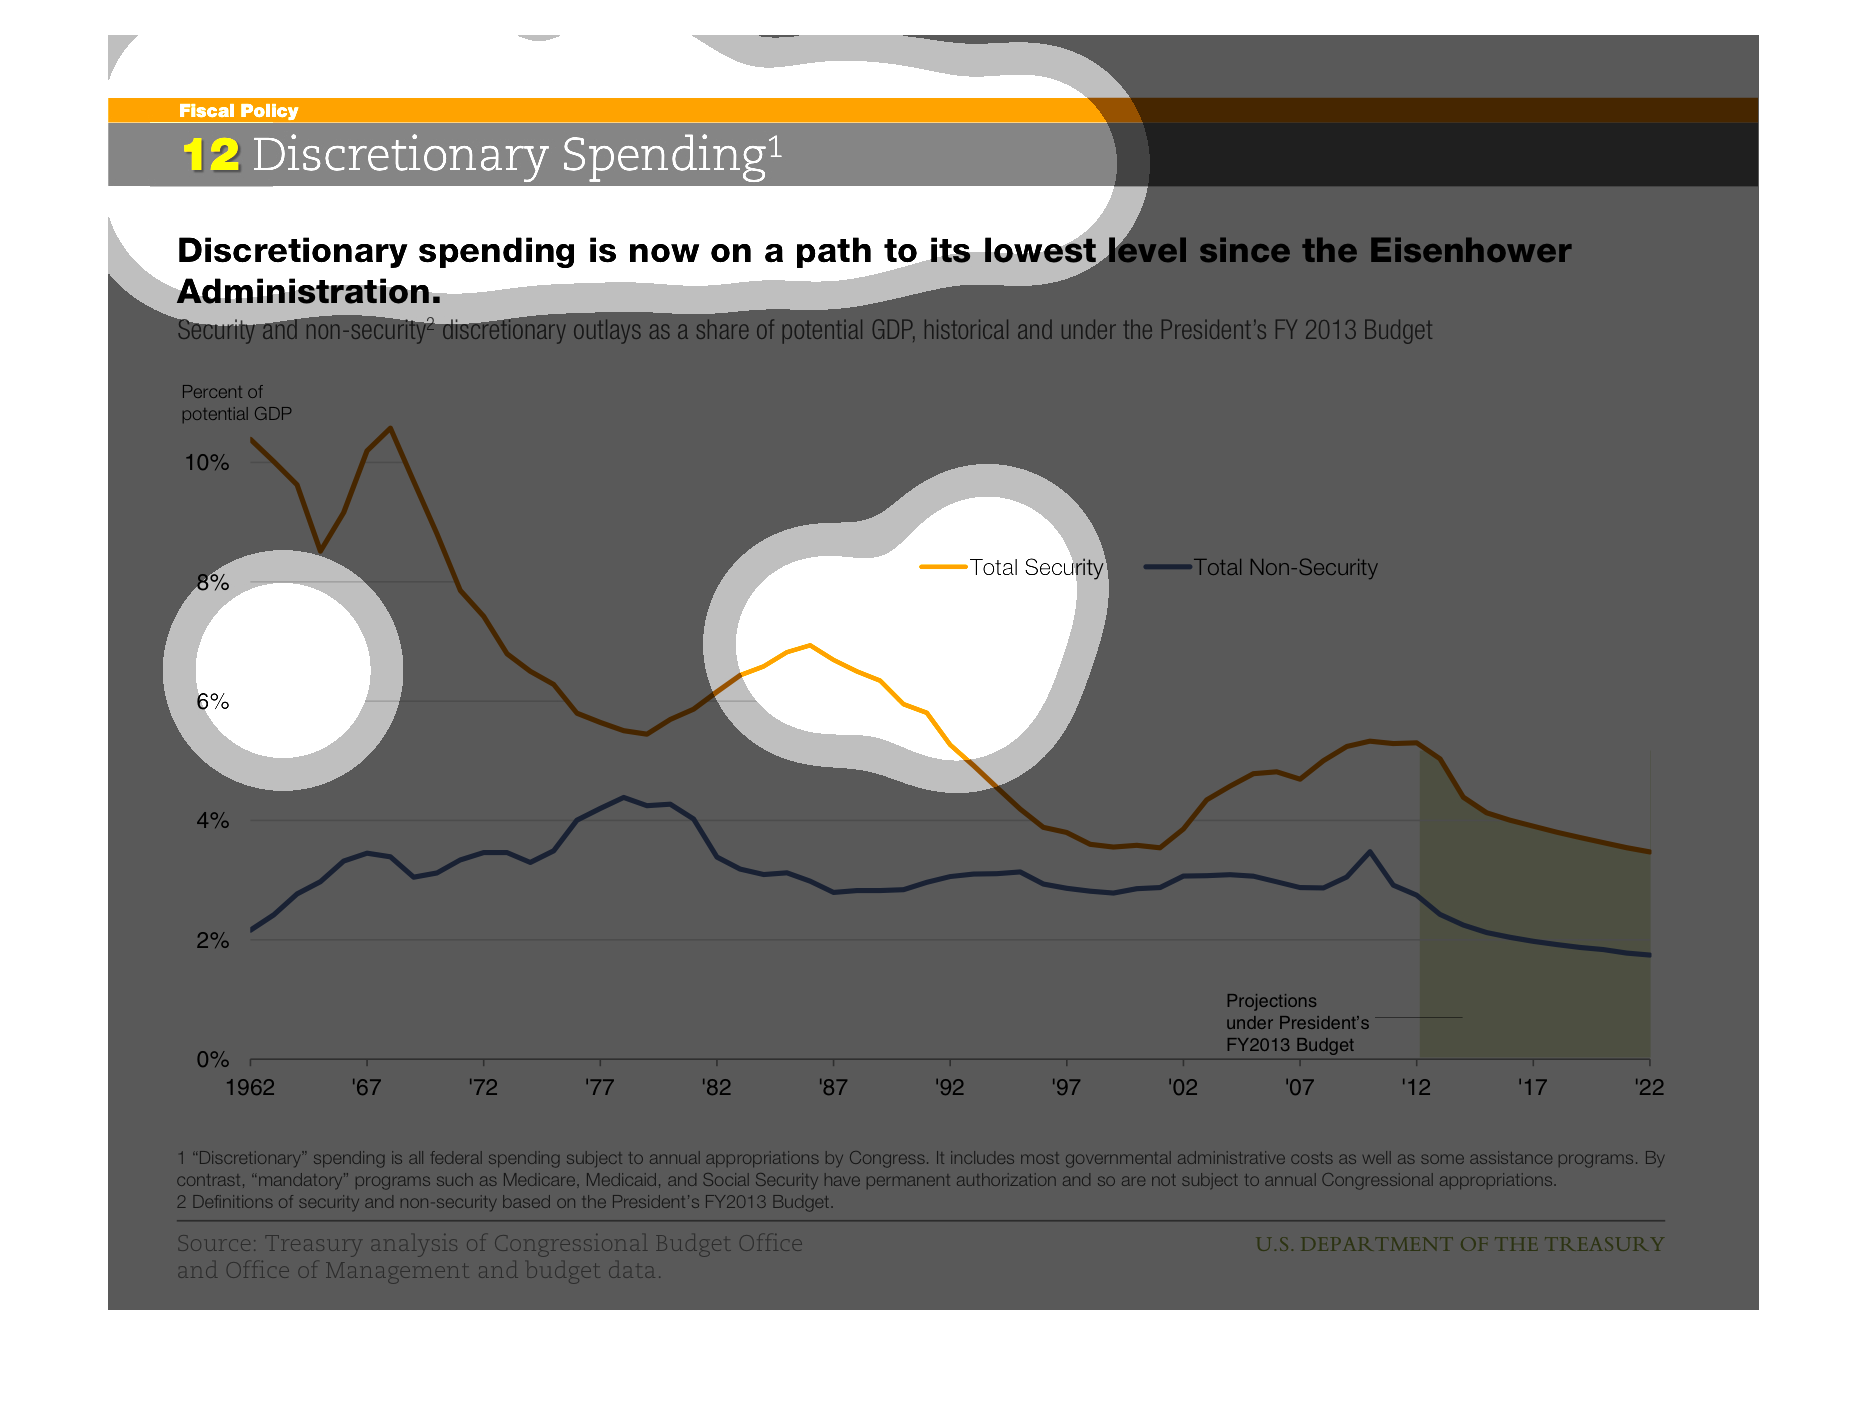
This chart is for Discretionary spending. The discretionary spending is now on a path to its
lowest level since the Eisenhower presidency. This is very interesting.
This chart shows the amount of descertionary spending in congress as compared to the gdp.
Descertionary spending has decreased according to the chart
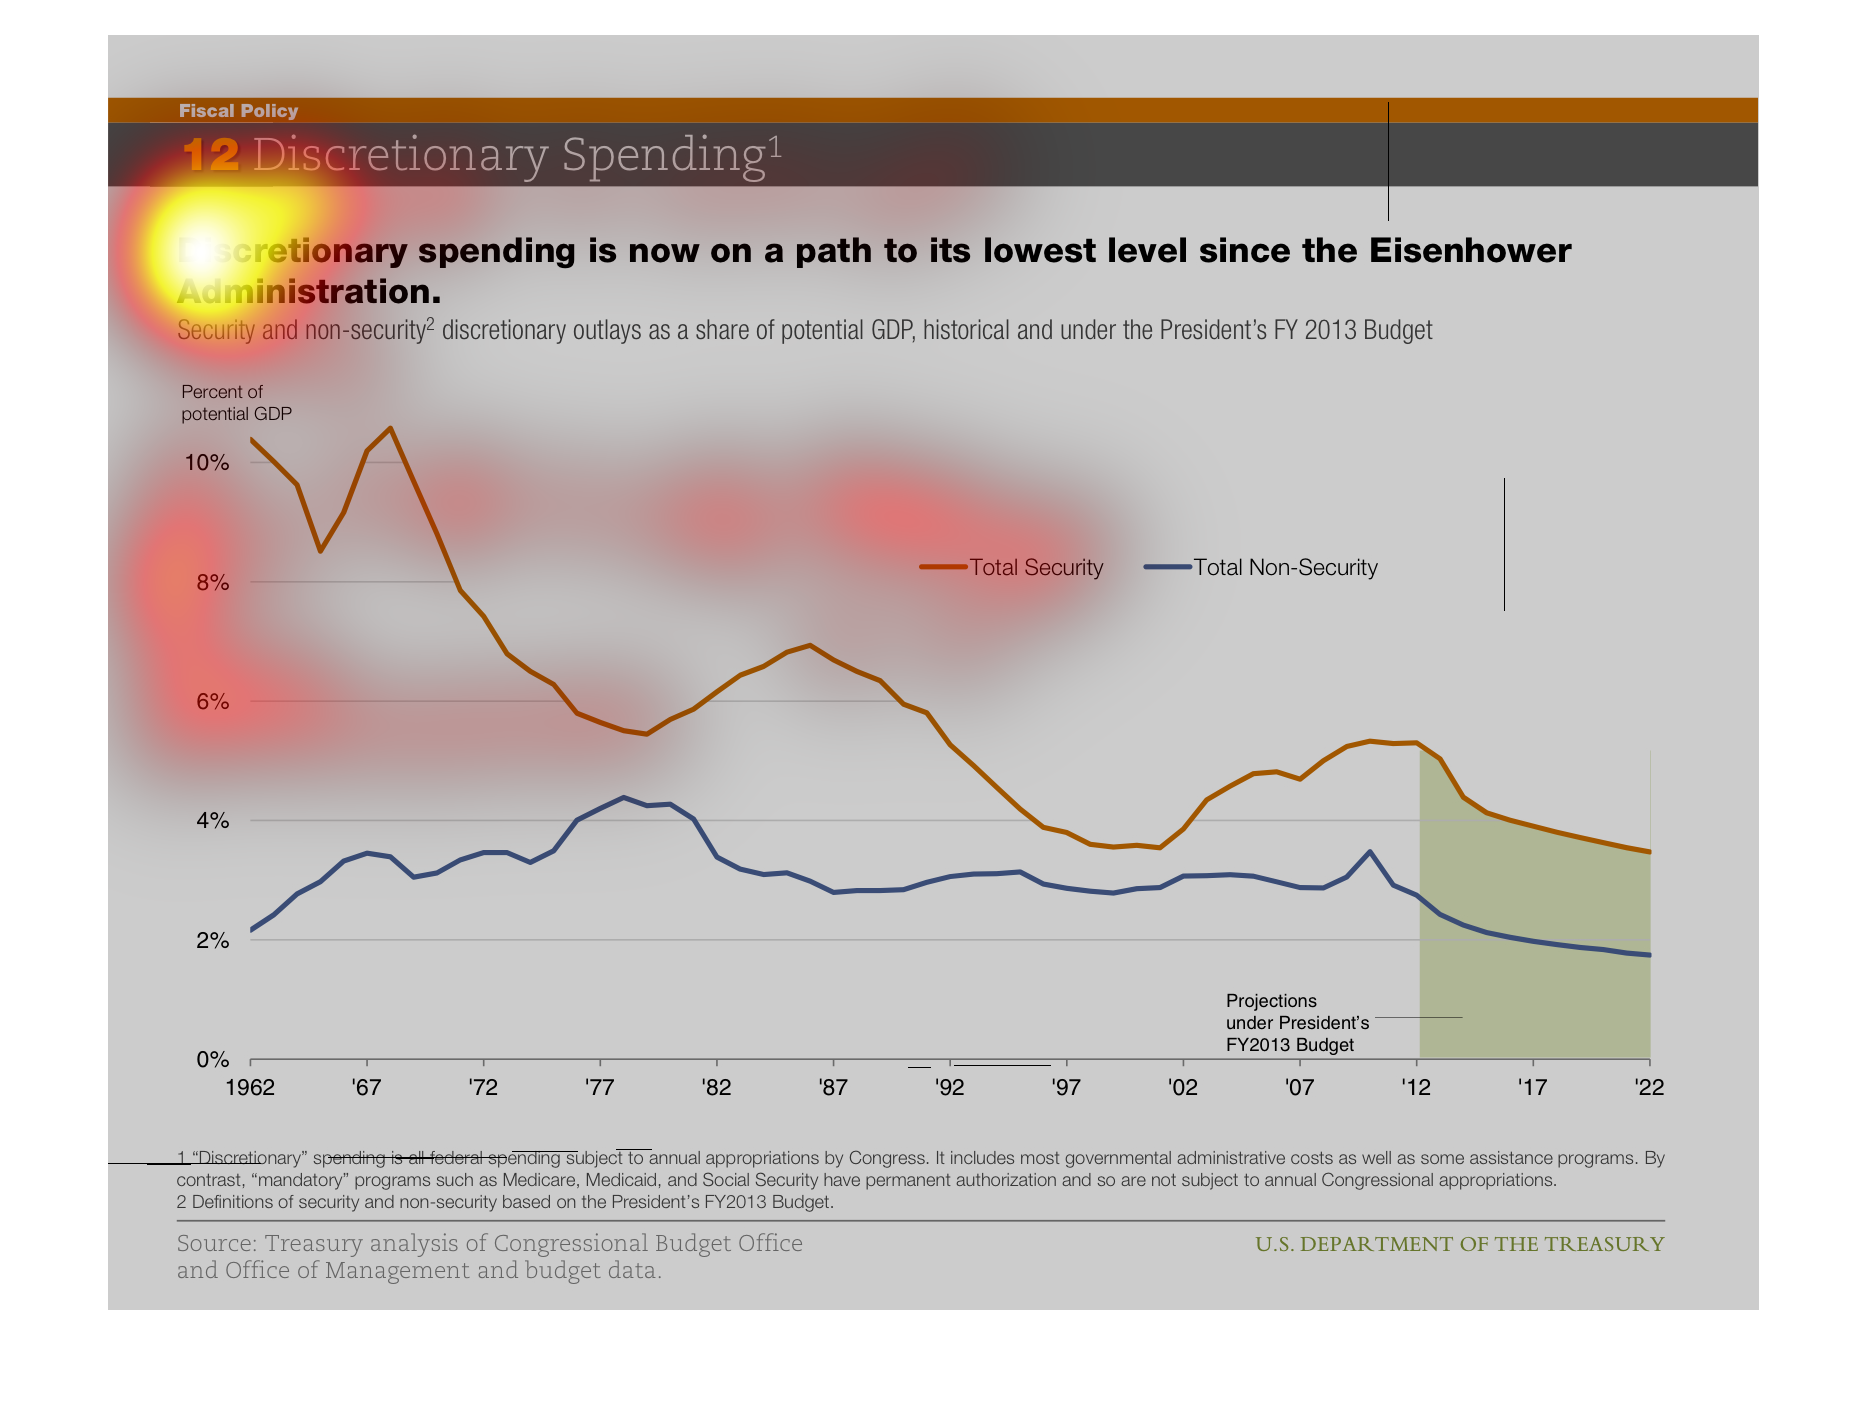
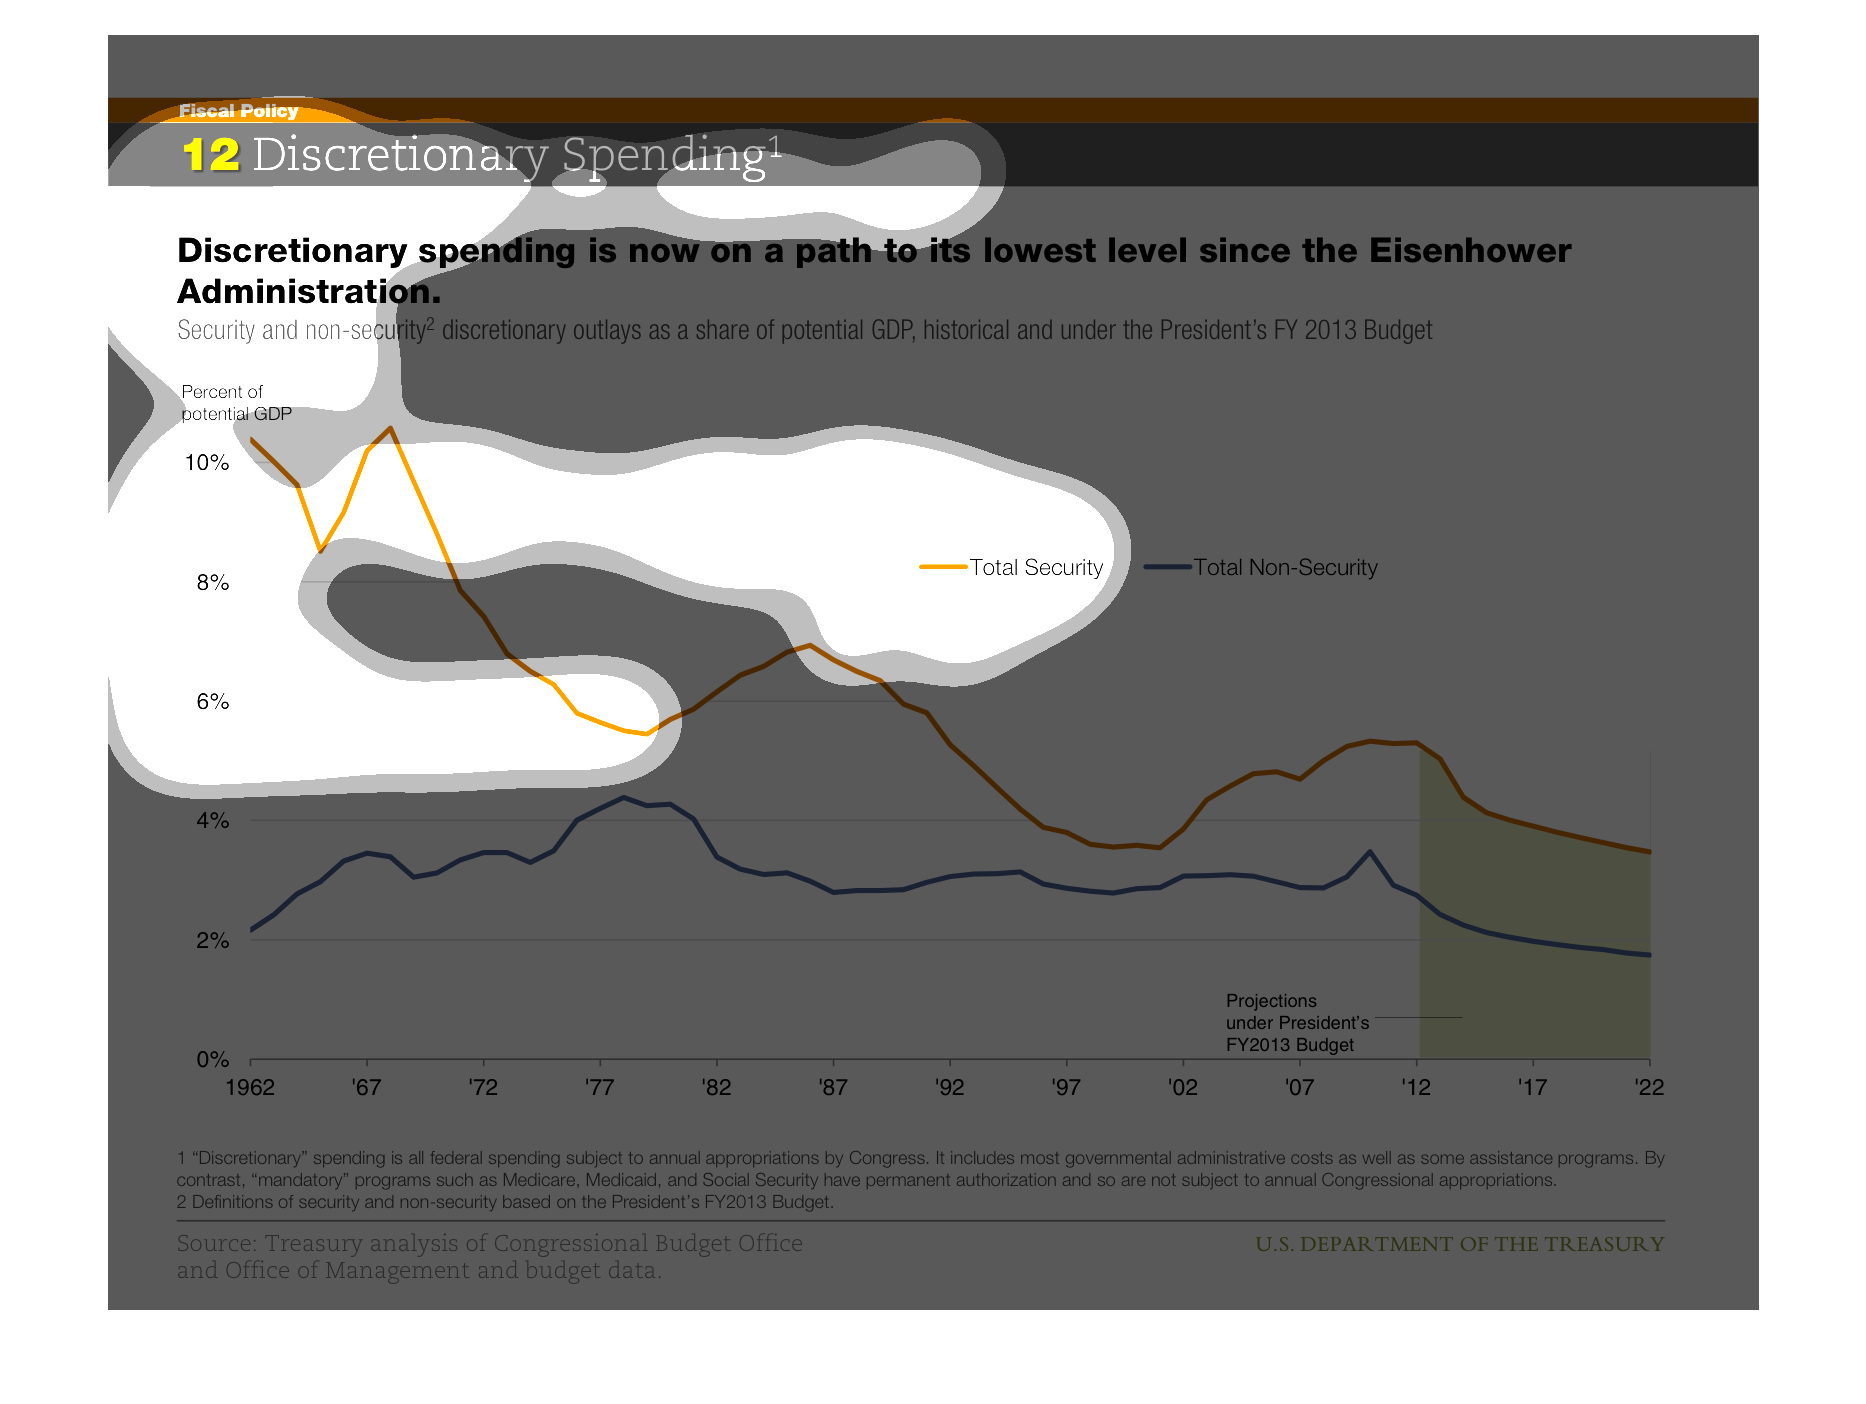
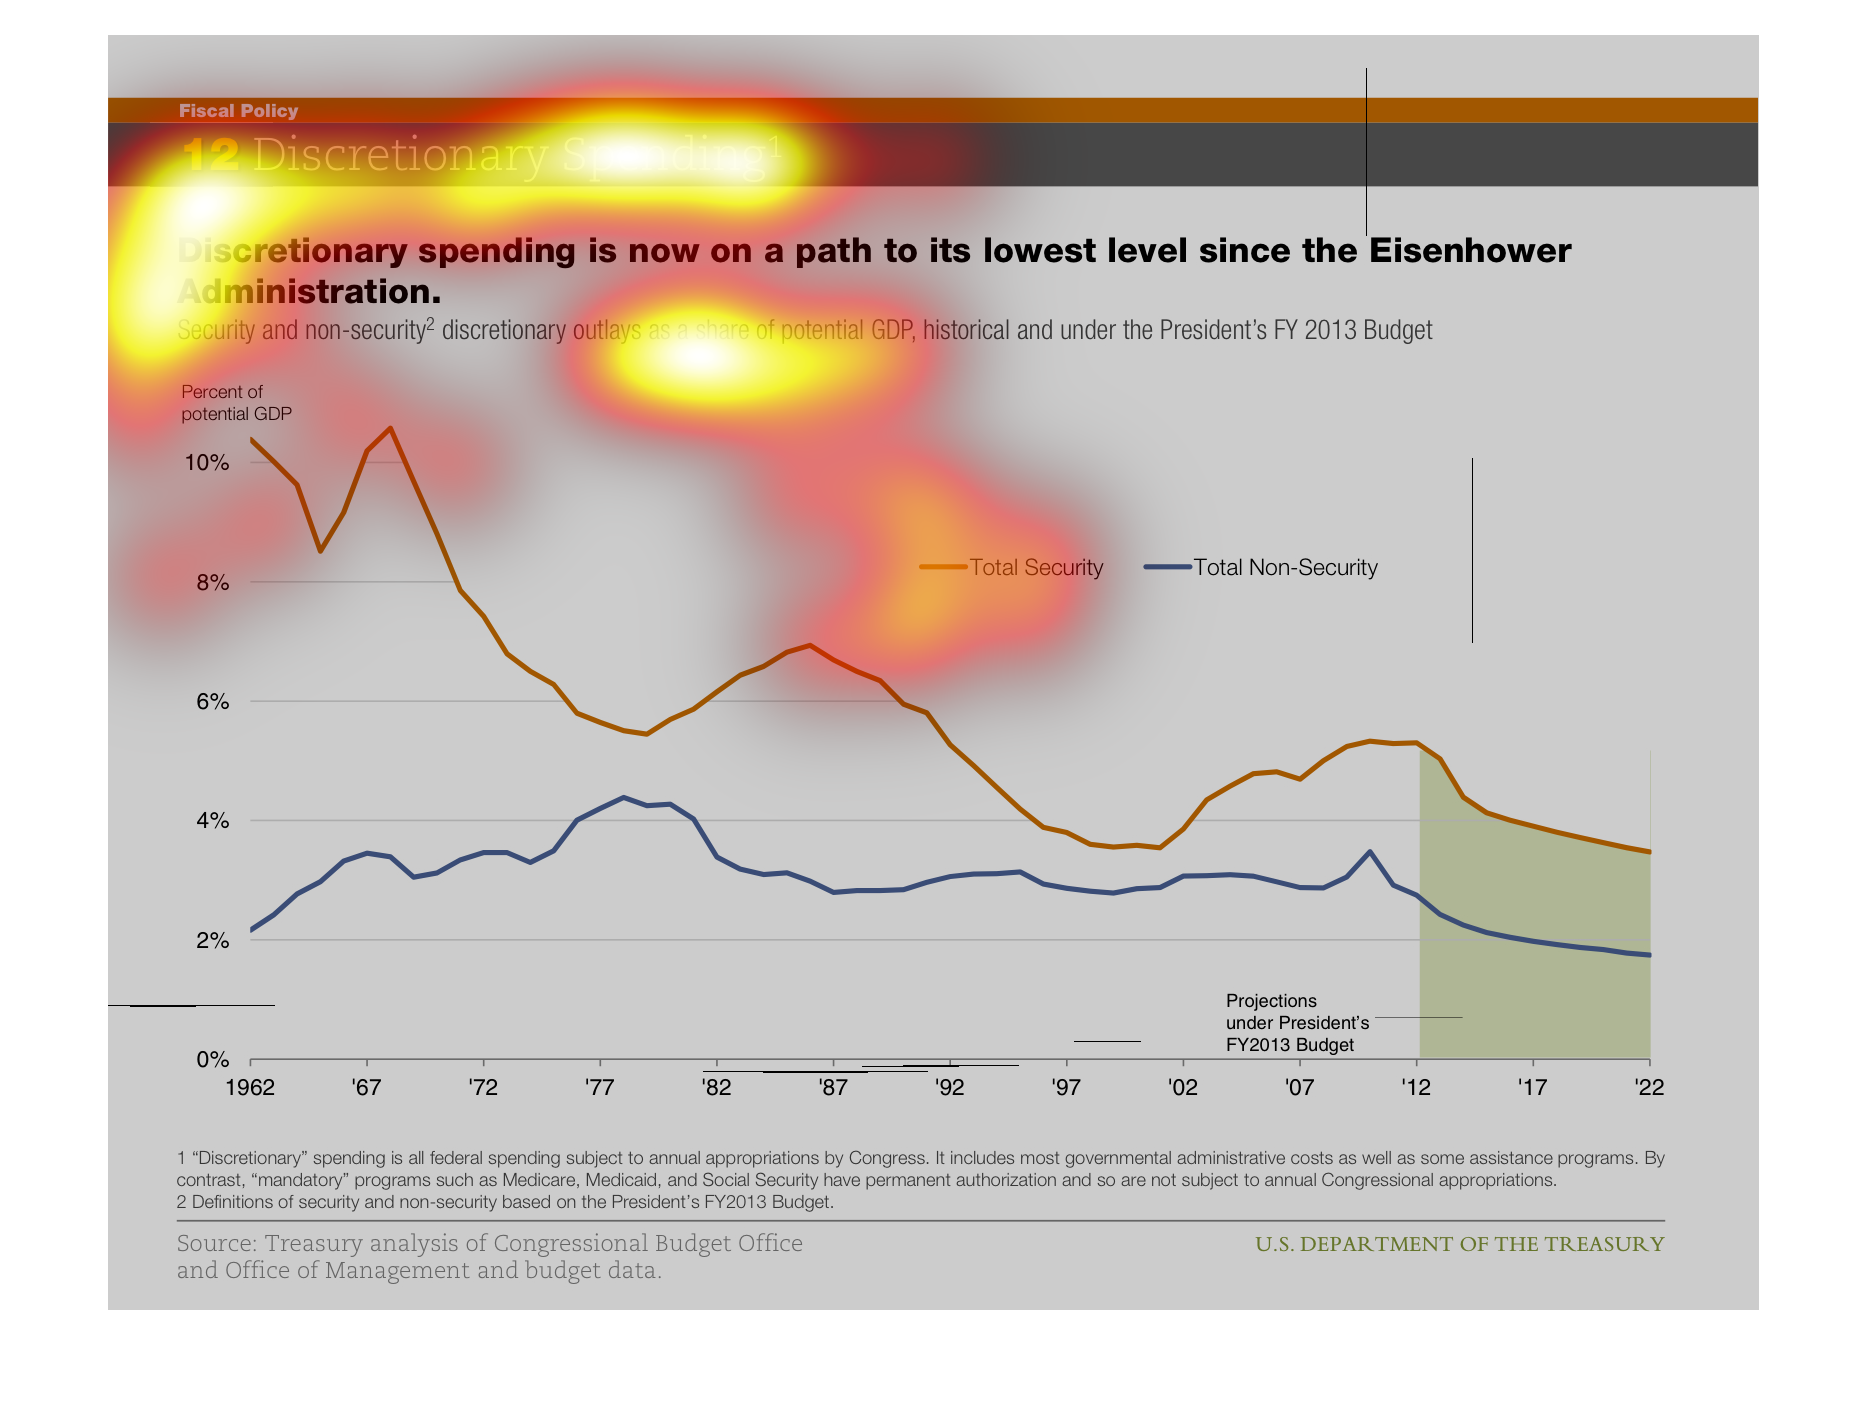
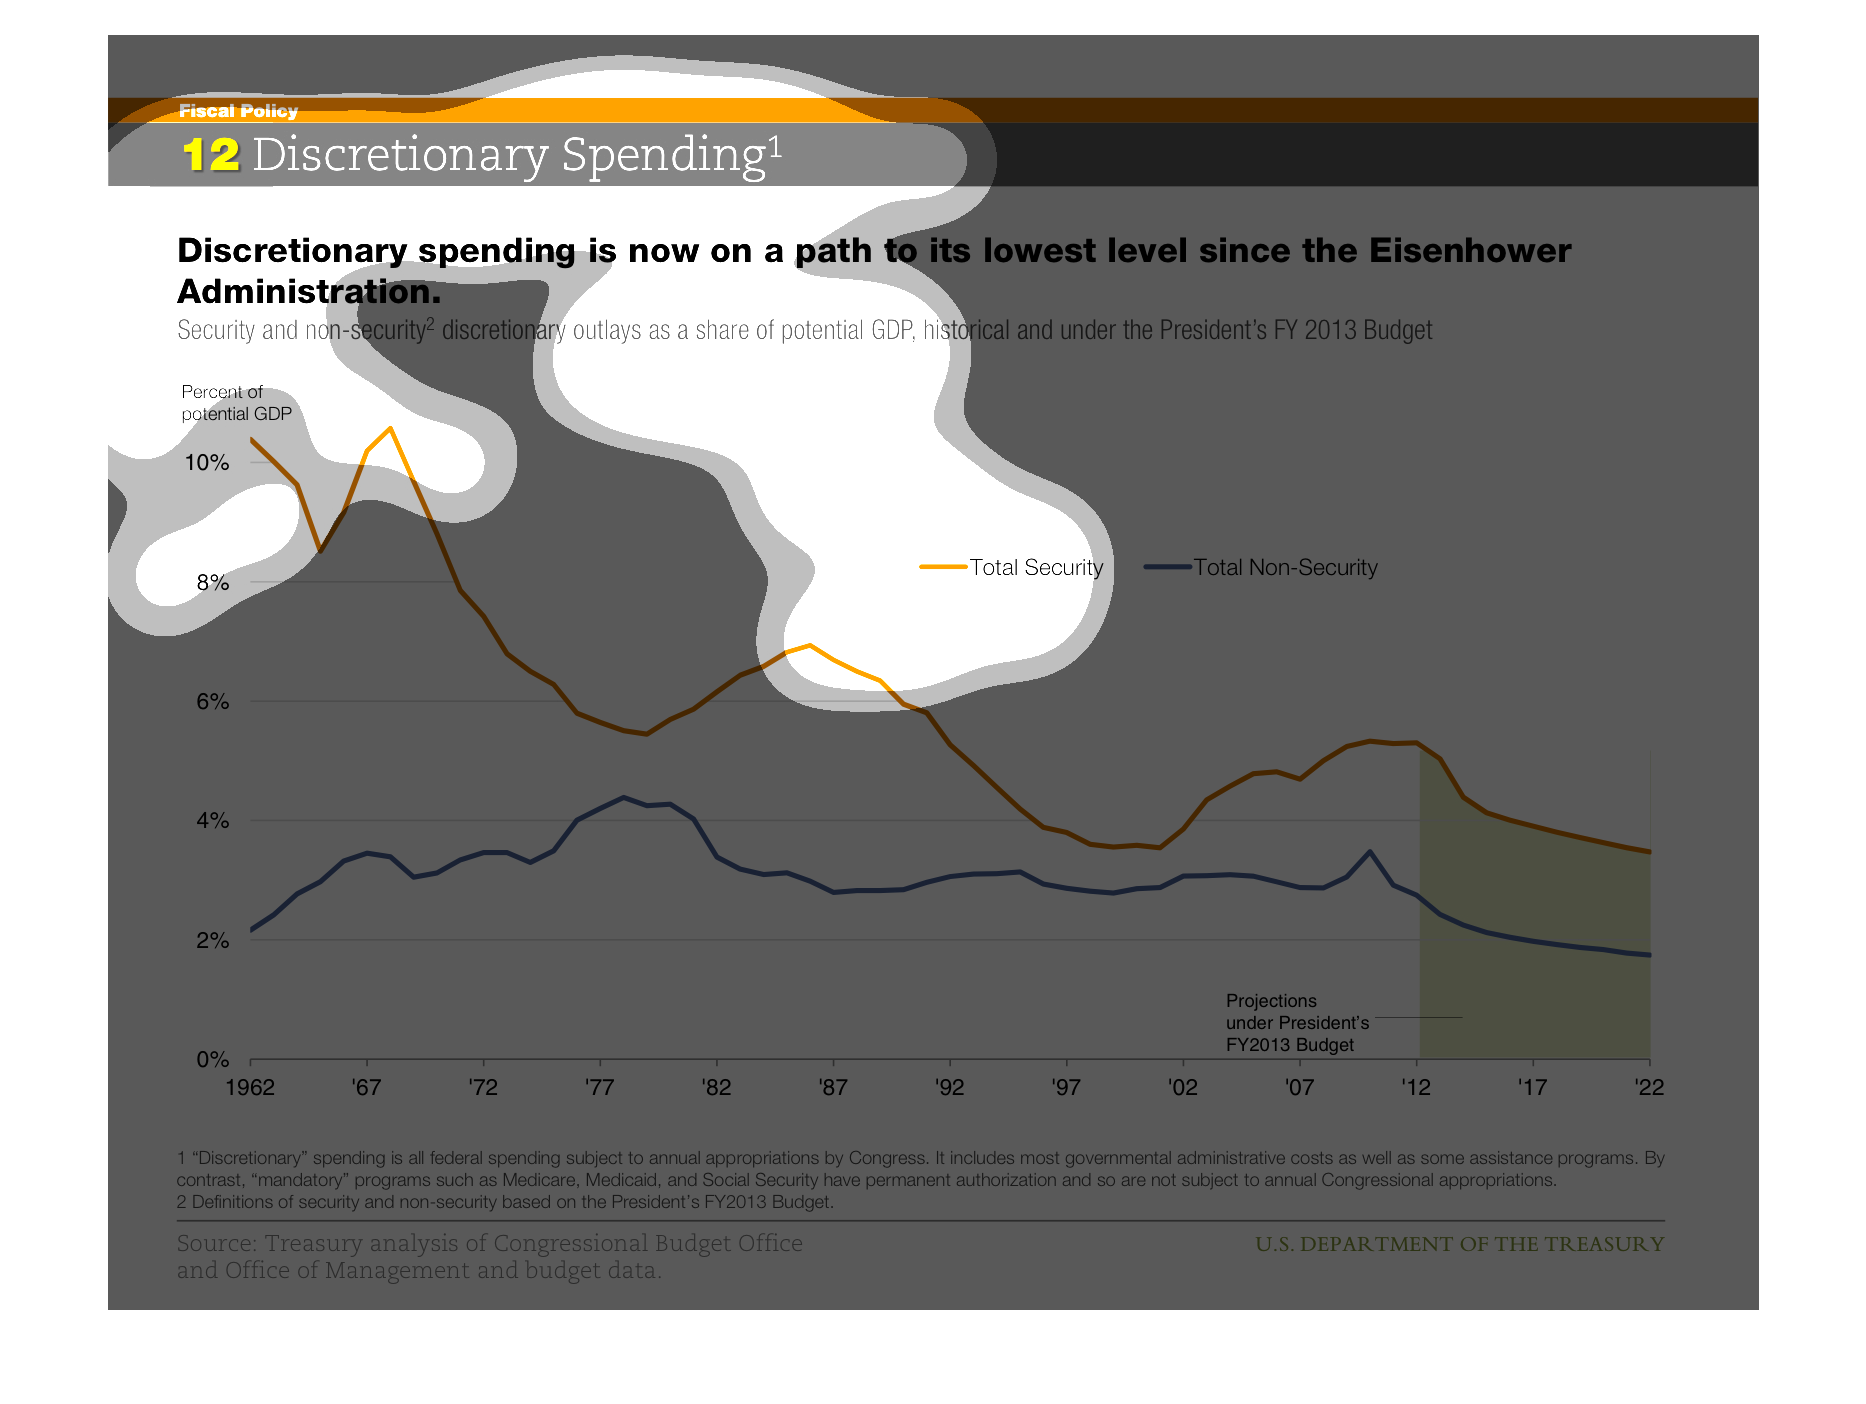
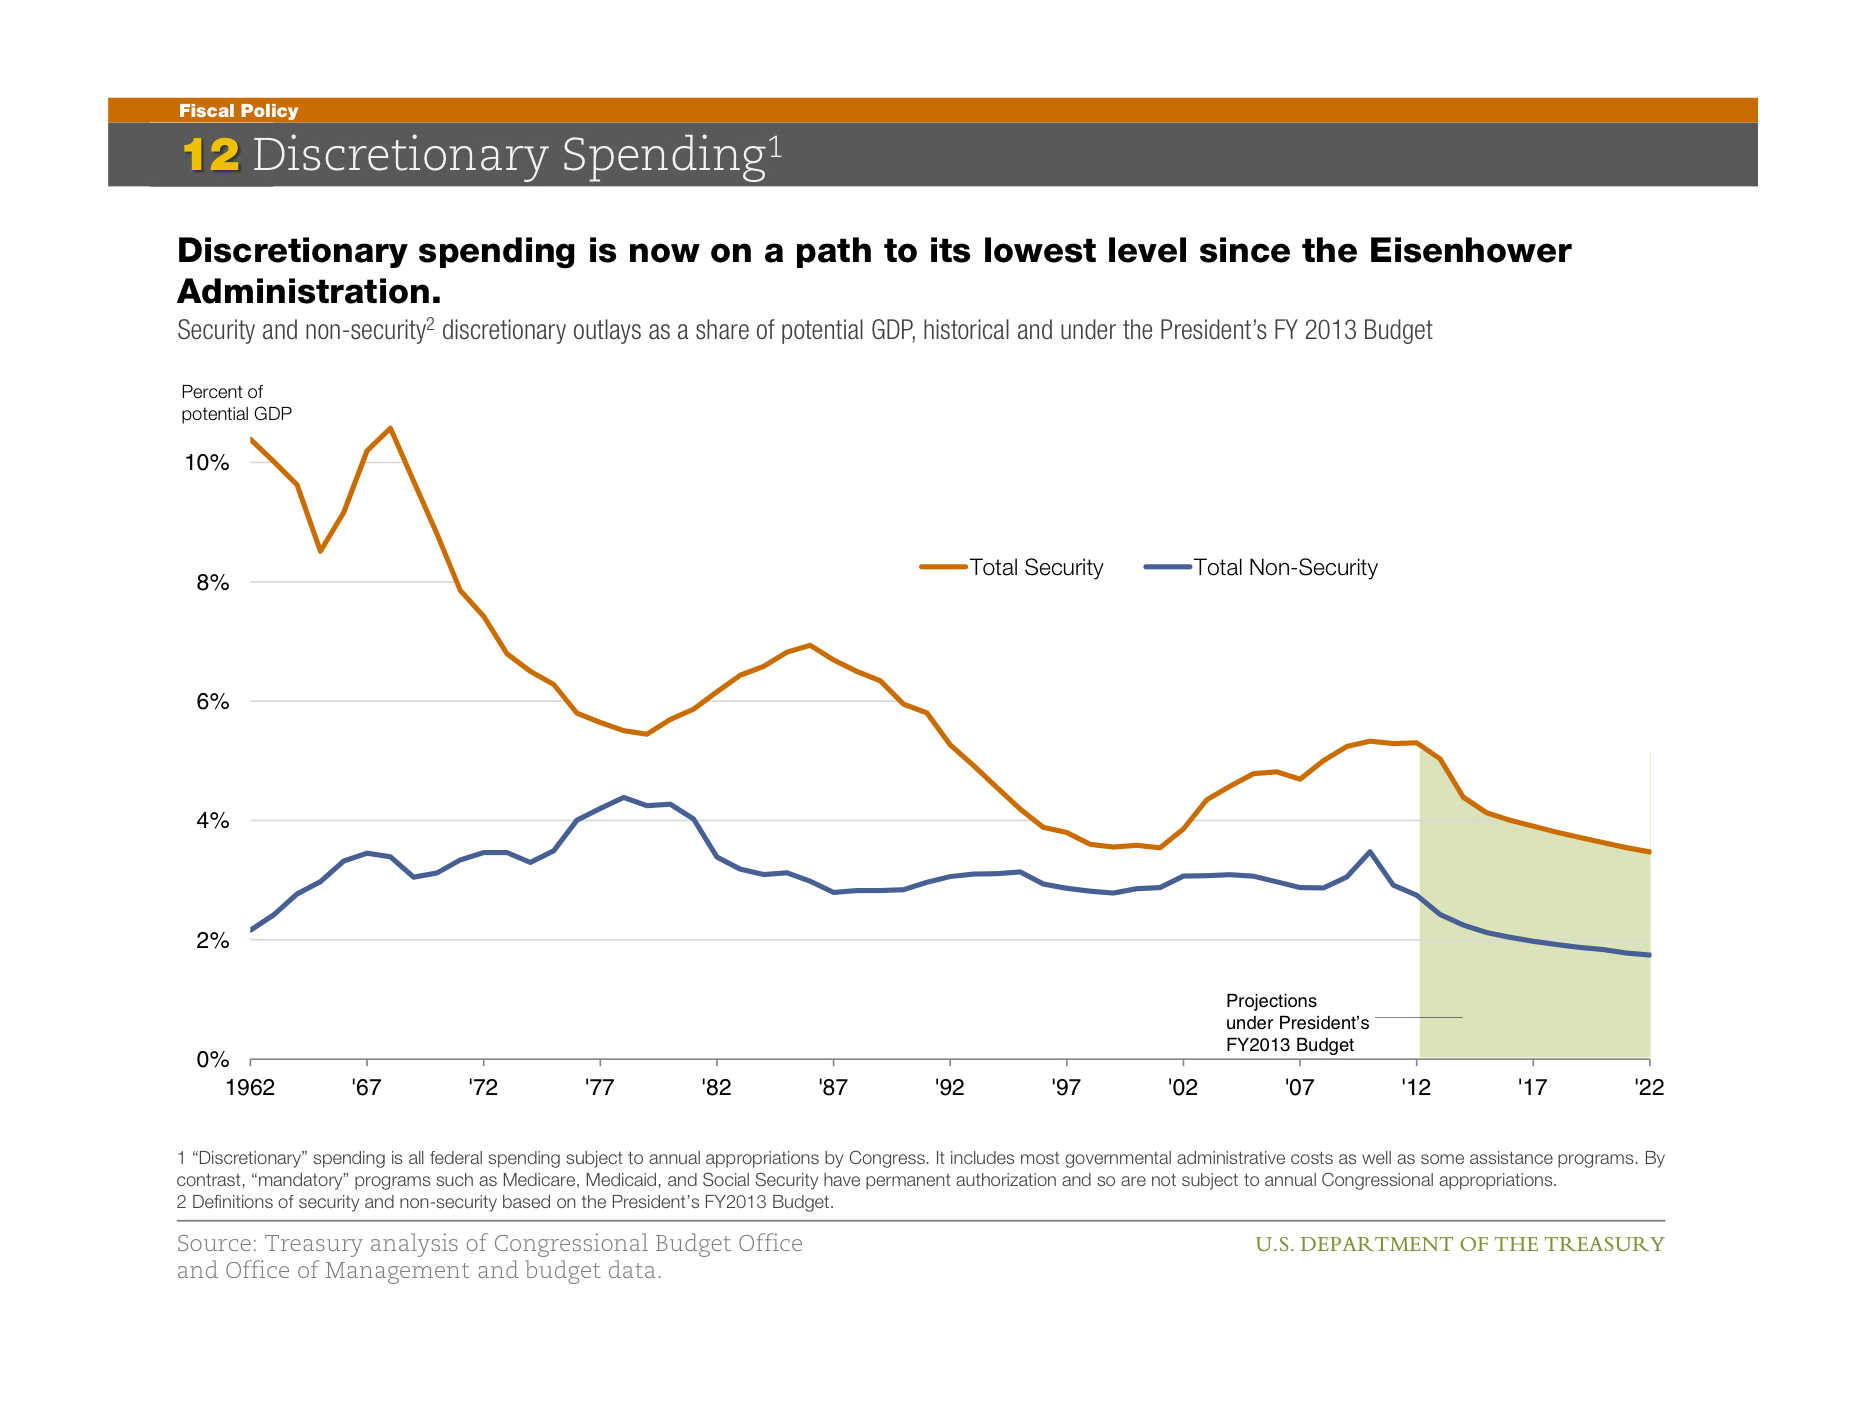
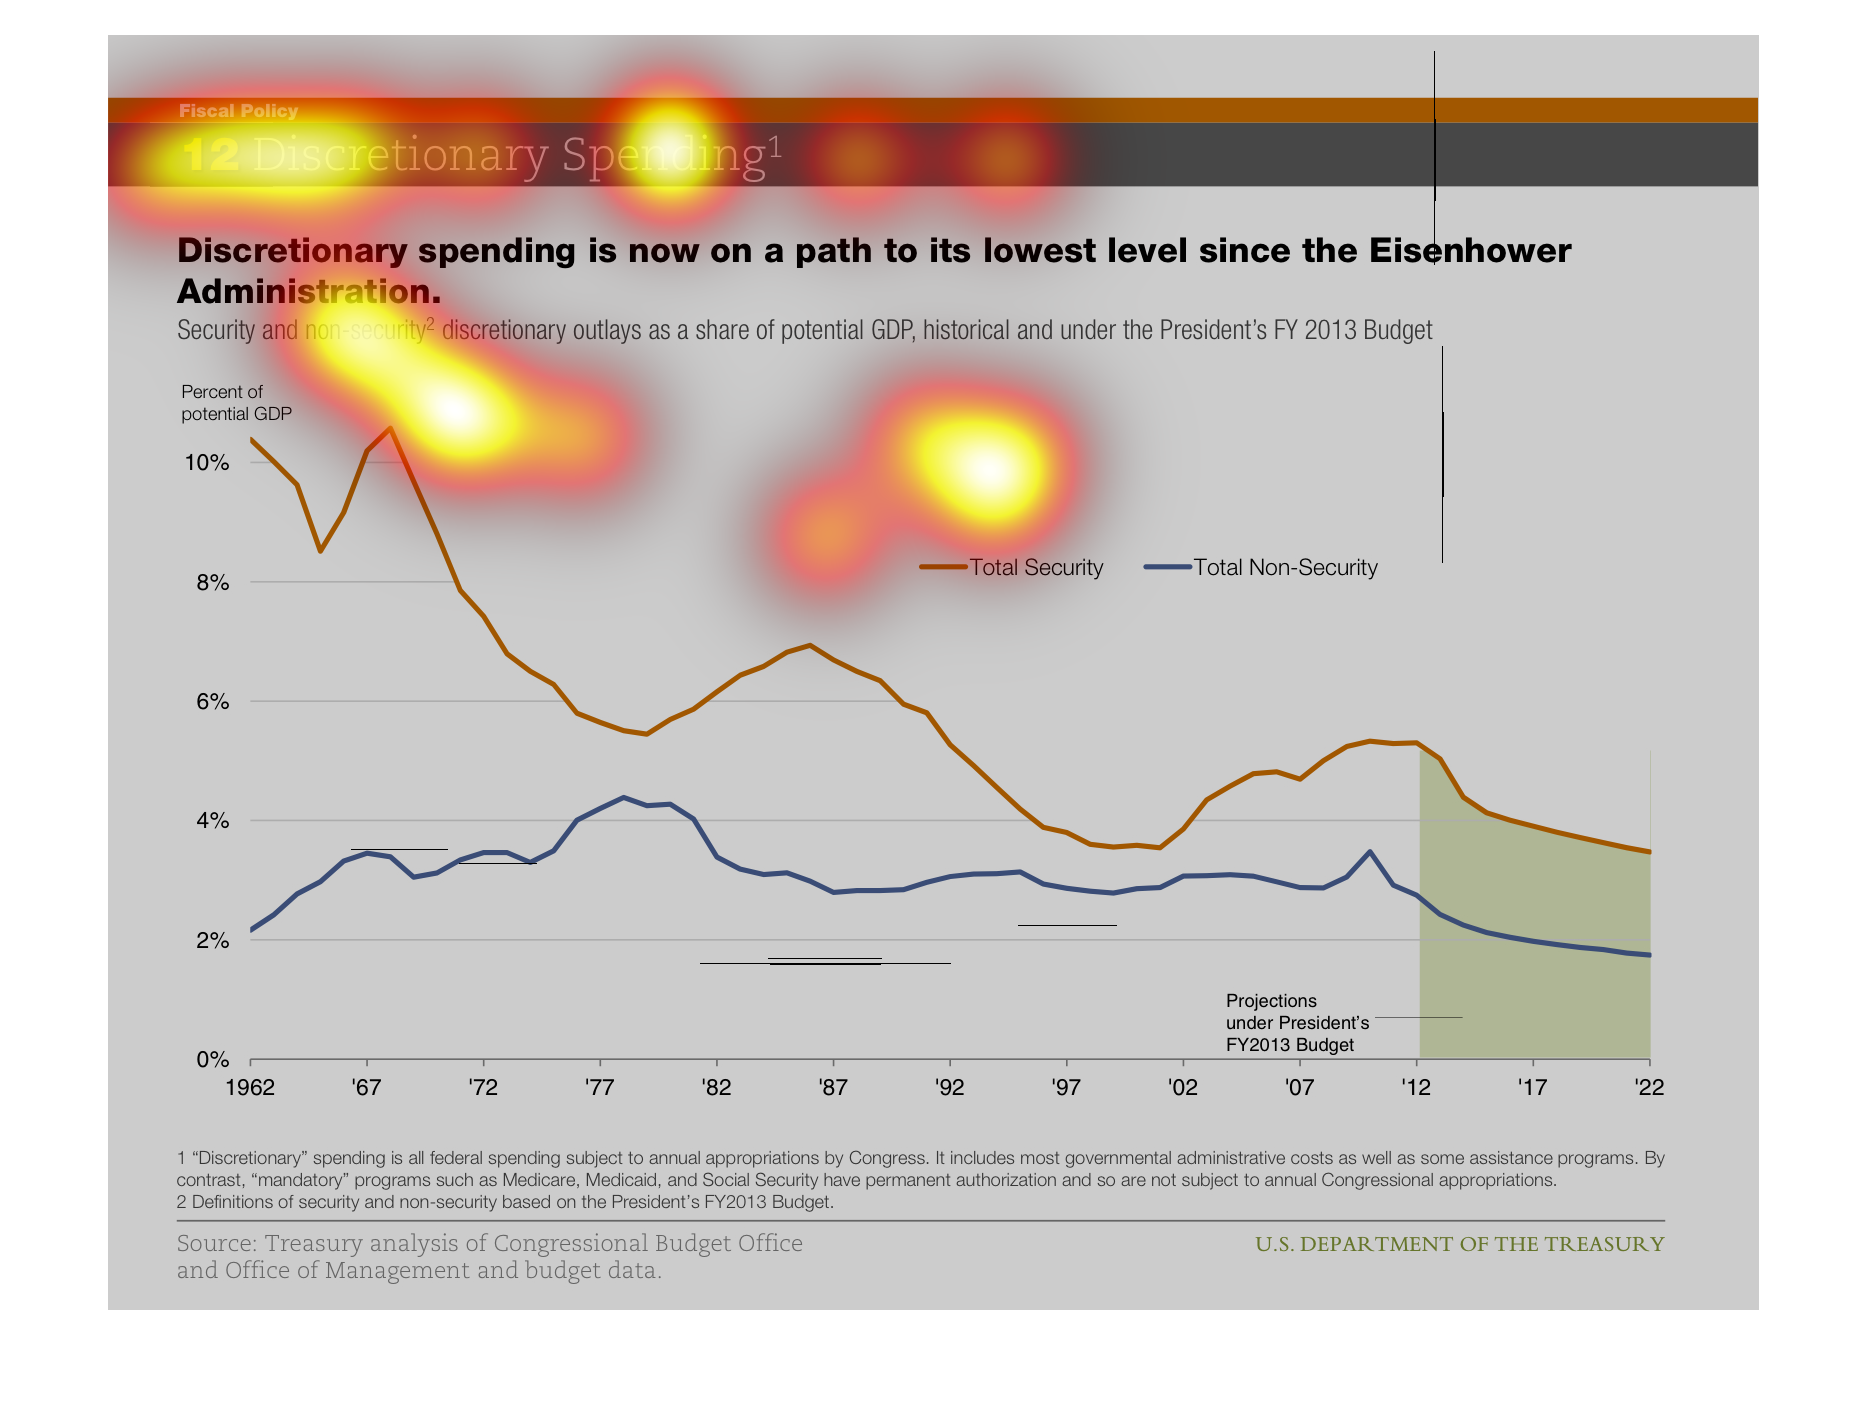
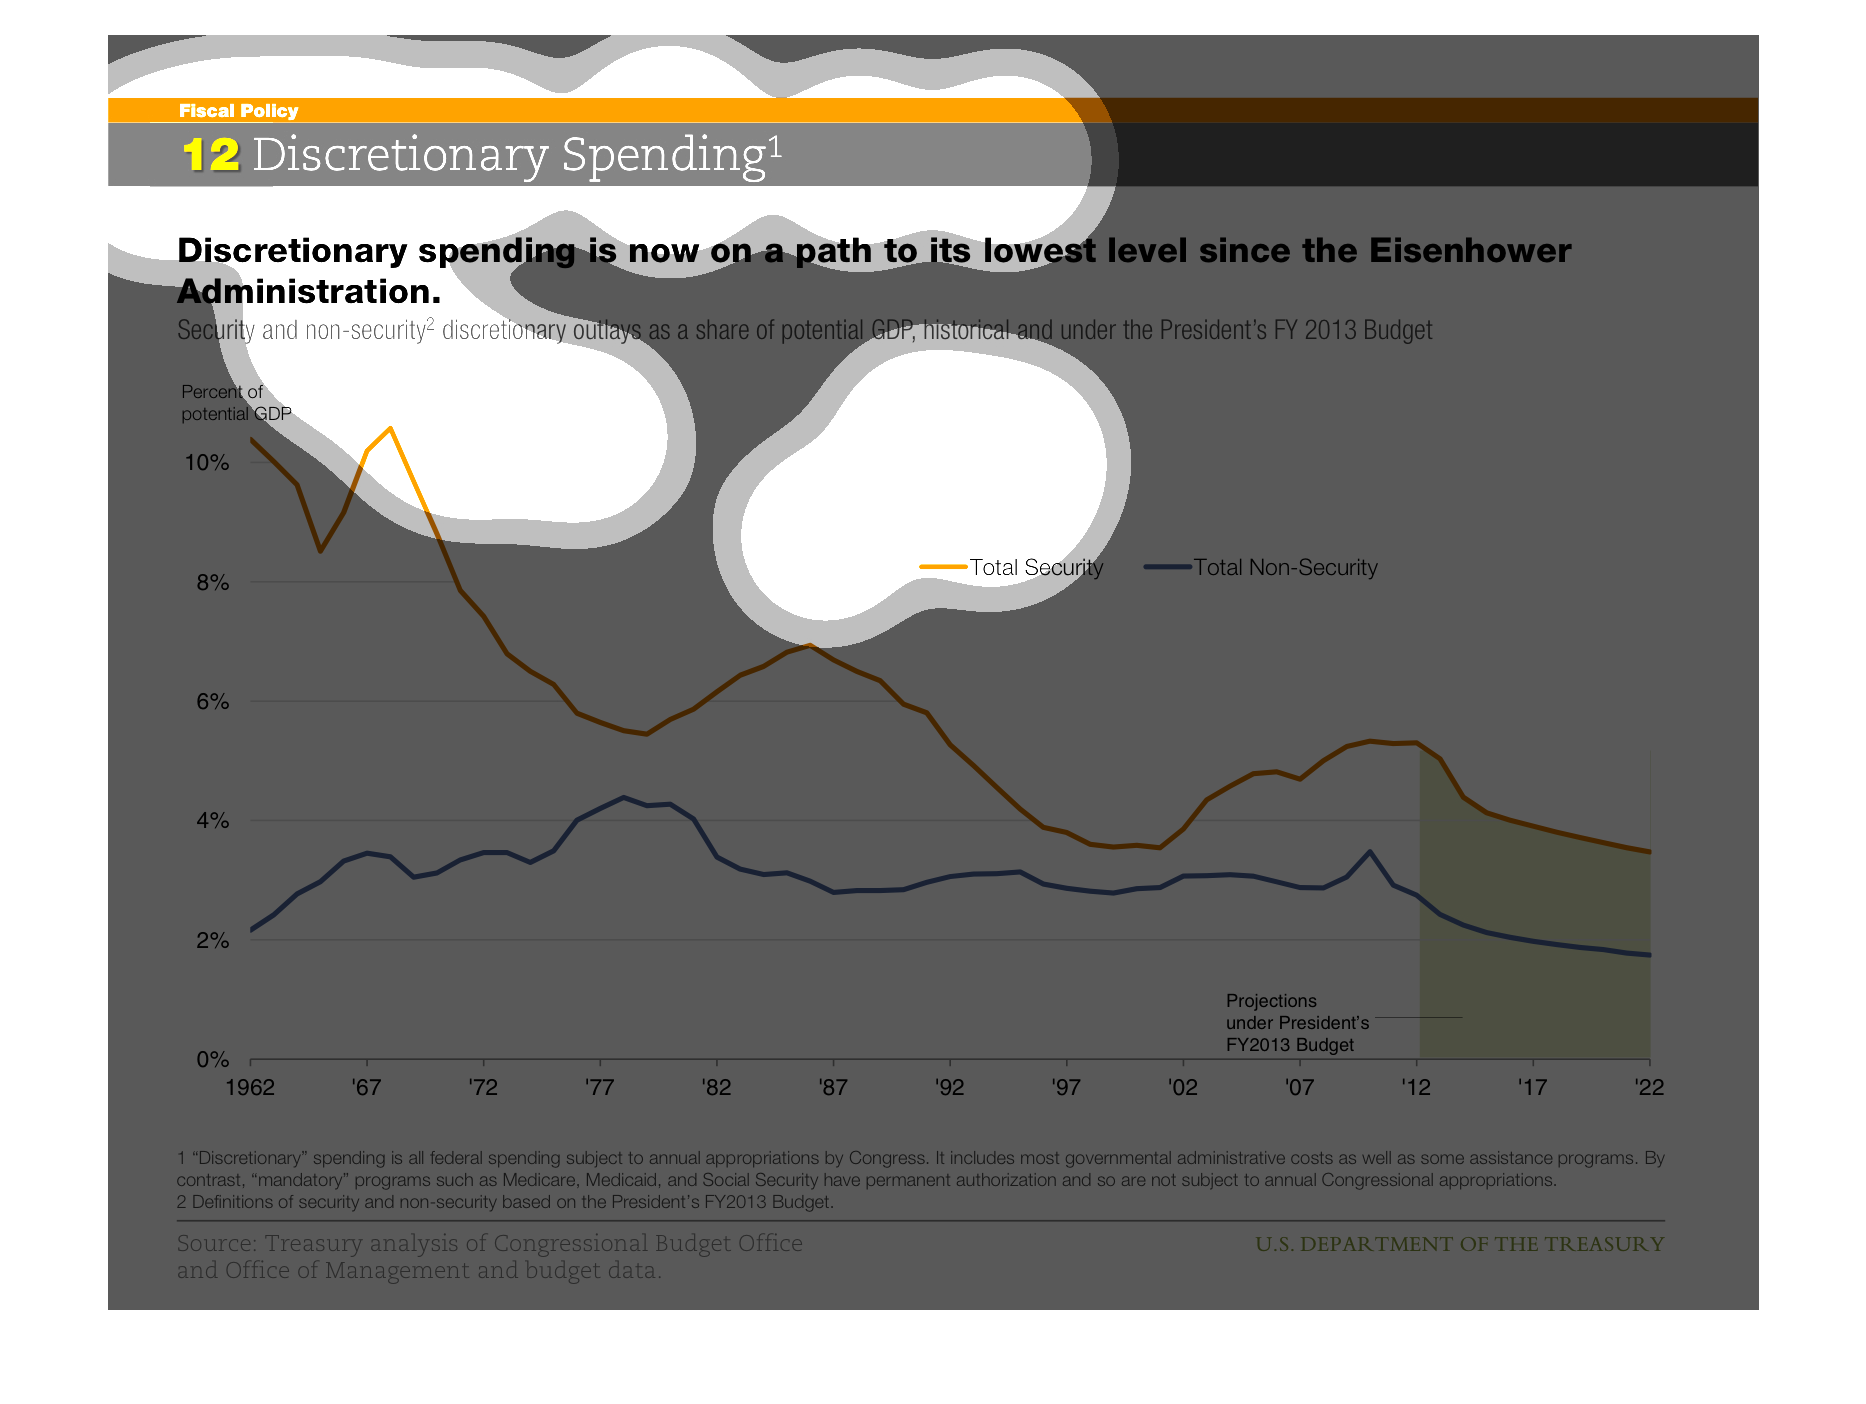
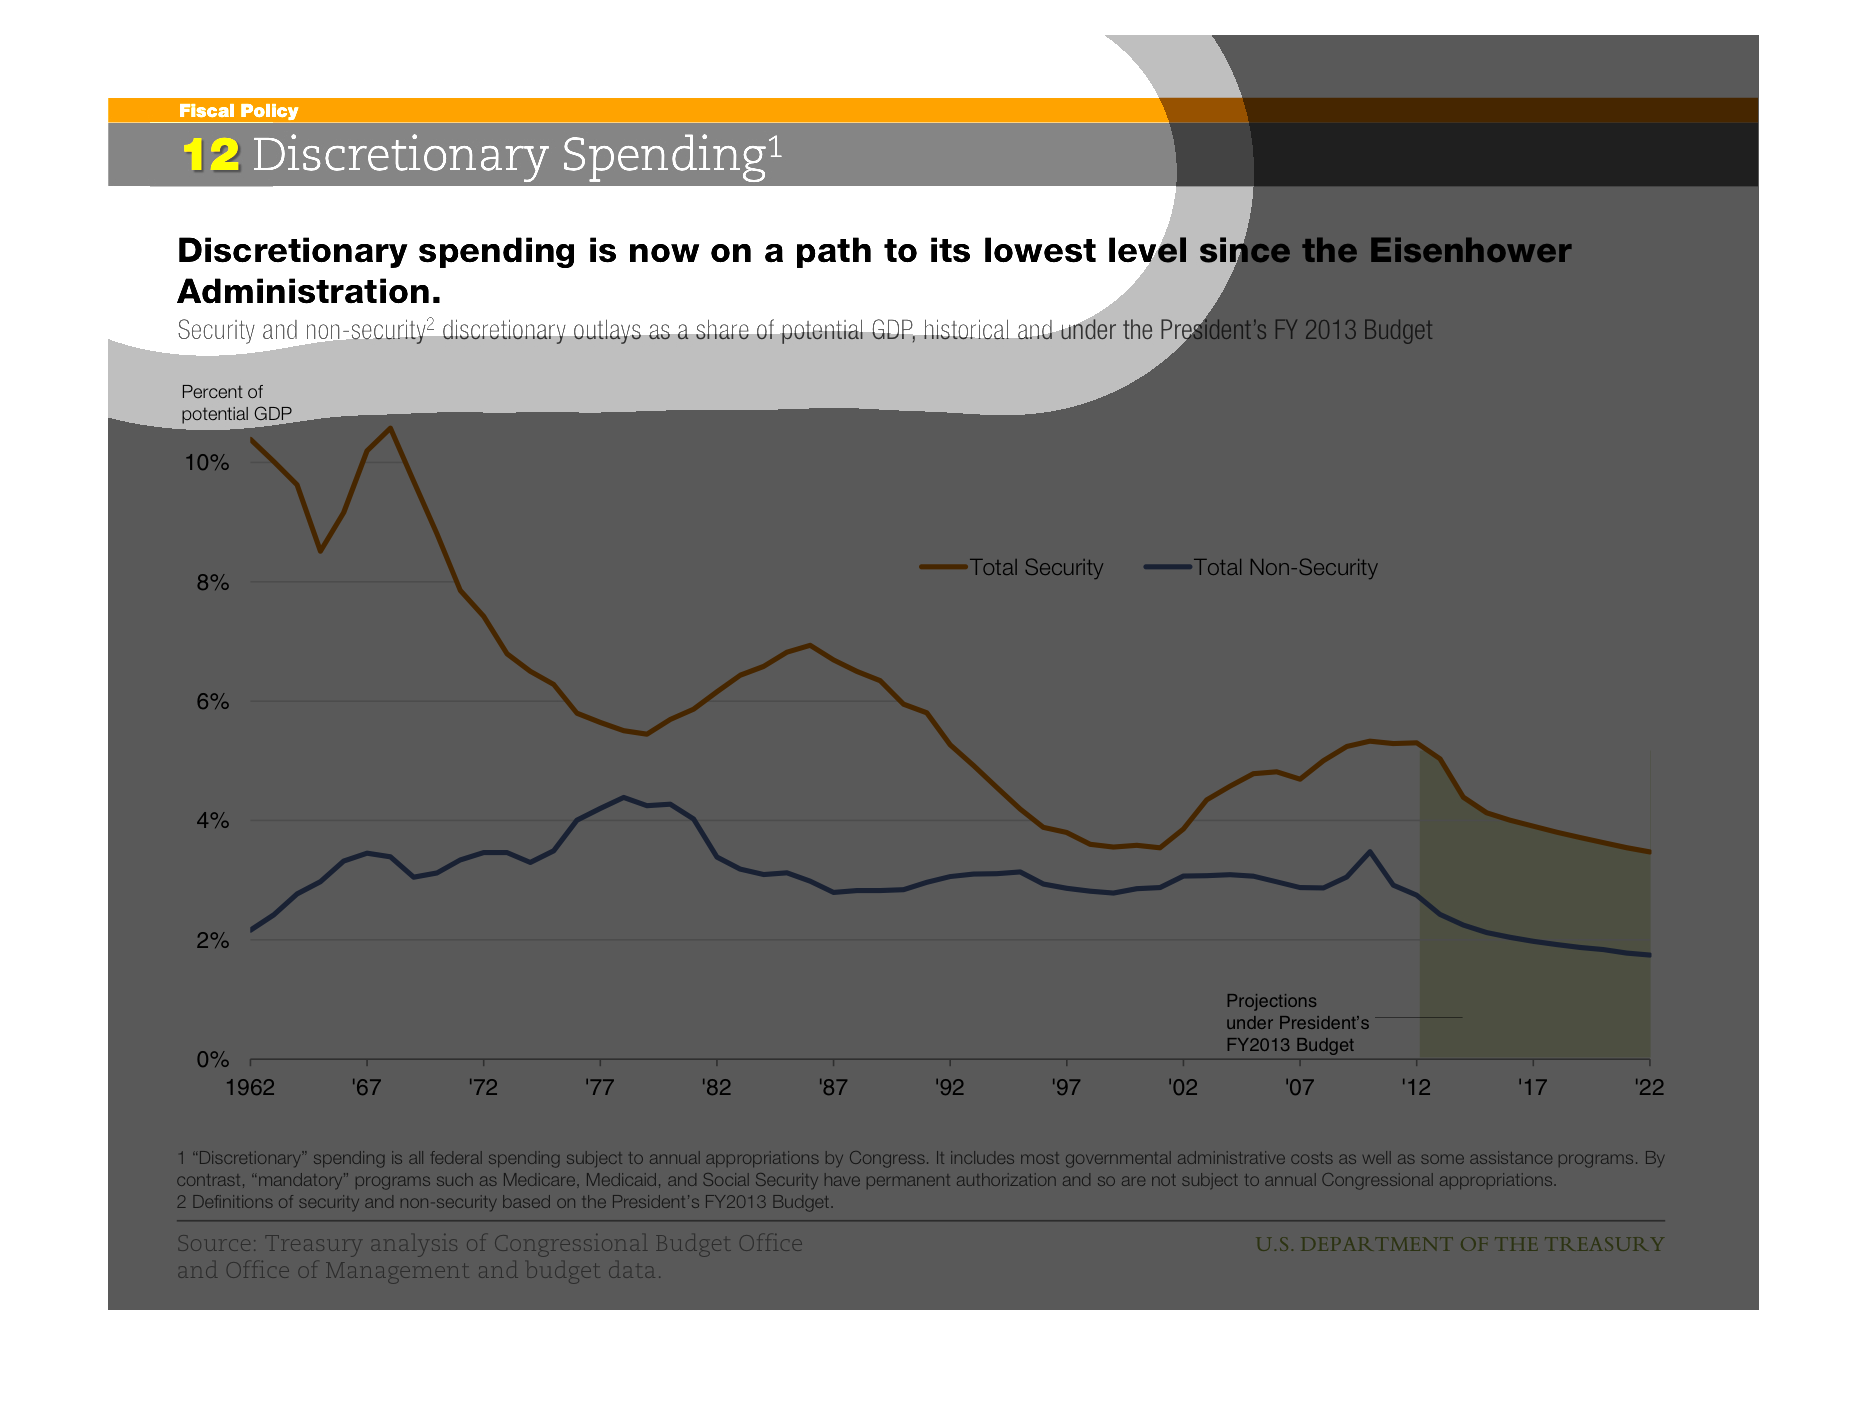
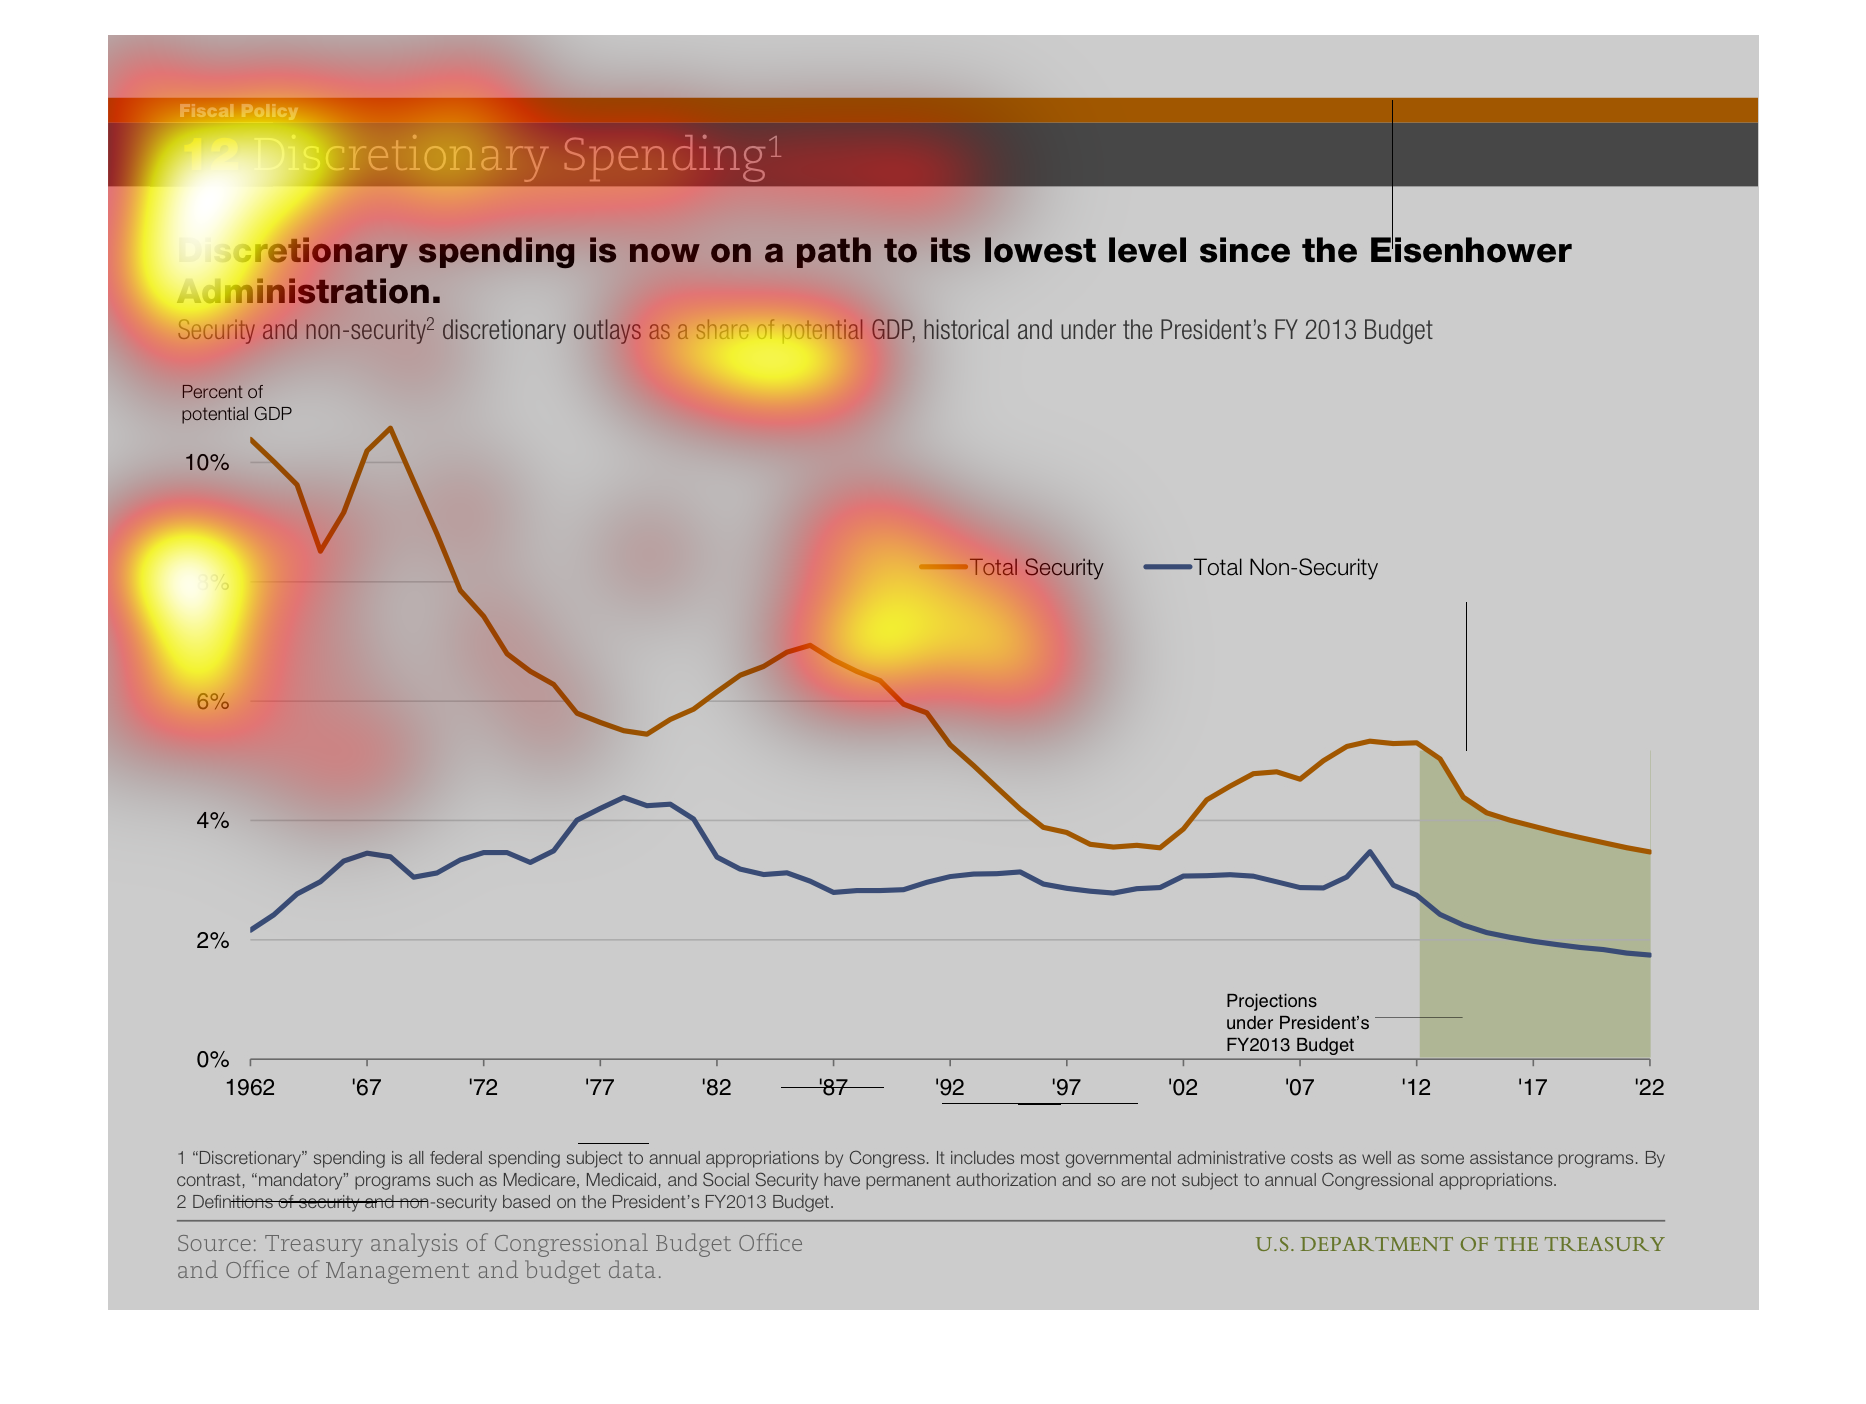
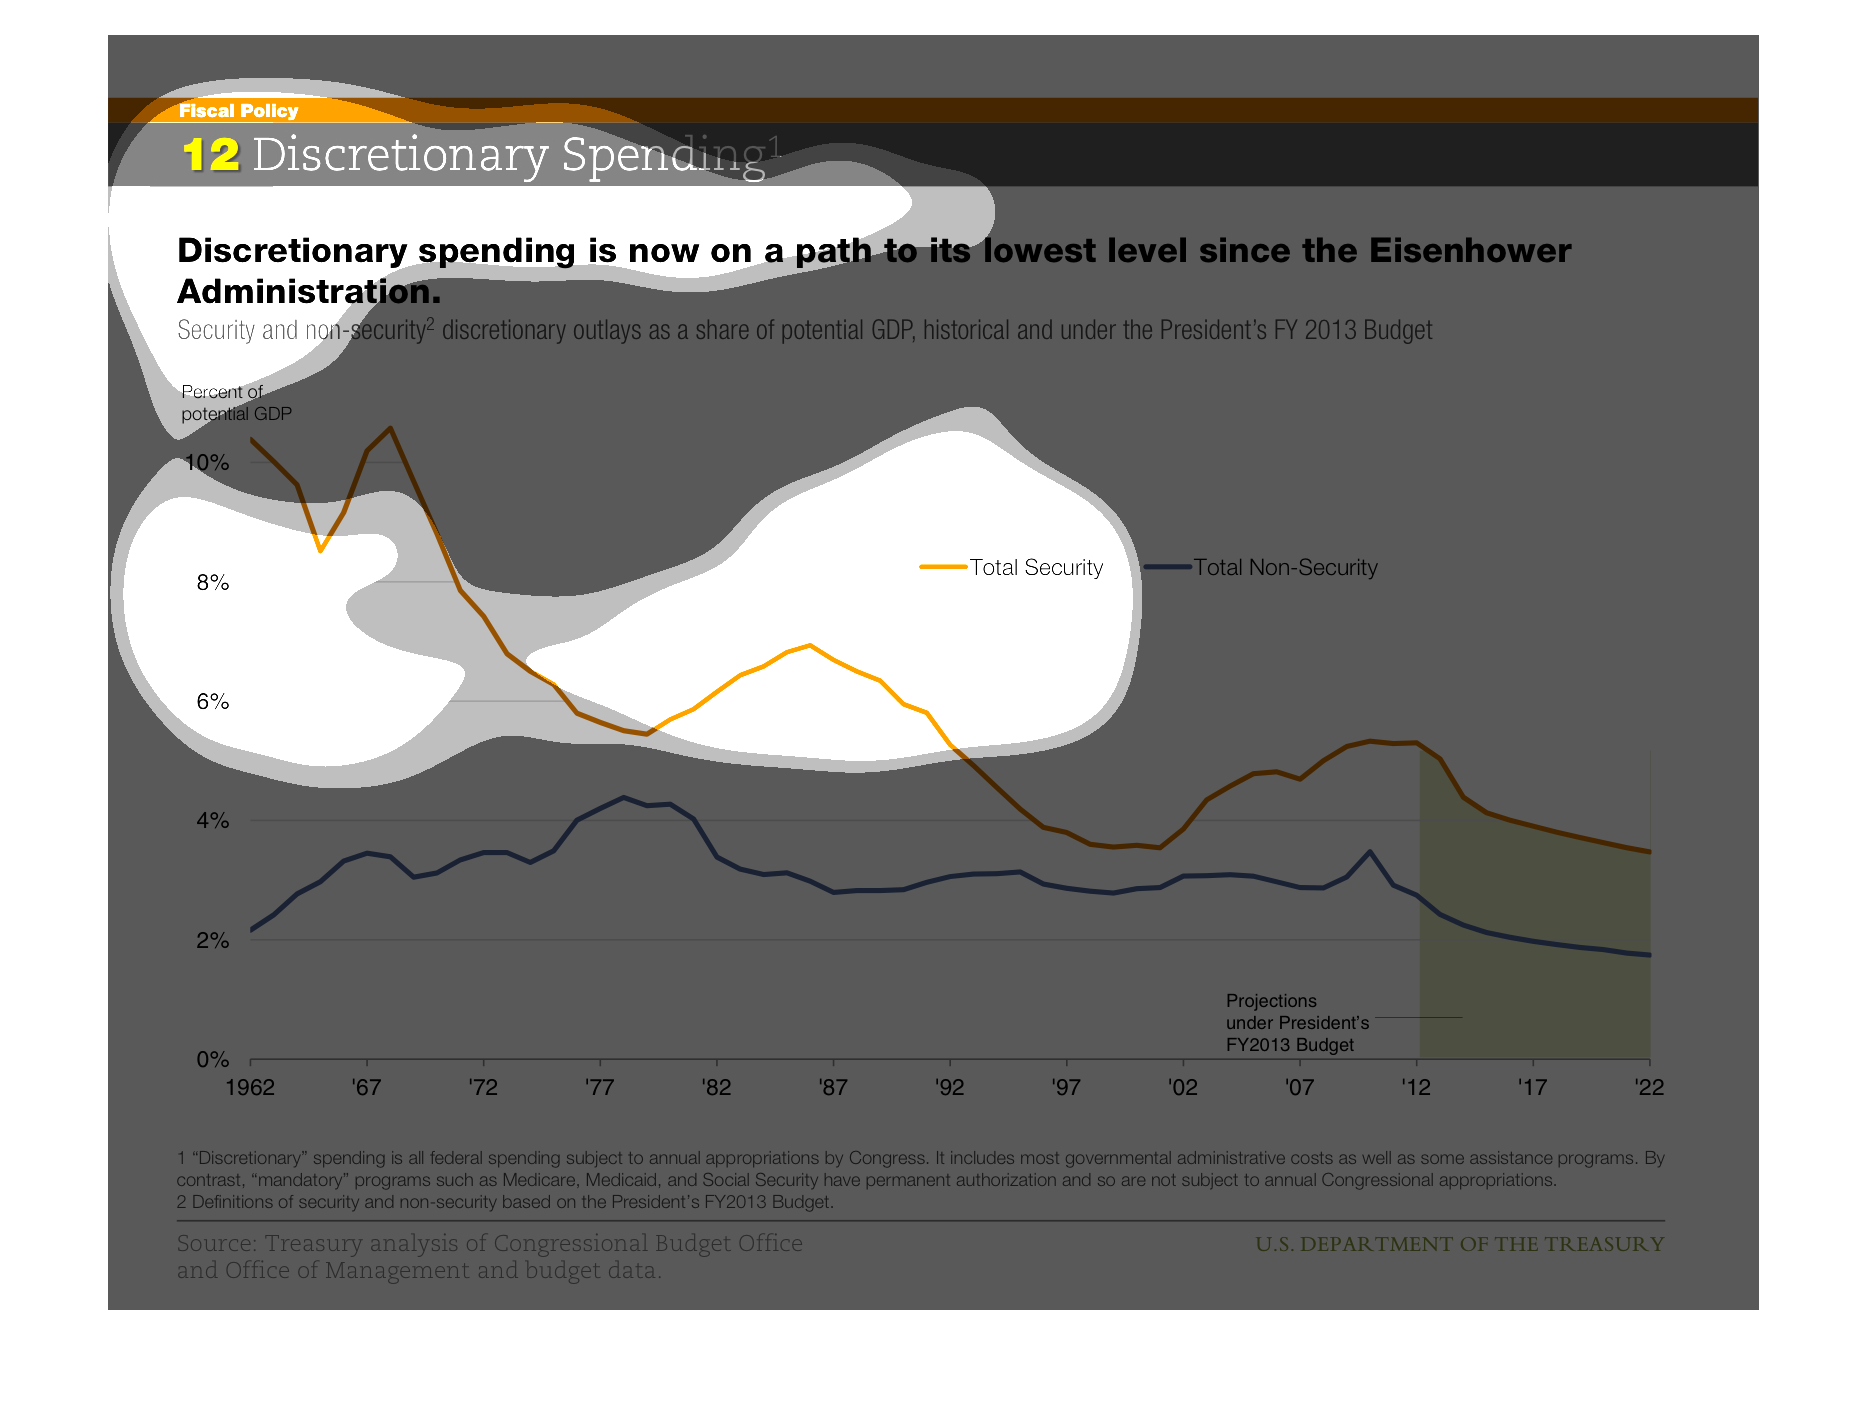
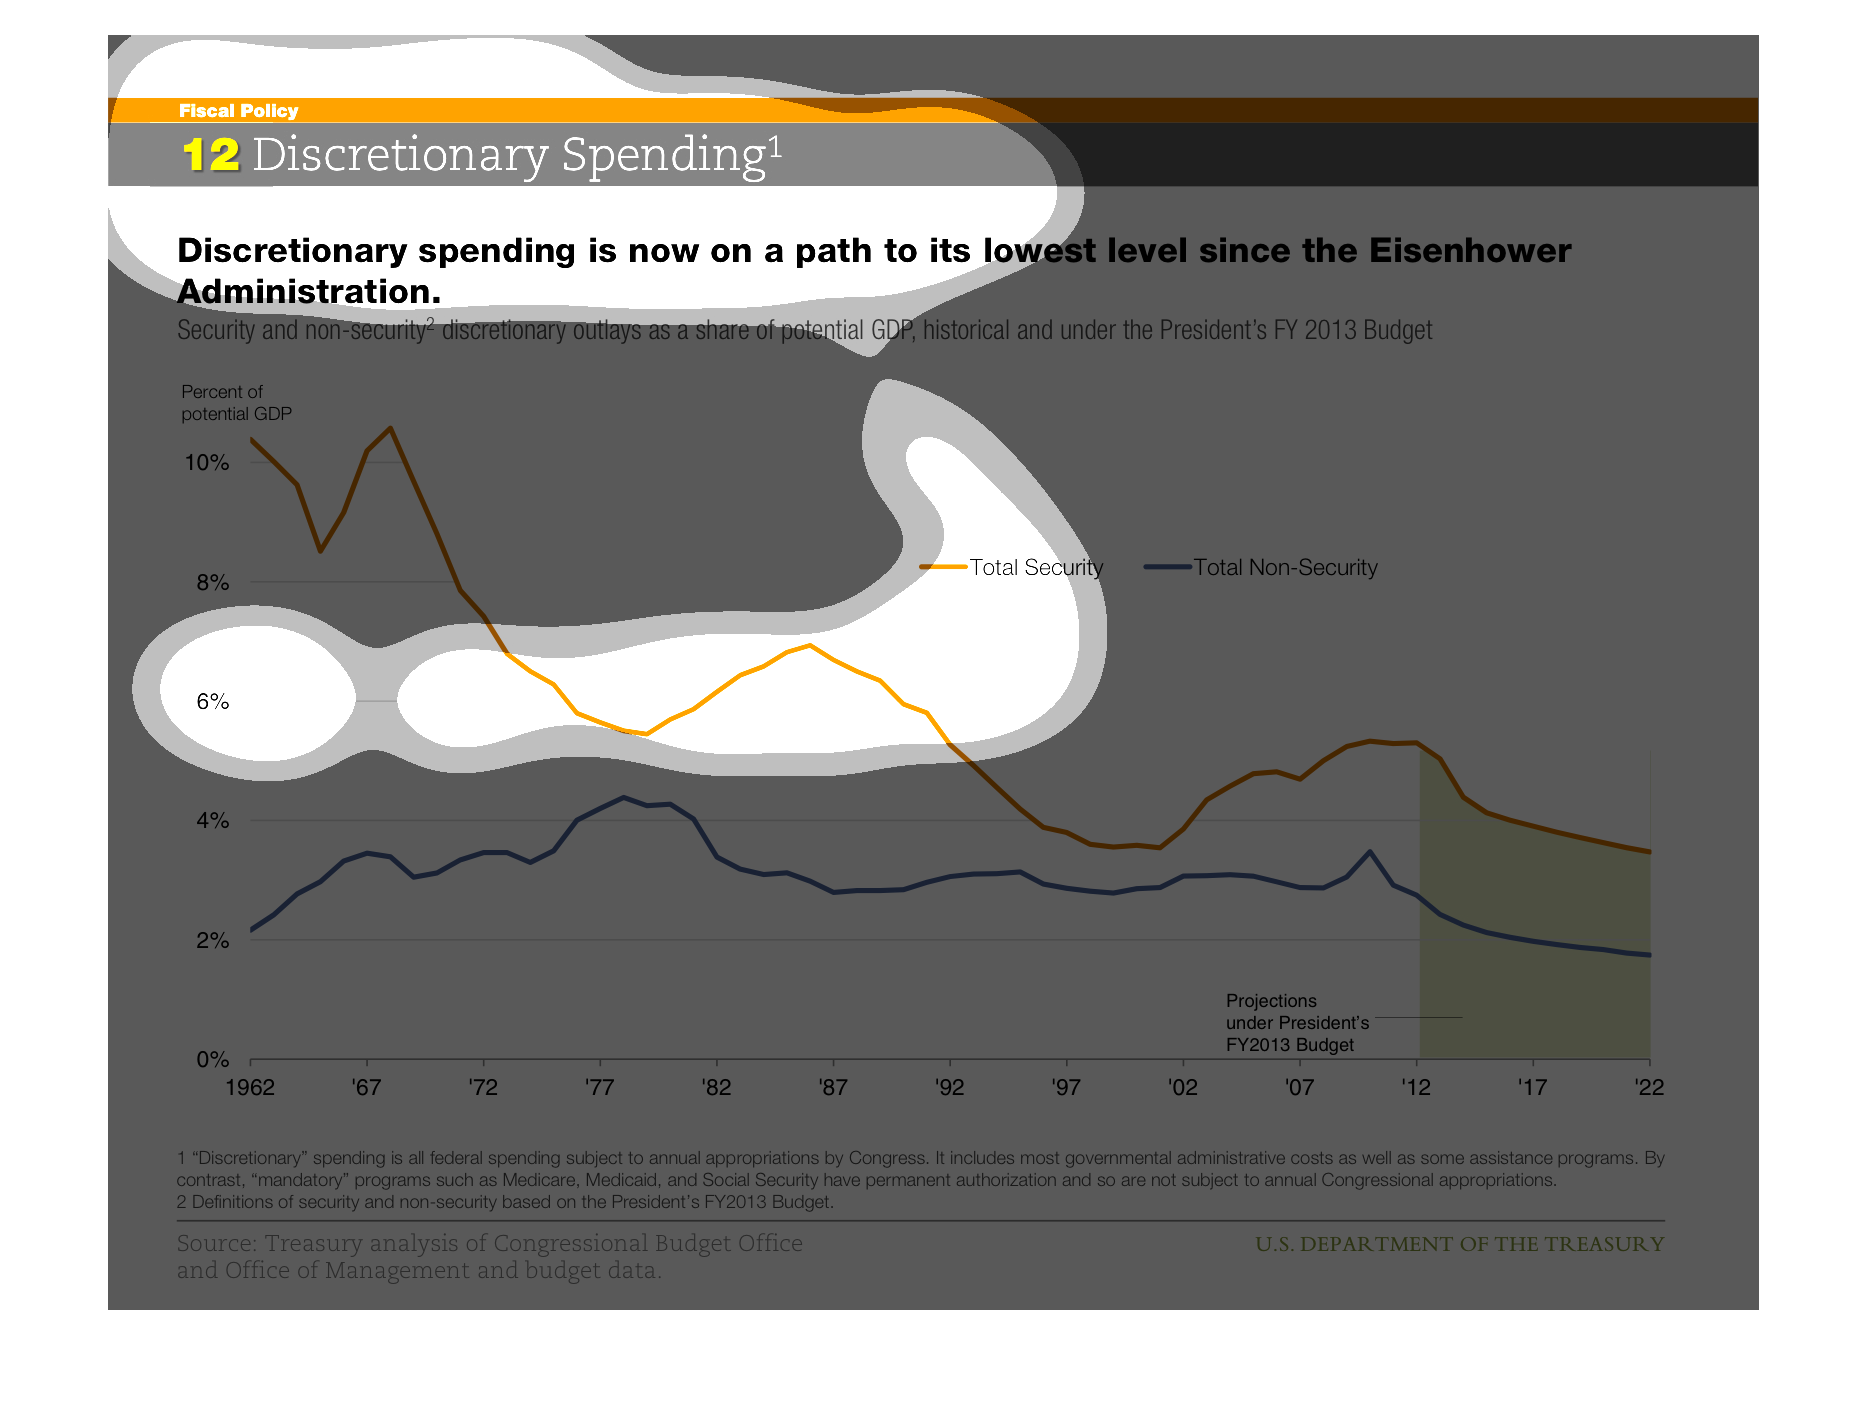
Discretionary spending is now on a path to its lowest level since the Eisenhower Administration.
 Starting in 1962, total non security went up from 2% and total security went down from 10%.
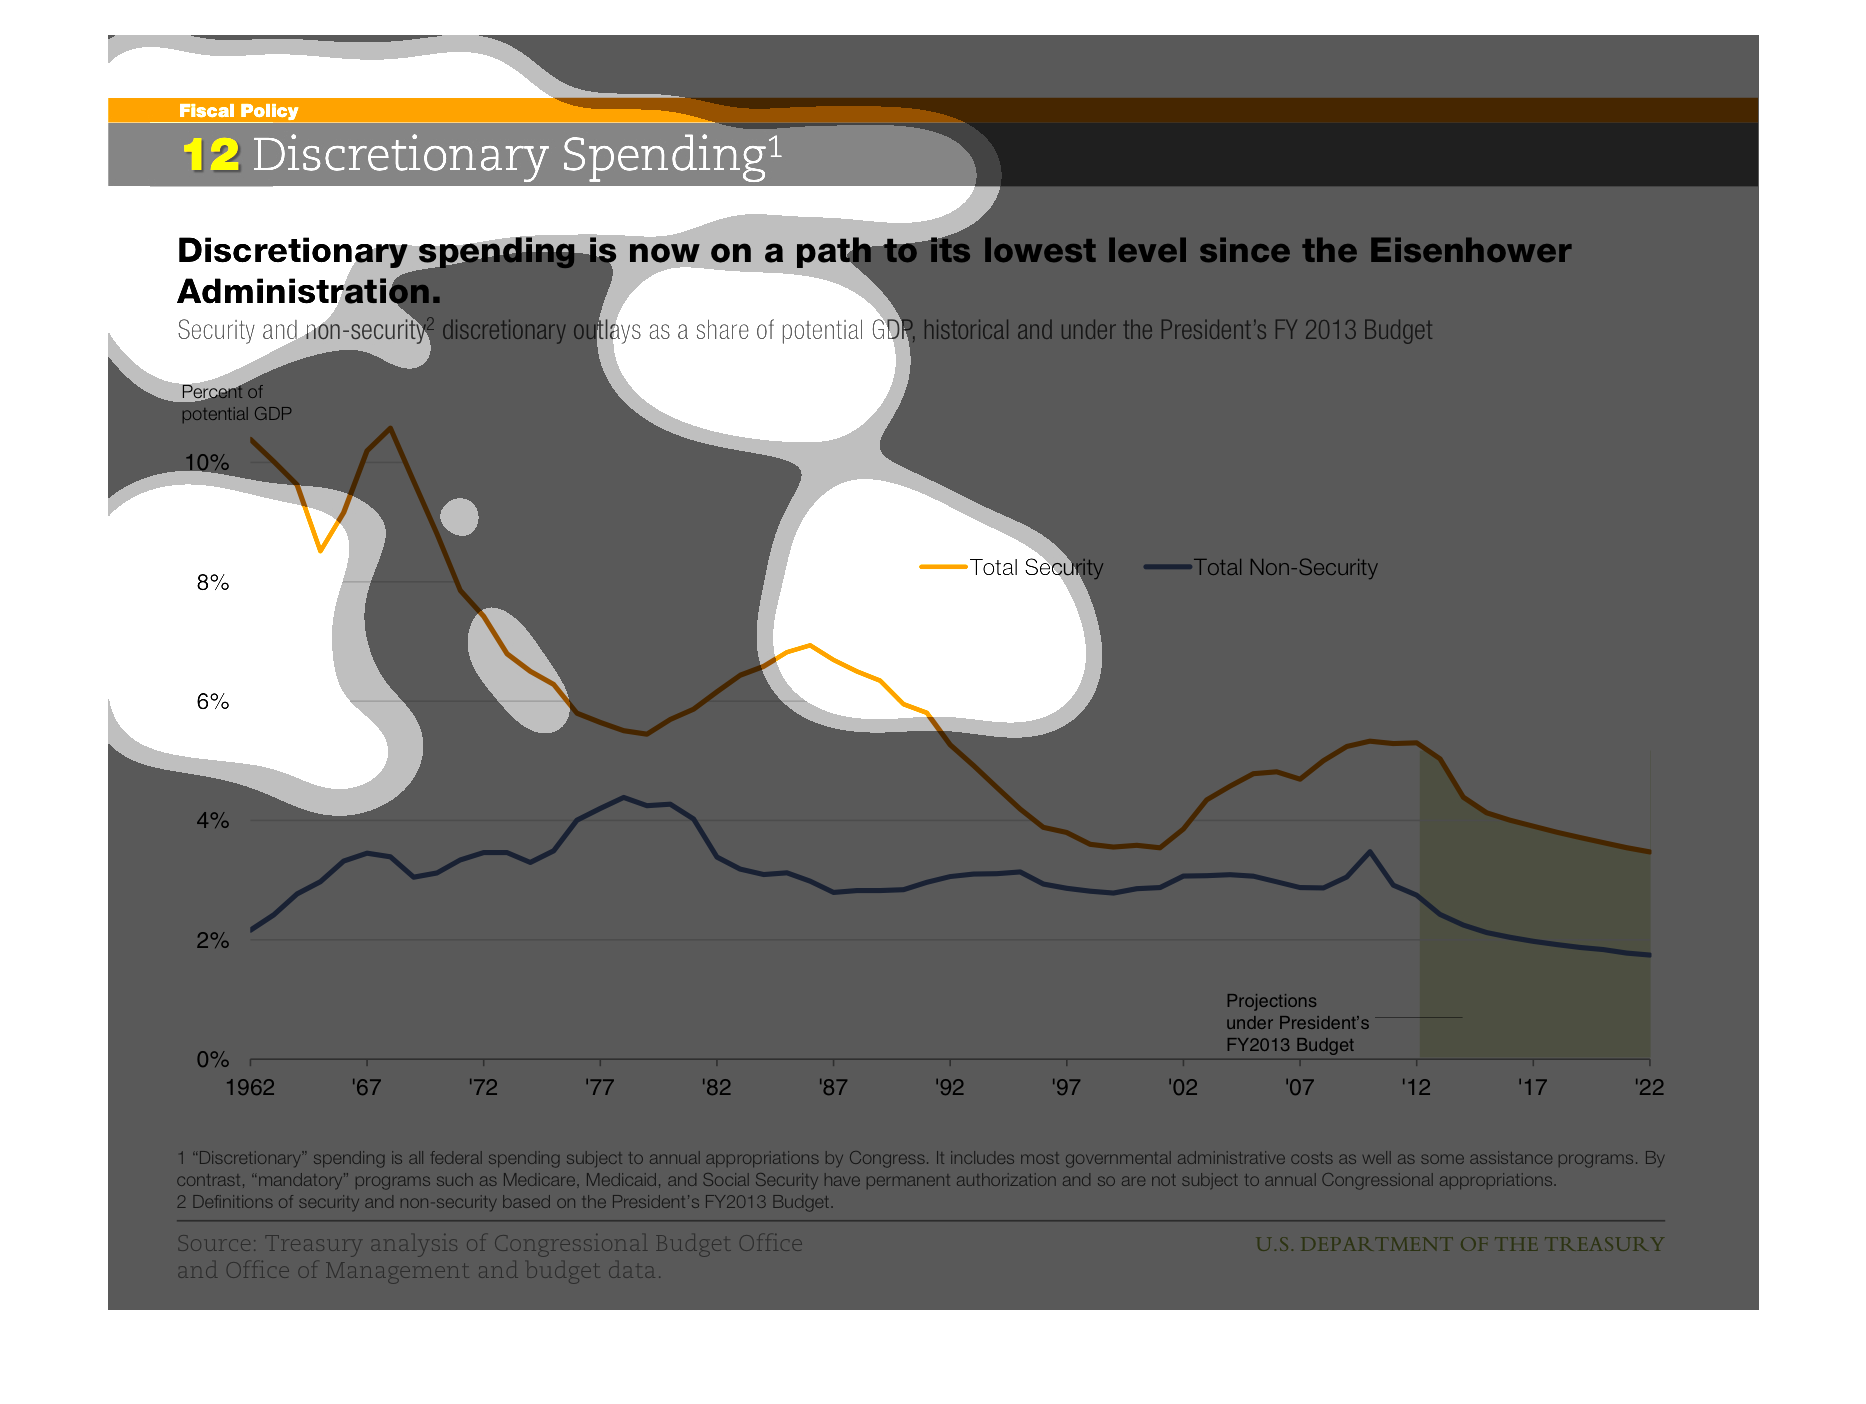
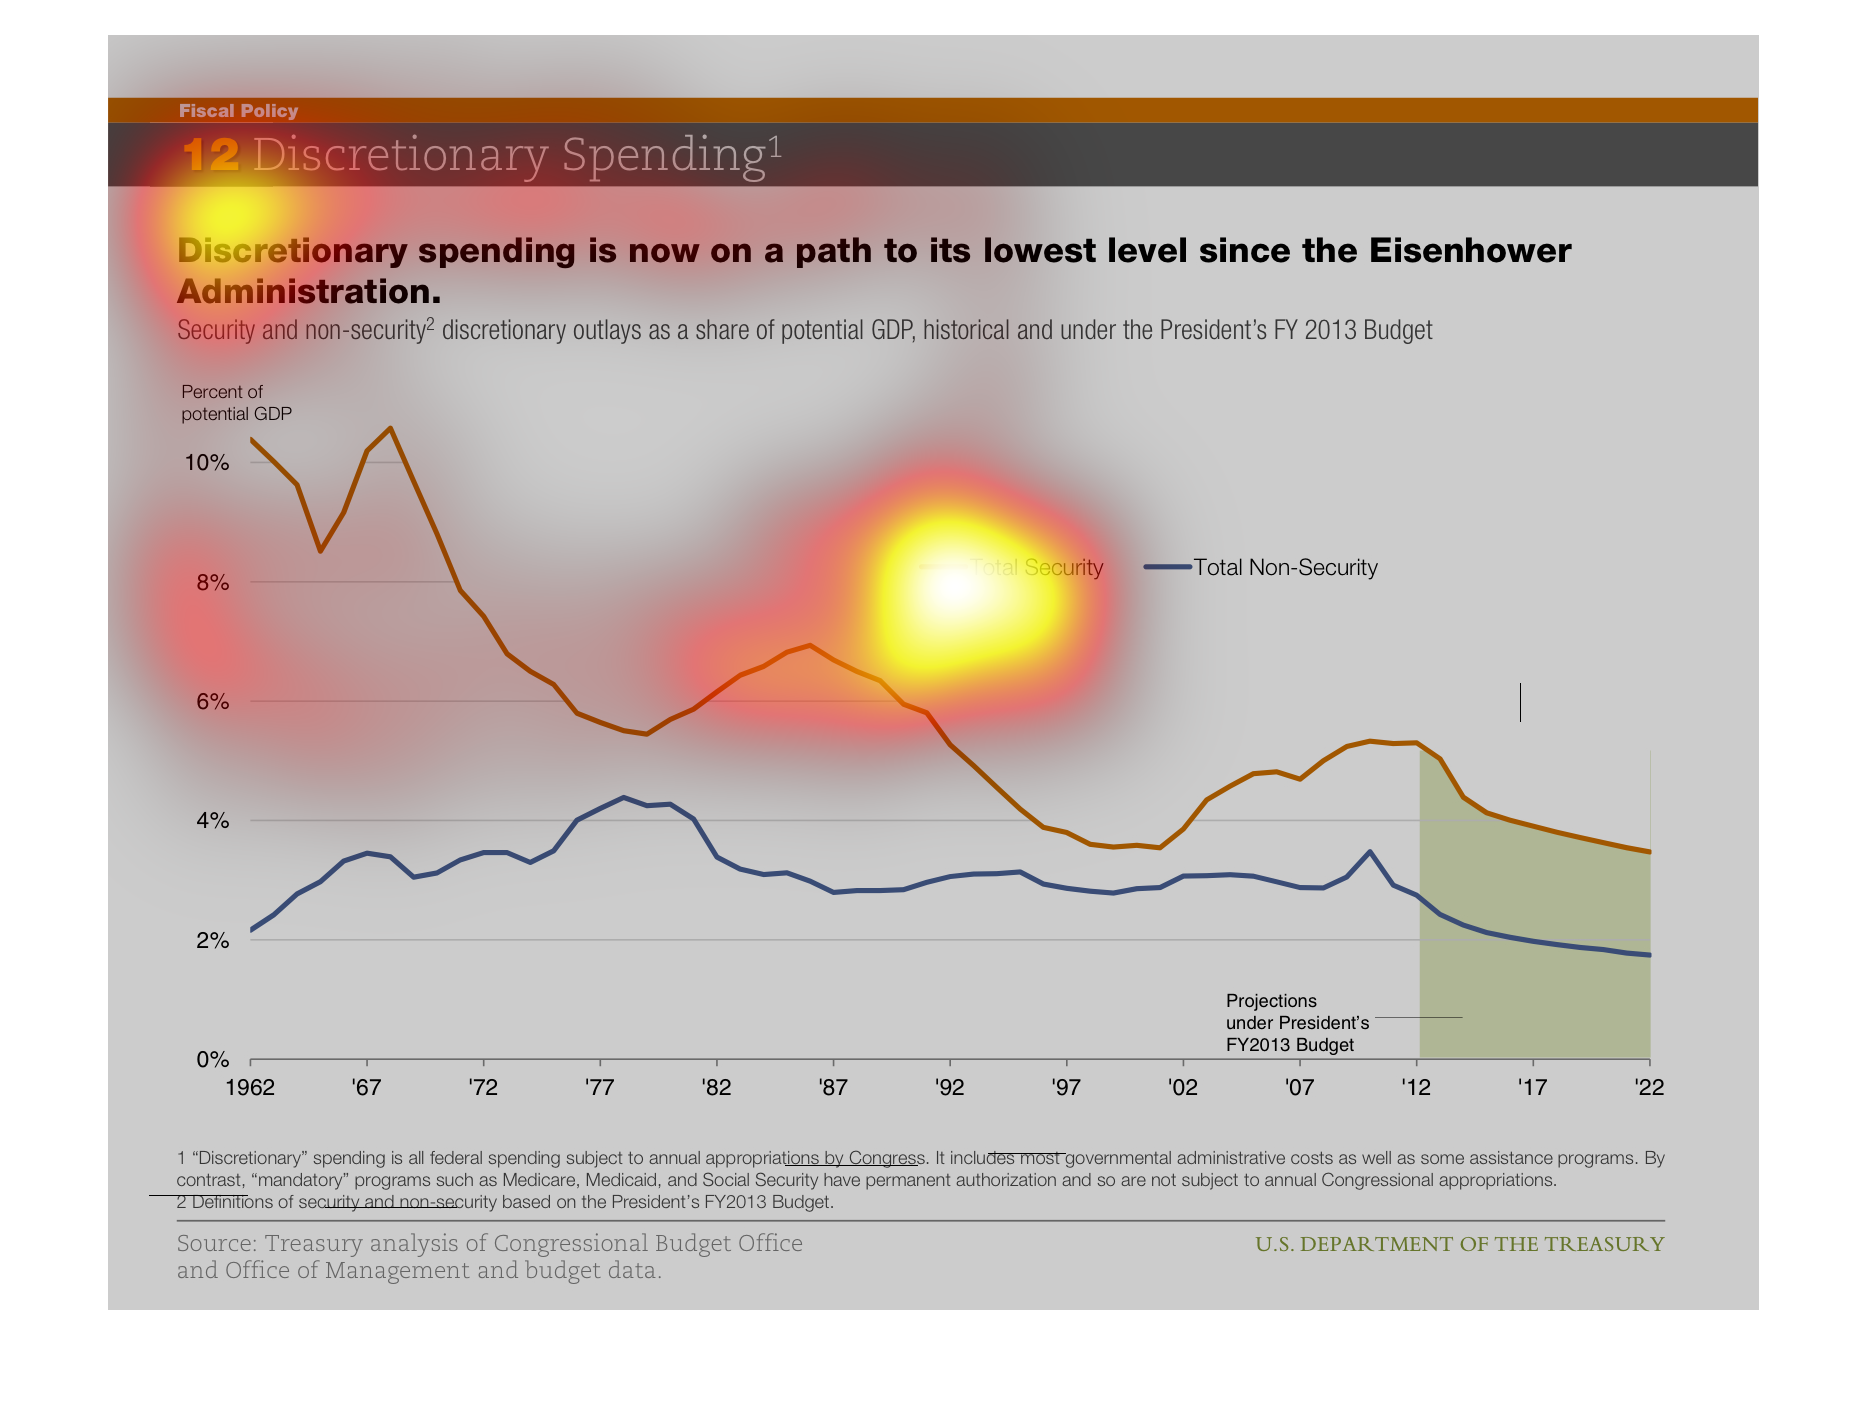
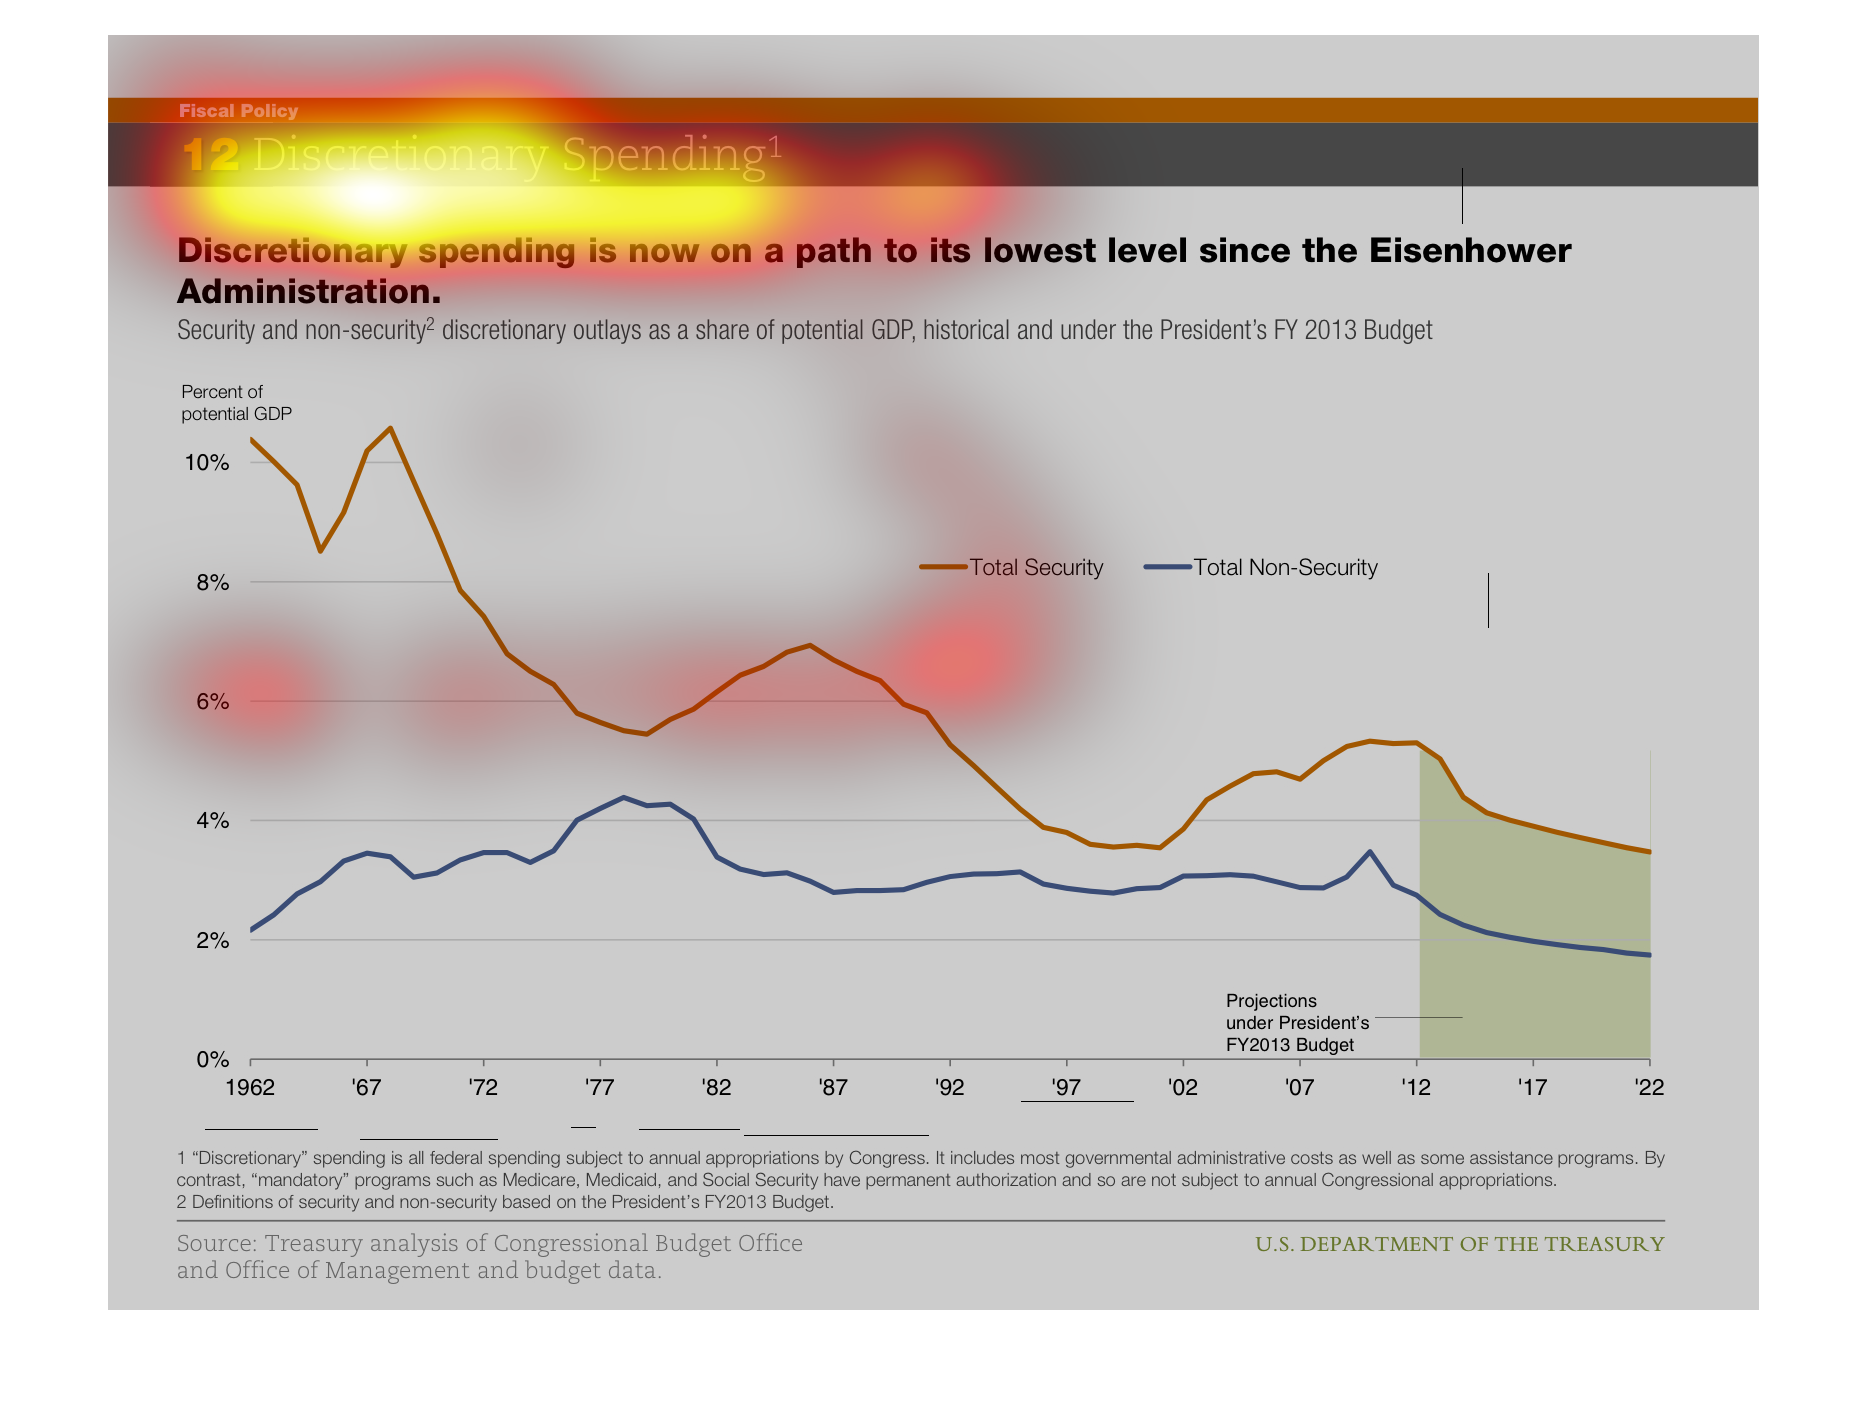
This graph shows the decline of discretionary spending since the Eisenhower Administration.
Total security has spiked down dramatically around 1967, and peaks around 4% during 2016.
Total non security is also accounted for, but does not have as much of a dramatic change as
total security.
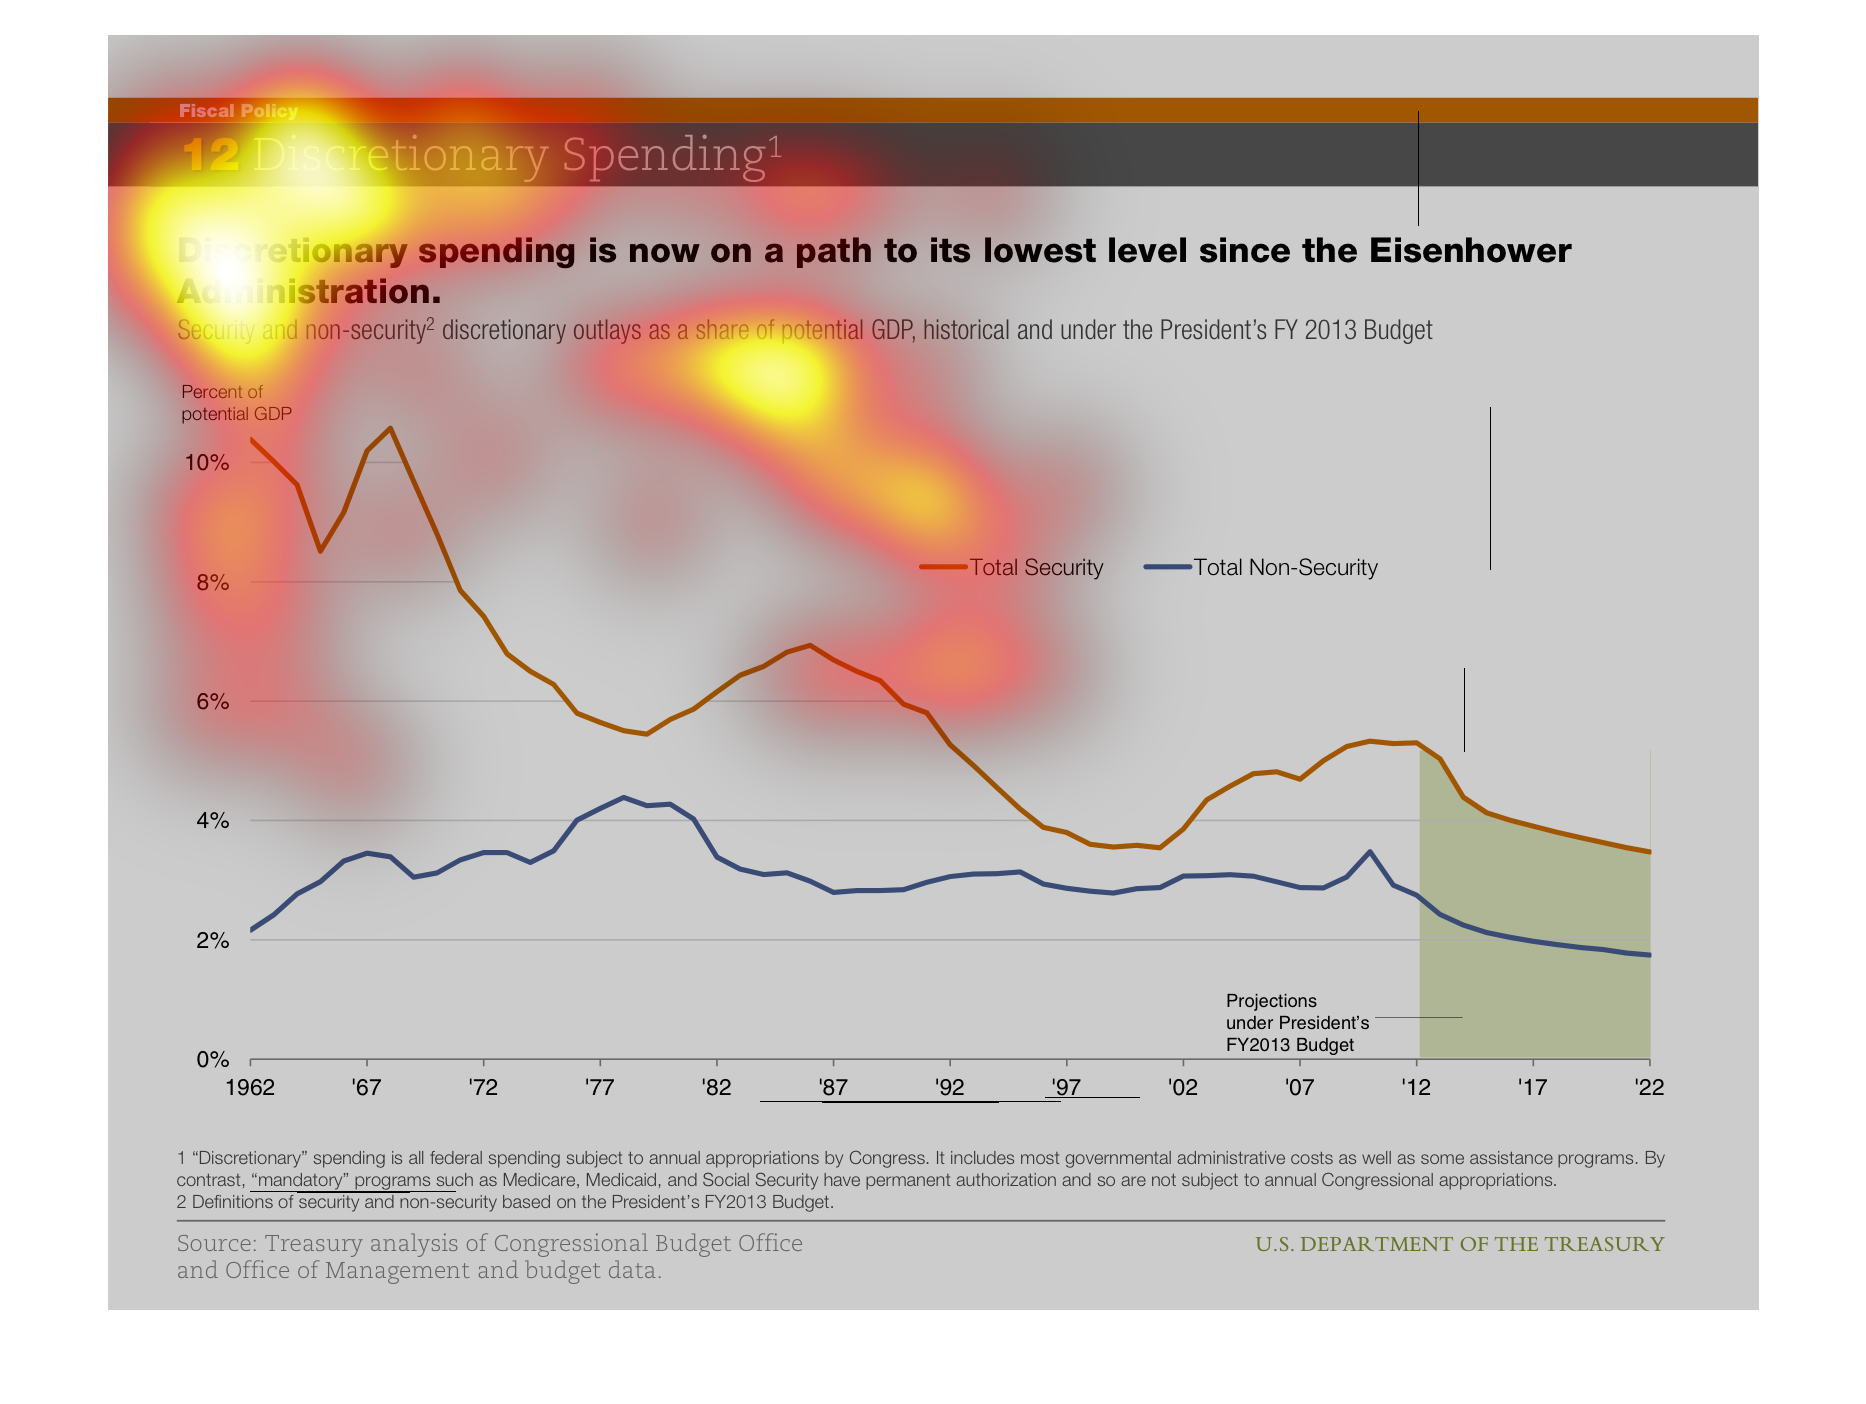
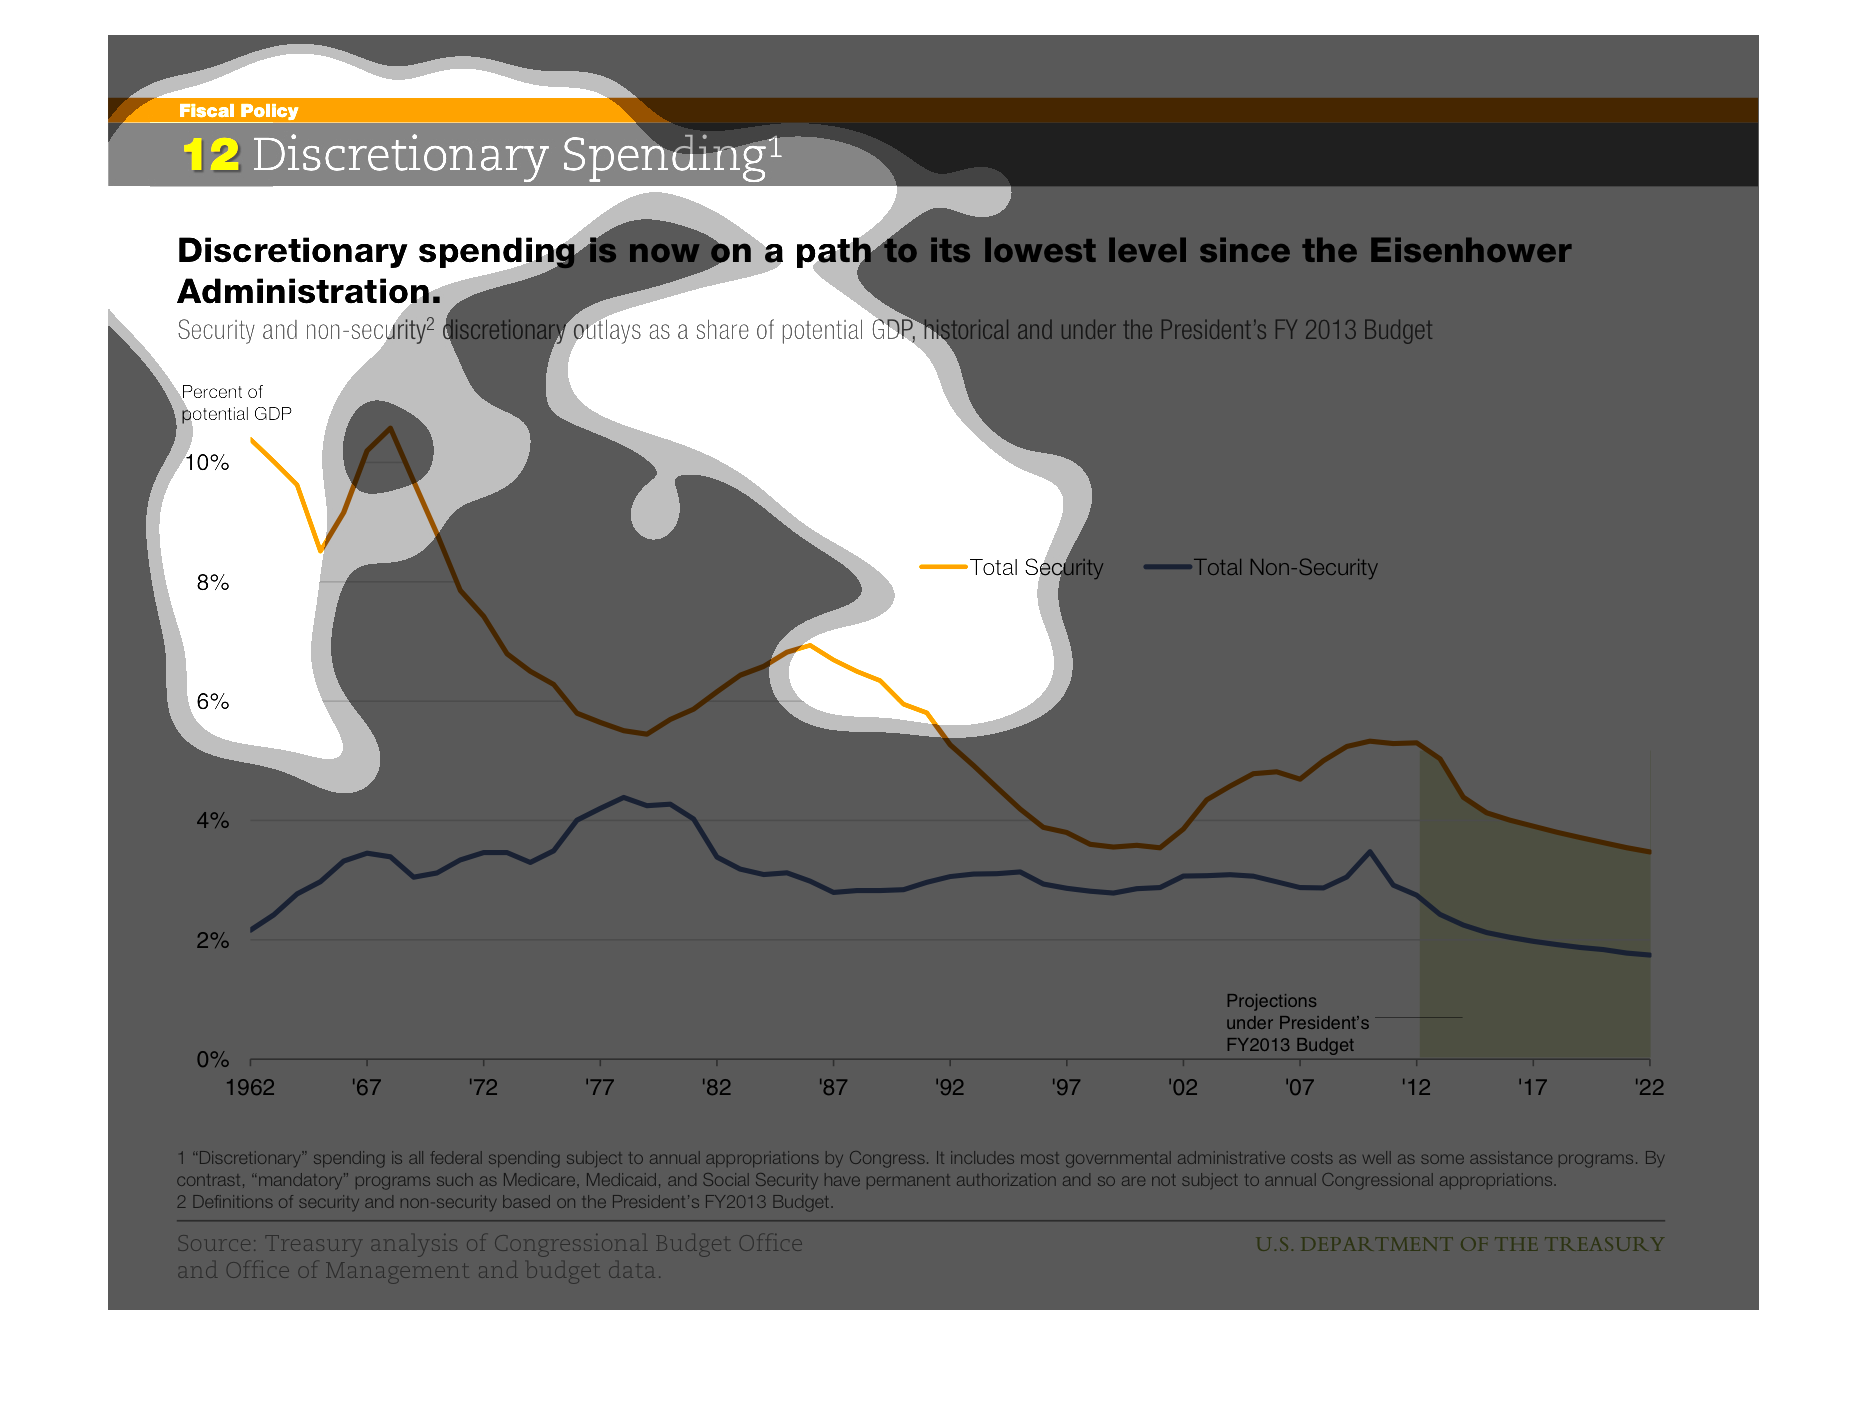
This is a moving average of government spending between 1962 and 2012, with forecasts based
on  presidential plans through 2022. It is divided into security and non security categories.
Non security stays about the same, but security is on a decline, and at it's lowest point
ever.
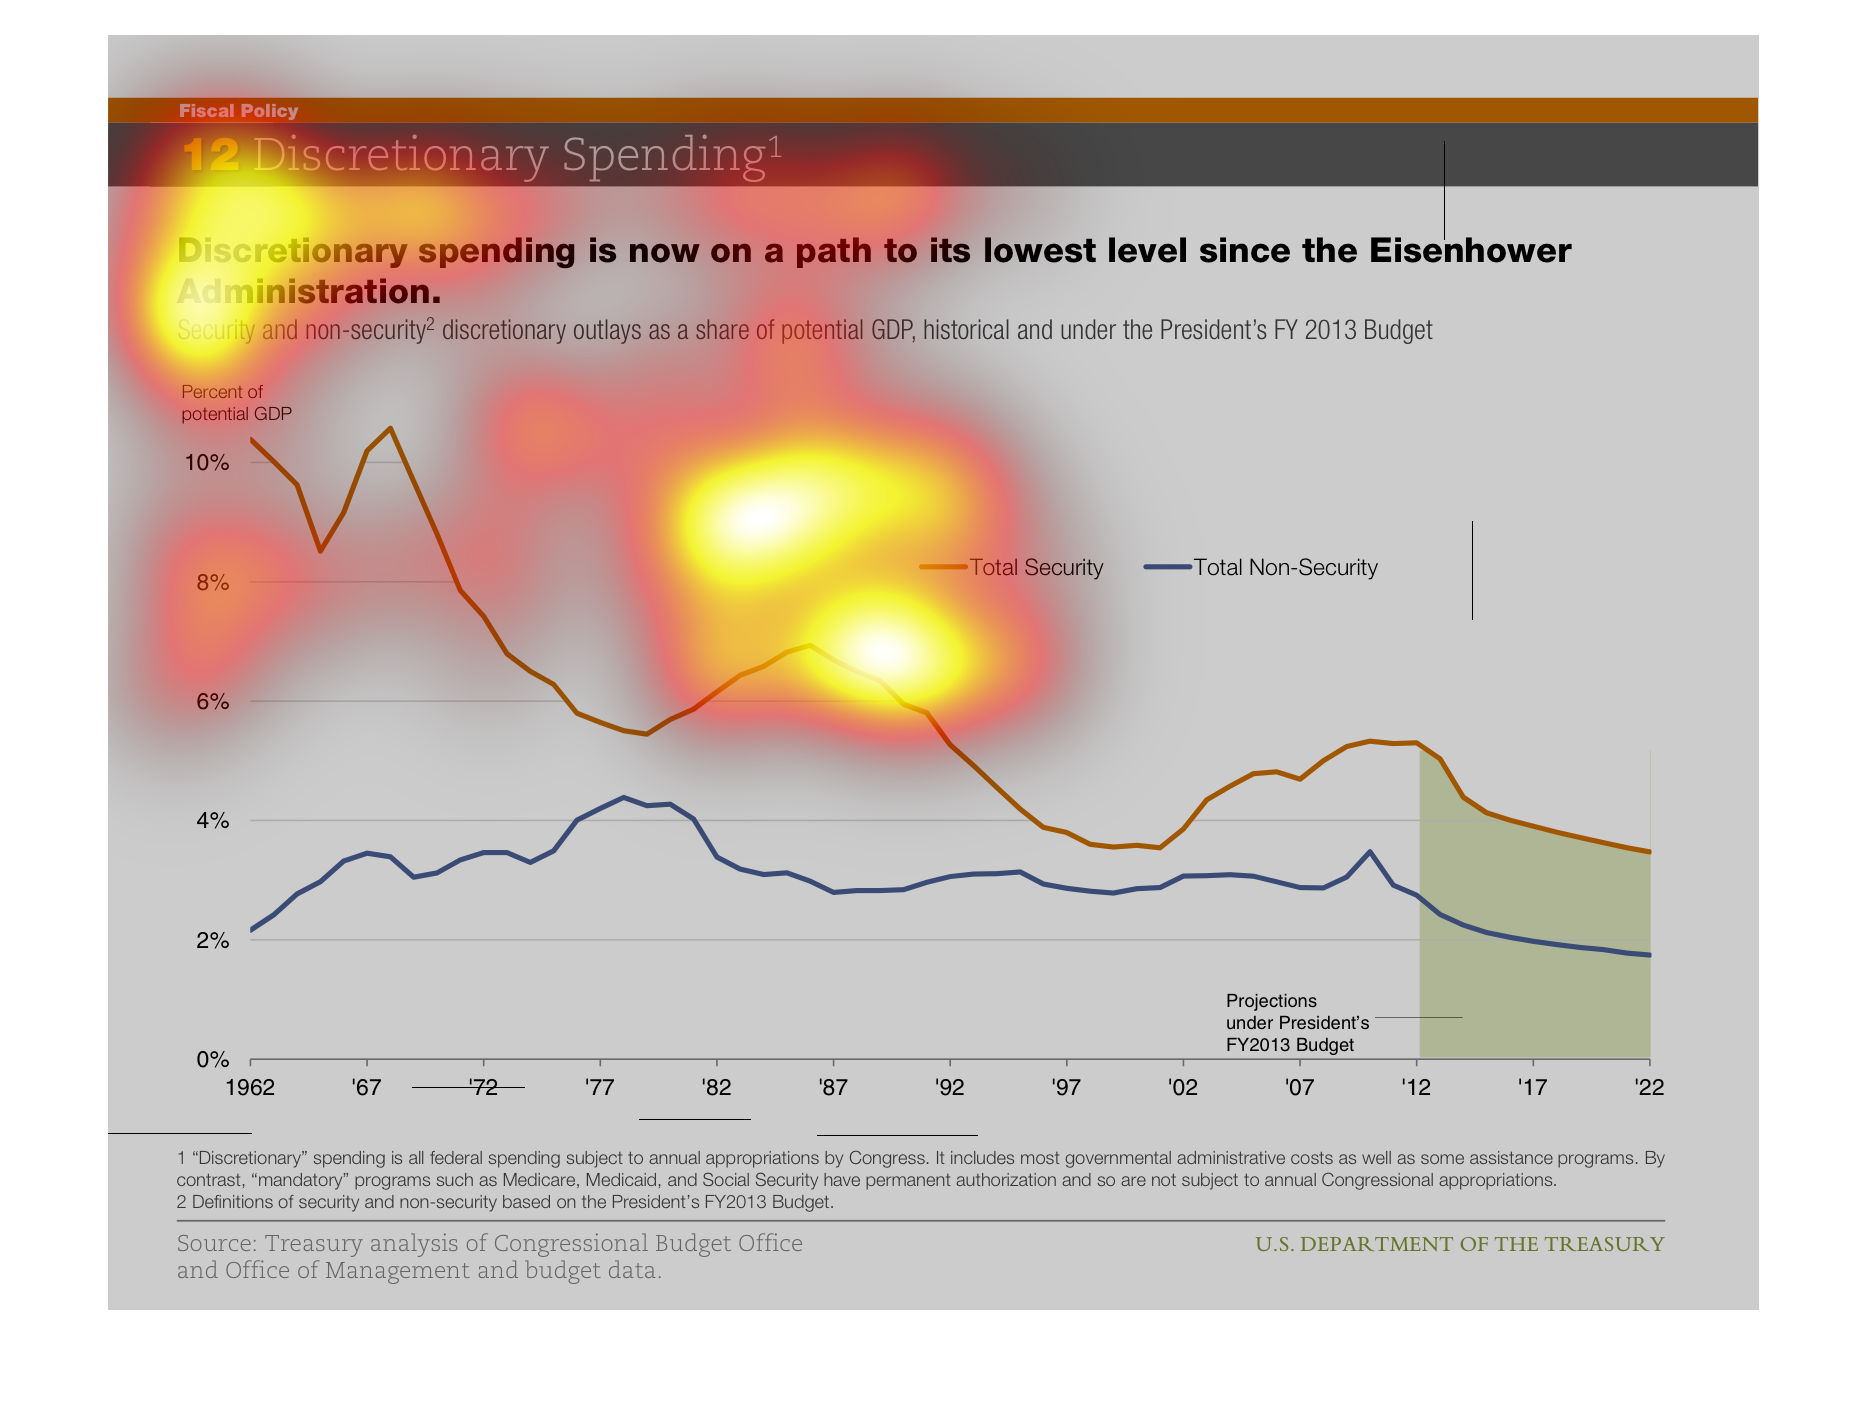
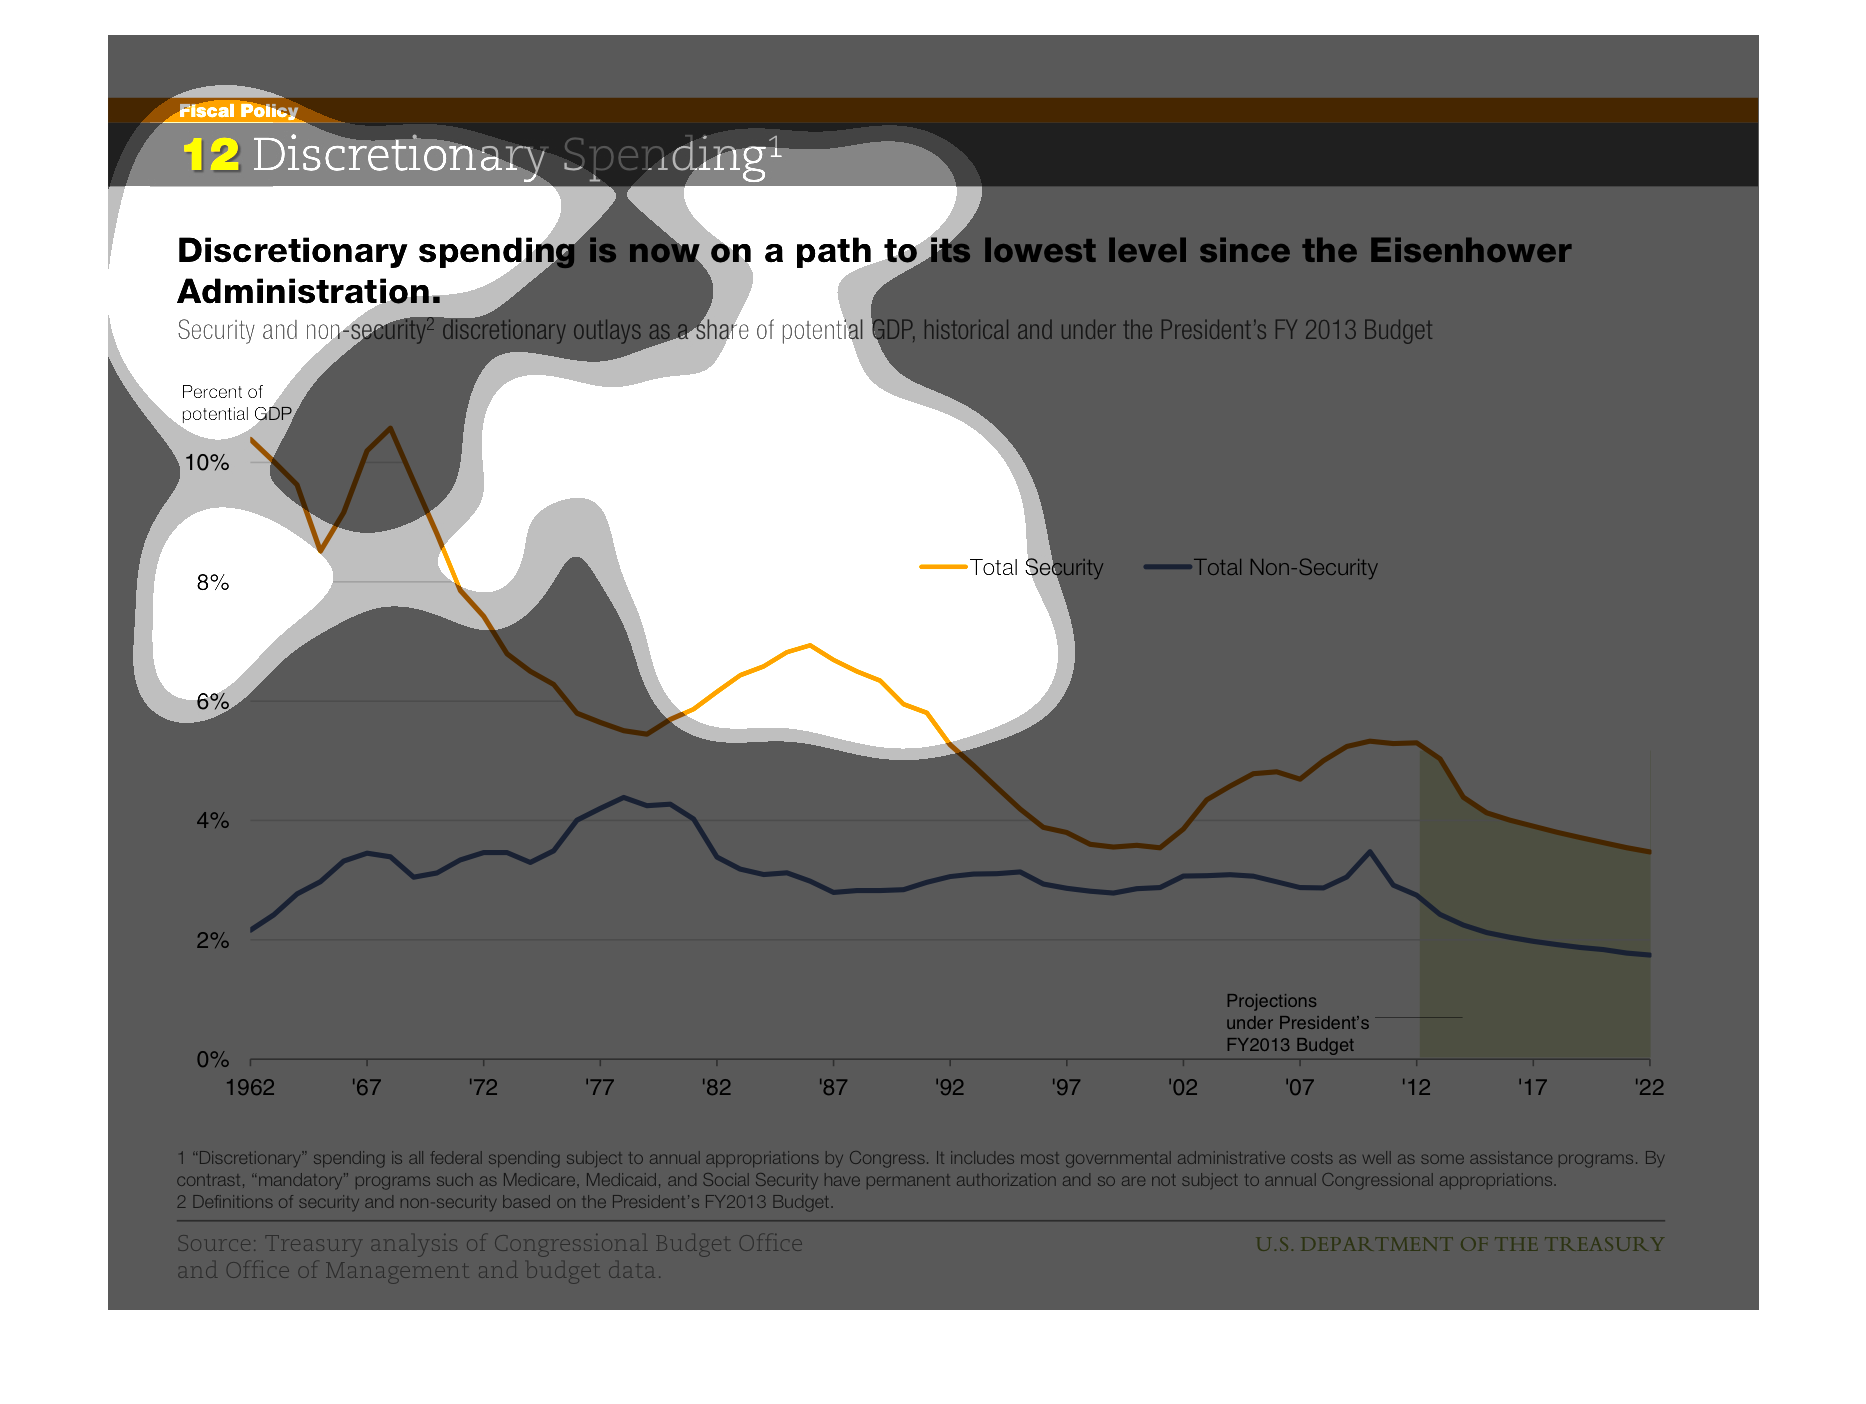
Chart showing the discretionary spending of Americans by year along with the GDP, it shows
that it is now at the lowest levels since the Eisenhower presidency.
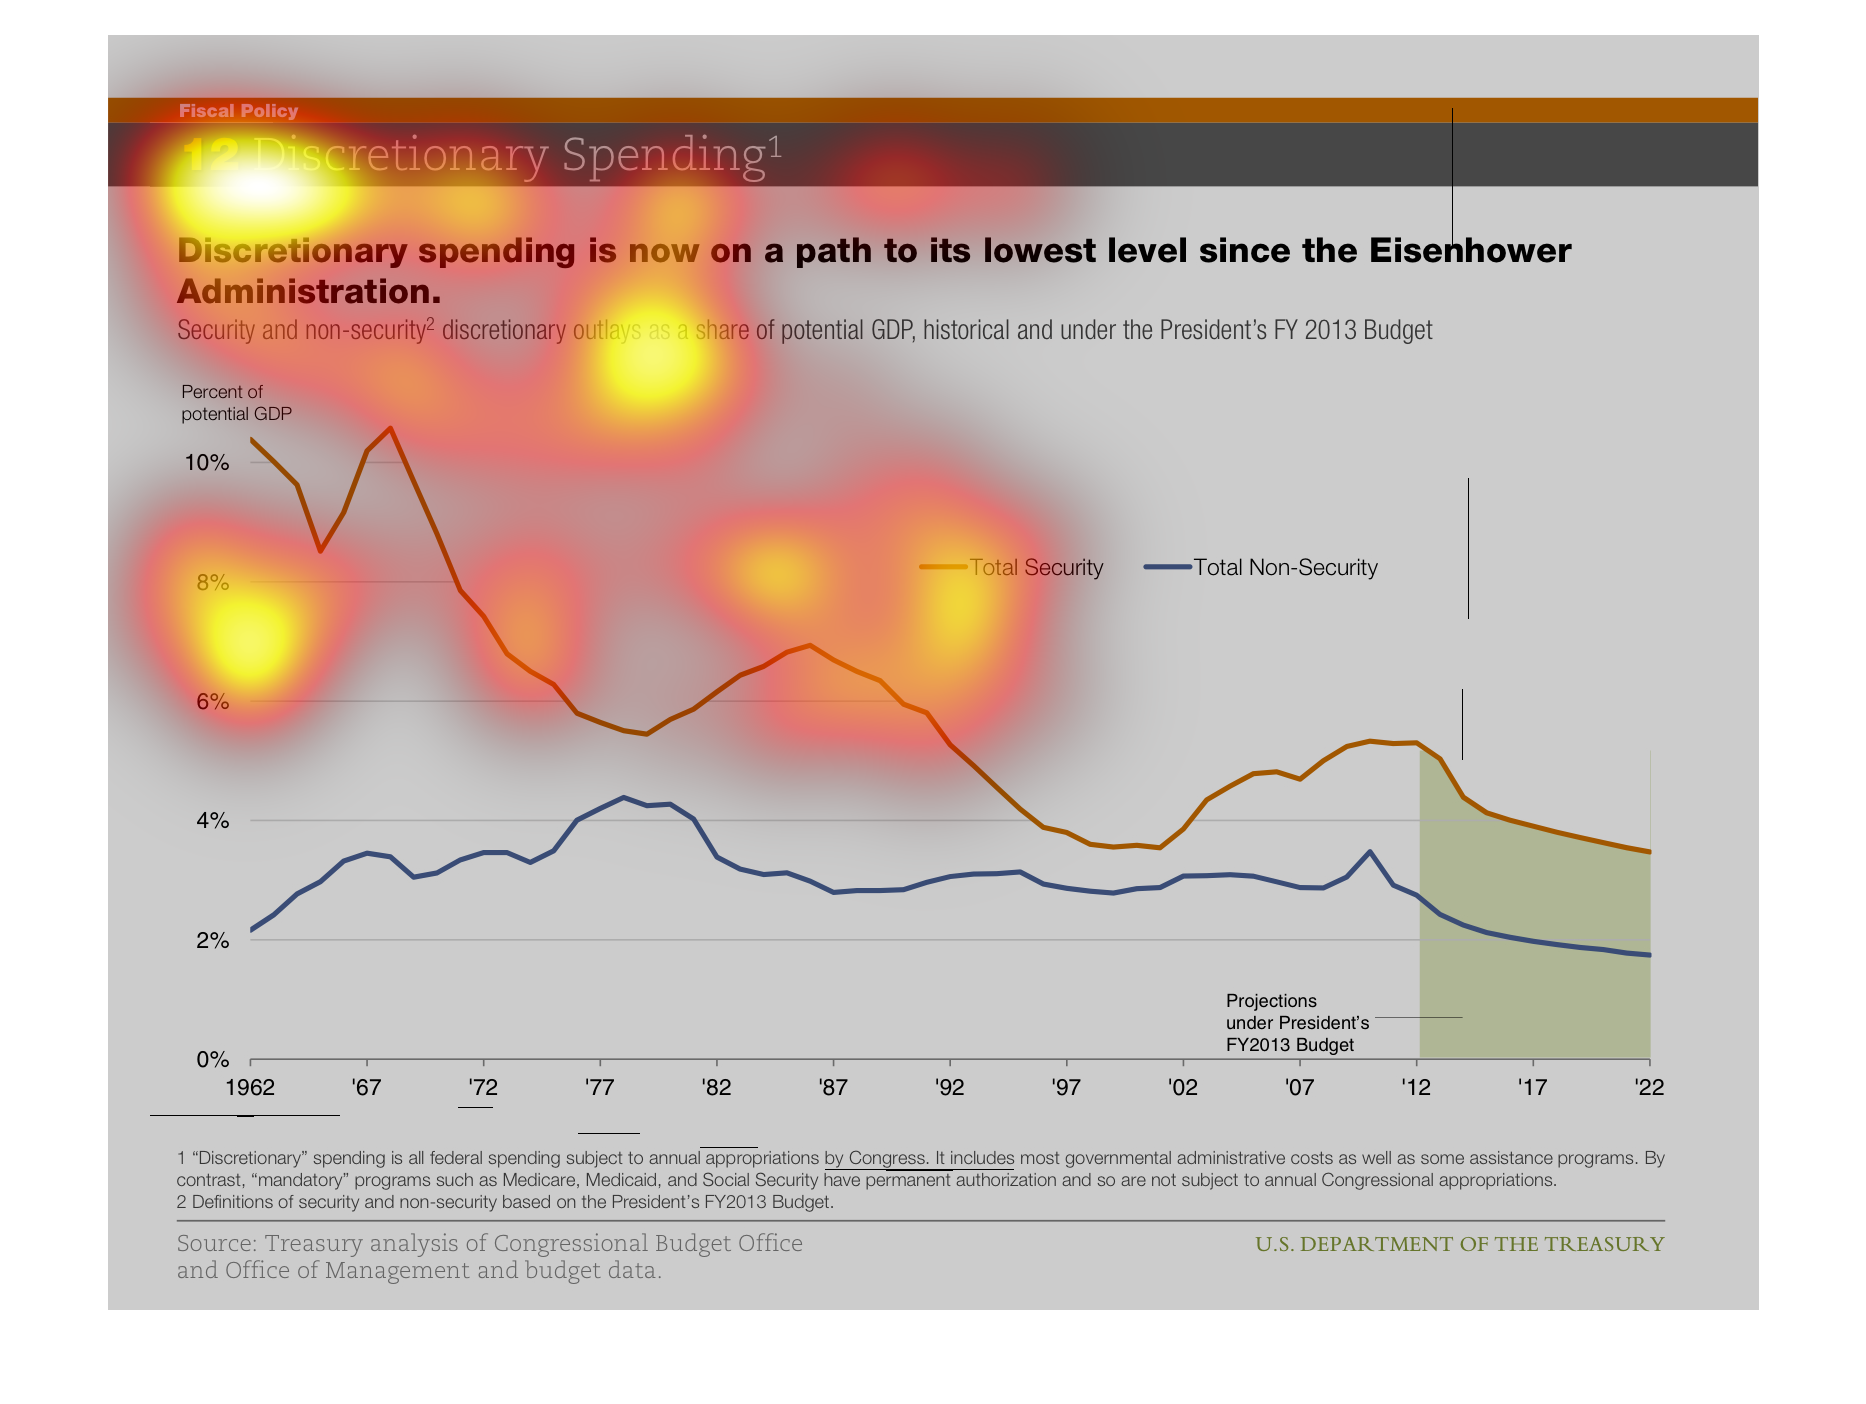
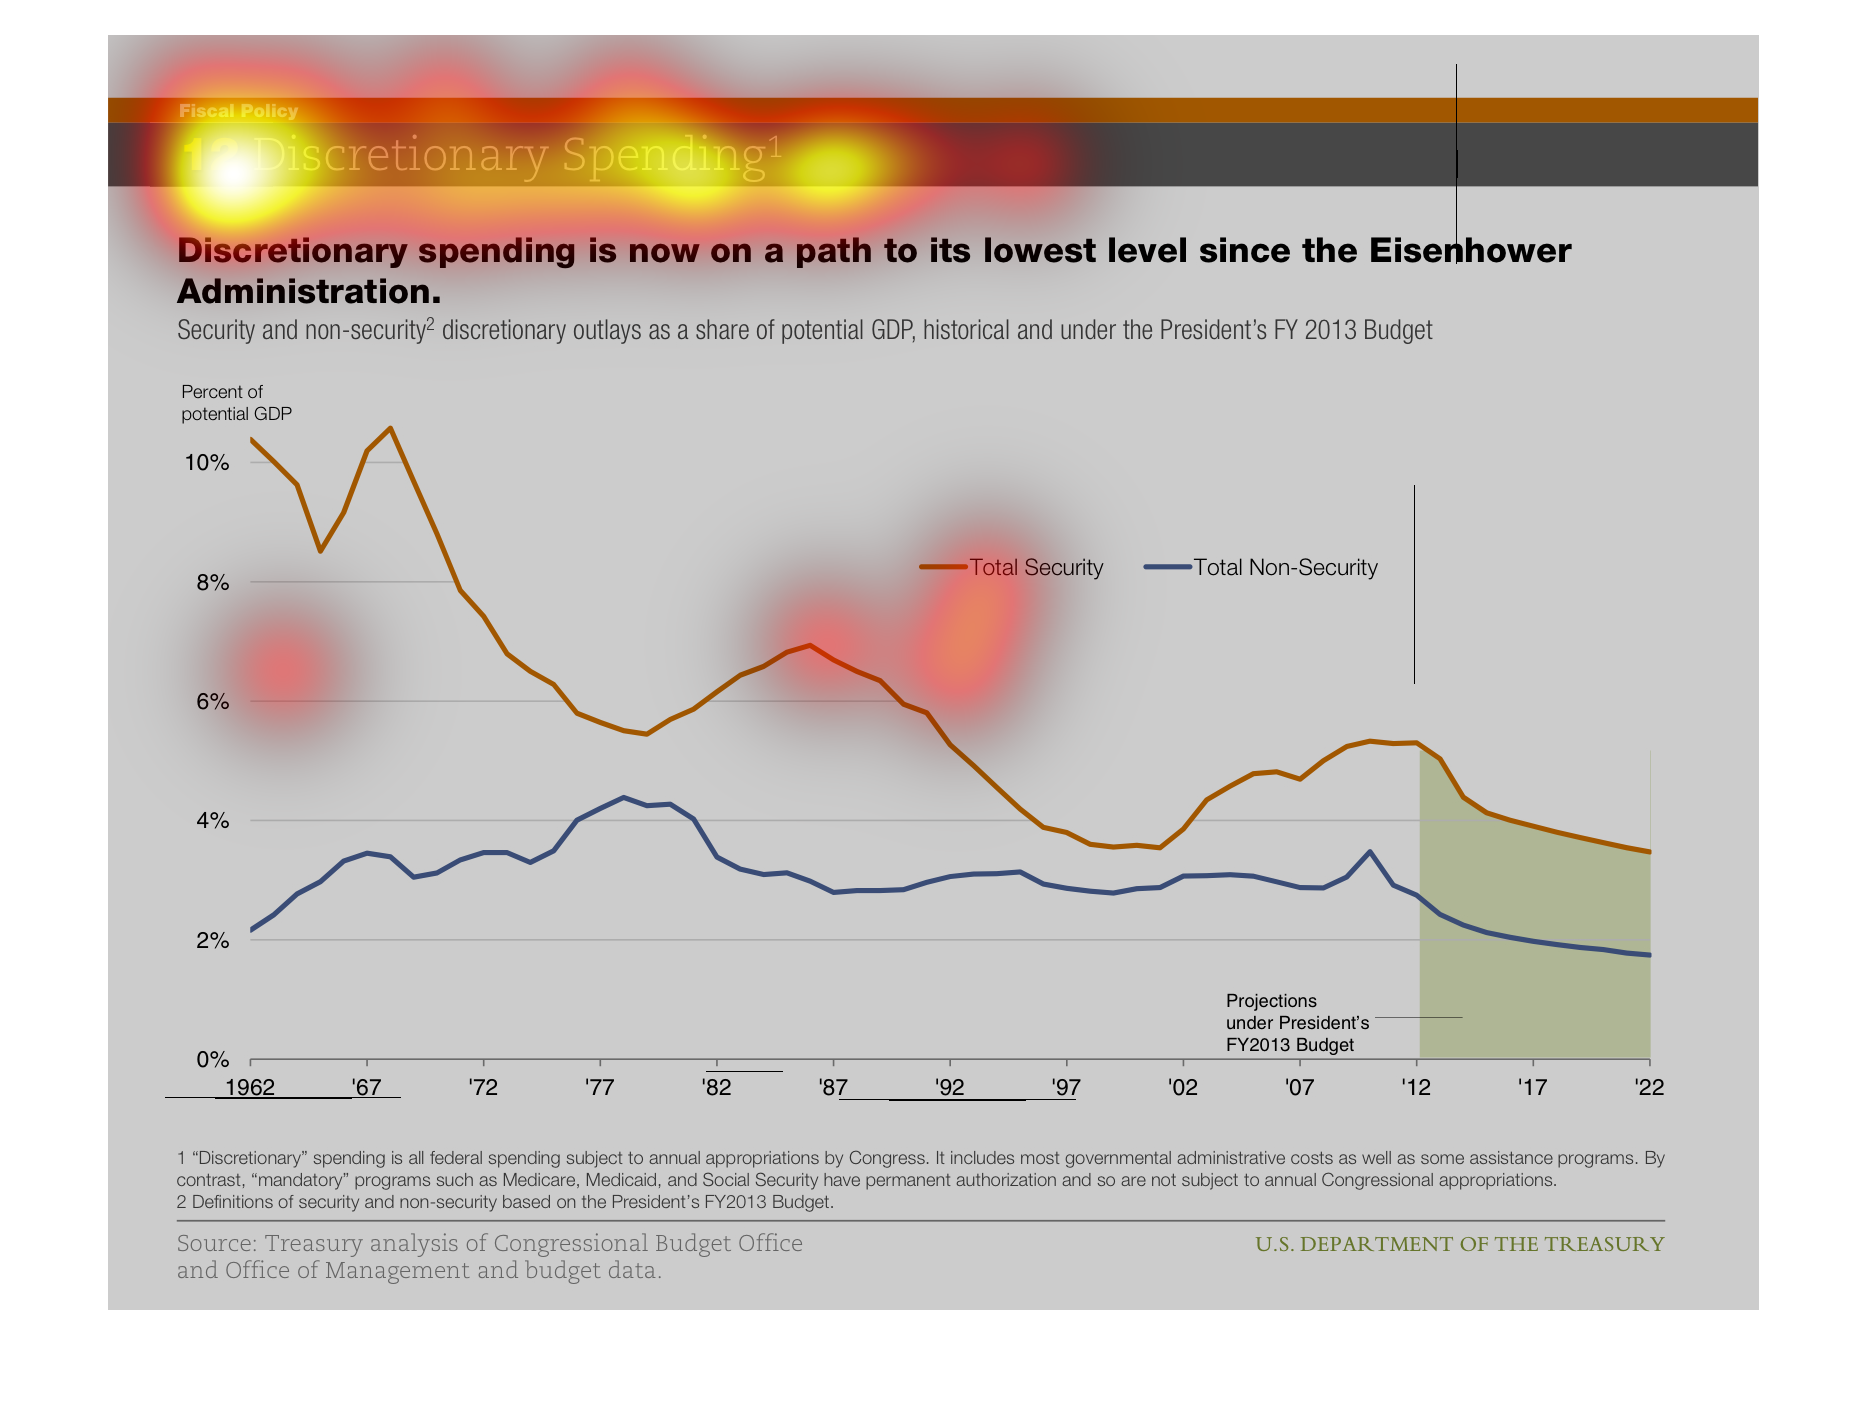
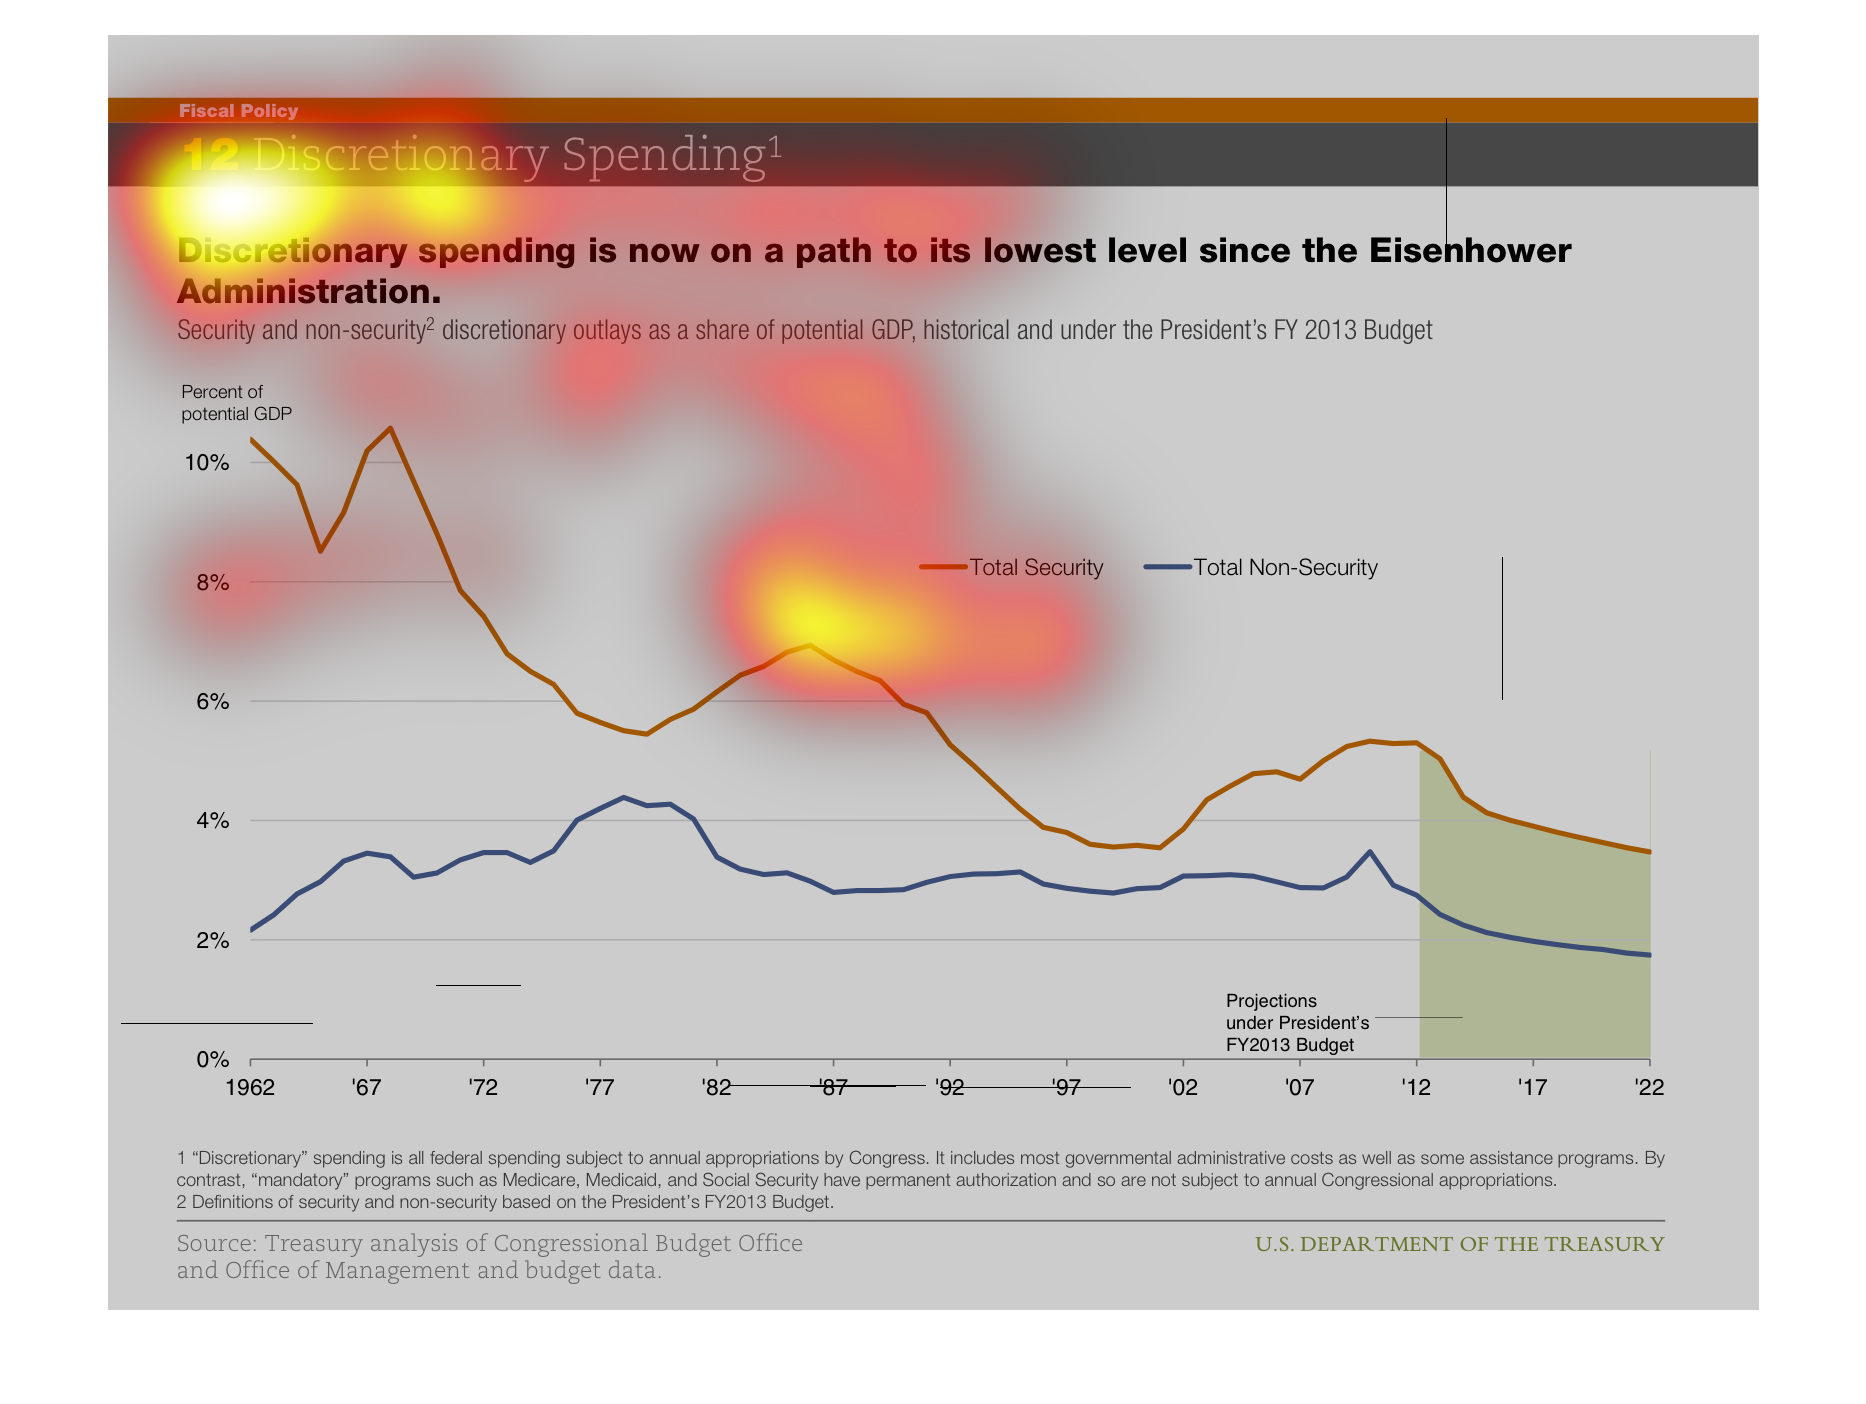
This chart describes discretionary spending since the Eisenhower administration, beginning
in 1962 and continues through 2012, with projections through 2022. The chart shows that discretionary
spending is at its lowest point as of 2012.
THIS PLOT SHOWS THAT BOTH SECURITY AND NON SECURITY DISCRETIONARY SPENDING HAS DECREASING
OVER THE LAST SEVERAL DECADES AND IS PROJECTED TO DECREASE FURTHER.
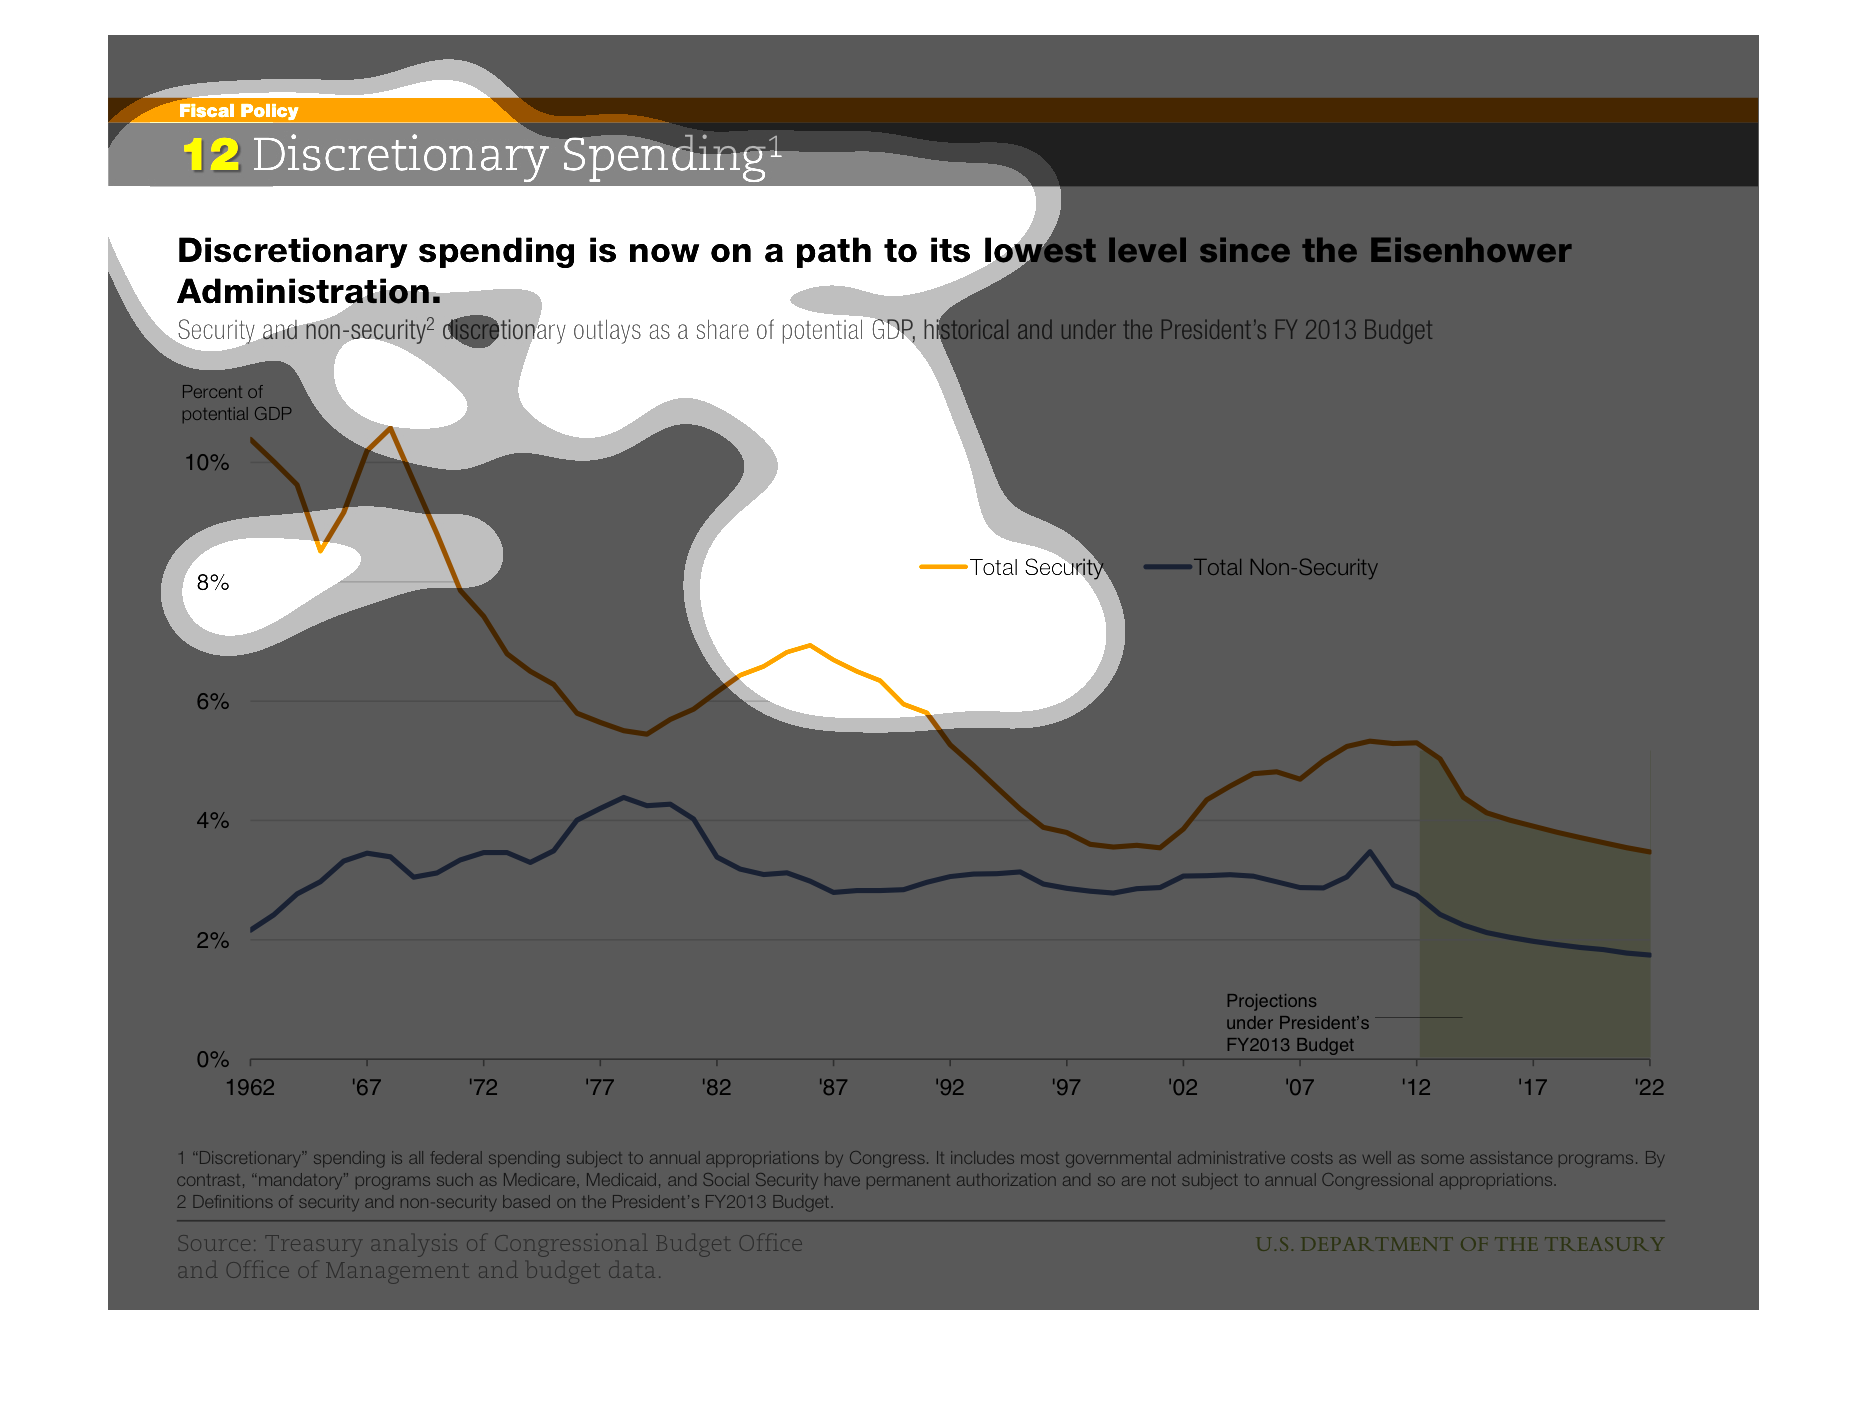
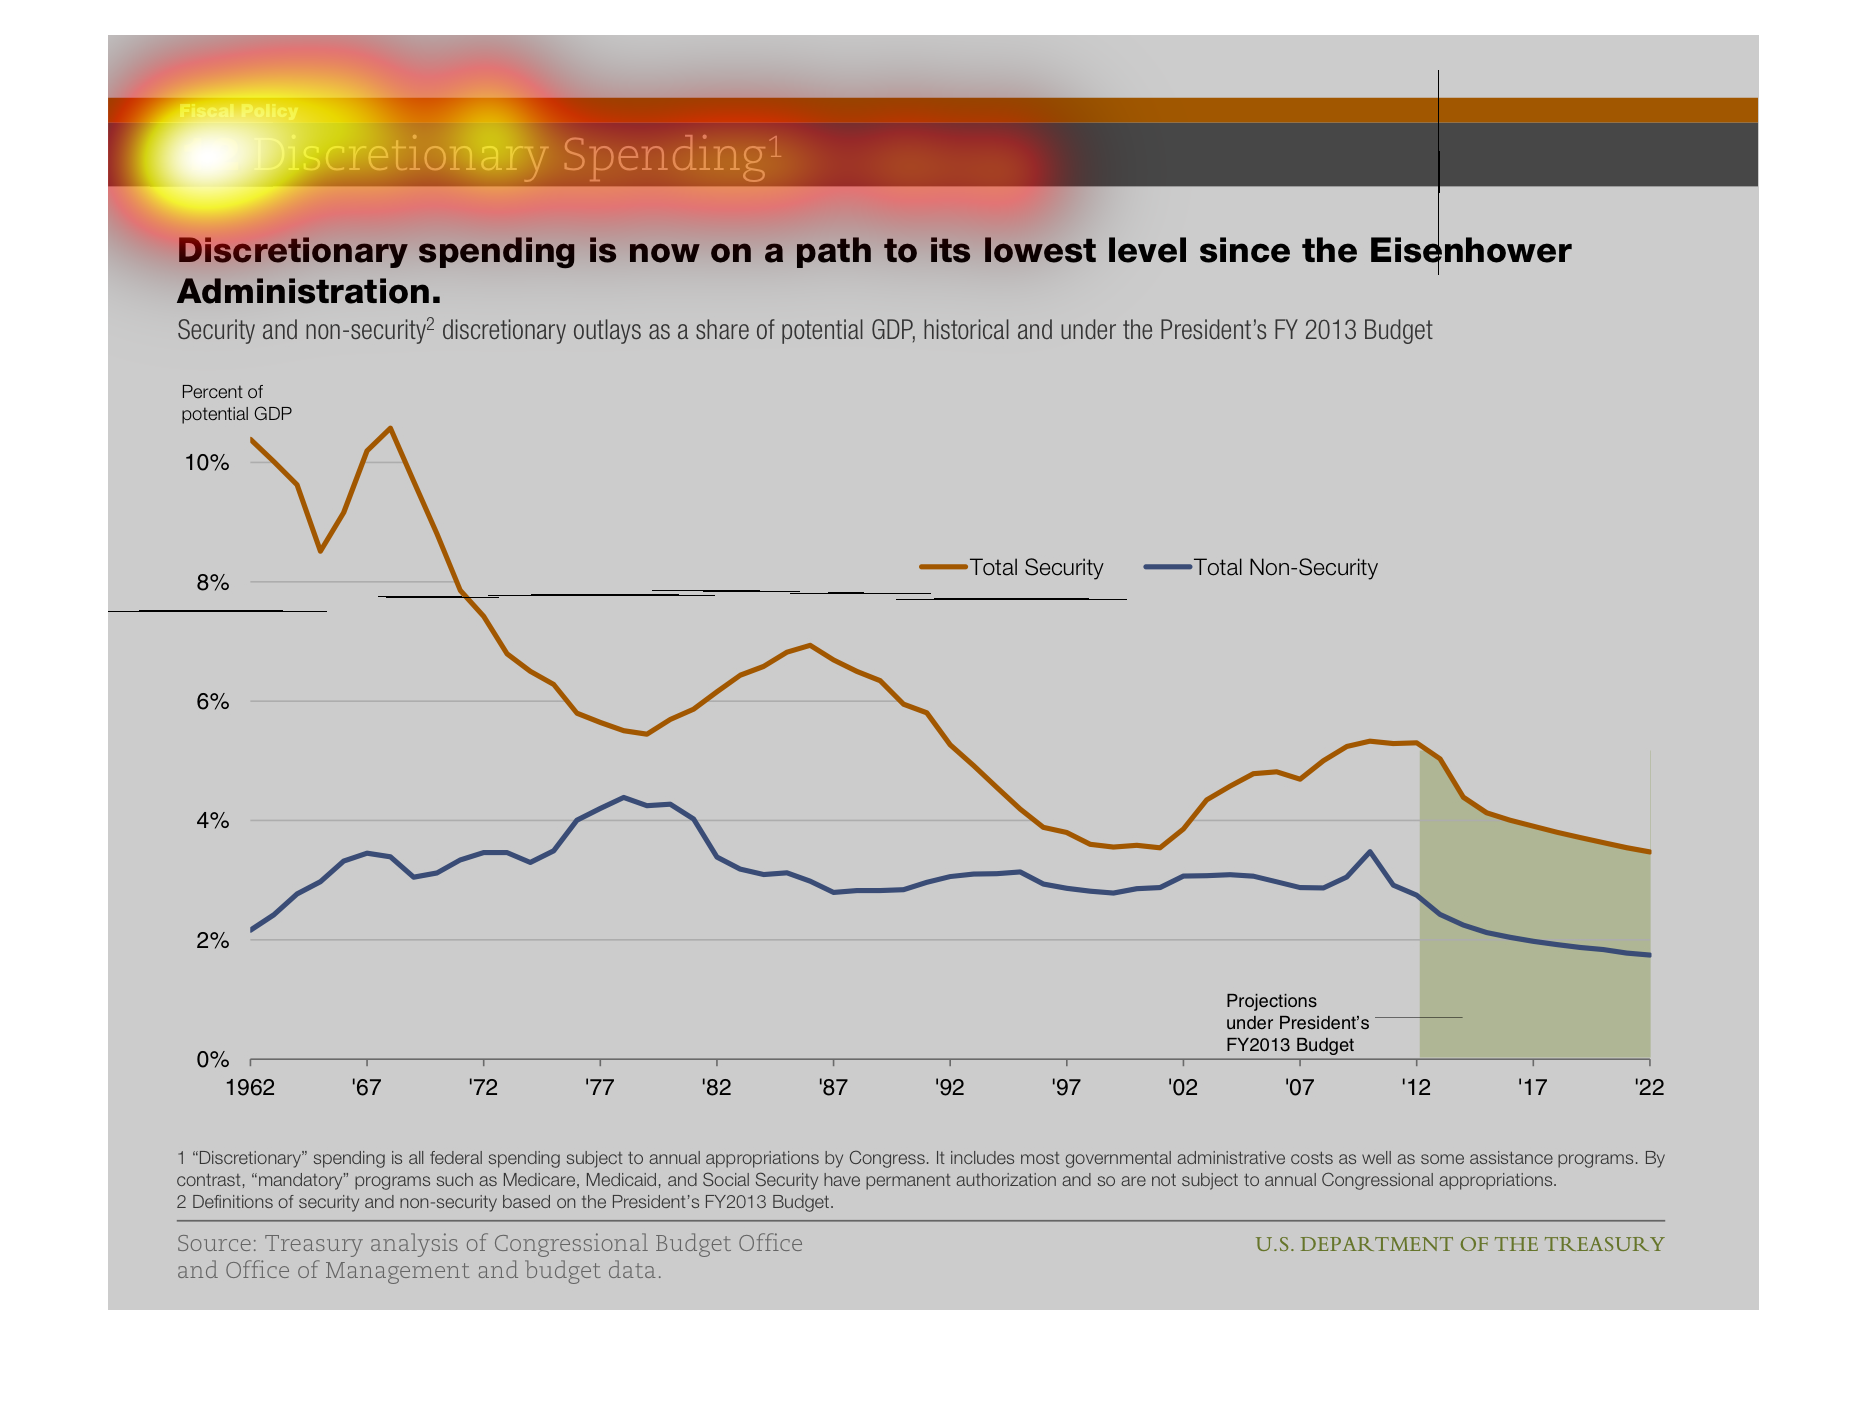
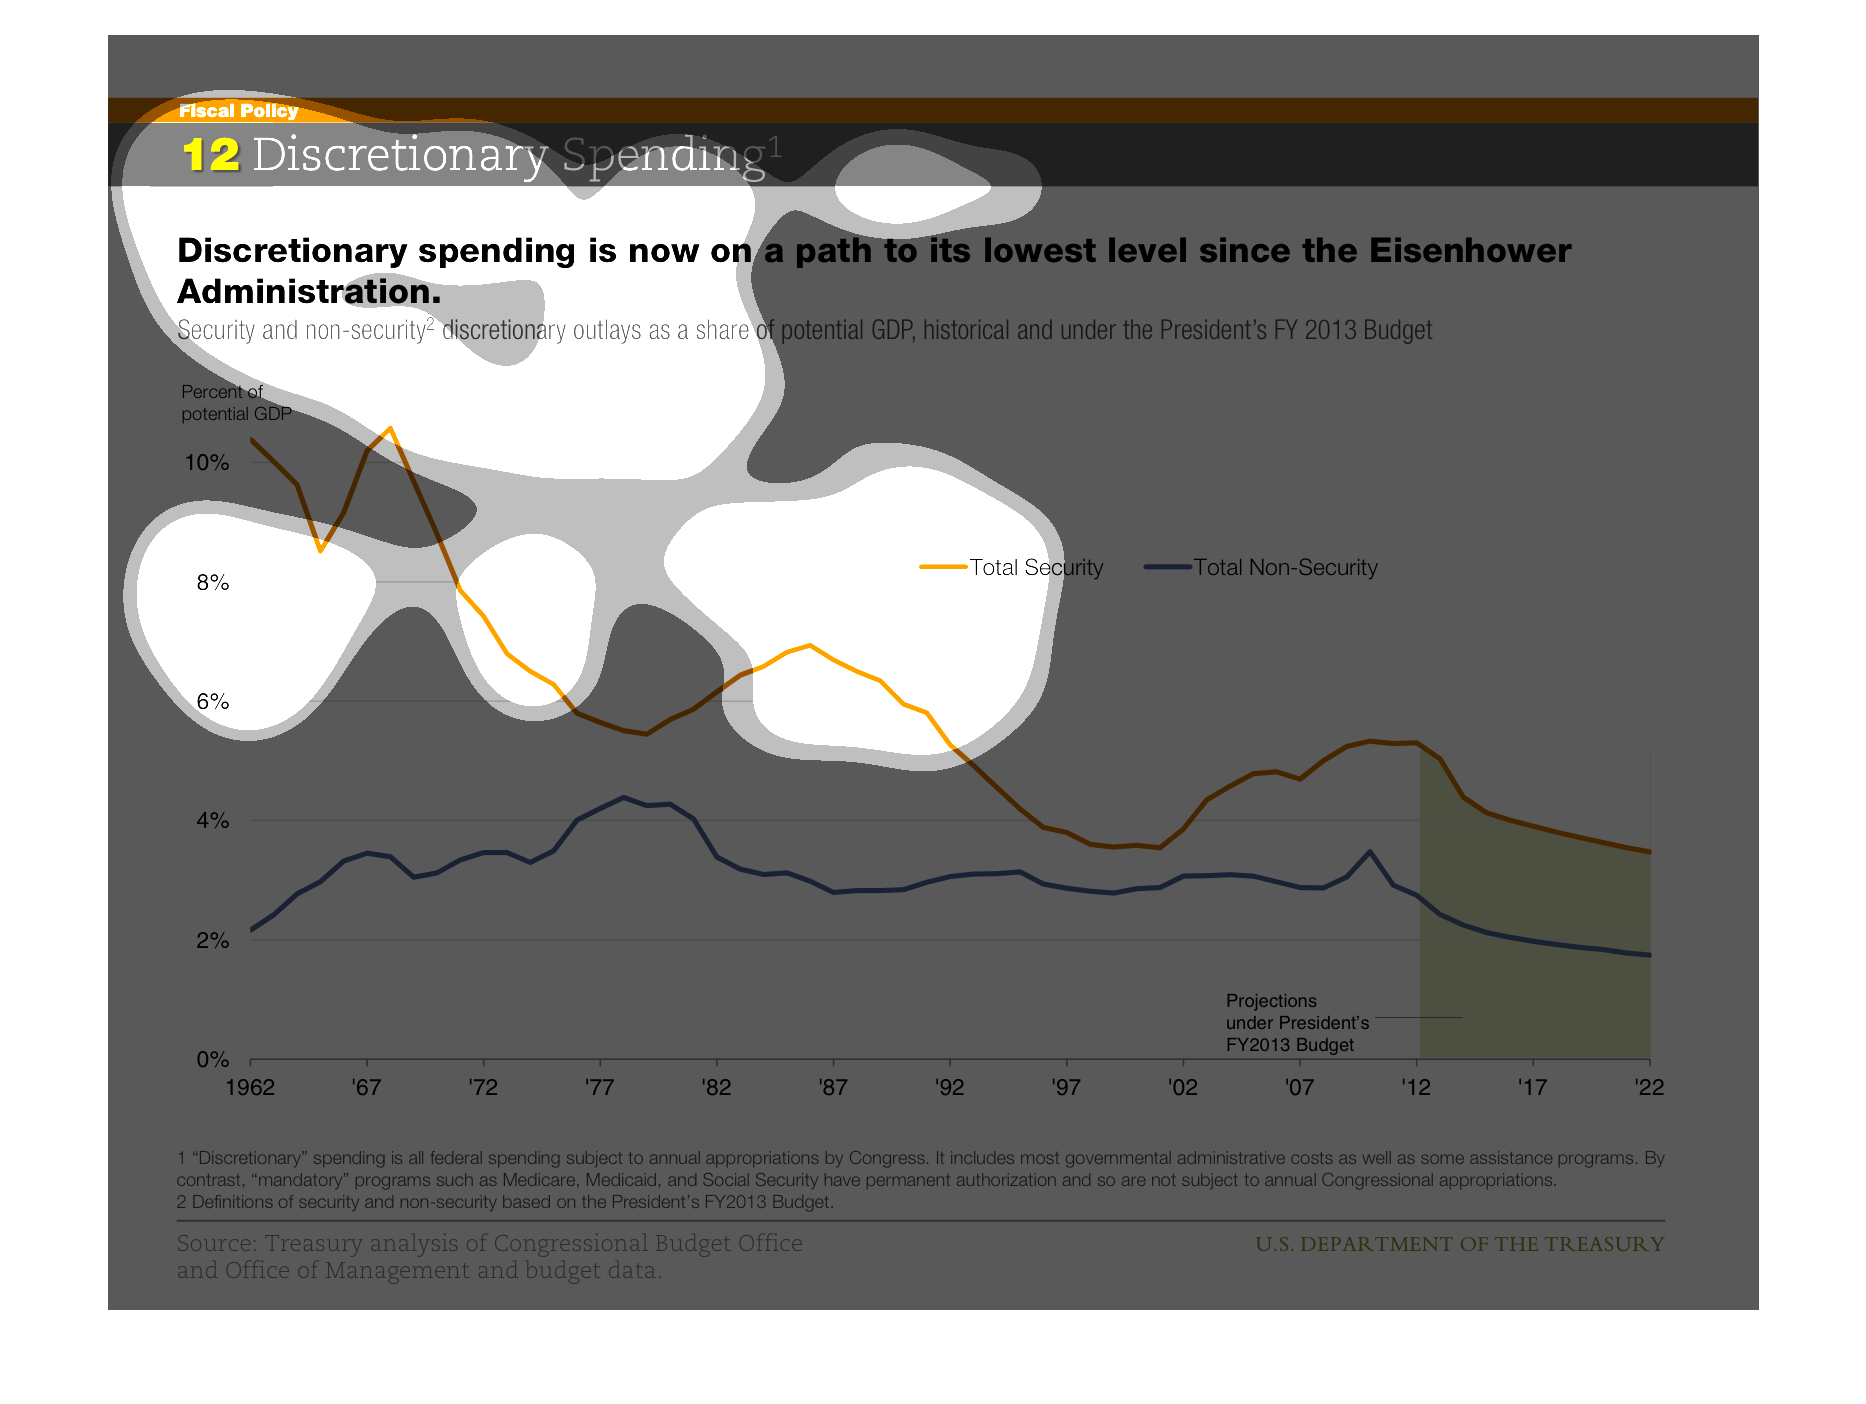
The following chart shows that discretionary spending is on course to be the lowest since
the Eisenhower Administration. This chart reflects data from 1962 and gives a projection to
2022.
This is a chart showing tat discretionary spending is declining, and is the lowest since the
Eisenhower administration. it charts from 1962 to 2022. It shows it as a percentage of potential
GDP declining from 10% to 4%.
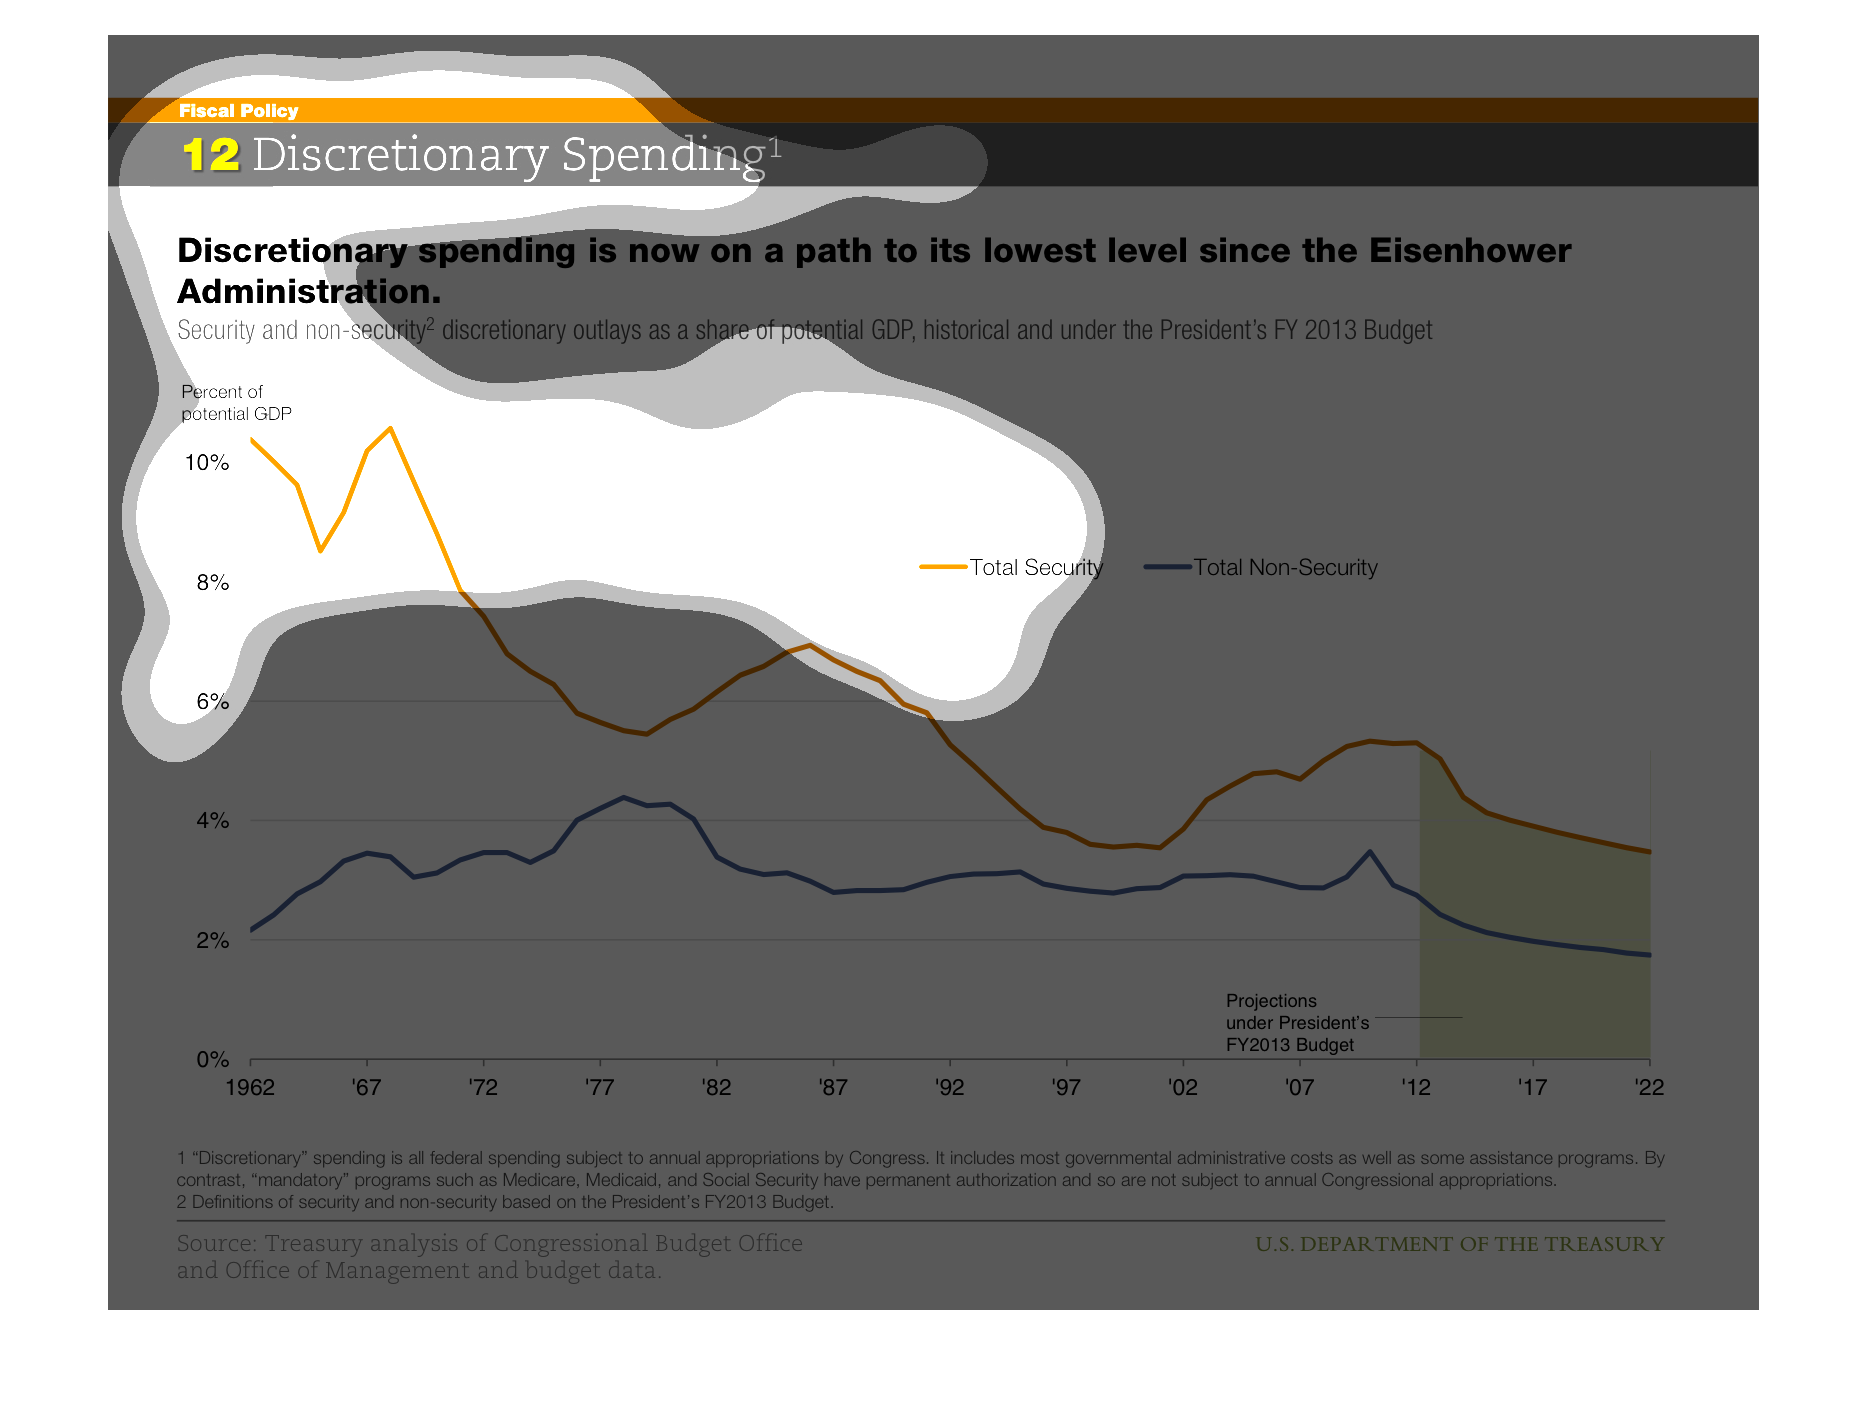
Discretionary spending is now on the path to its lowest level since the Eisenhower administration.
 The largest drop was in security spending vs. Non-security spending.