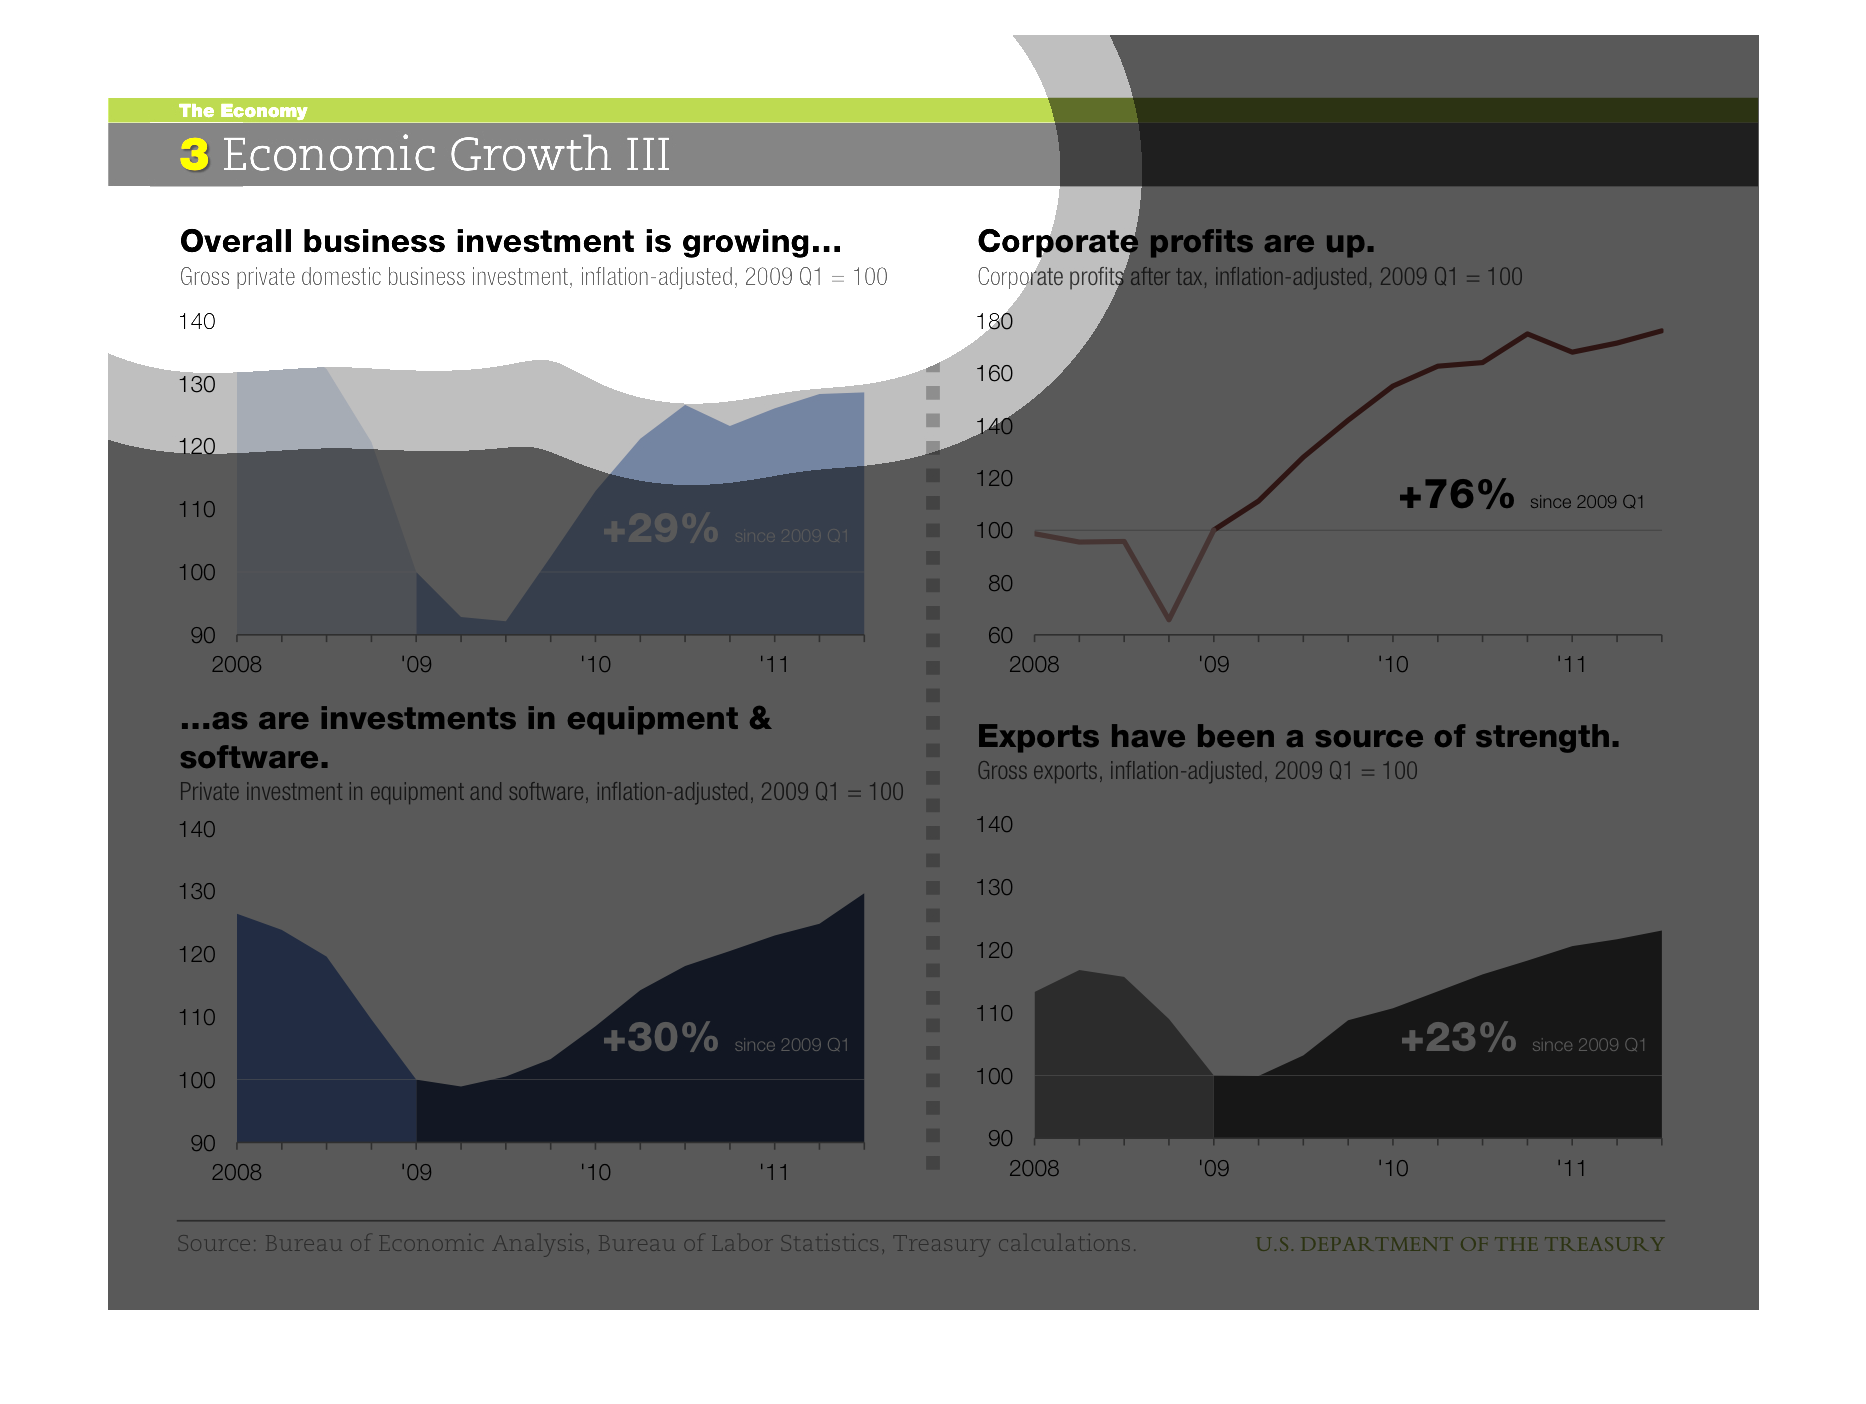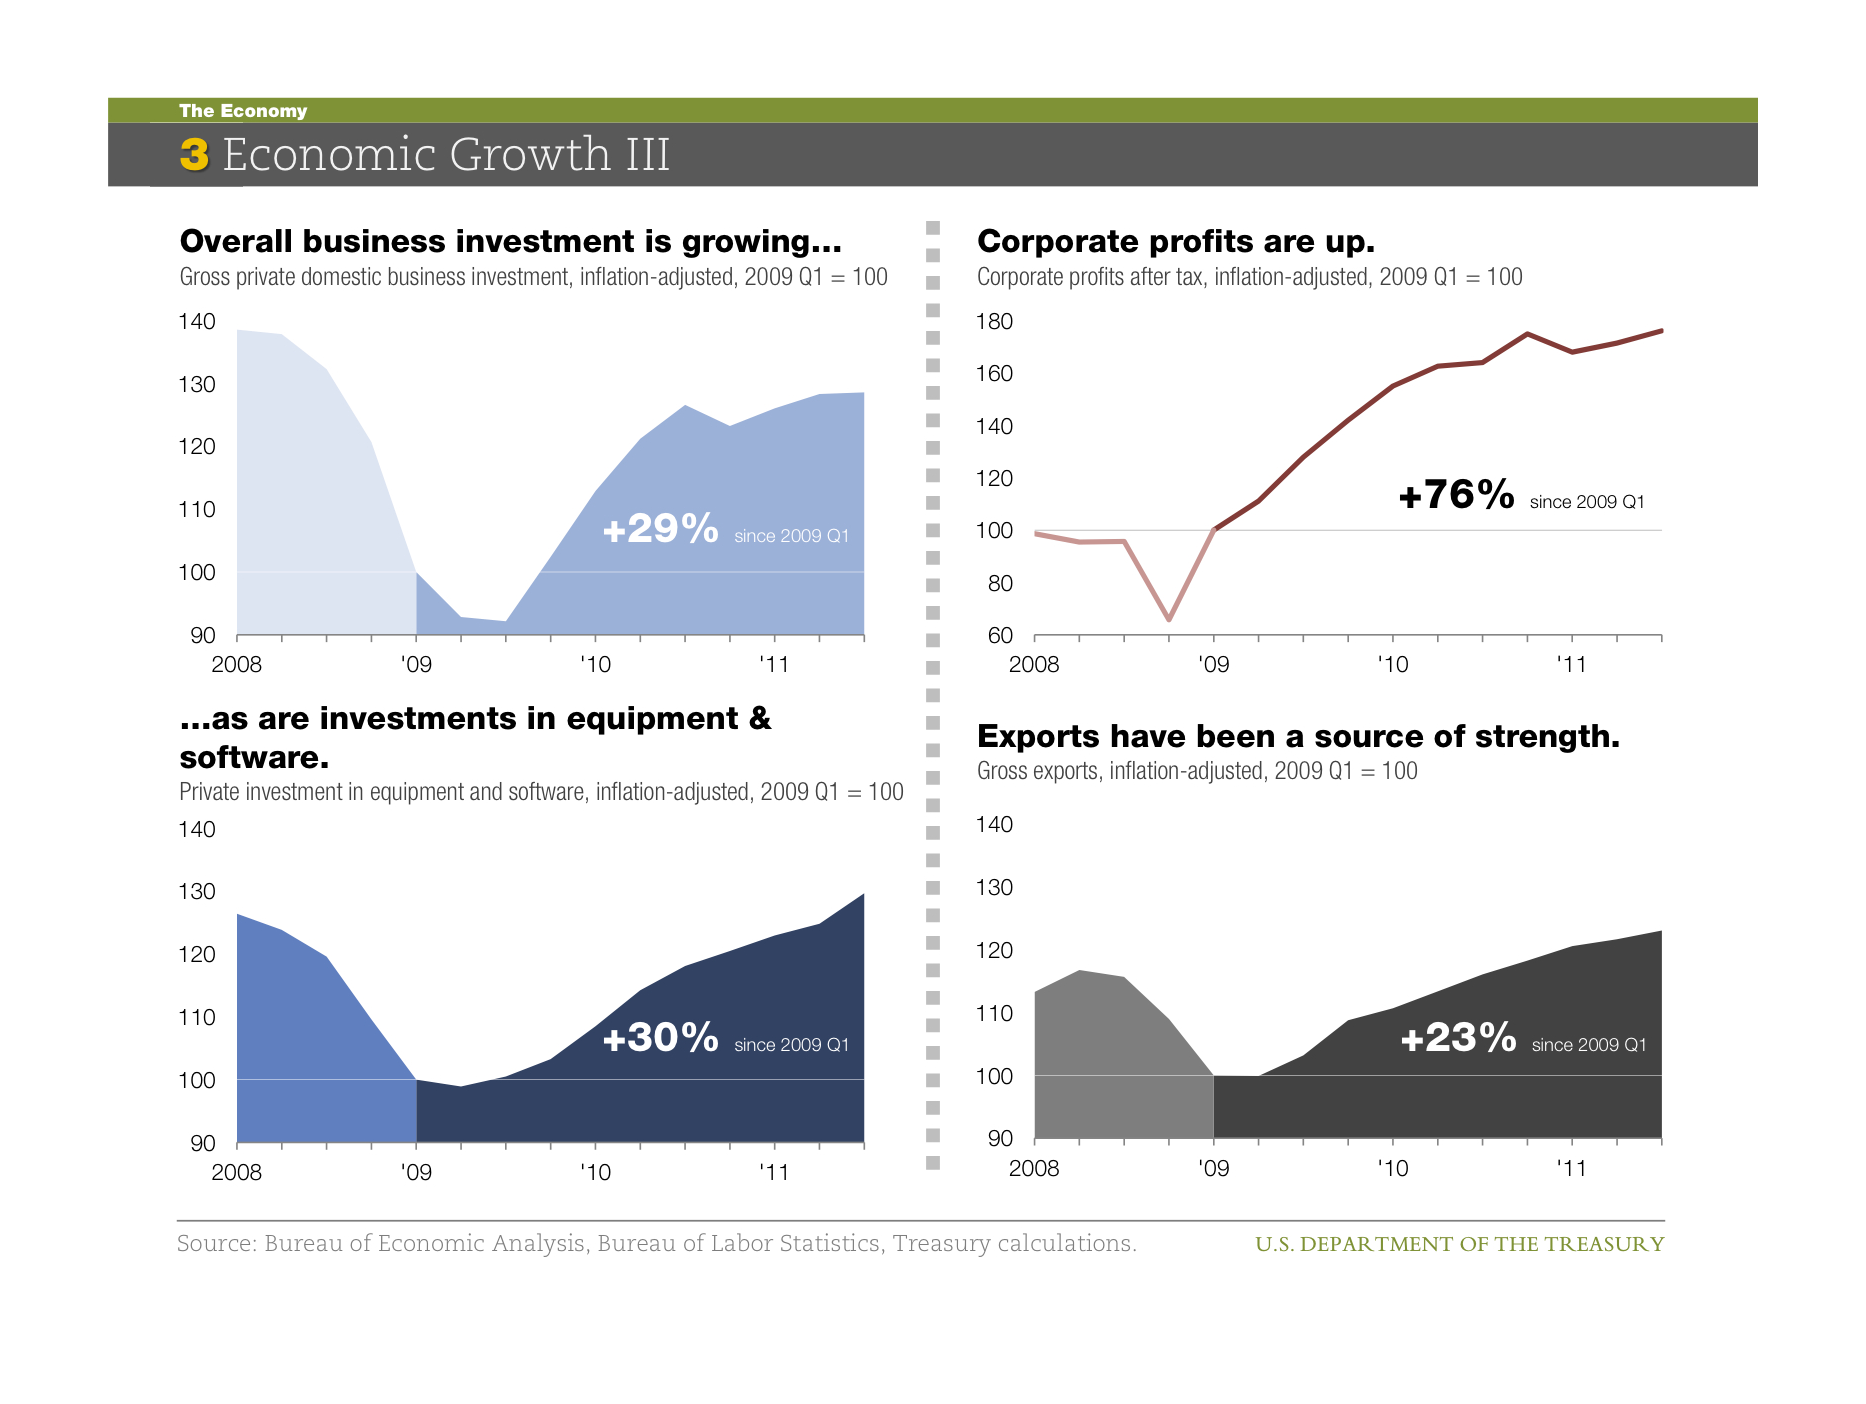
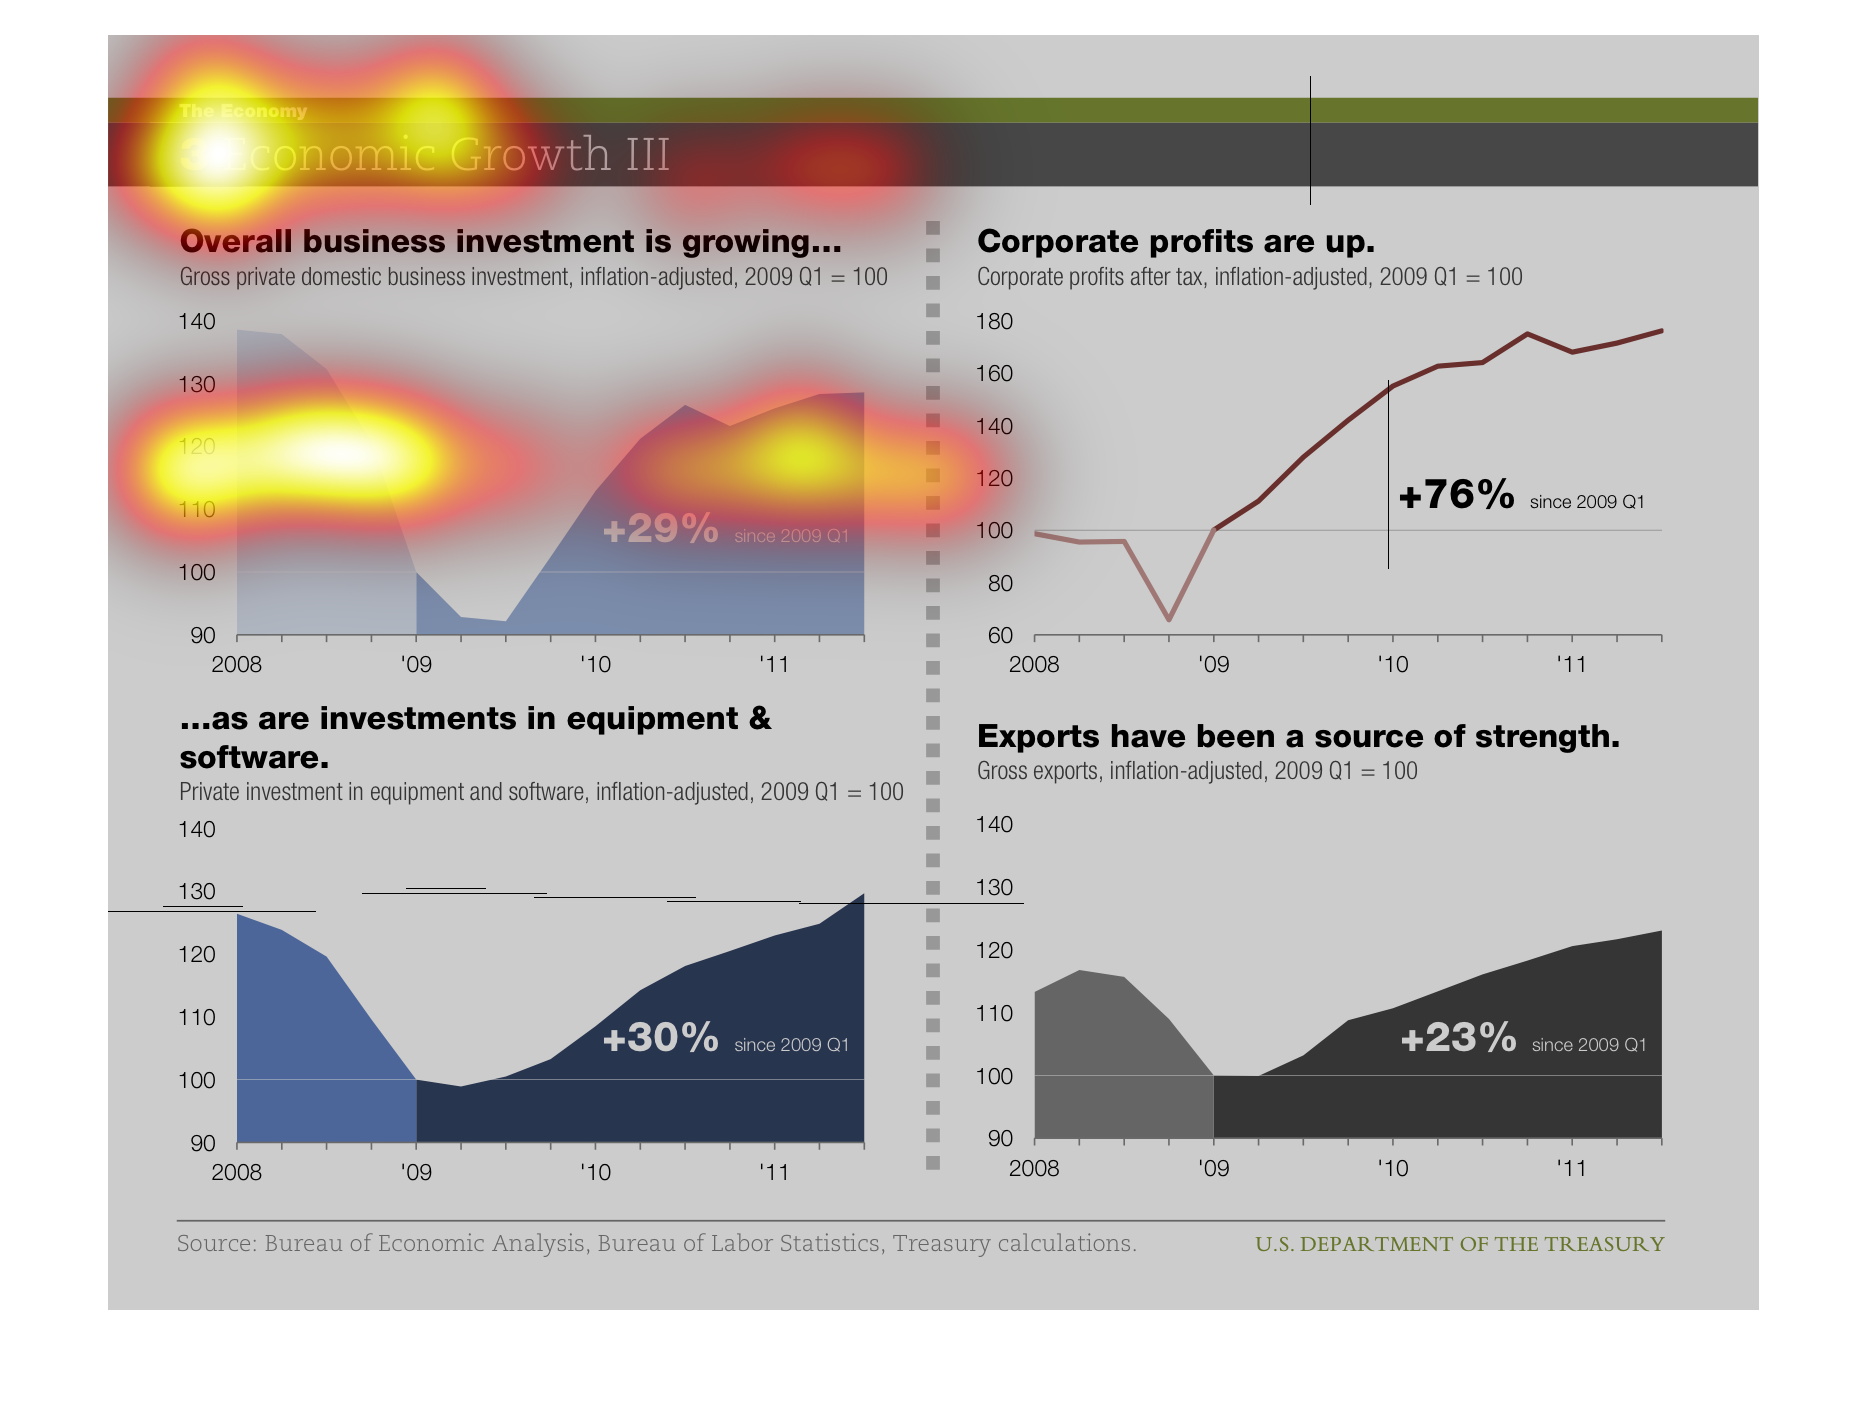
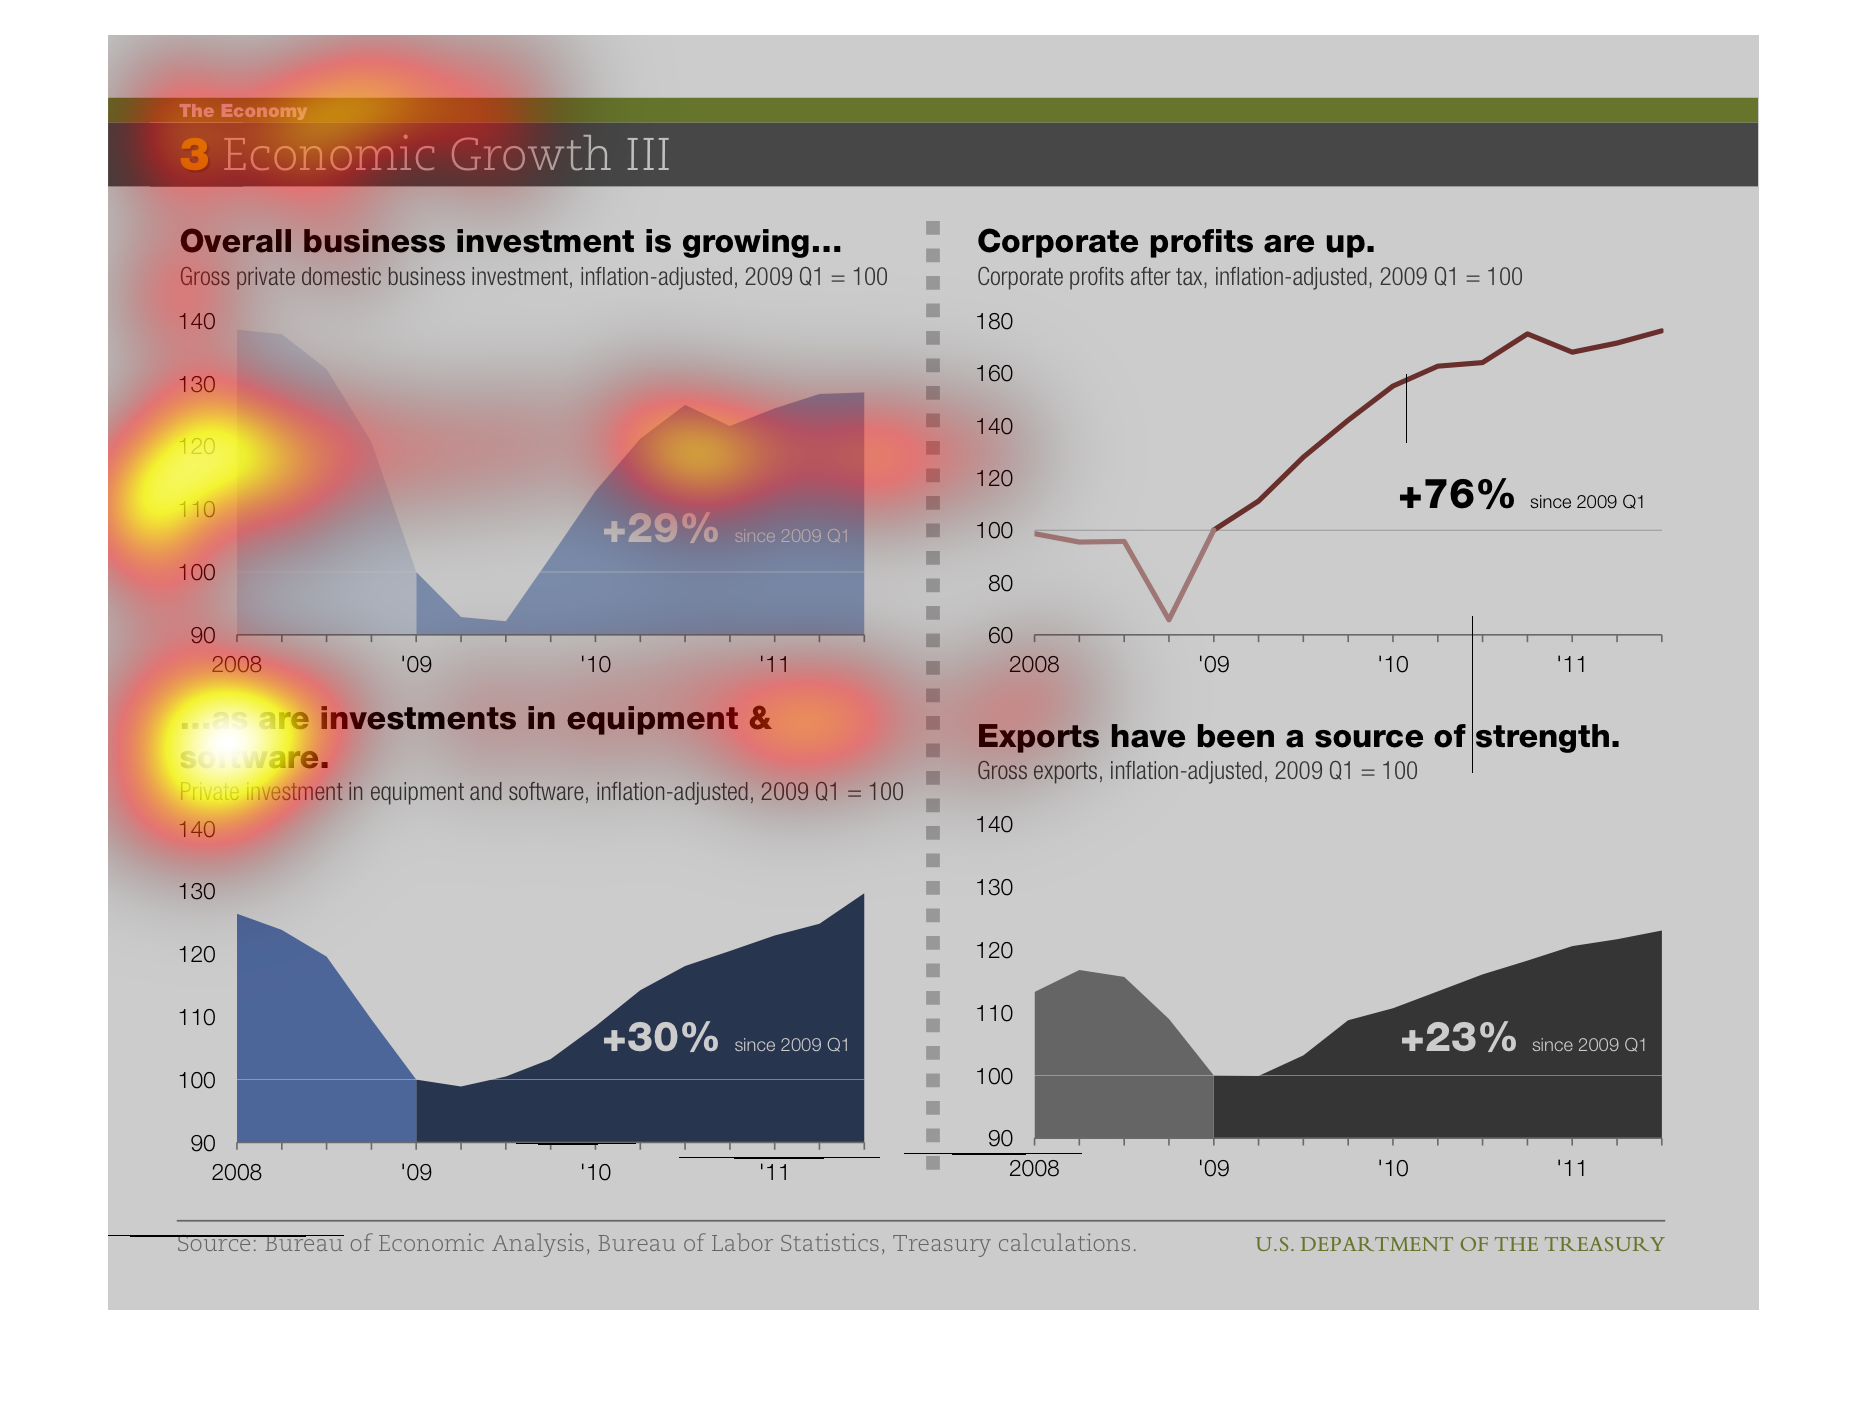
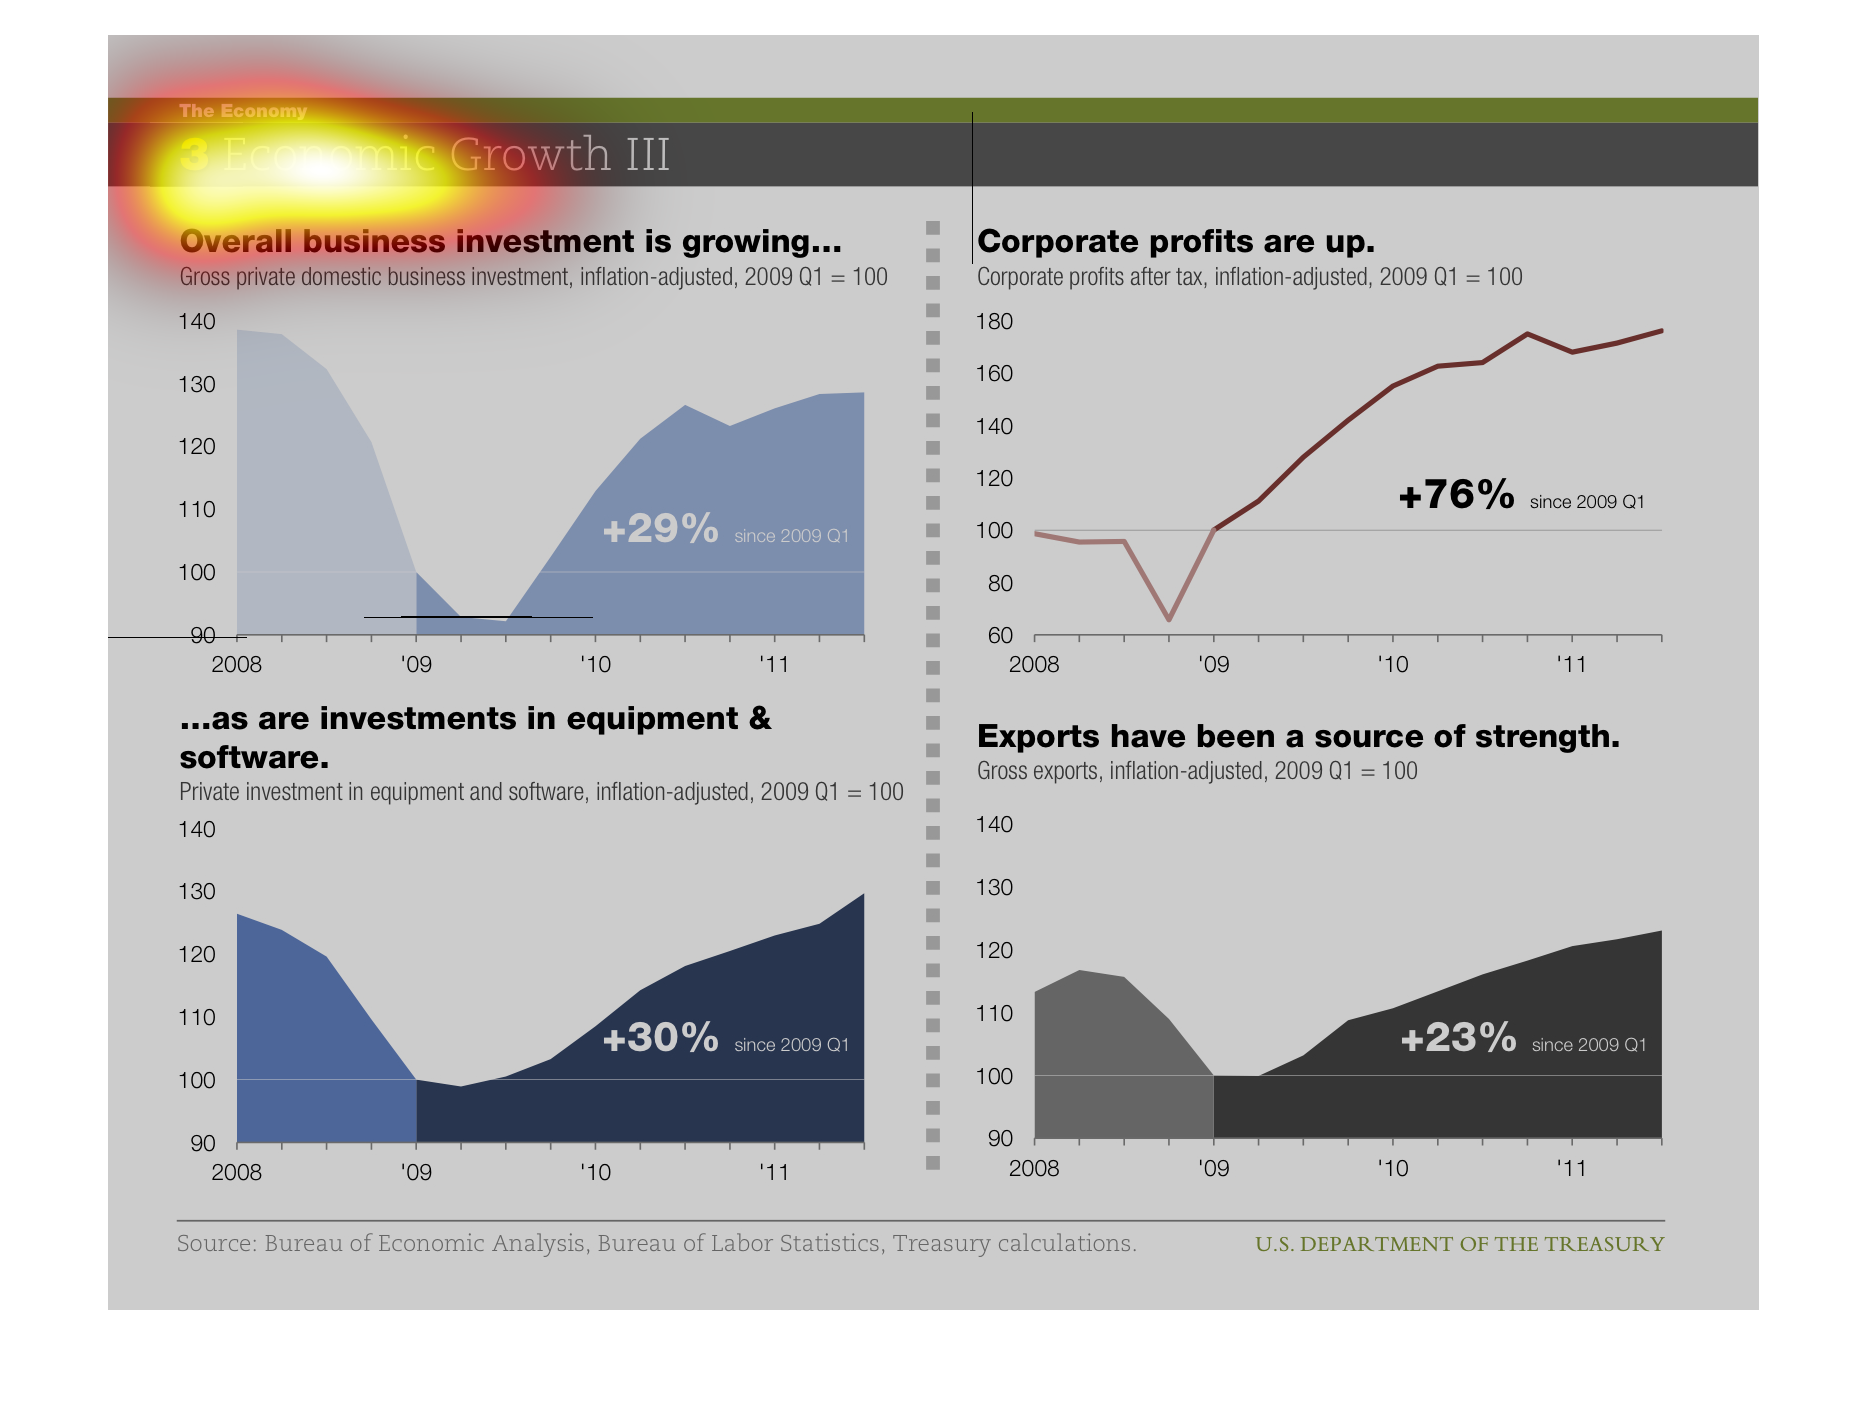
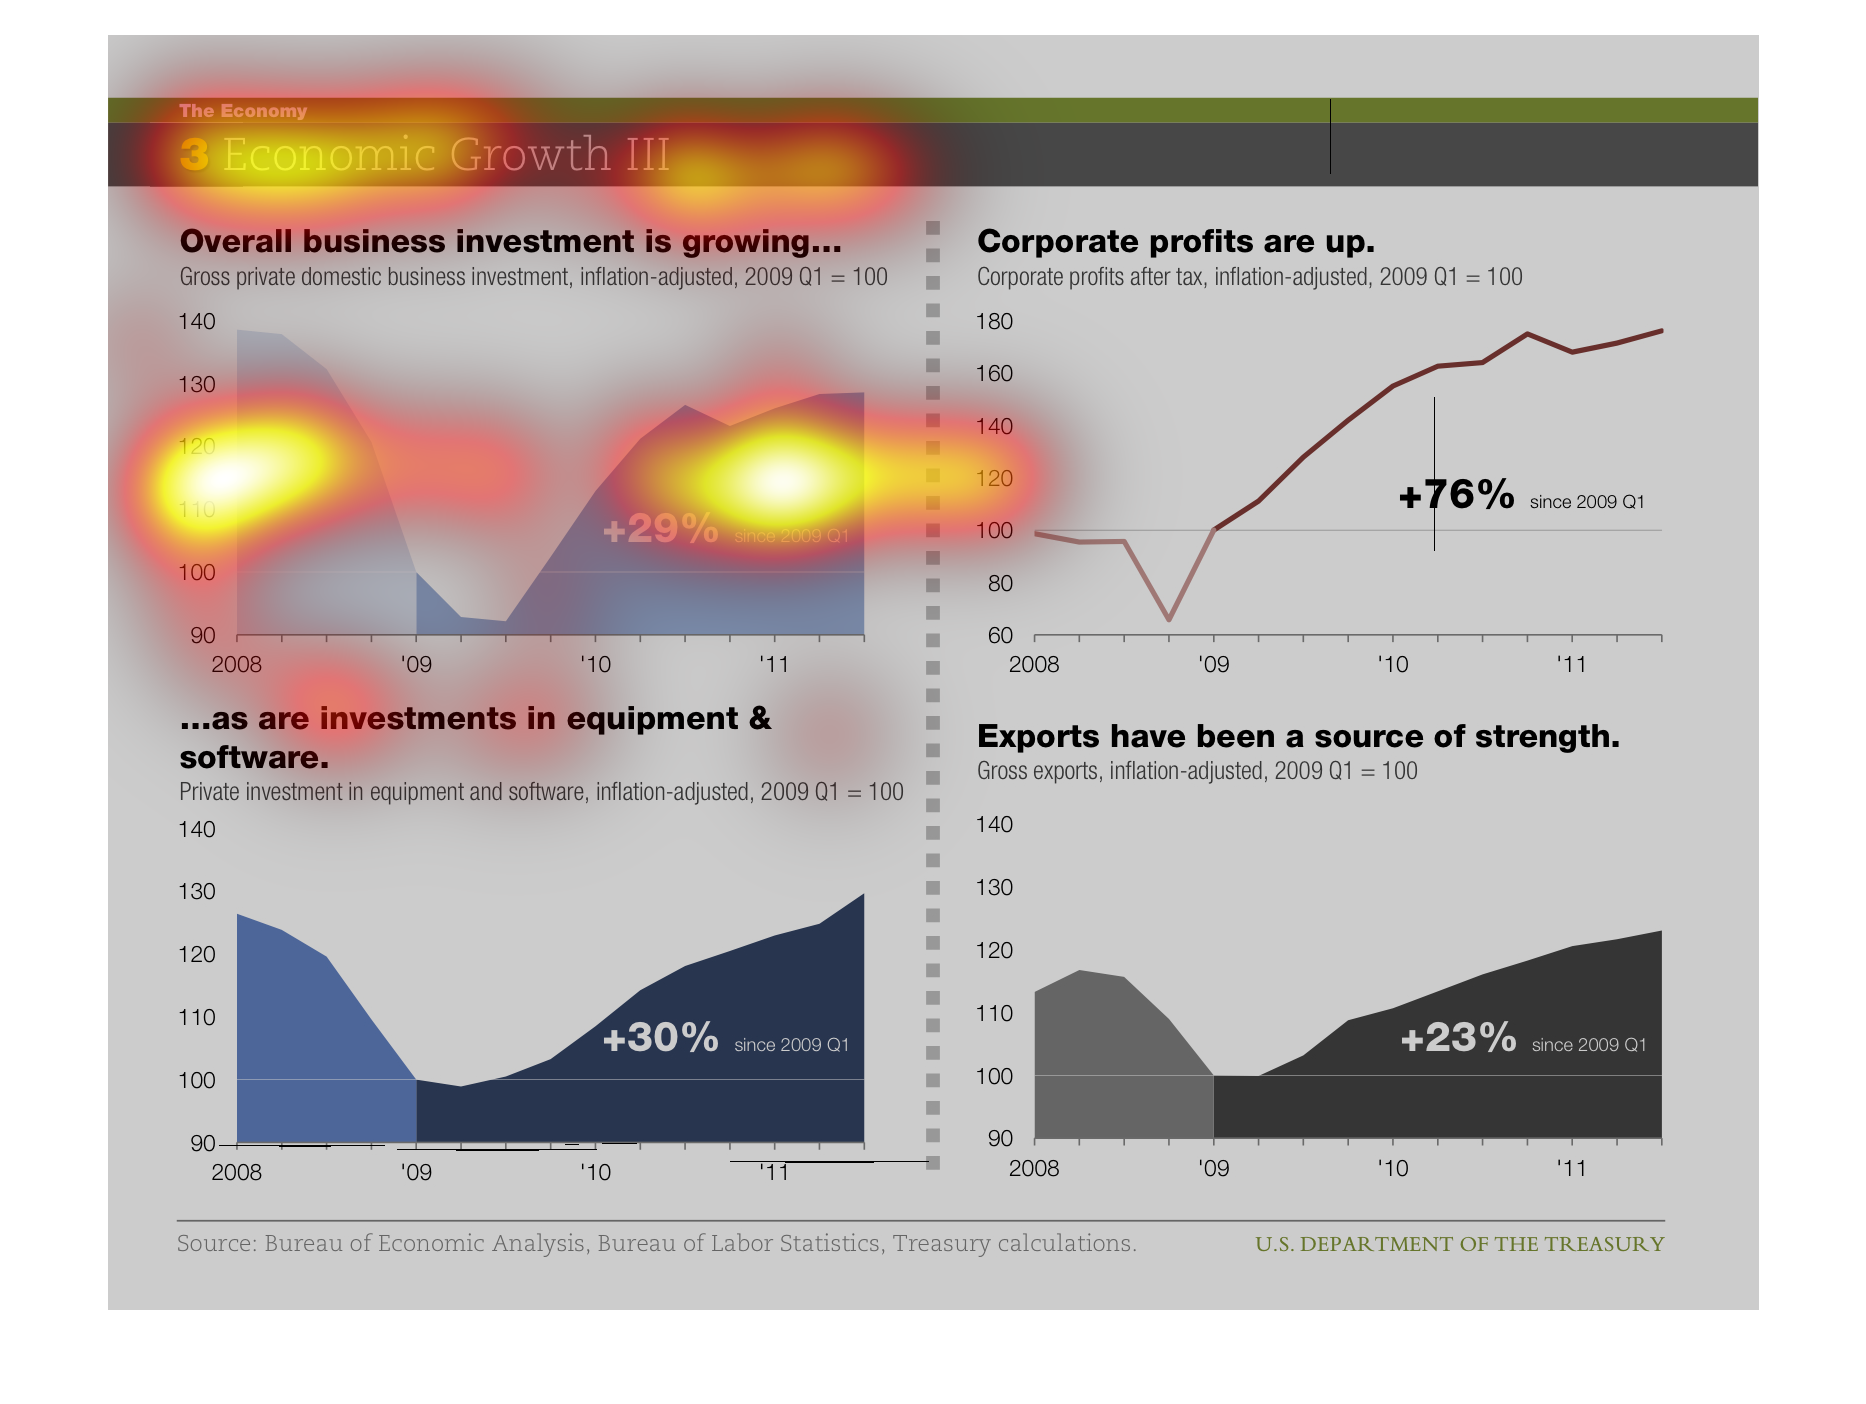
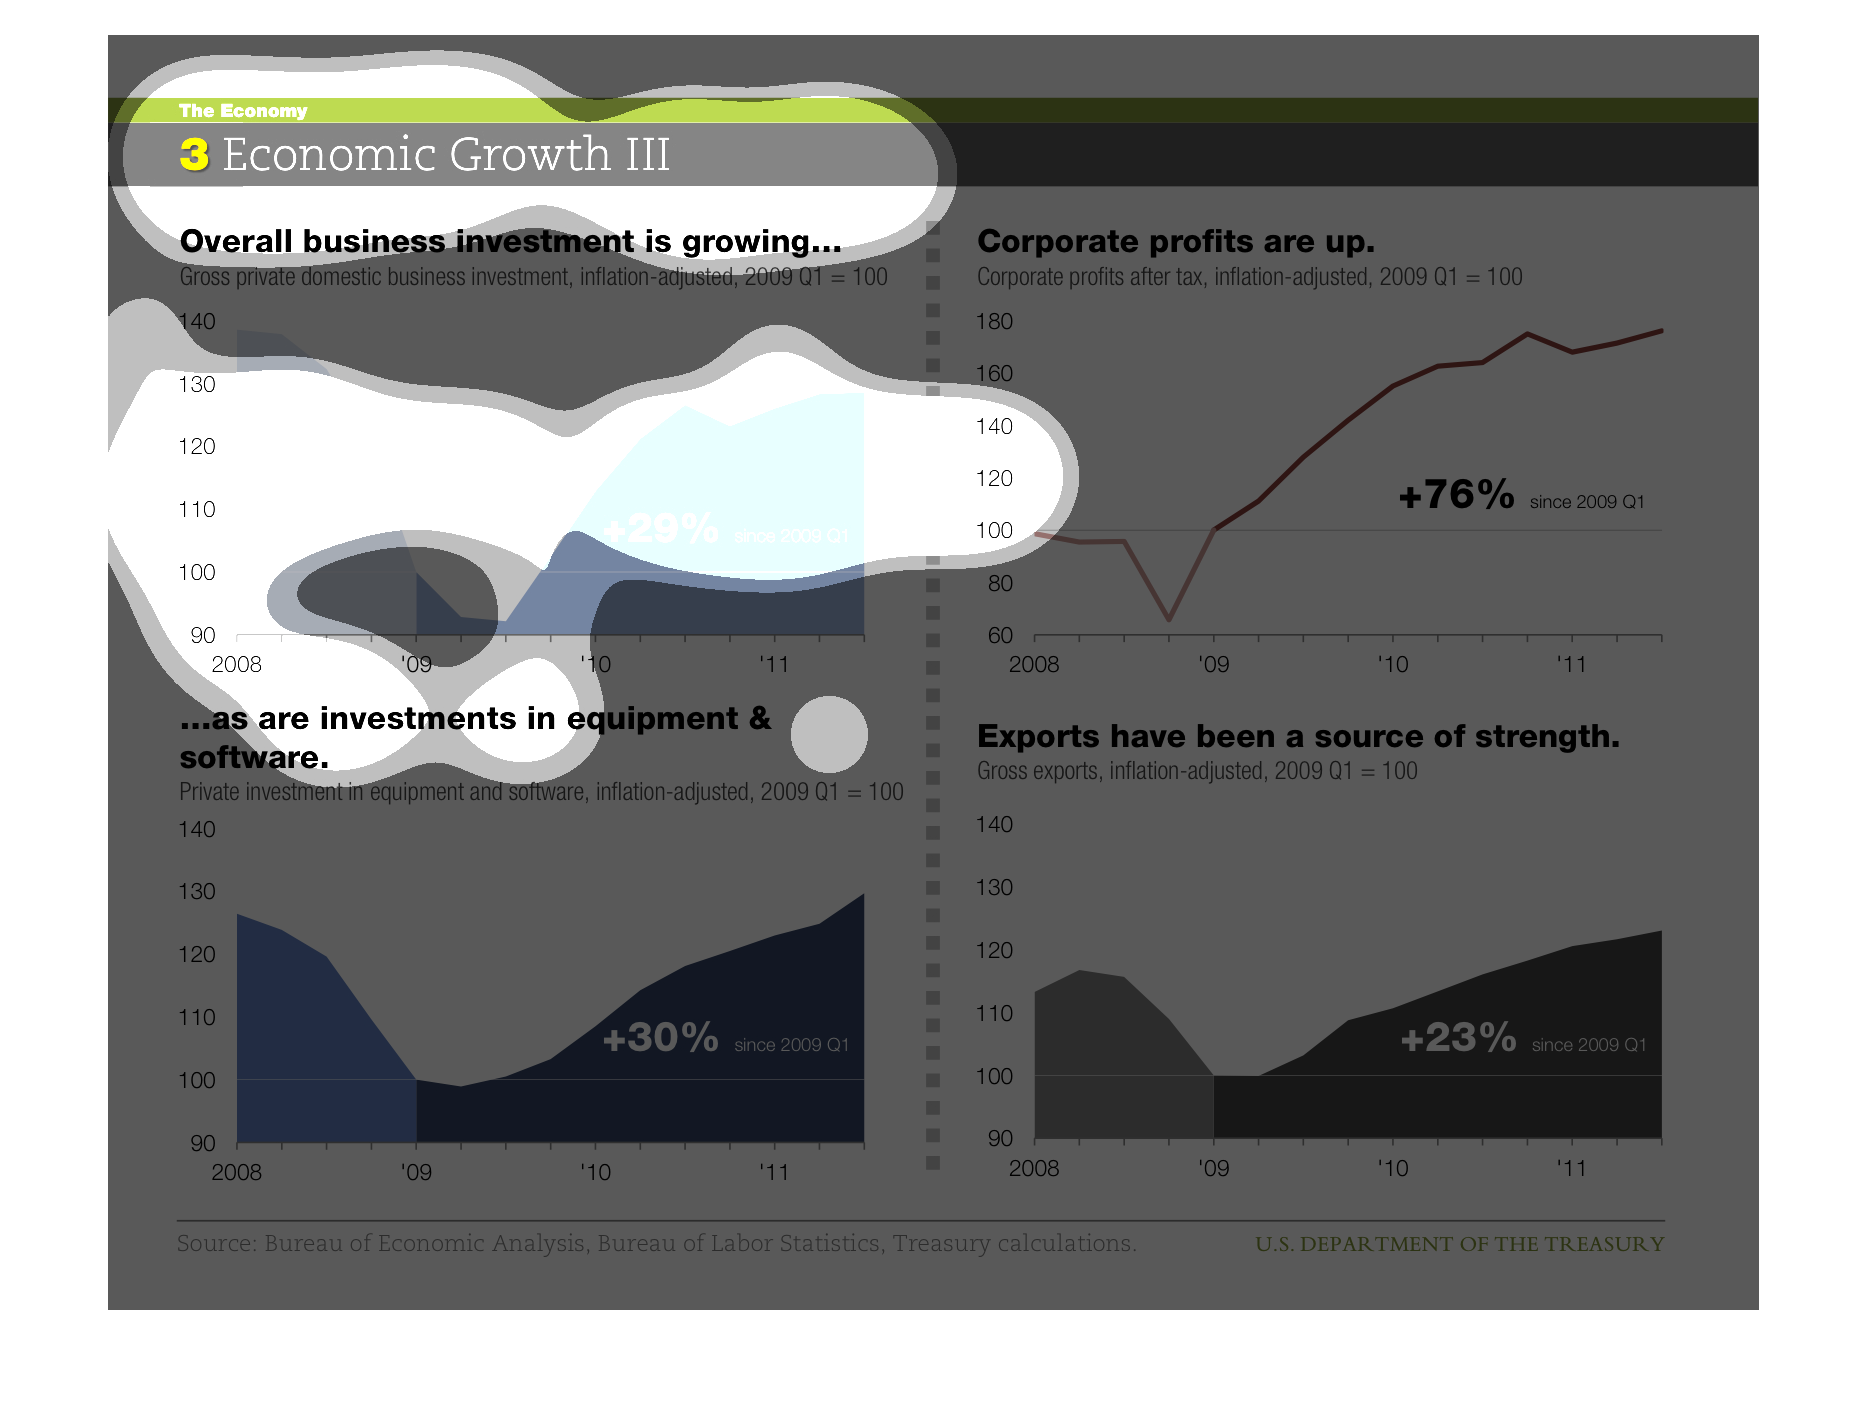
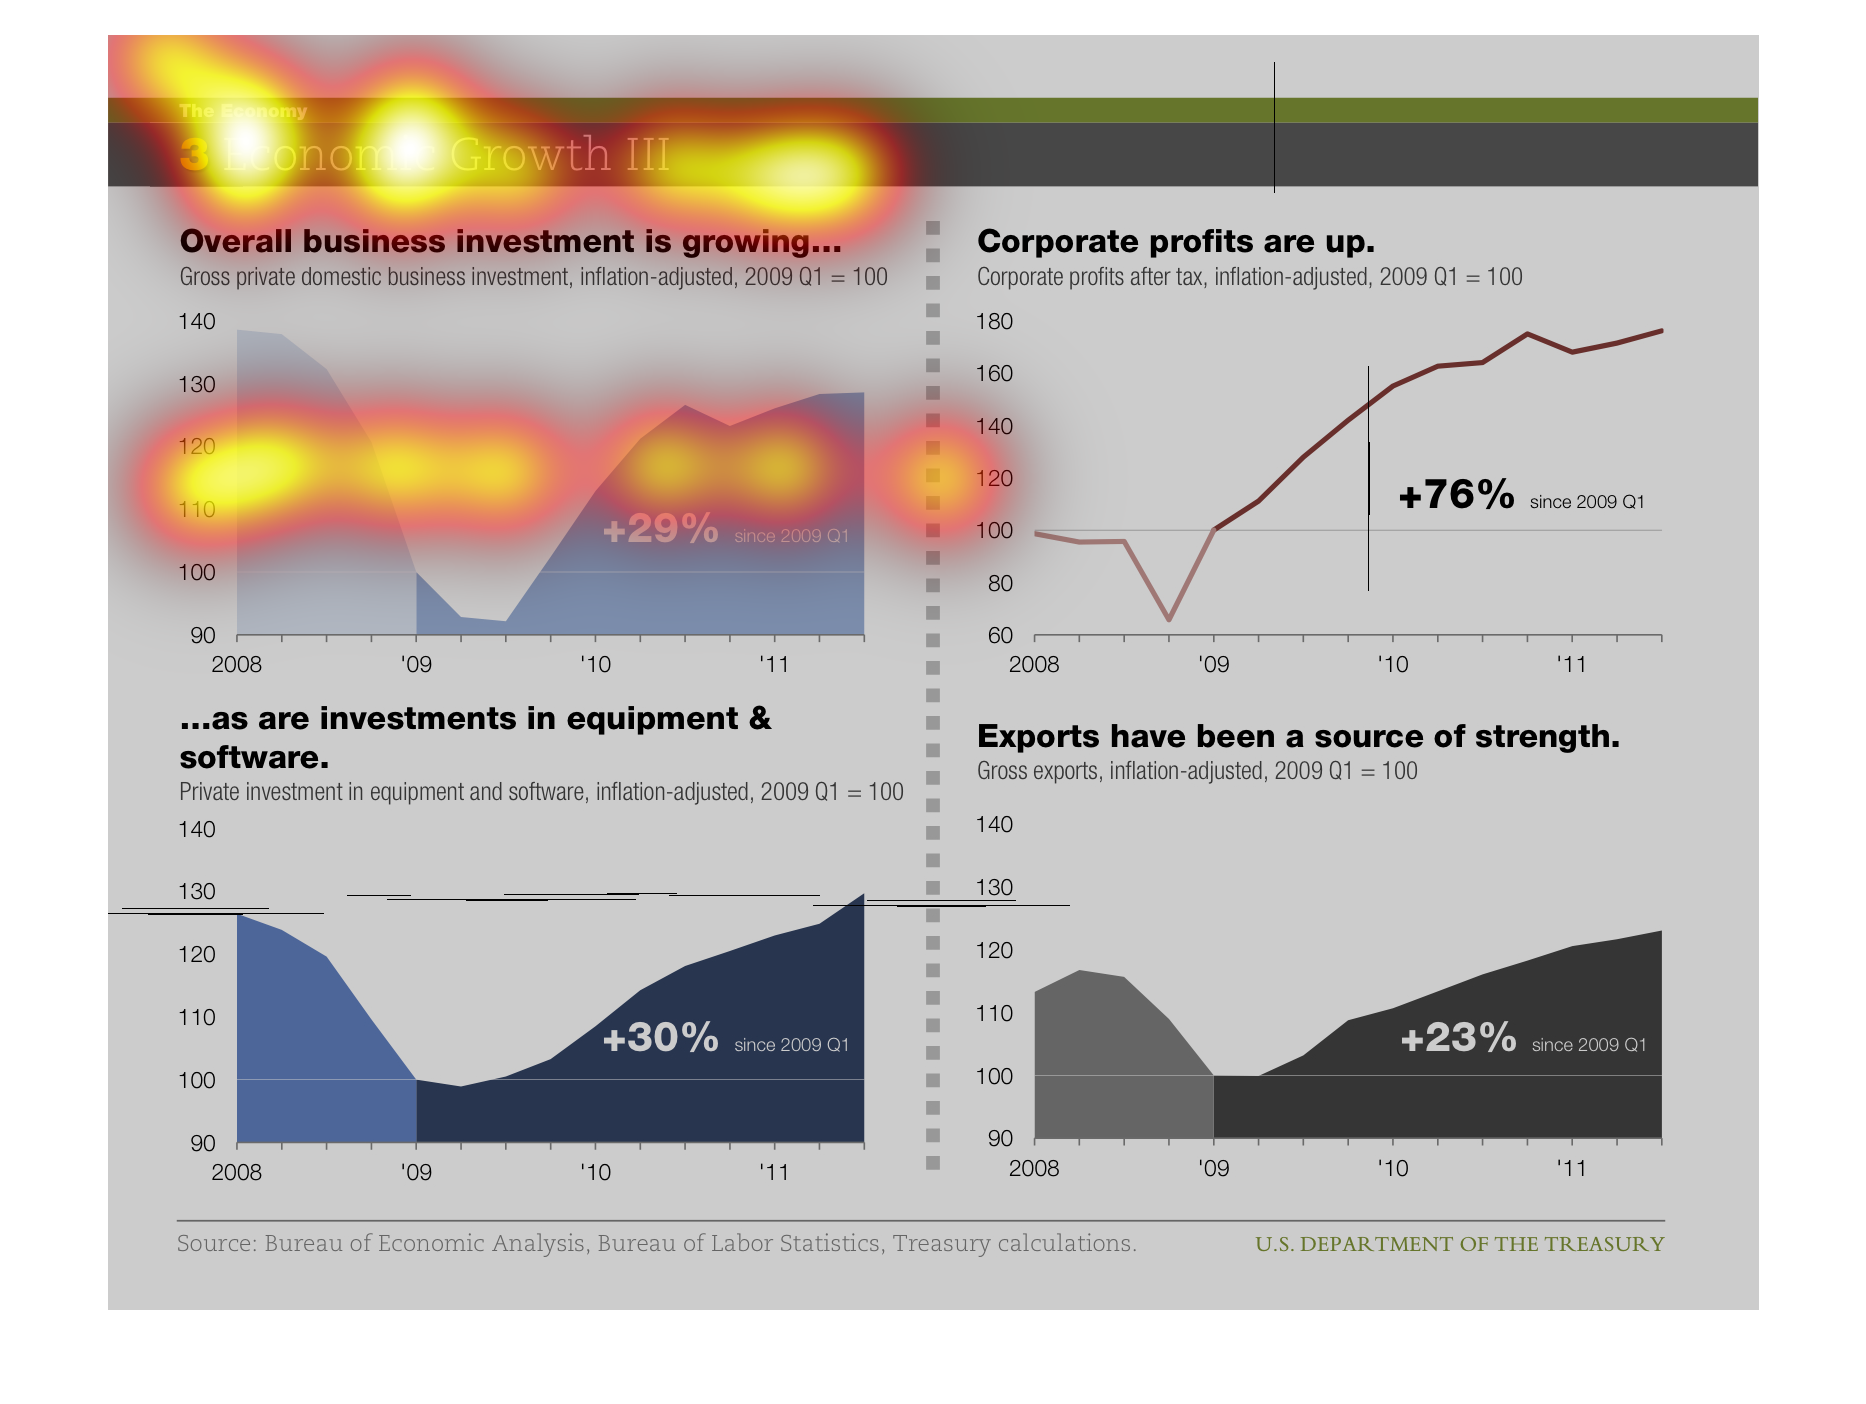
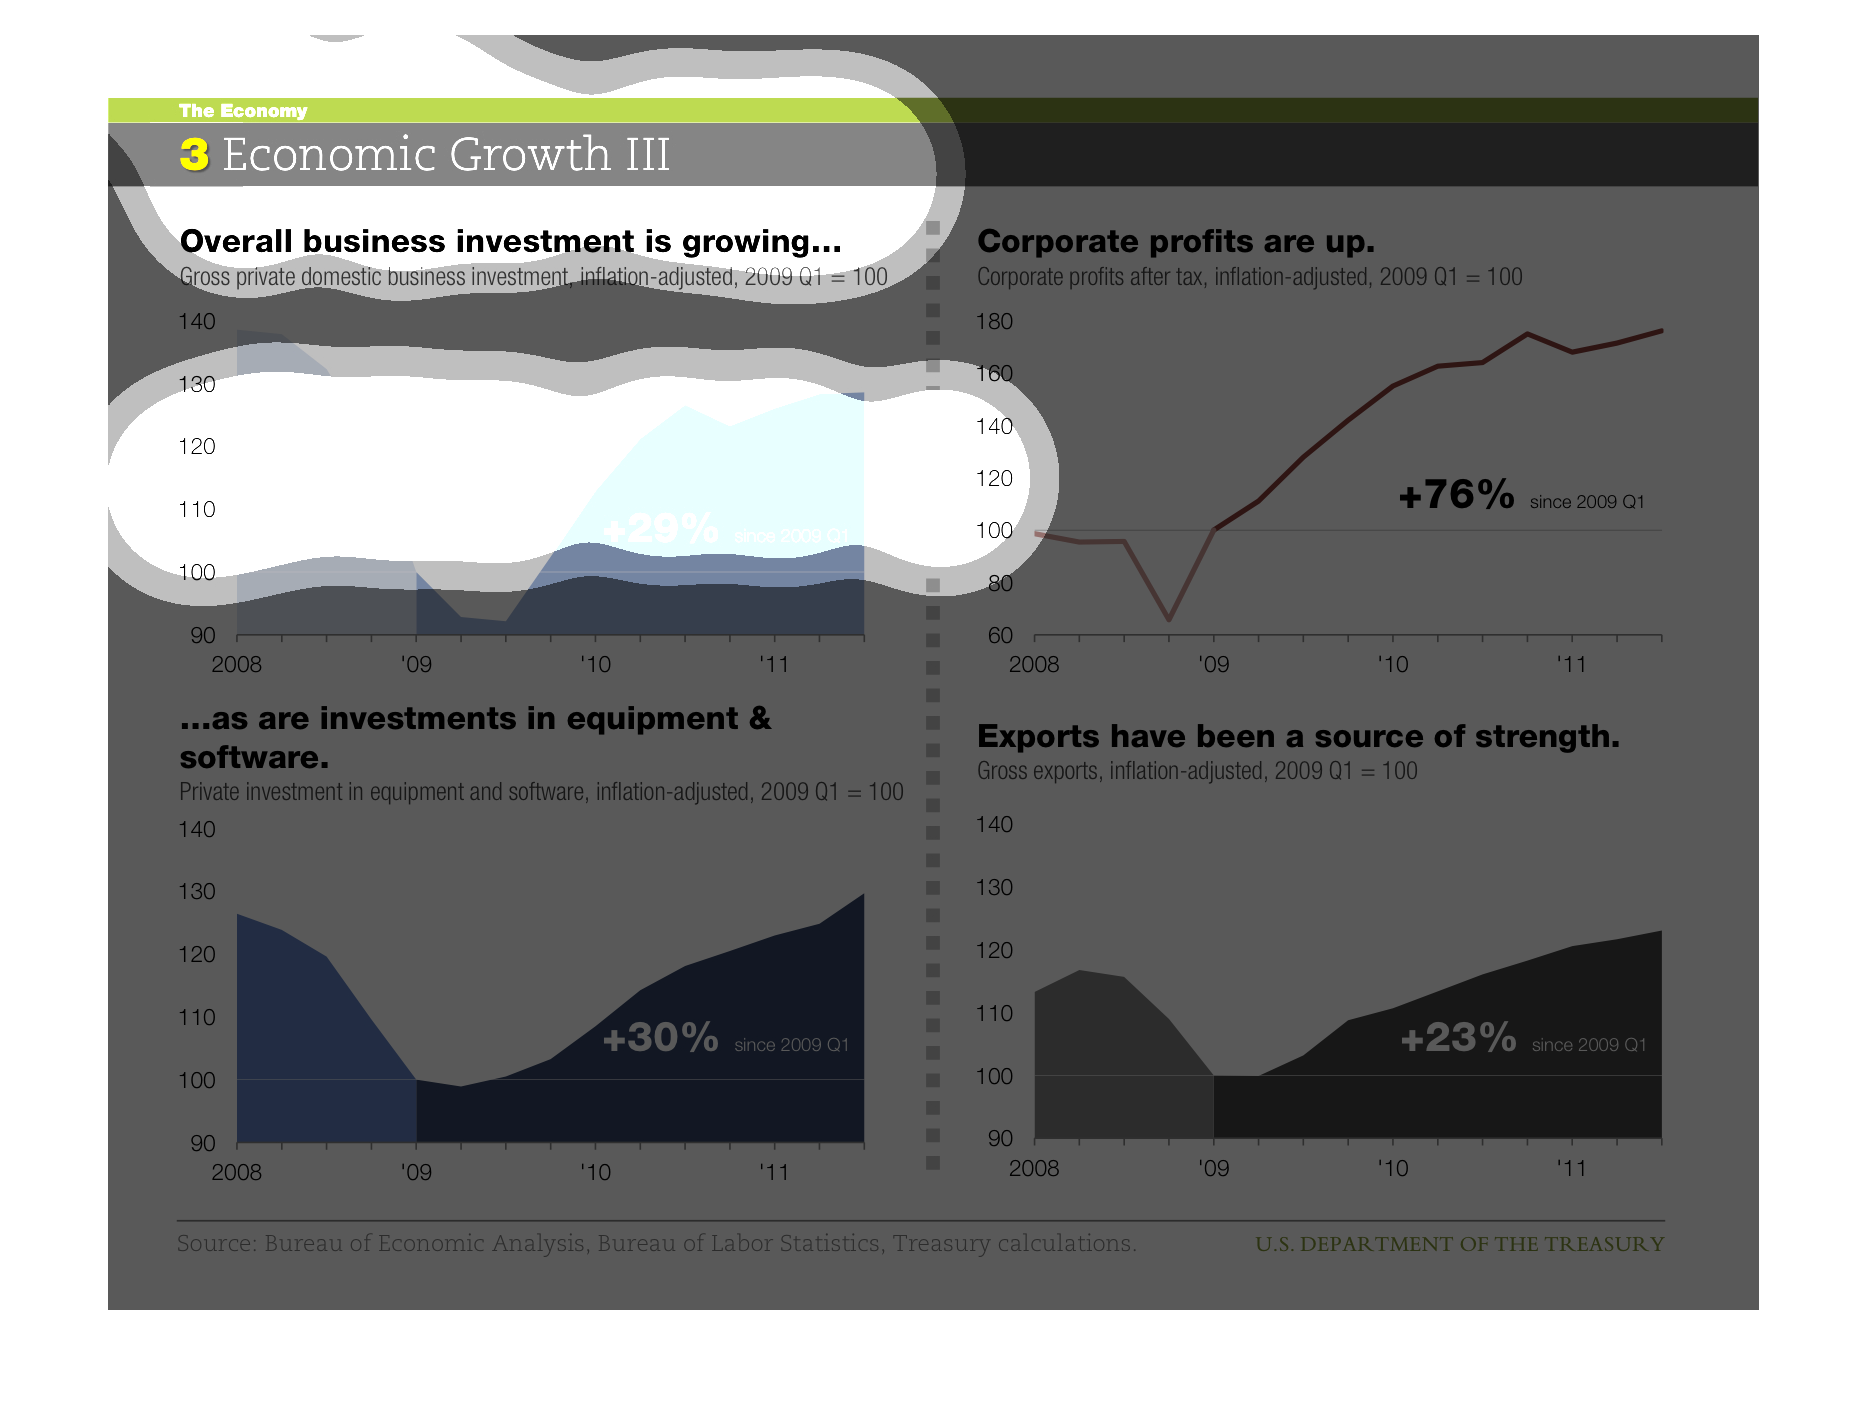
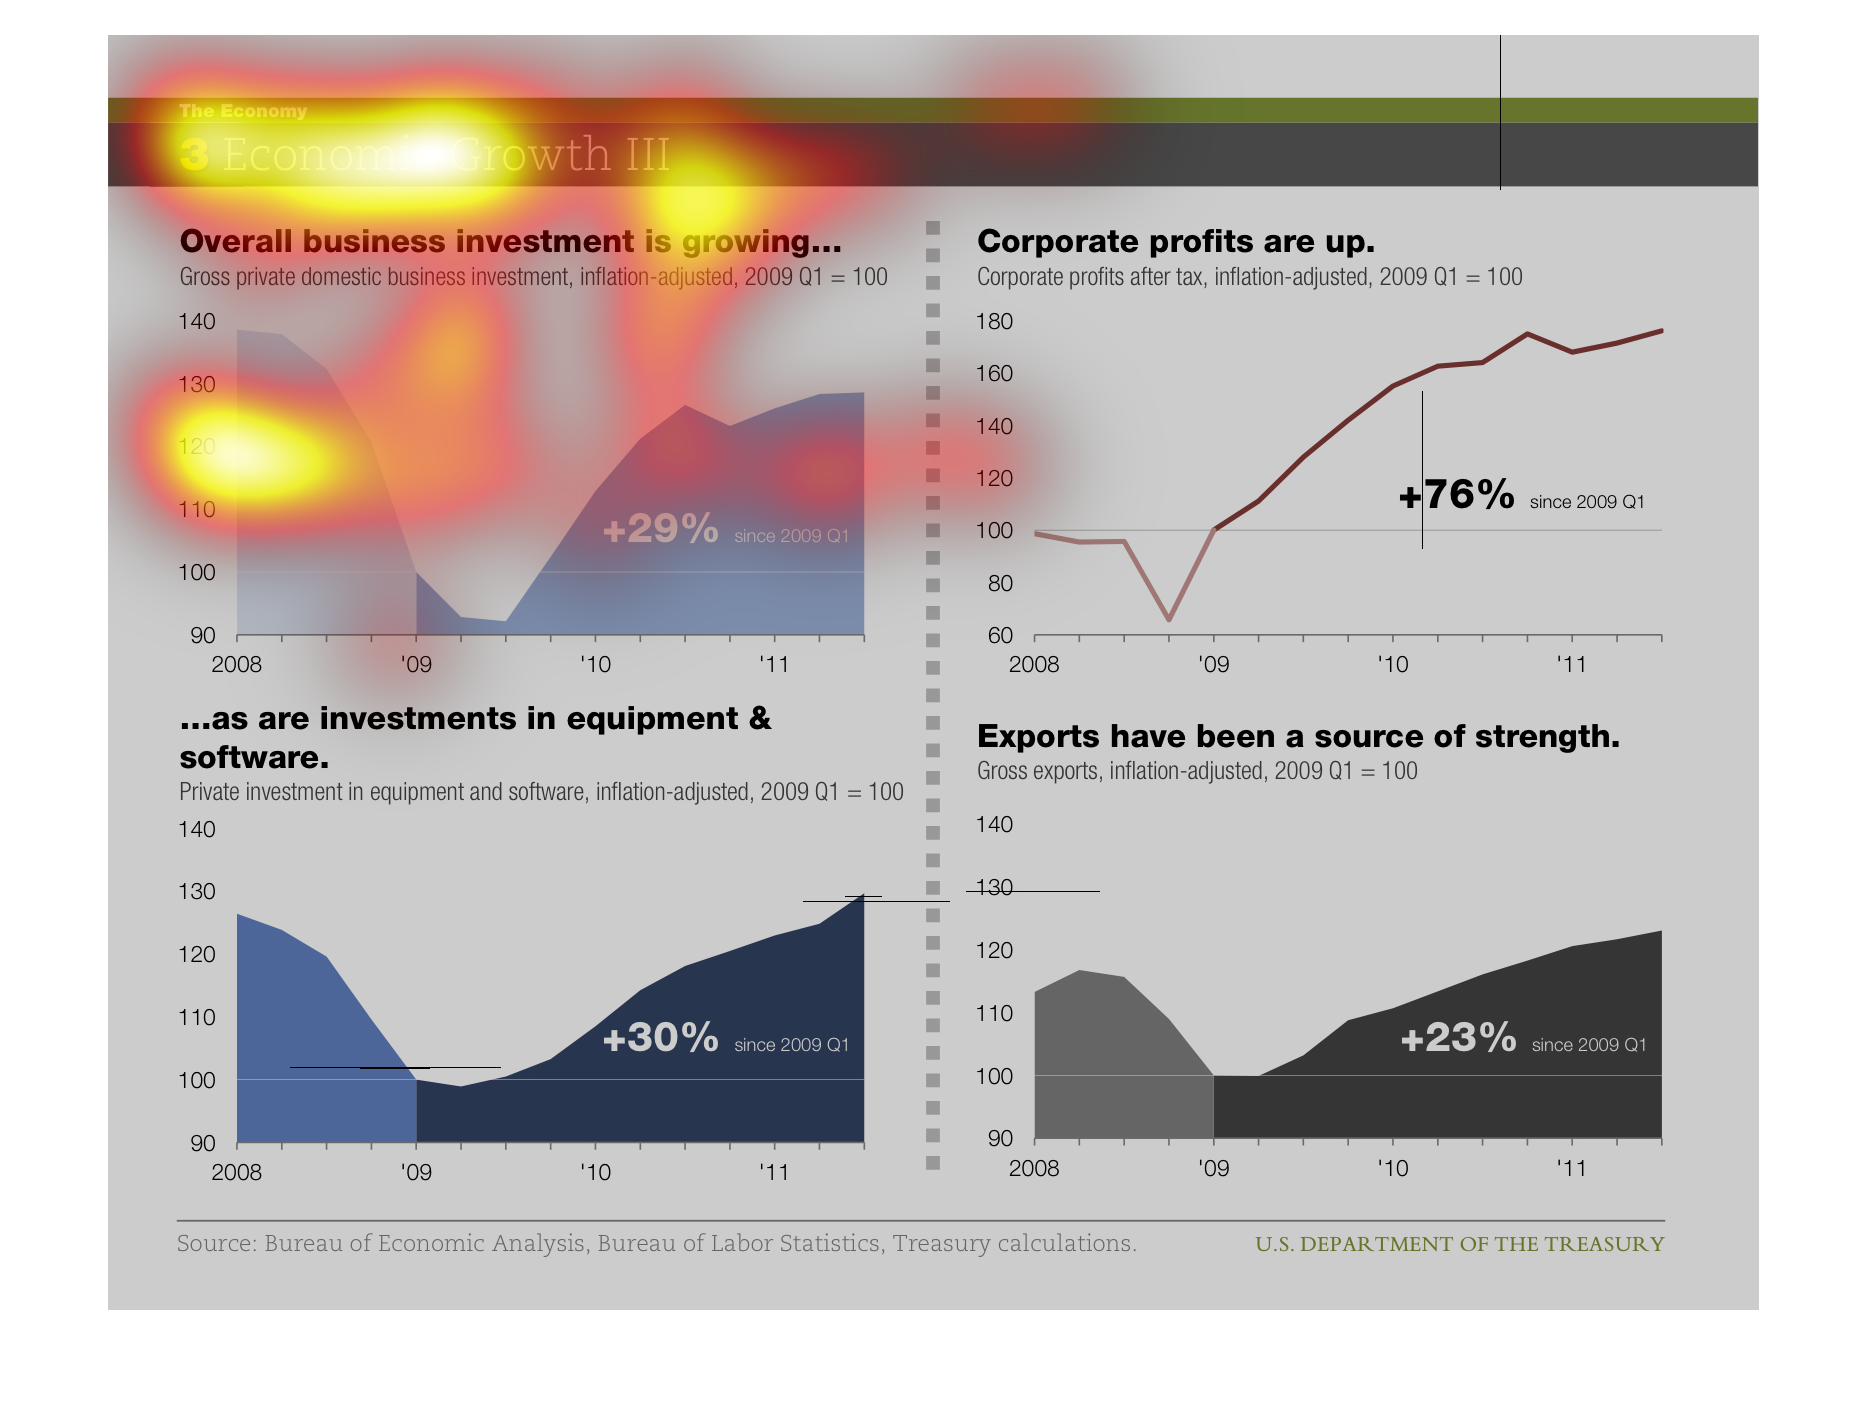
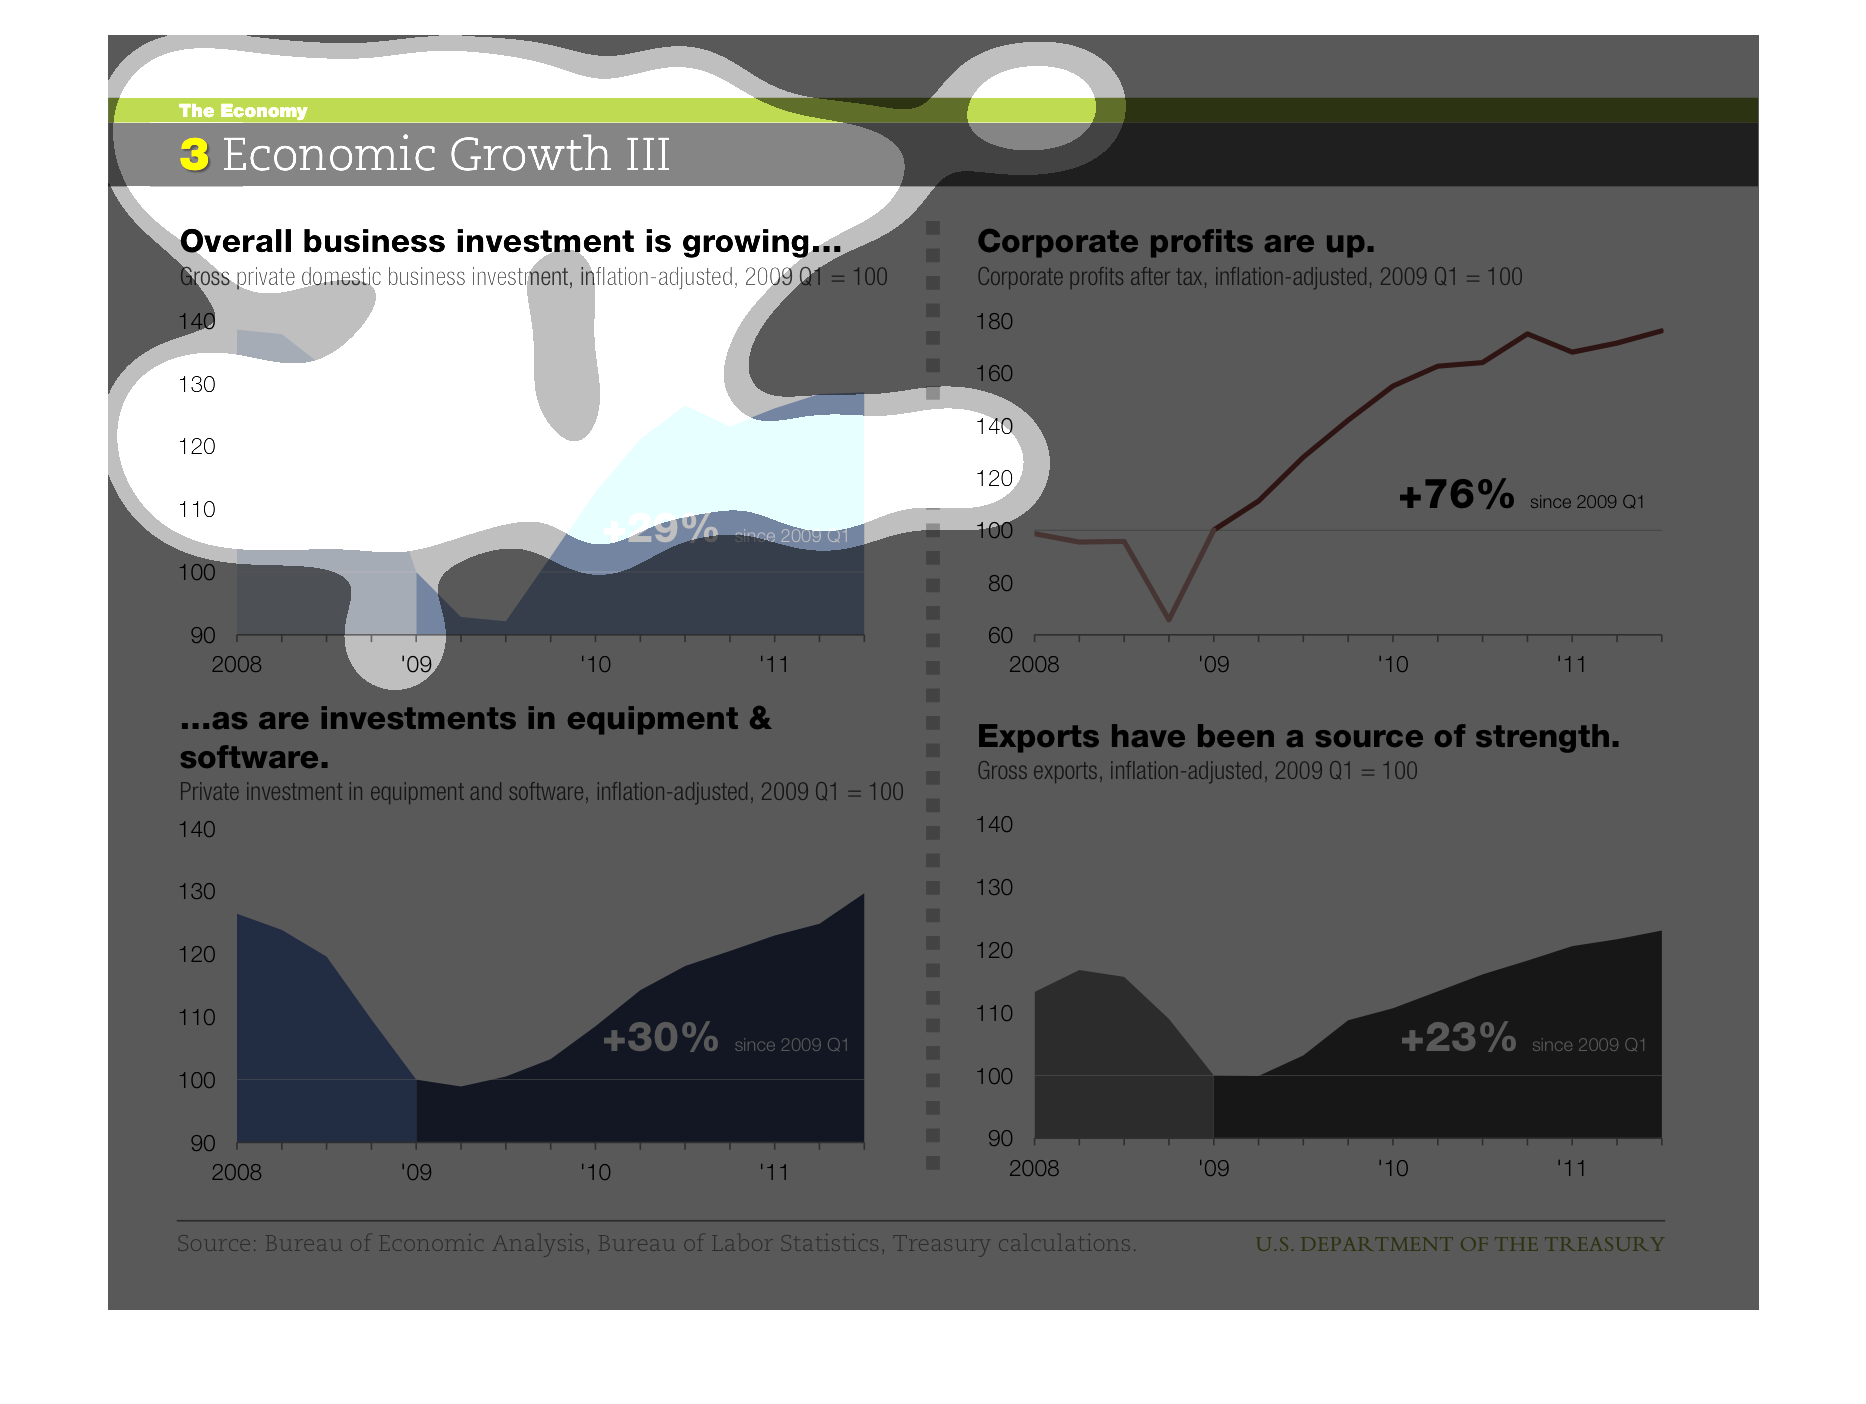
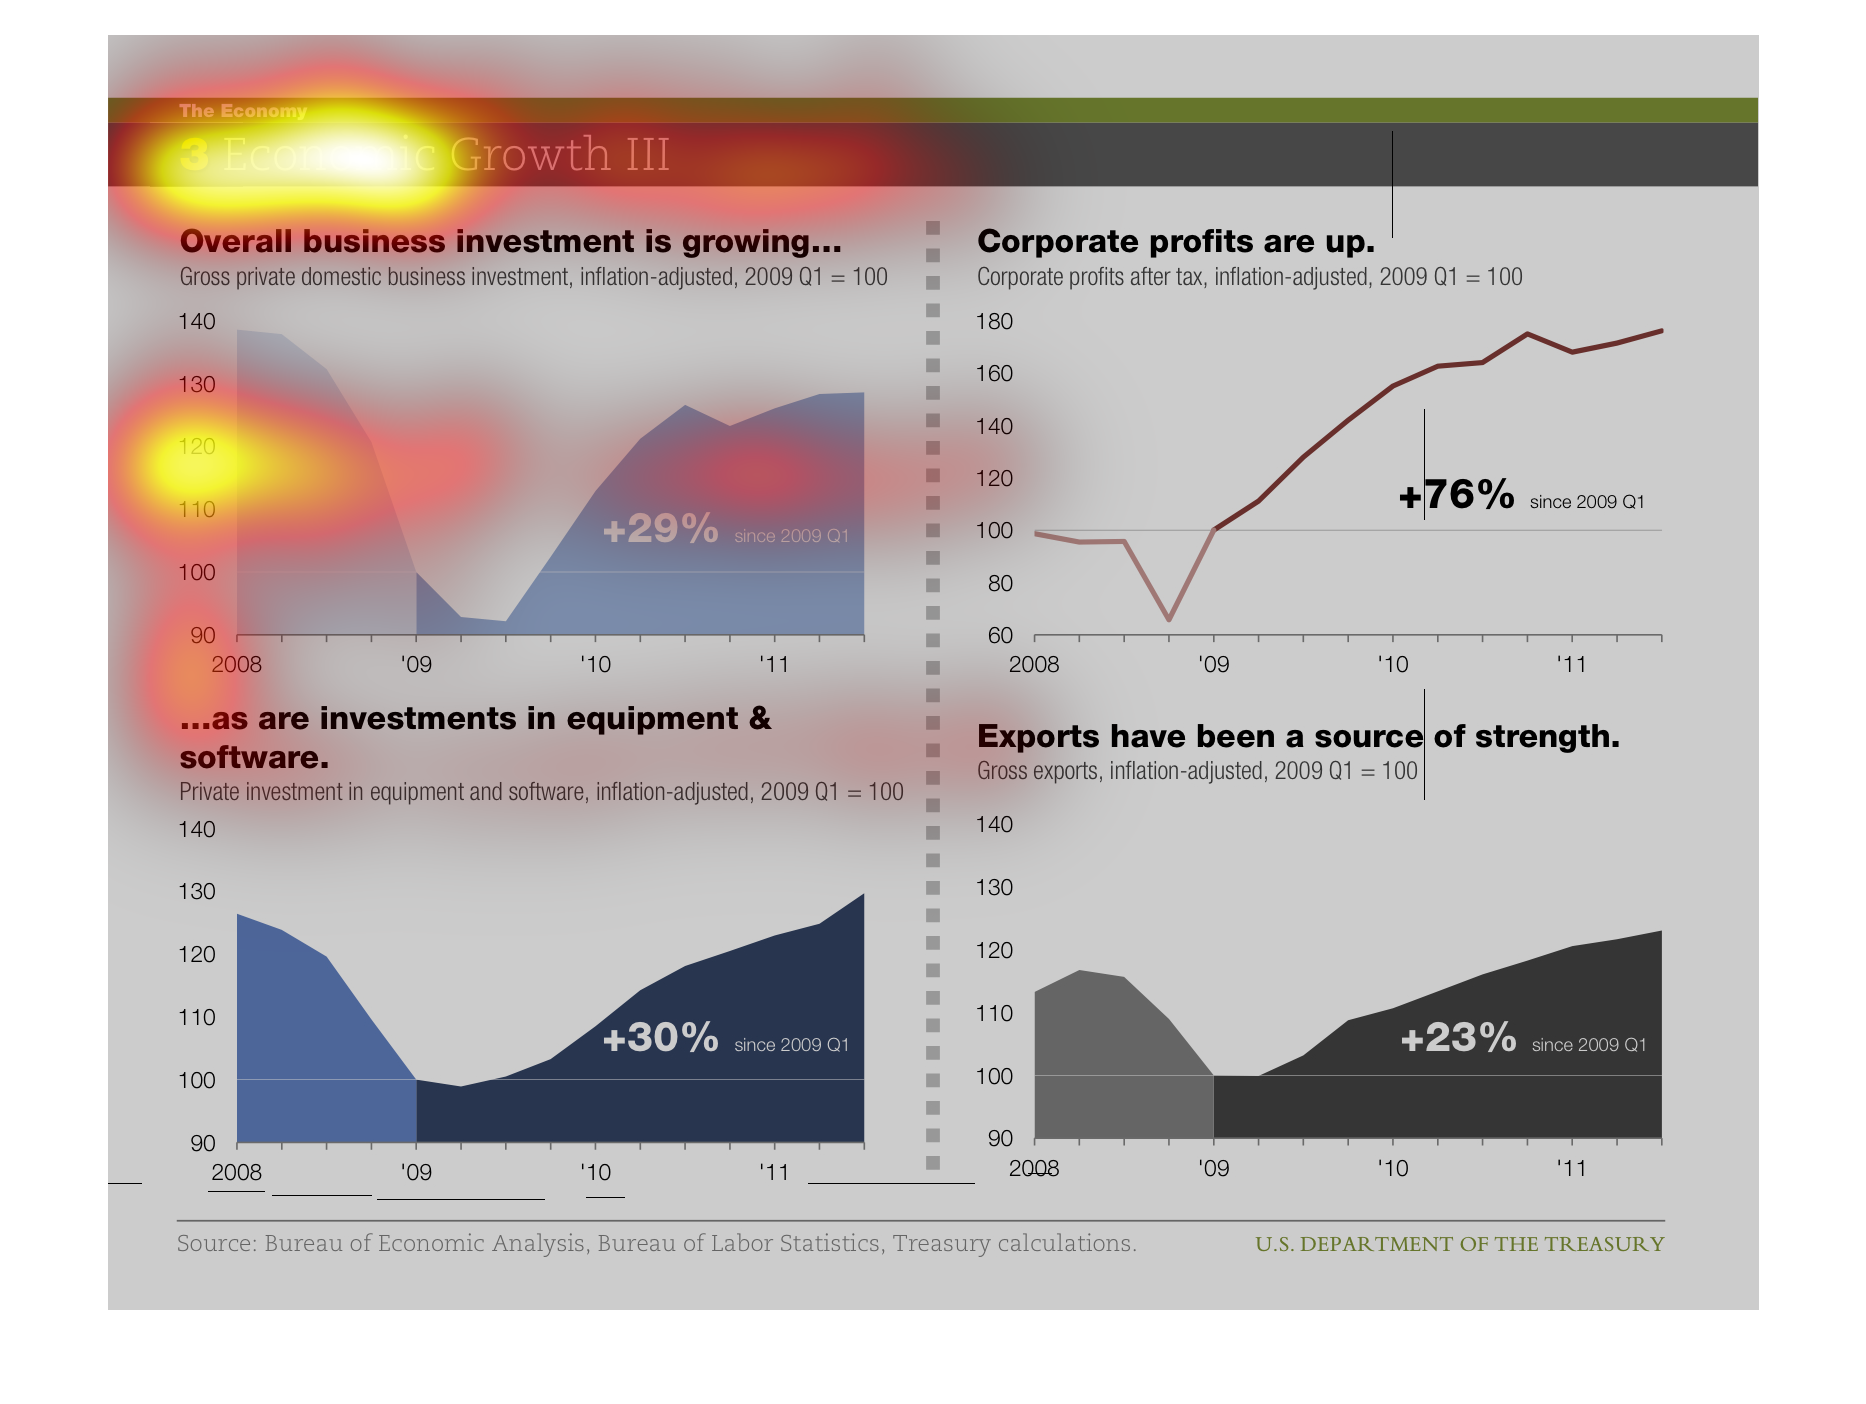
We have four graphs on the image, that should show statistics as evidence for the claim that
there is economic growth. The first diagram- top left, shows that overall business investment
is growing. The diagram on the top right shows corporate profits are increasing. The bottom
left shows investment in software businesses is increasing, and the bottom right shows the
growth in exports.
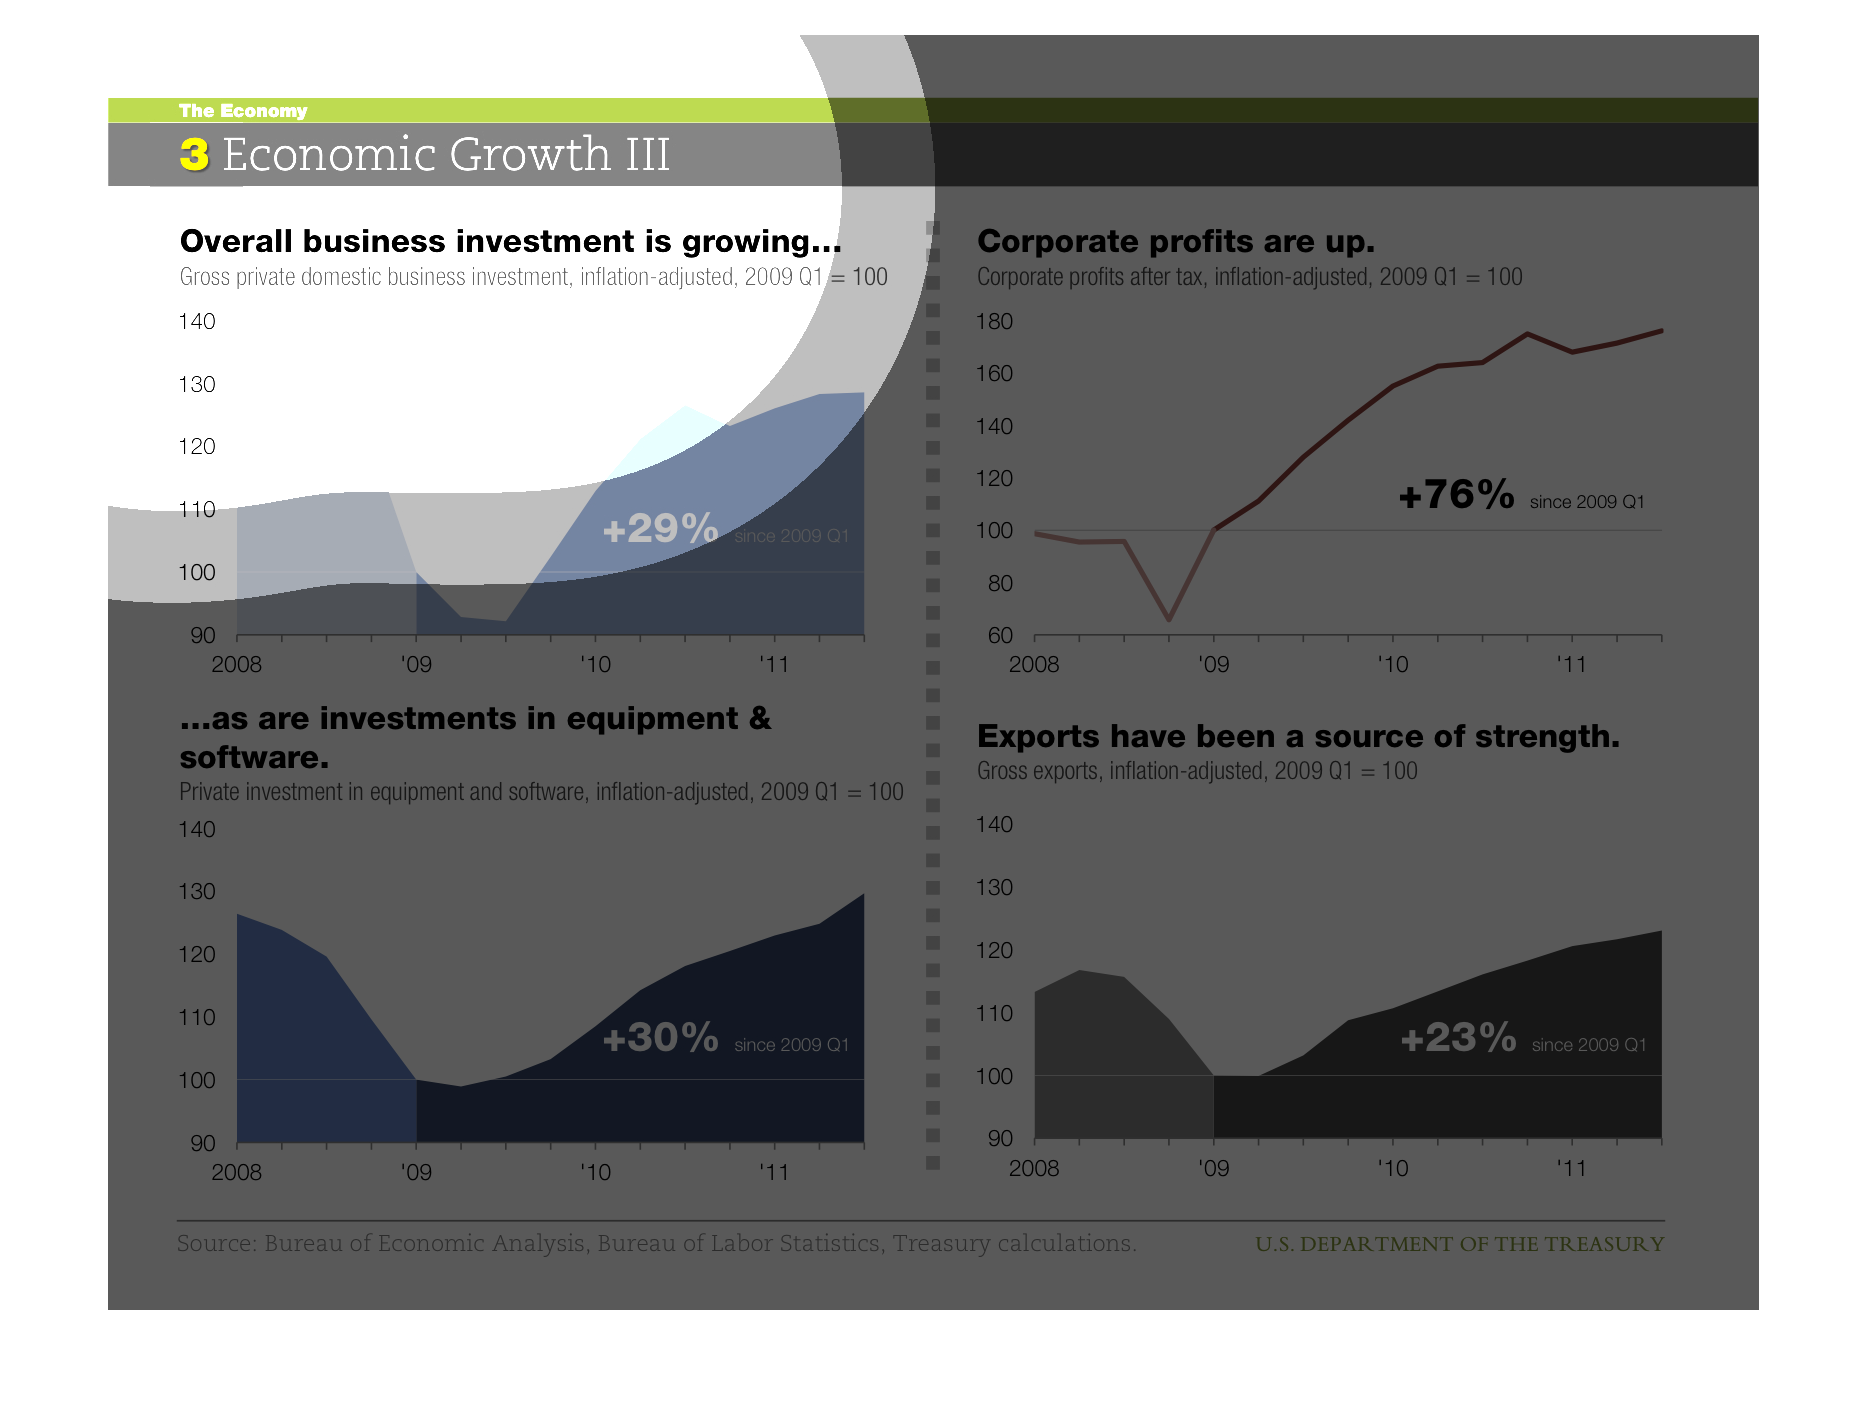
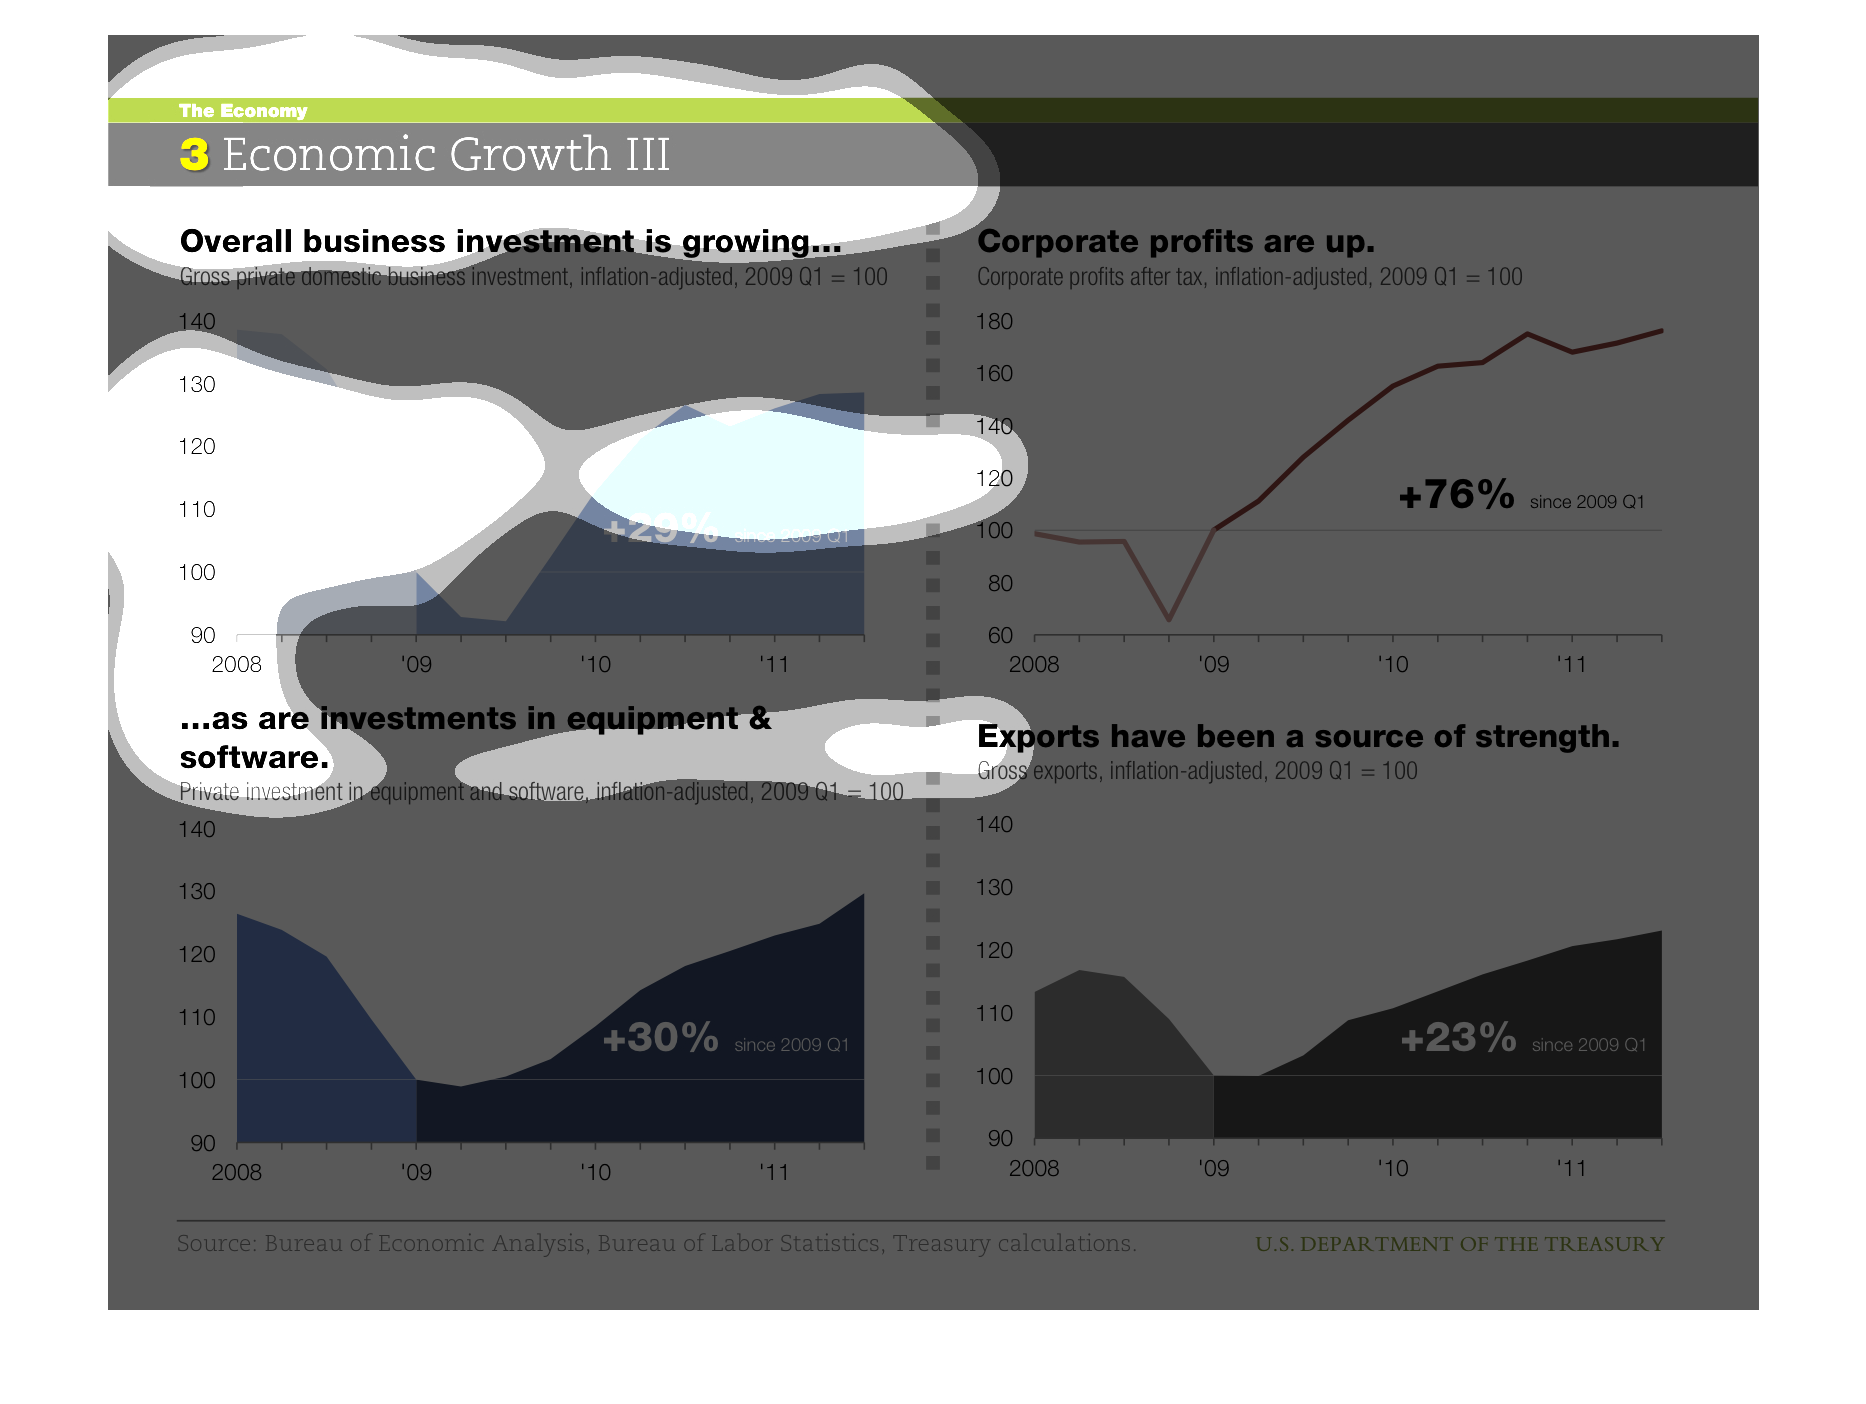
economic growth including, overall business investment growth, increase in CORPORATE profits,
as are investments in equipment software, and exports have been a source of strength
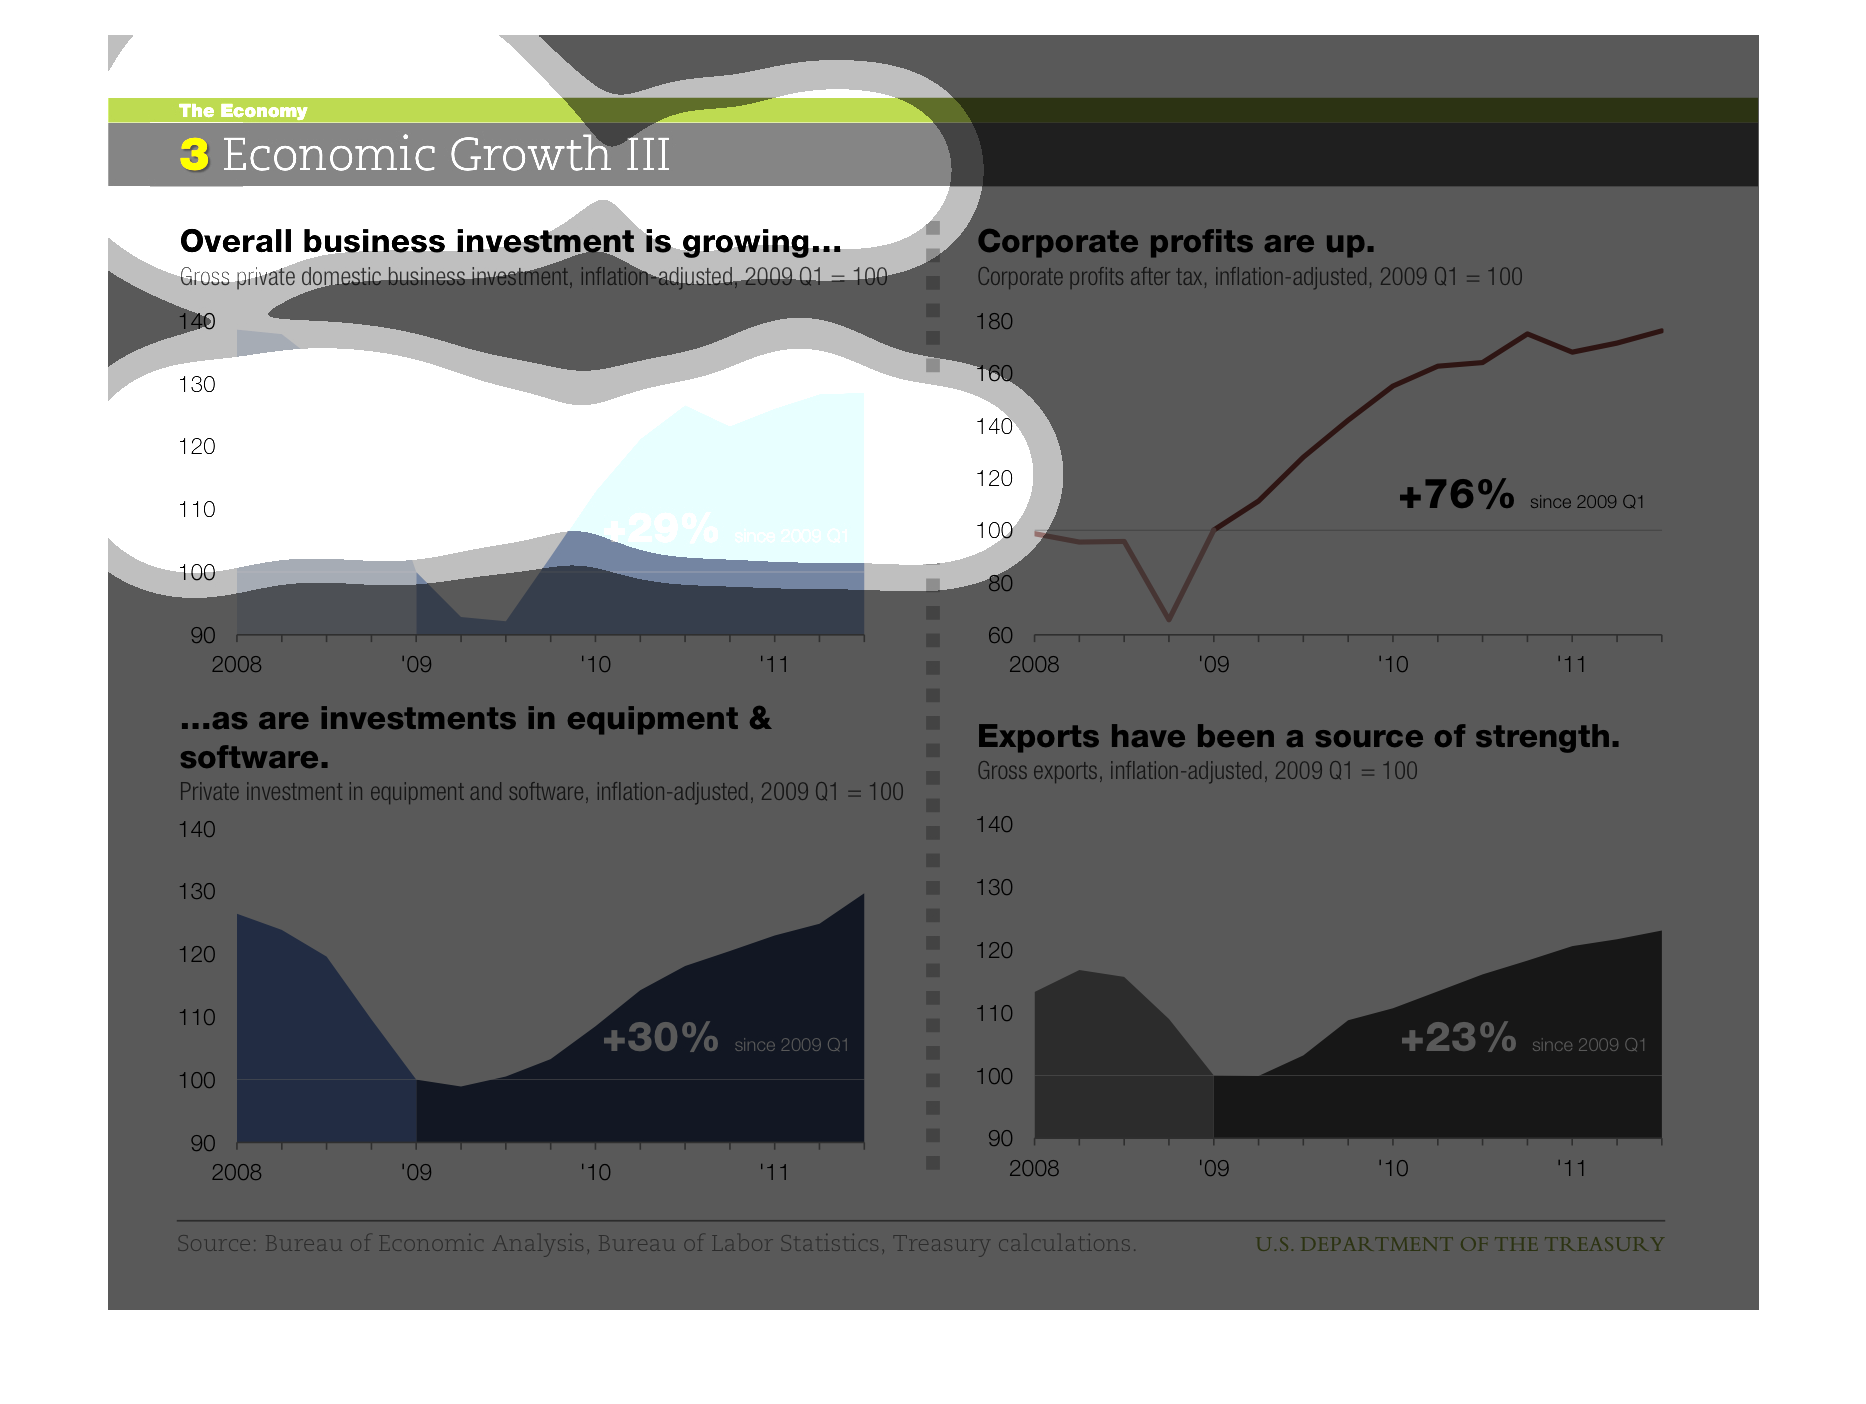
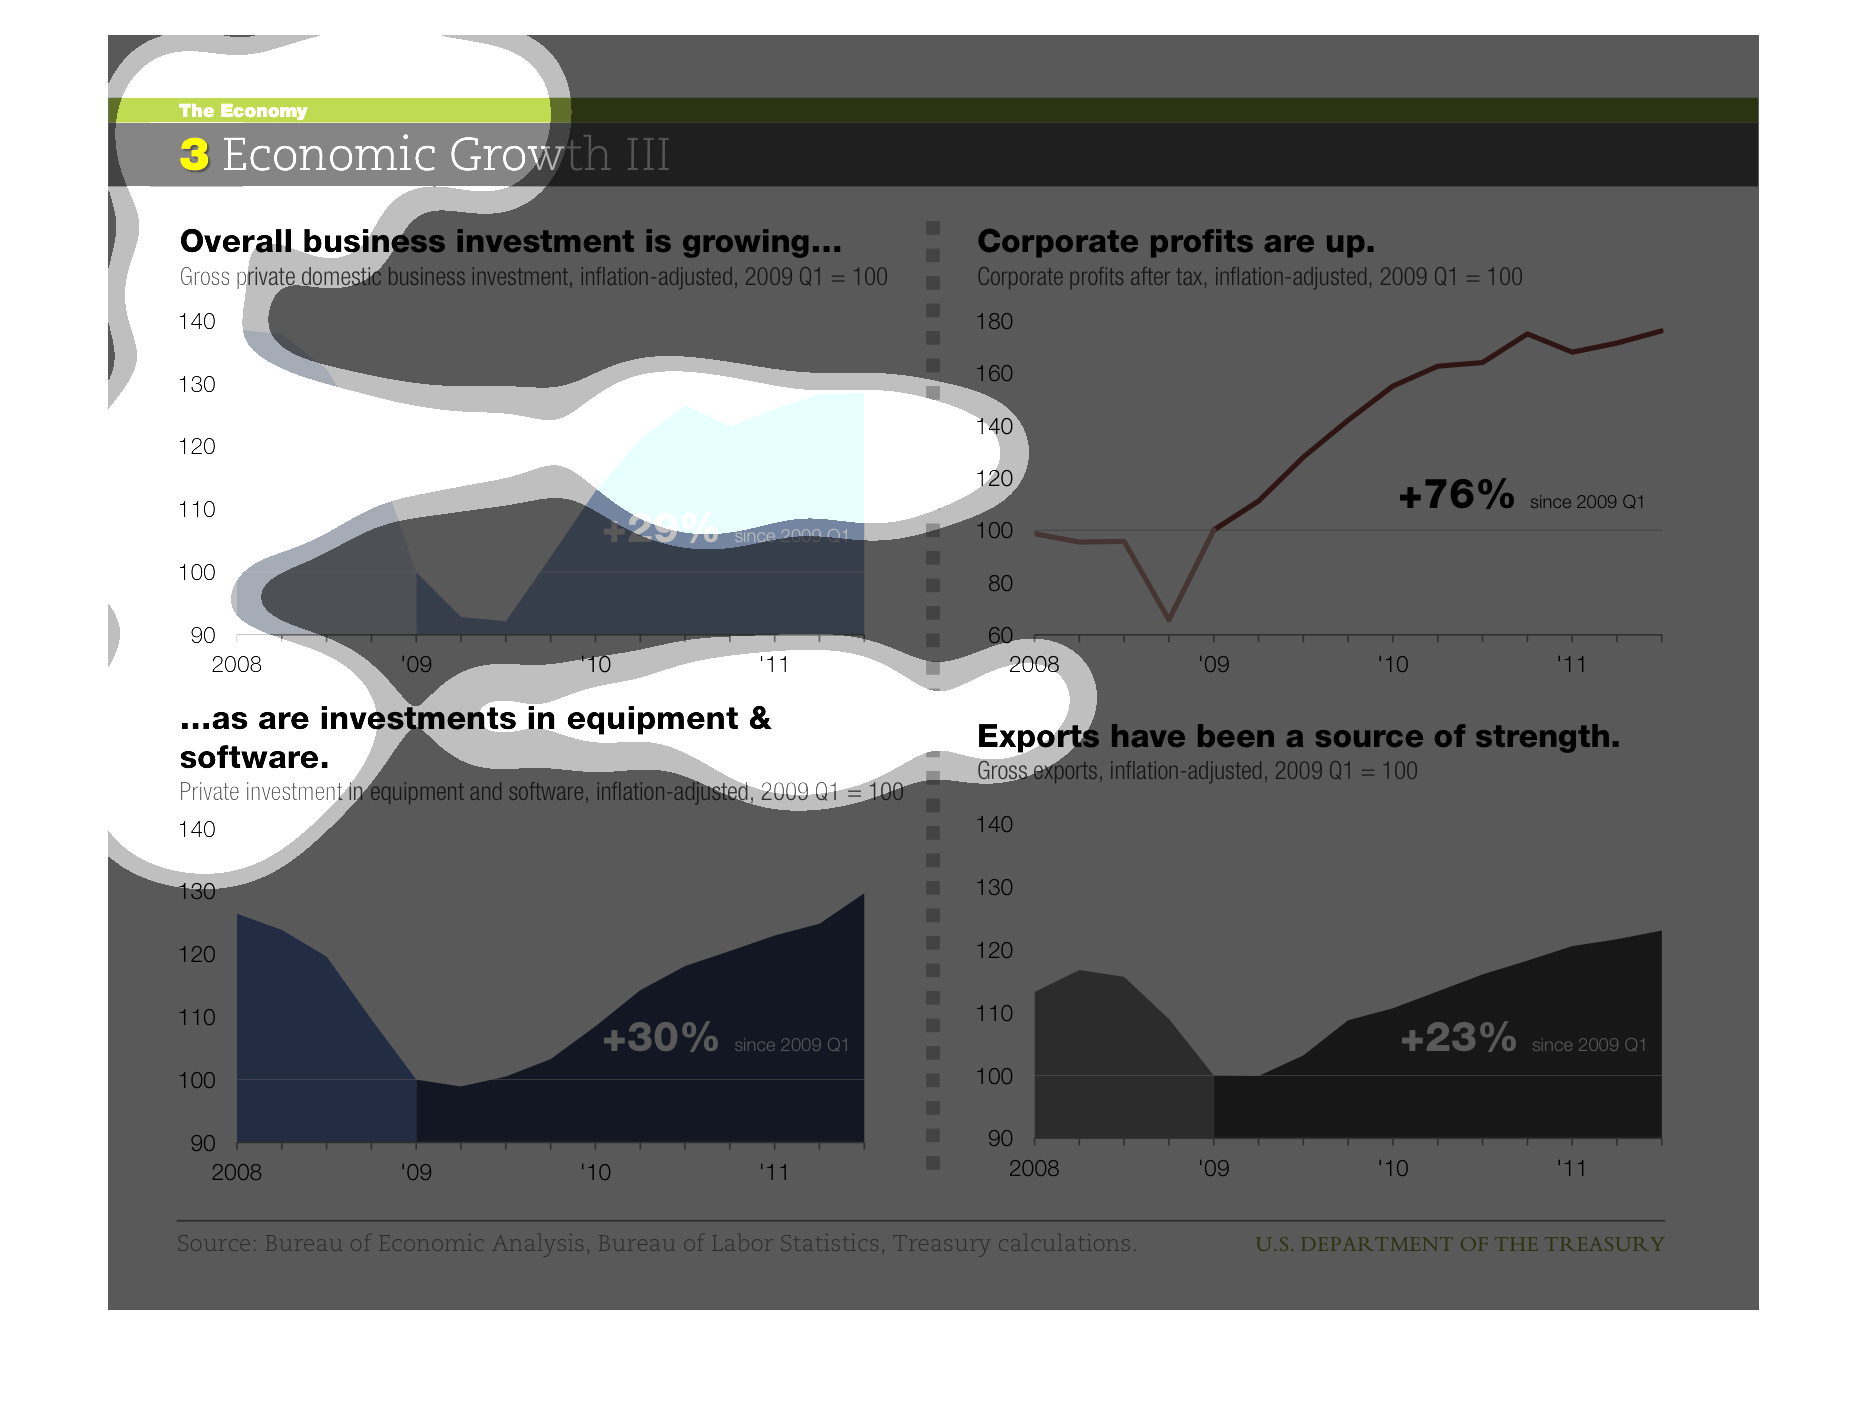
An infographic showing Economic Growth, how overall business investment is growing from 2008
to 2011. The graphs show increase in investments and recovering economy
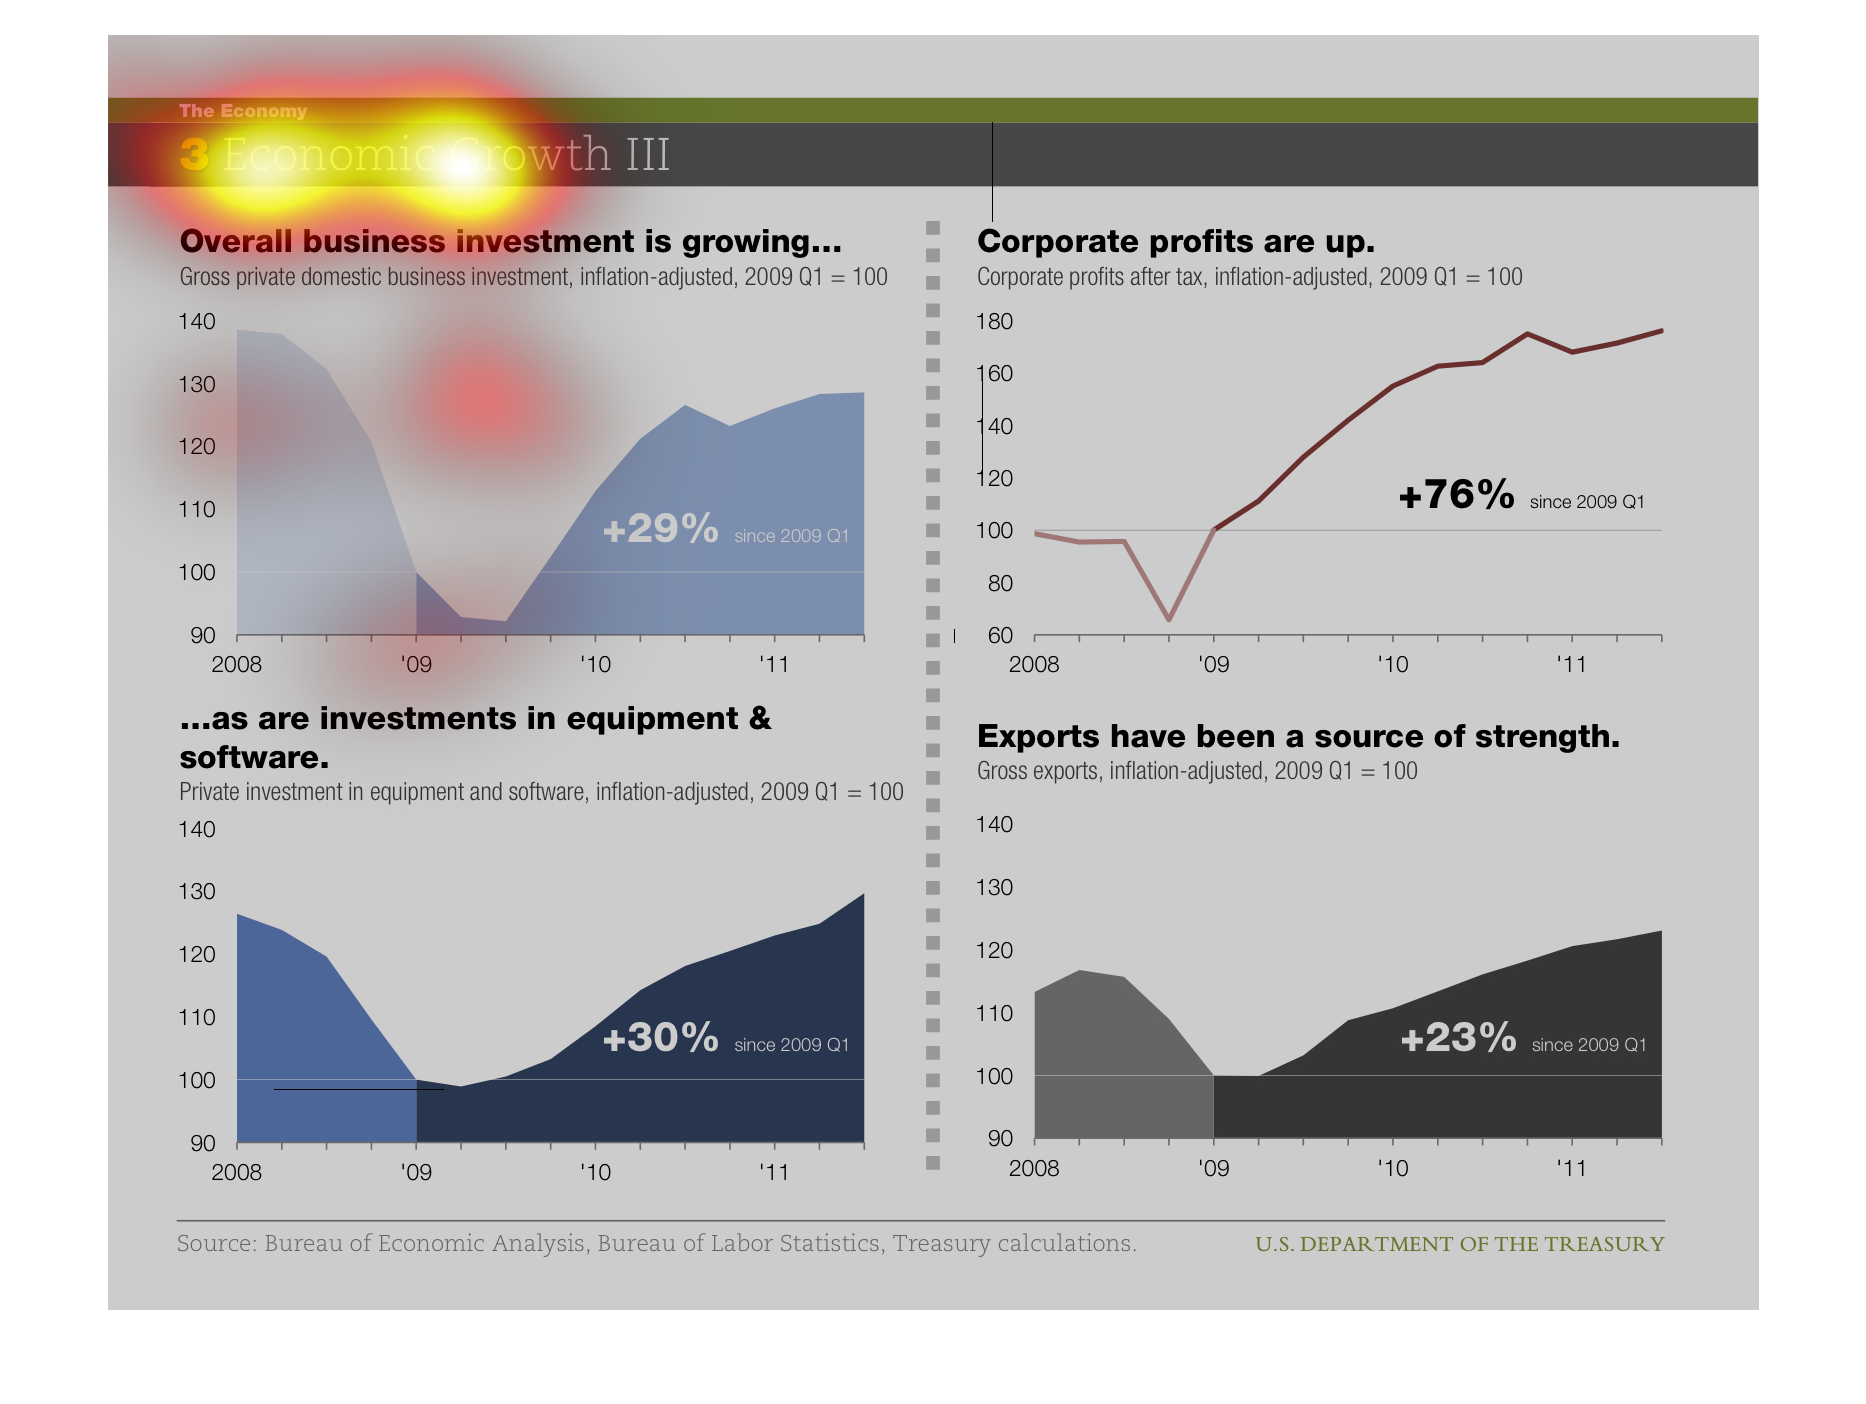
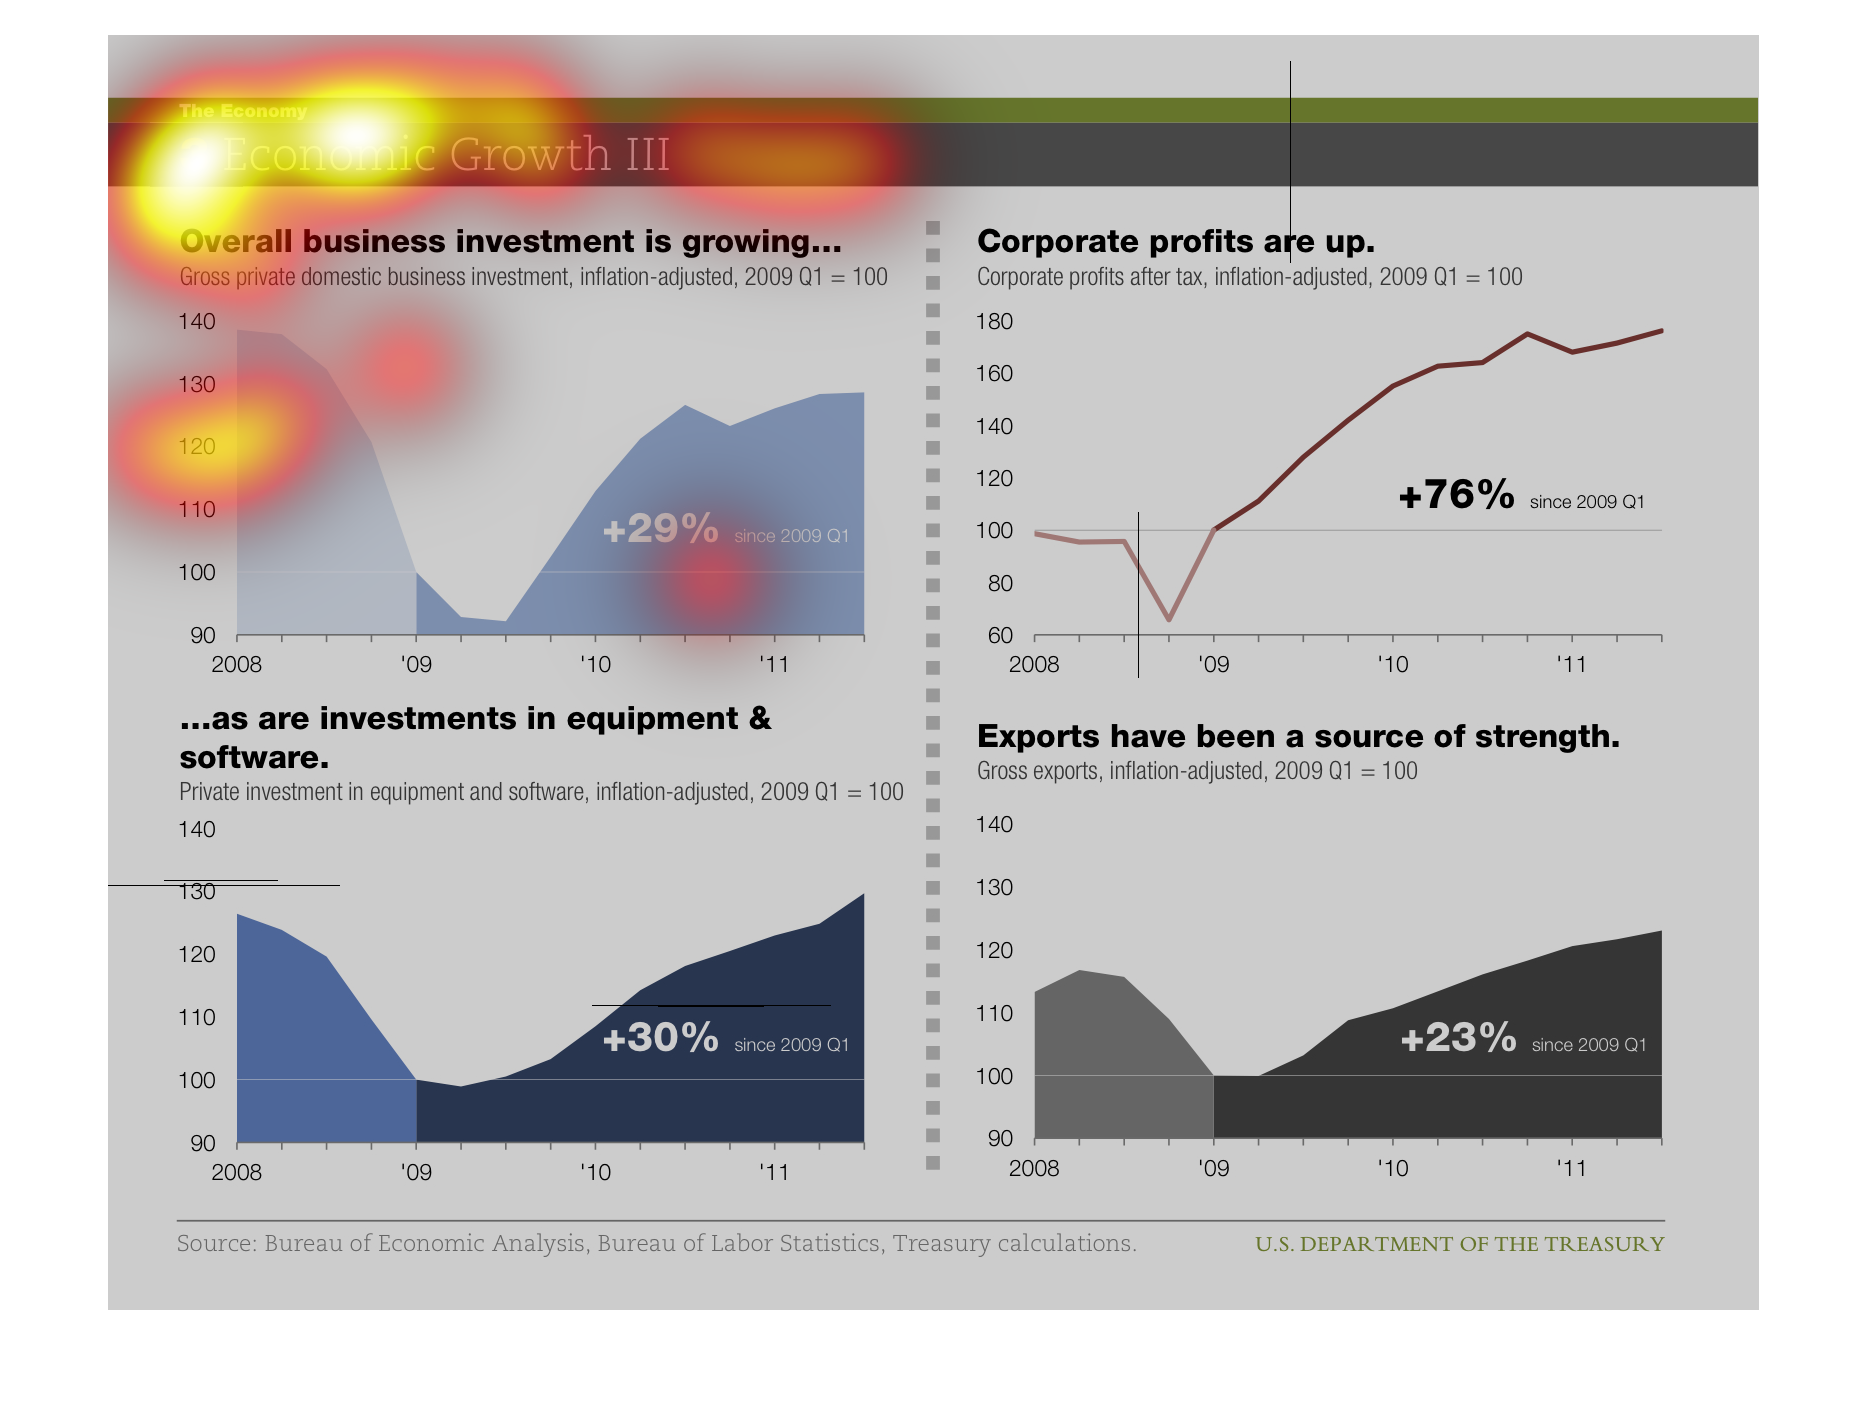
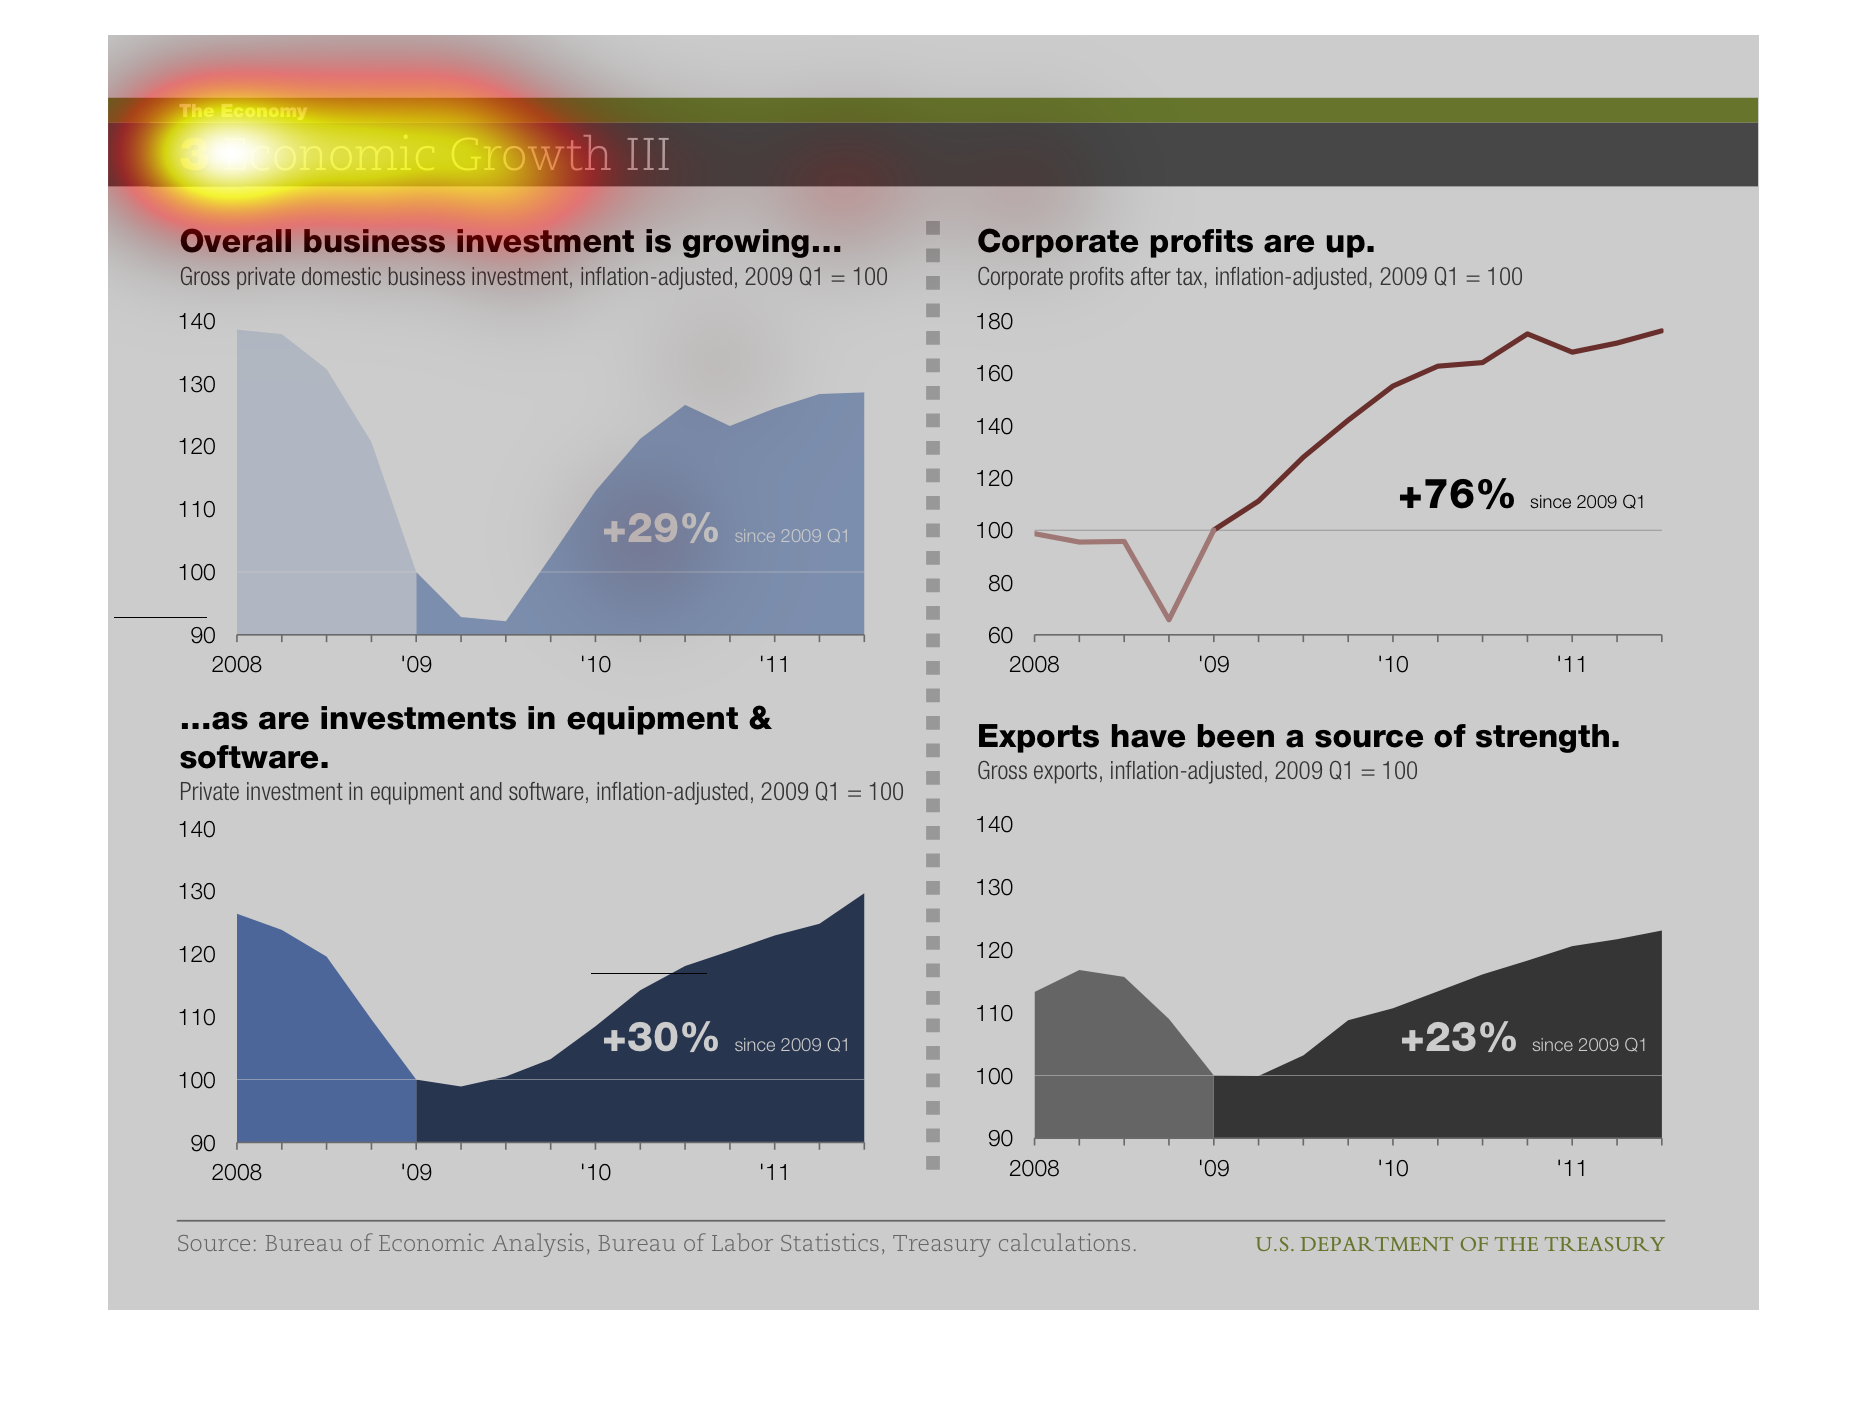
This is a graph that shows the economic growth. It shows how various industries have contributed
to this growth between the year 2008 and the year 2011.
THis image had four graphs comparing economic growth in different areas, and how they are
all increasing after having crashed in the years of depression.
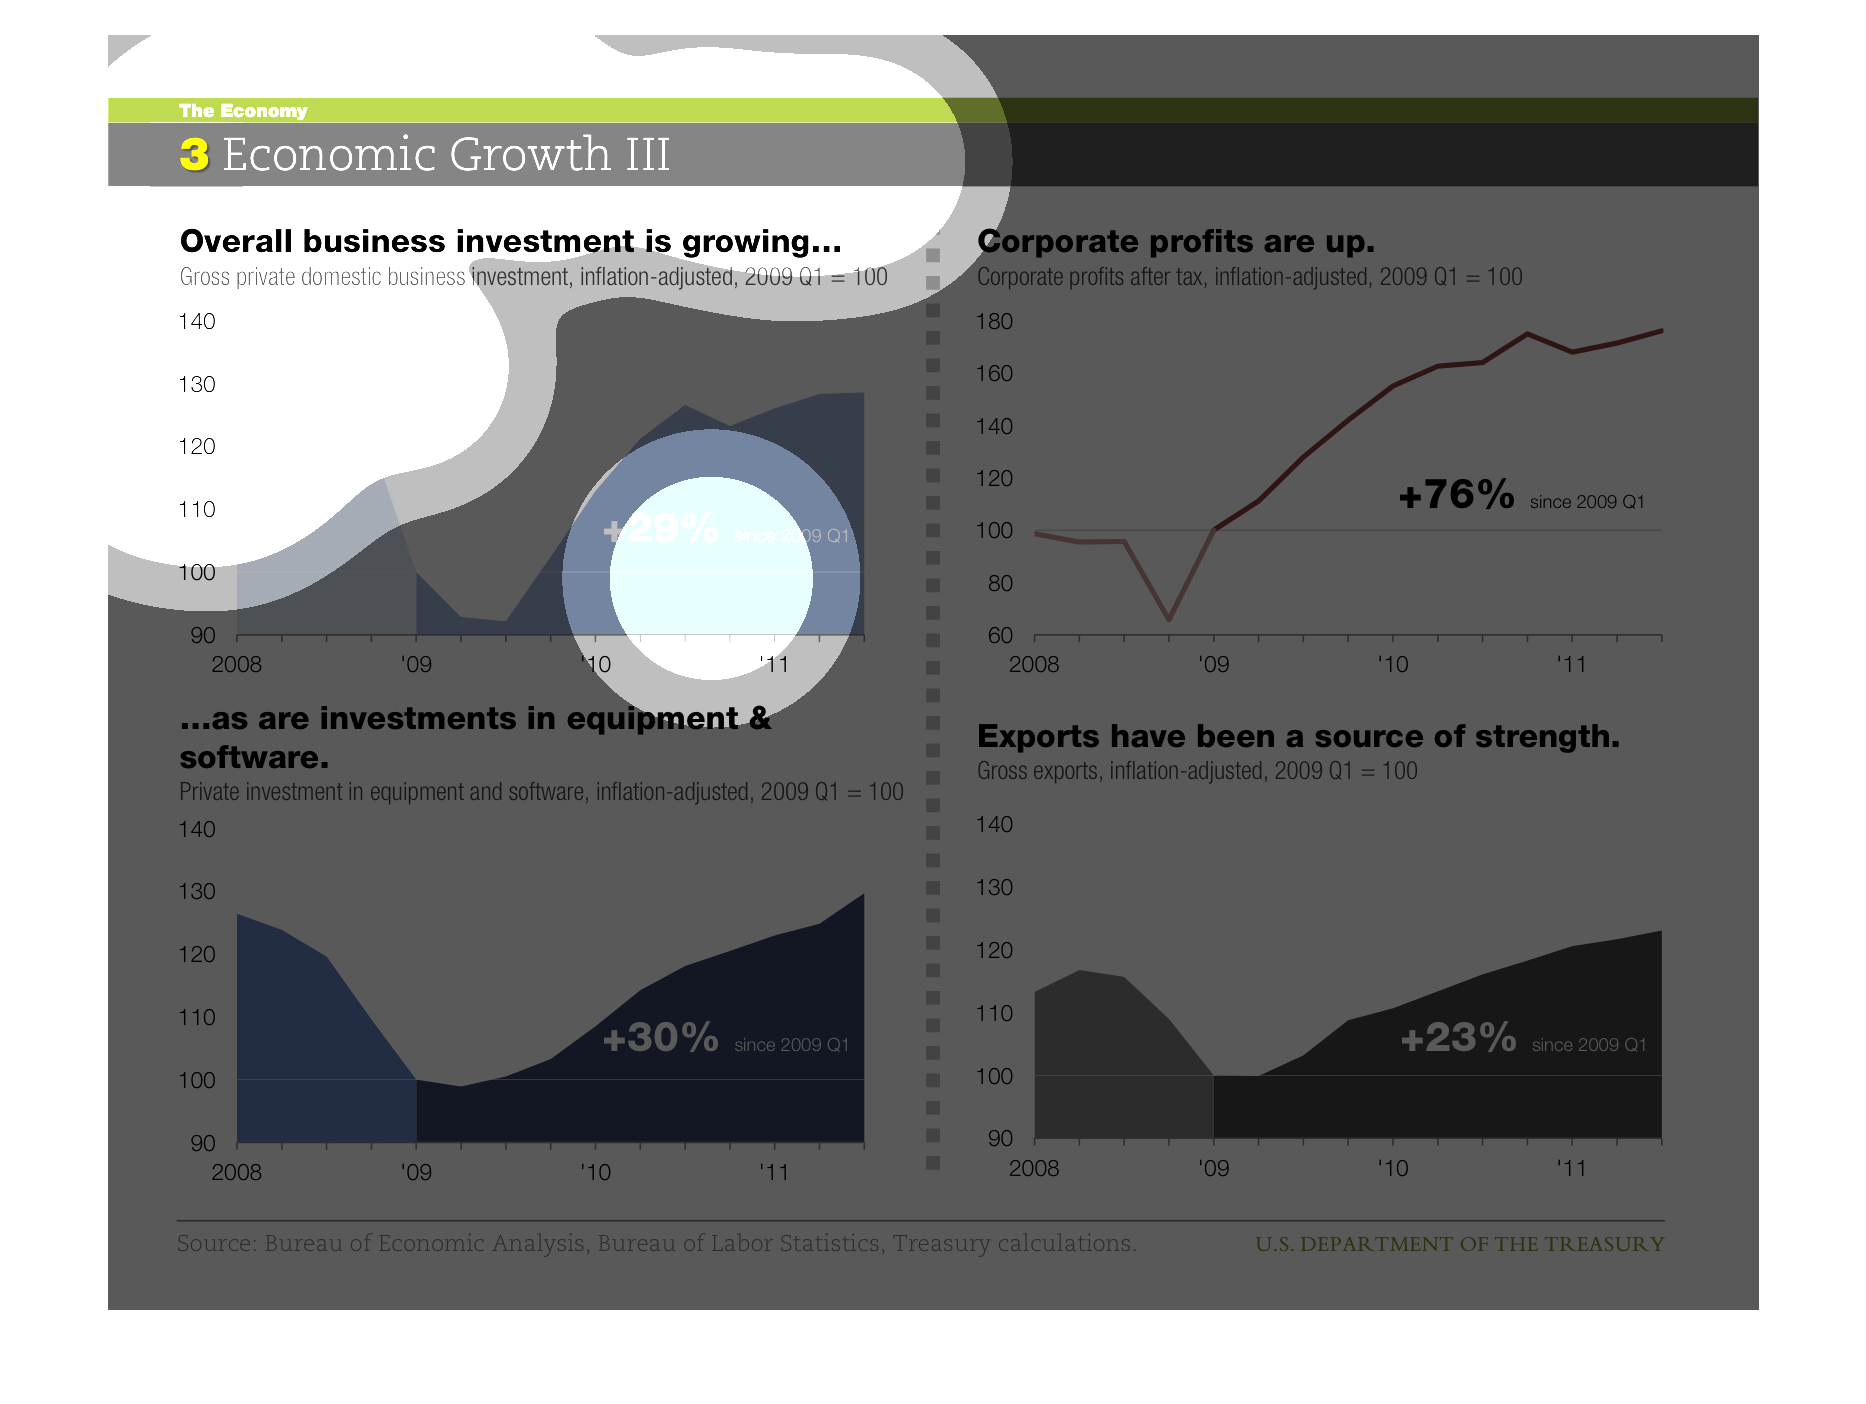
This chart describes that overall business investment is growing. Specifically gross private
domestic business investment, inflation-adjustment in the US.
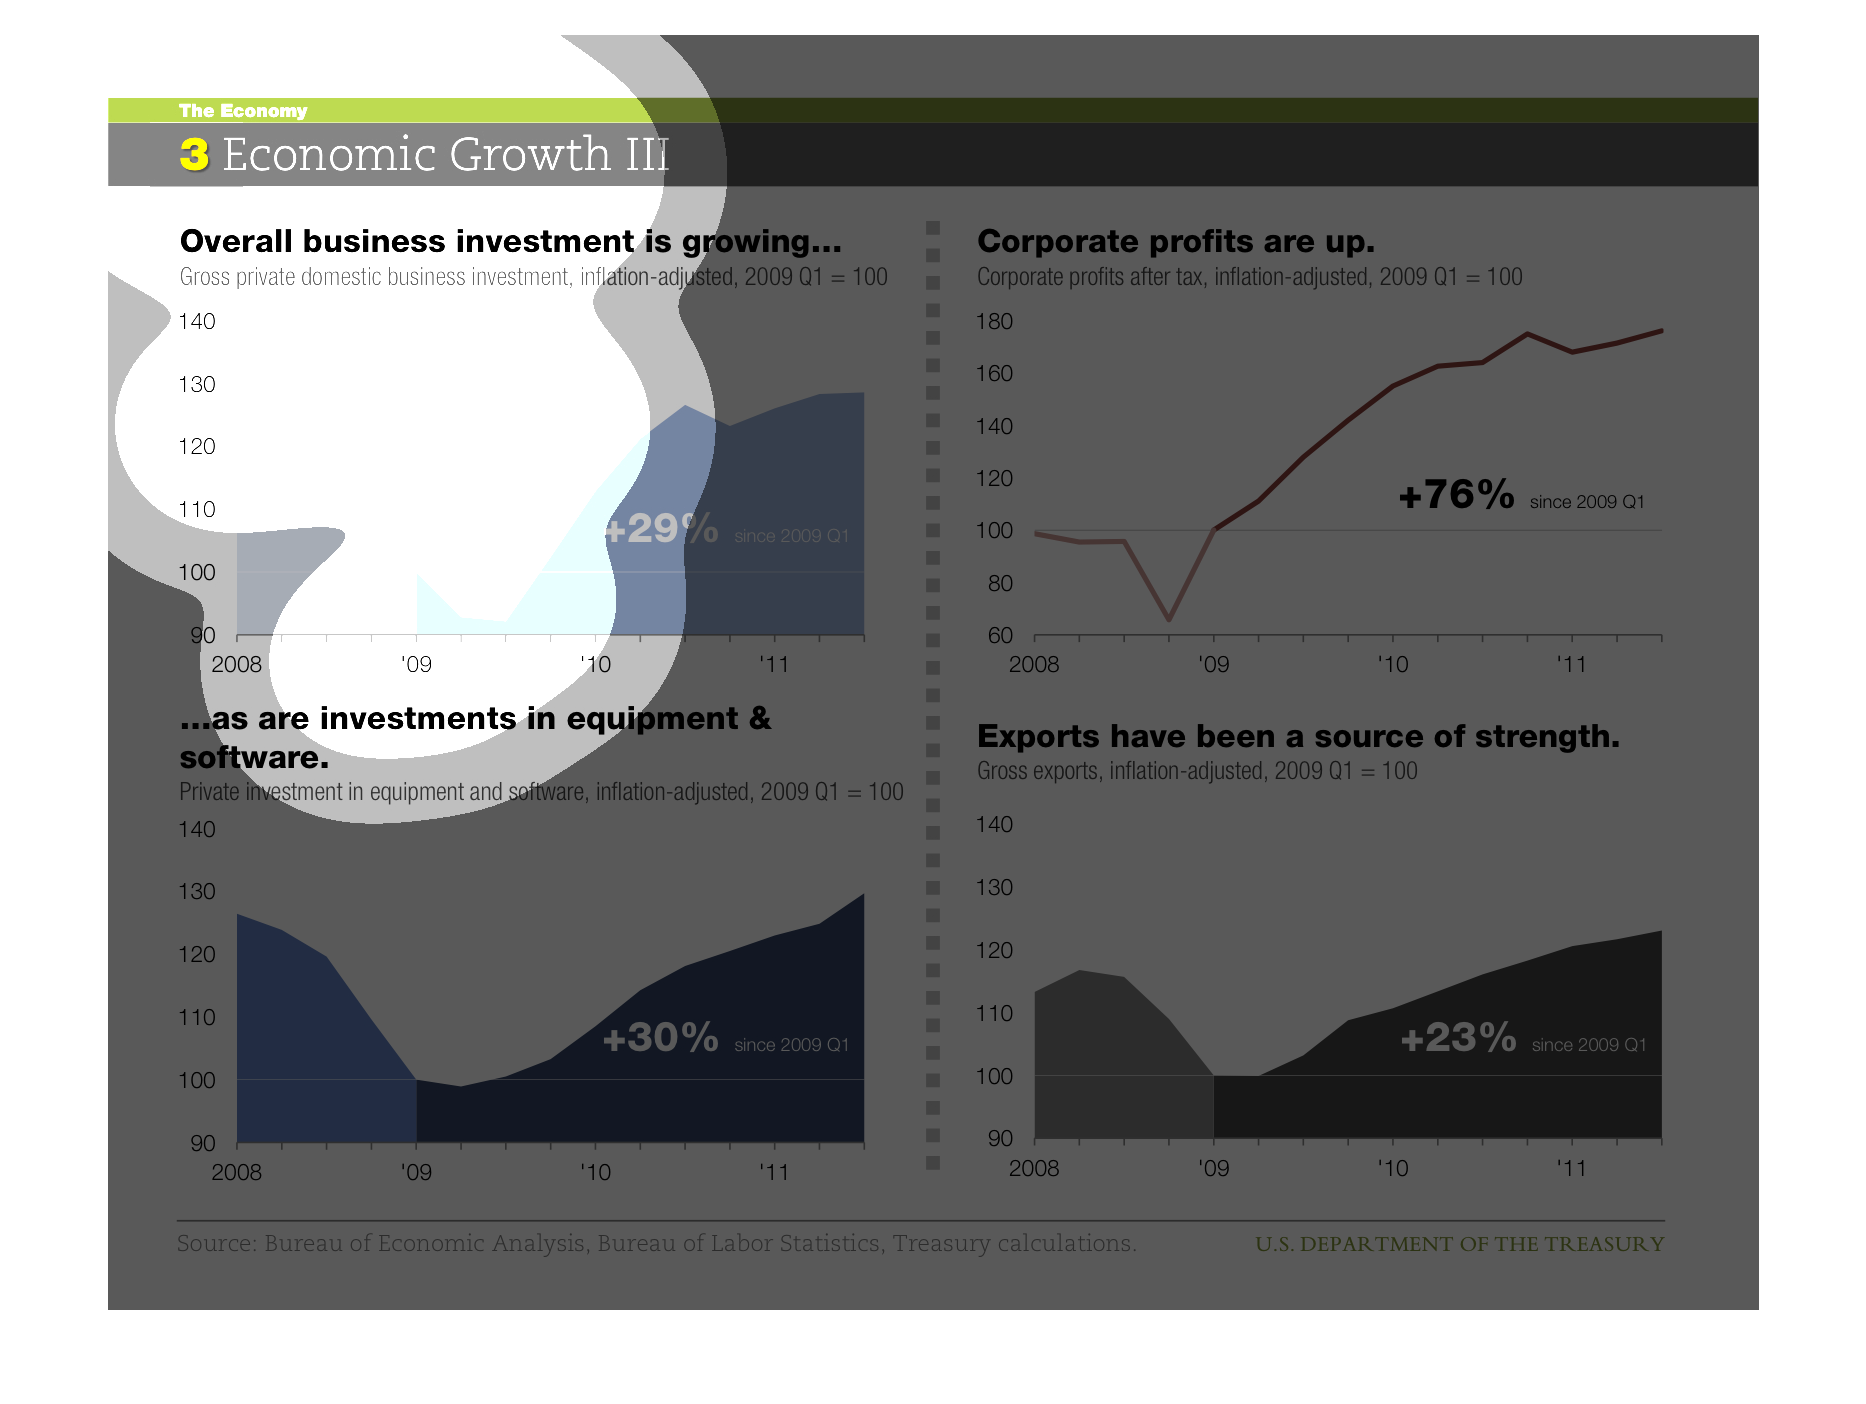
The chart clearly displays economic growth through the growth of overall business investment.
The chart displays several years in which the growth of the economy improves.
All four charts are showing major growth since 2009. The charts are showing business investments,
investments in equipment and software, exports, and corporate profits.
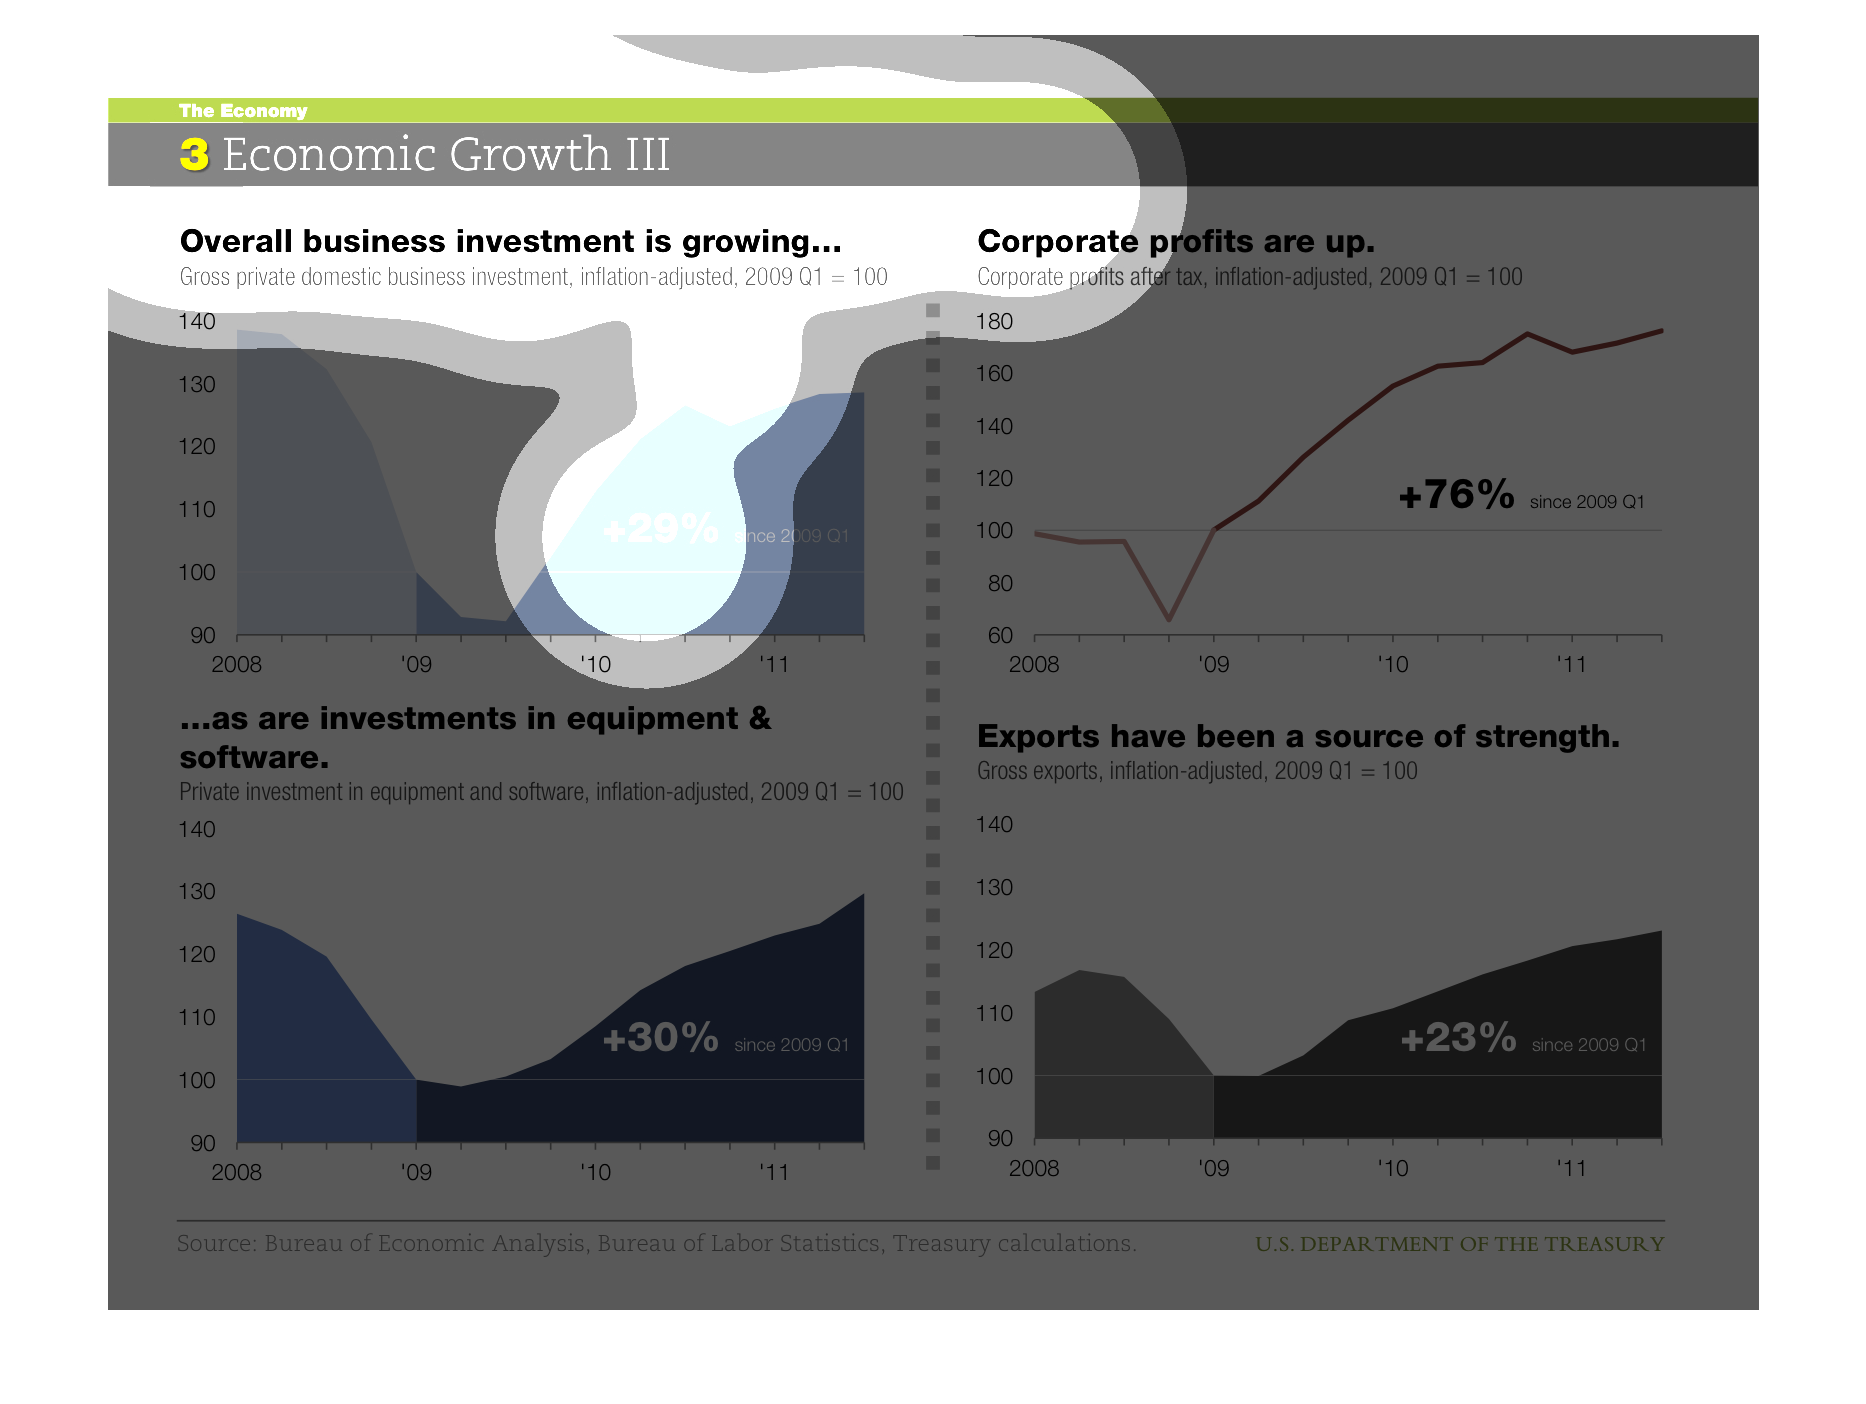
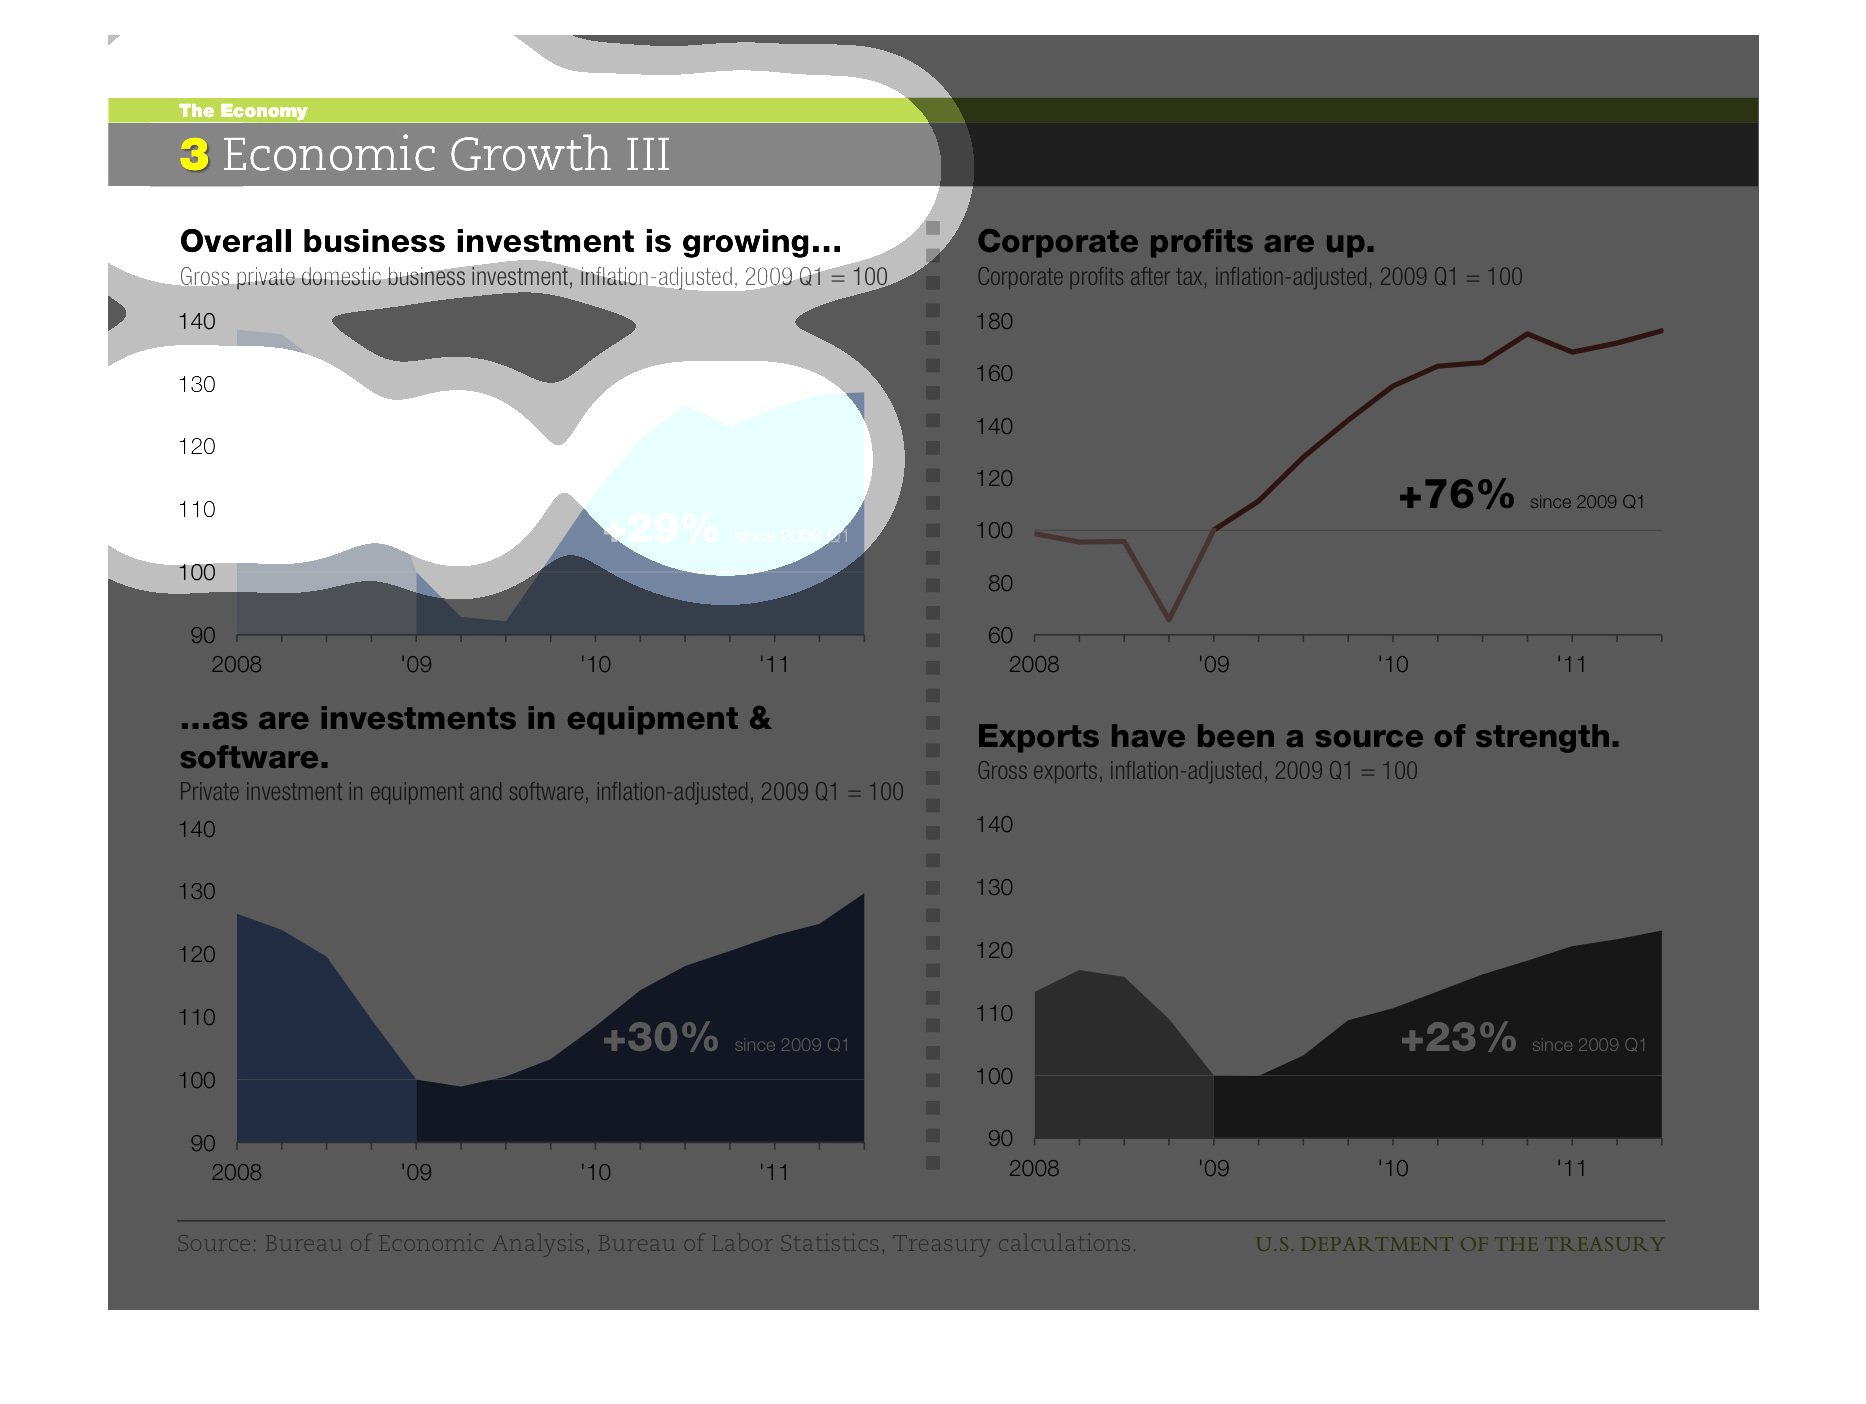
The image describes the investments a business is engaged in over the 2008 - 2011 period.
Over the same period, different graphs depict different metrics for the company including
profits, export numbers, and investments into other technologies.
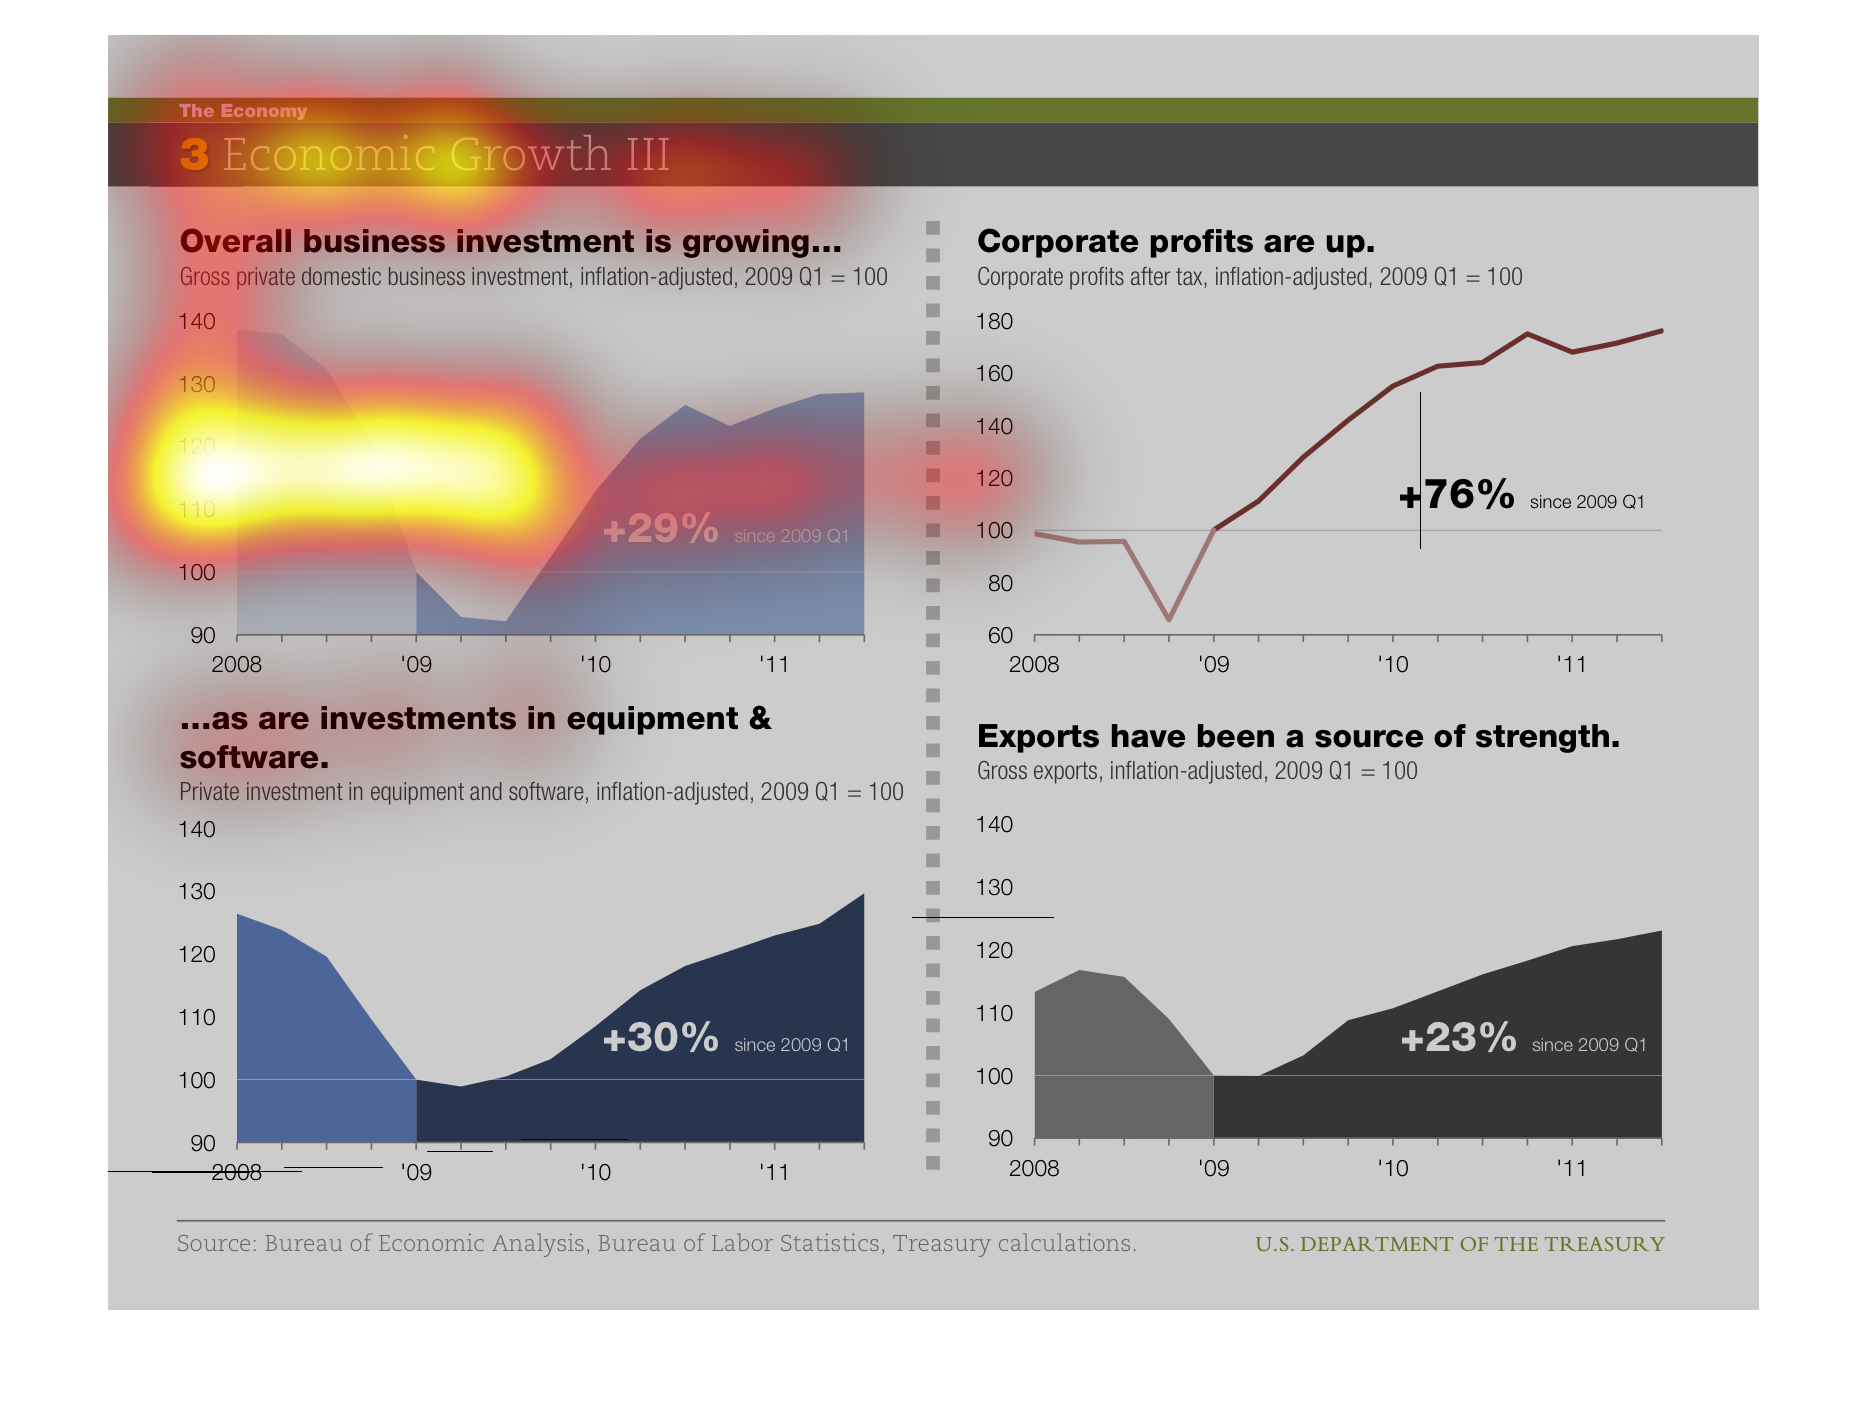
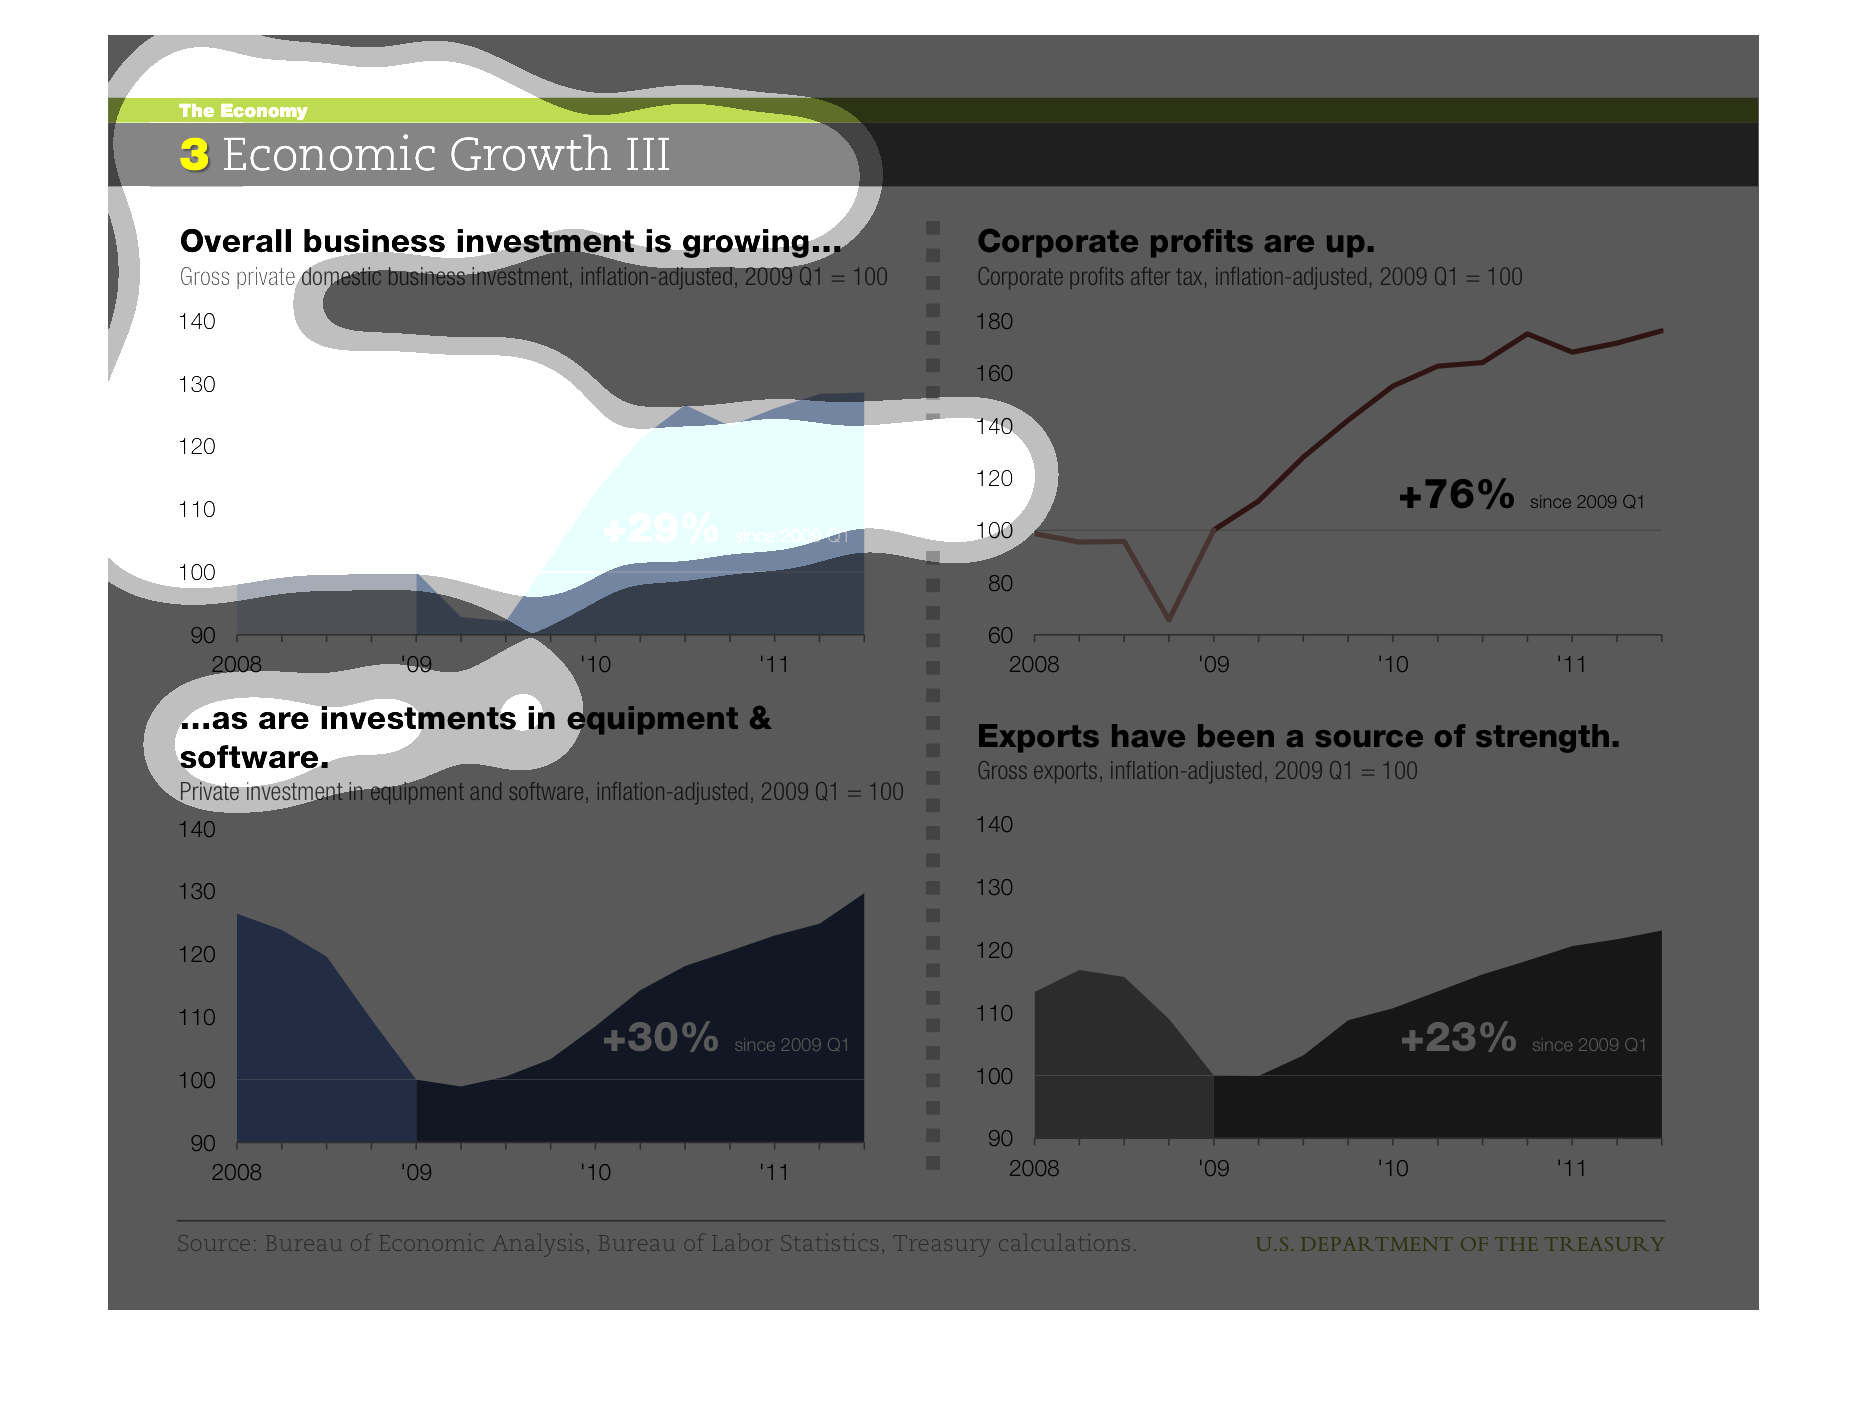
The top left graph shows overall business investment while the top right shows corporate profit
growth.  The bottom left graph shows investment in equipment and software and the bottom right
shows exports.
Shows economic growth trends in different components of GDP. The trends all mirror each other,
signifying that there is an overall external driver that is common to all the different sectors.
Economic growth comes as a response to software investments, exports, corporations, and businesses.
The gross private domestic businesses, corporate profits after taxes, private investments
and software, and gross imports are all shown.
This is a series of charts depicting the economic growth across several different sectors/metrics
including corporate profits, business investment and exports.
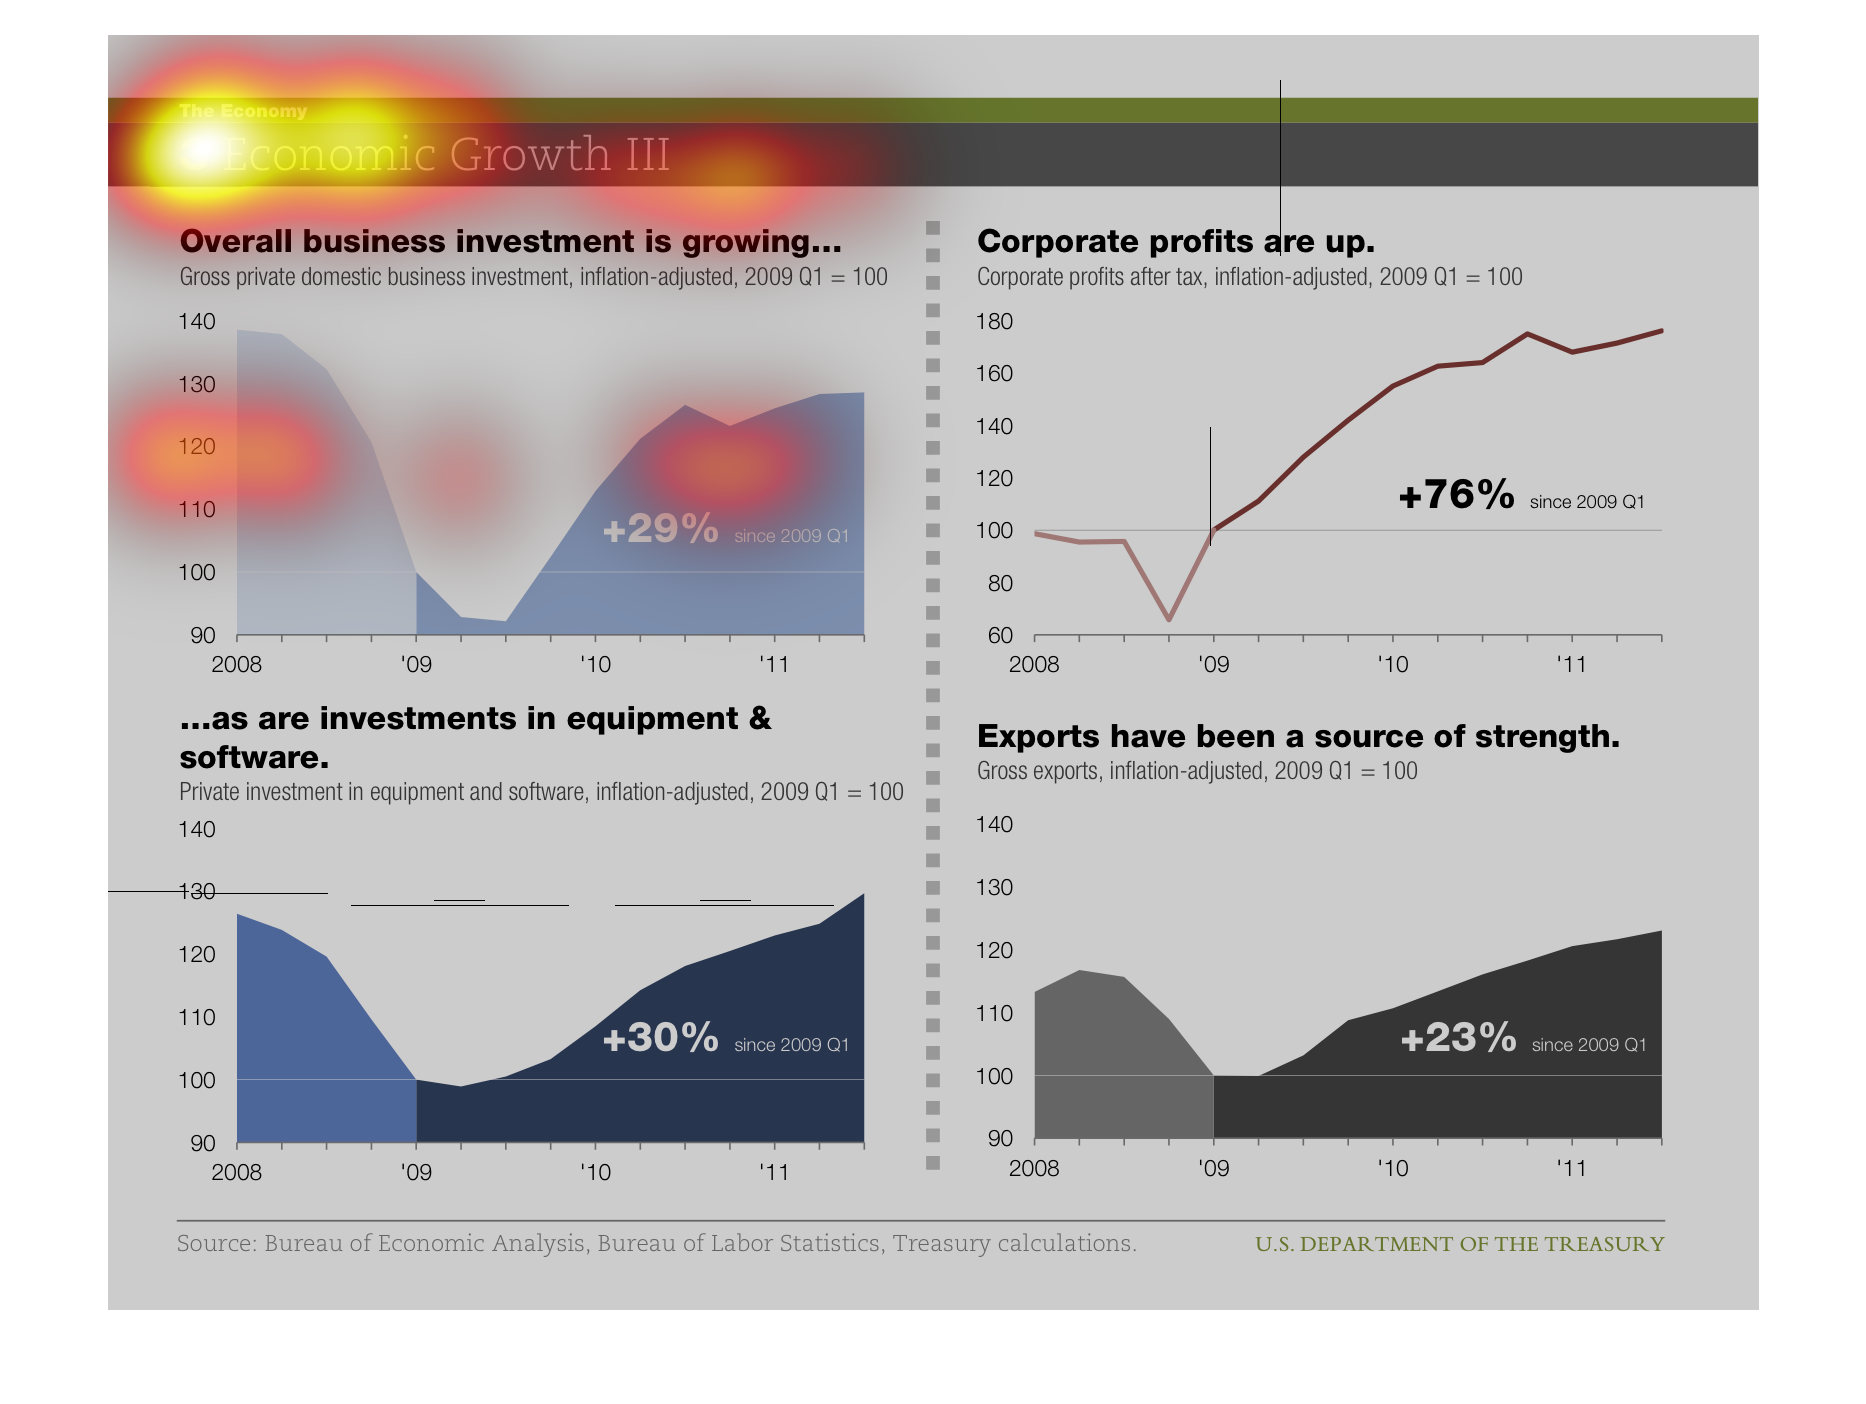
This chart is for 3 Economic III. Below that is states Overall business investment is growing.
Next to that is says Corporate profits are up. This is fun chart.