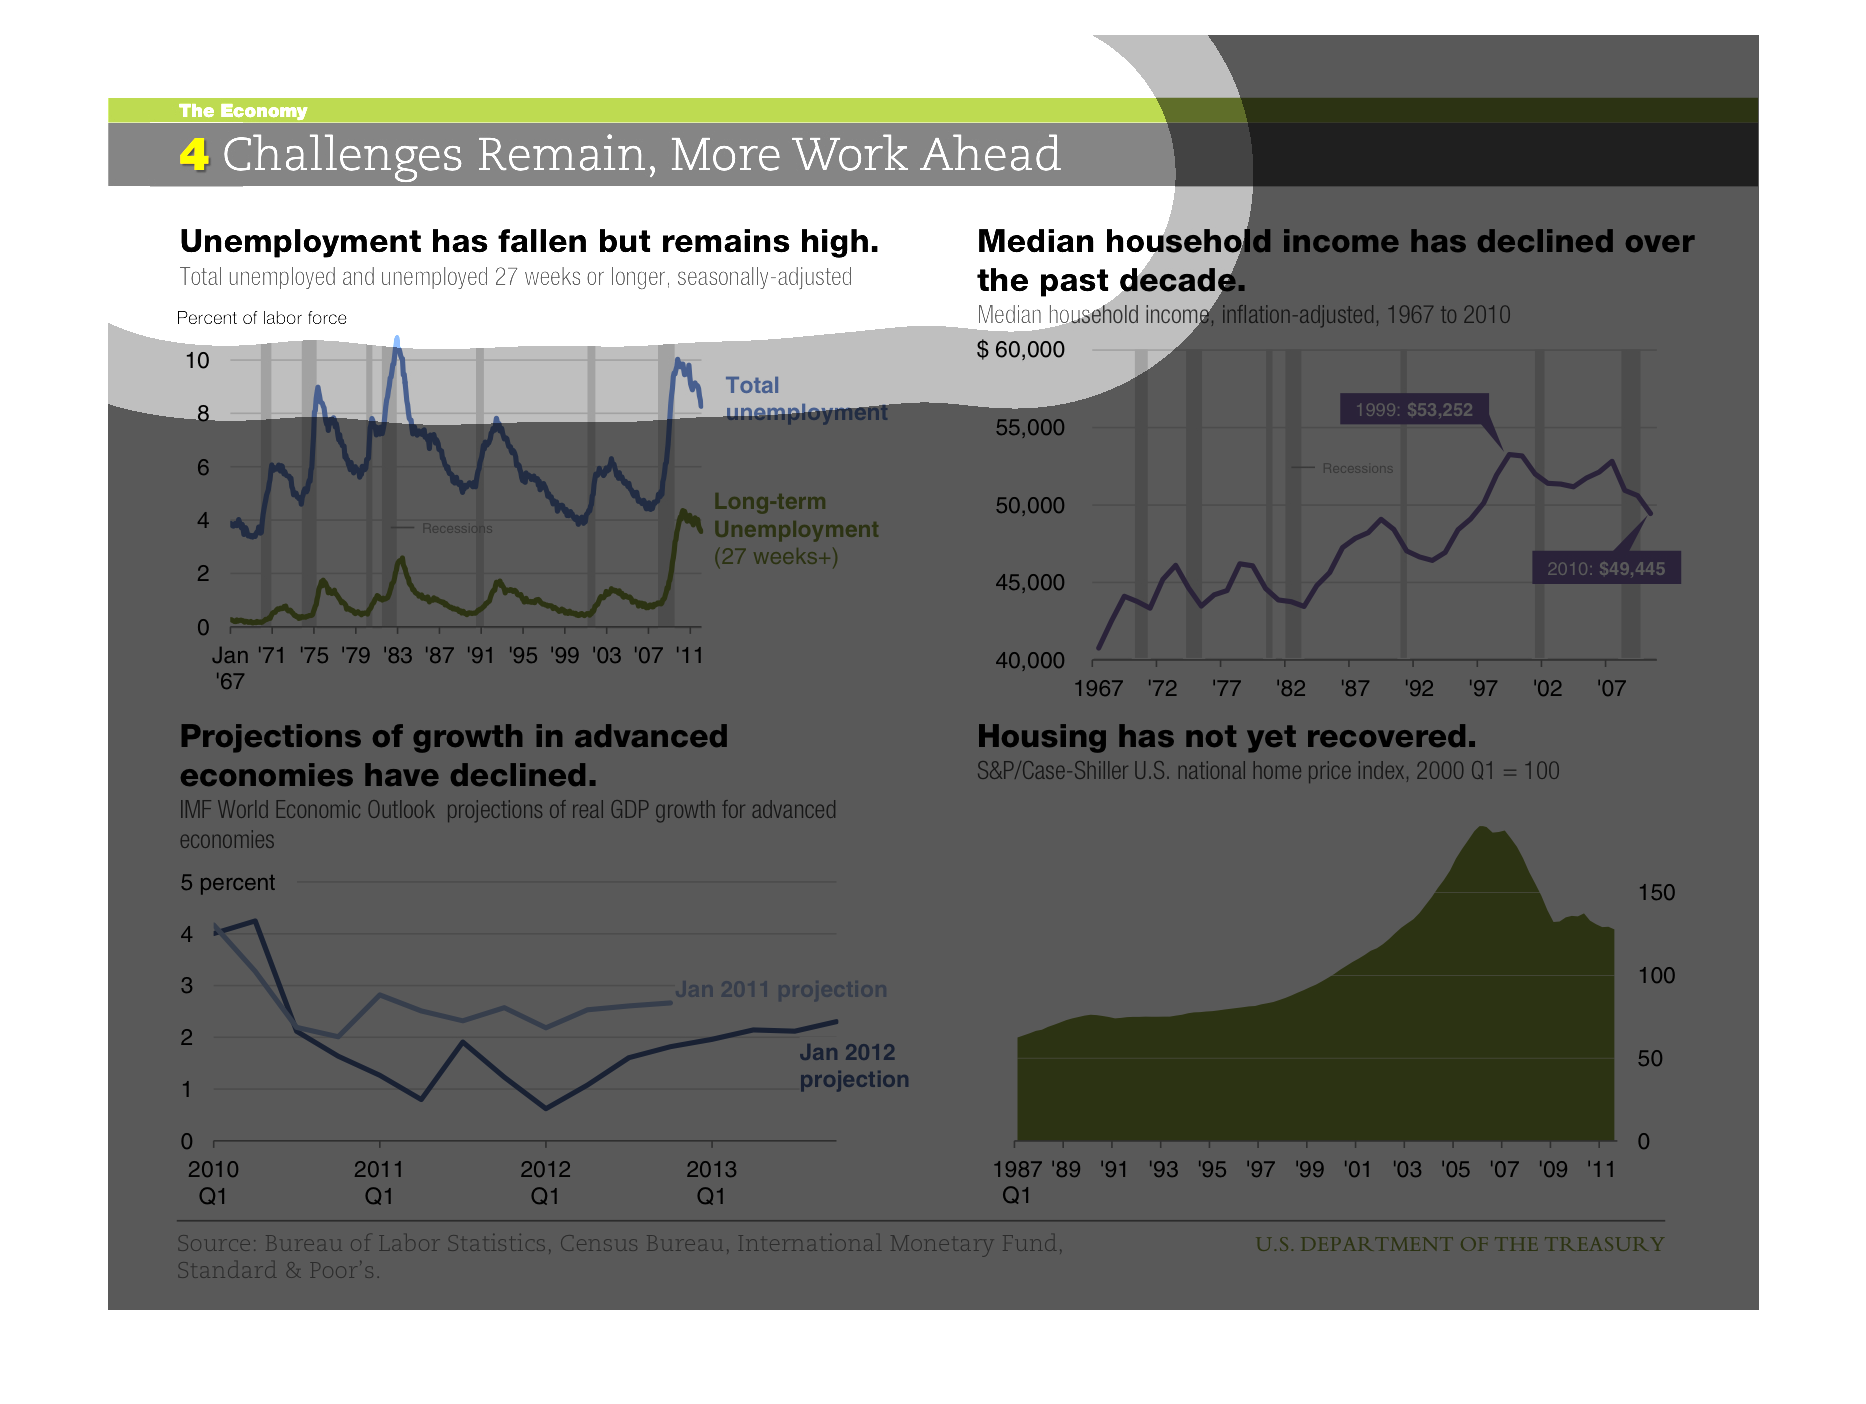
There are many different graphs displayed on this page. The overall theme seems to be that
despite modest progress on economic issues, the situation remains really bad in many important
ways. For instance, Unemployment and housing prices hit huge valleys in recent years. They
are better now, but no where near their peaks and there is a lot of space for them to grow
to get back to the best place.
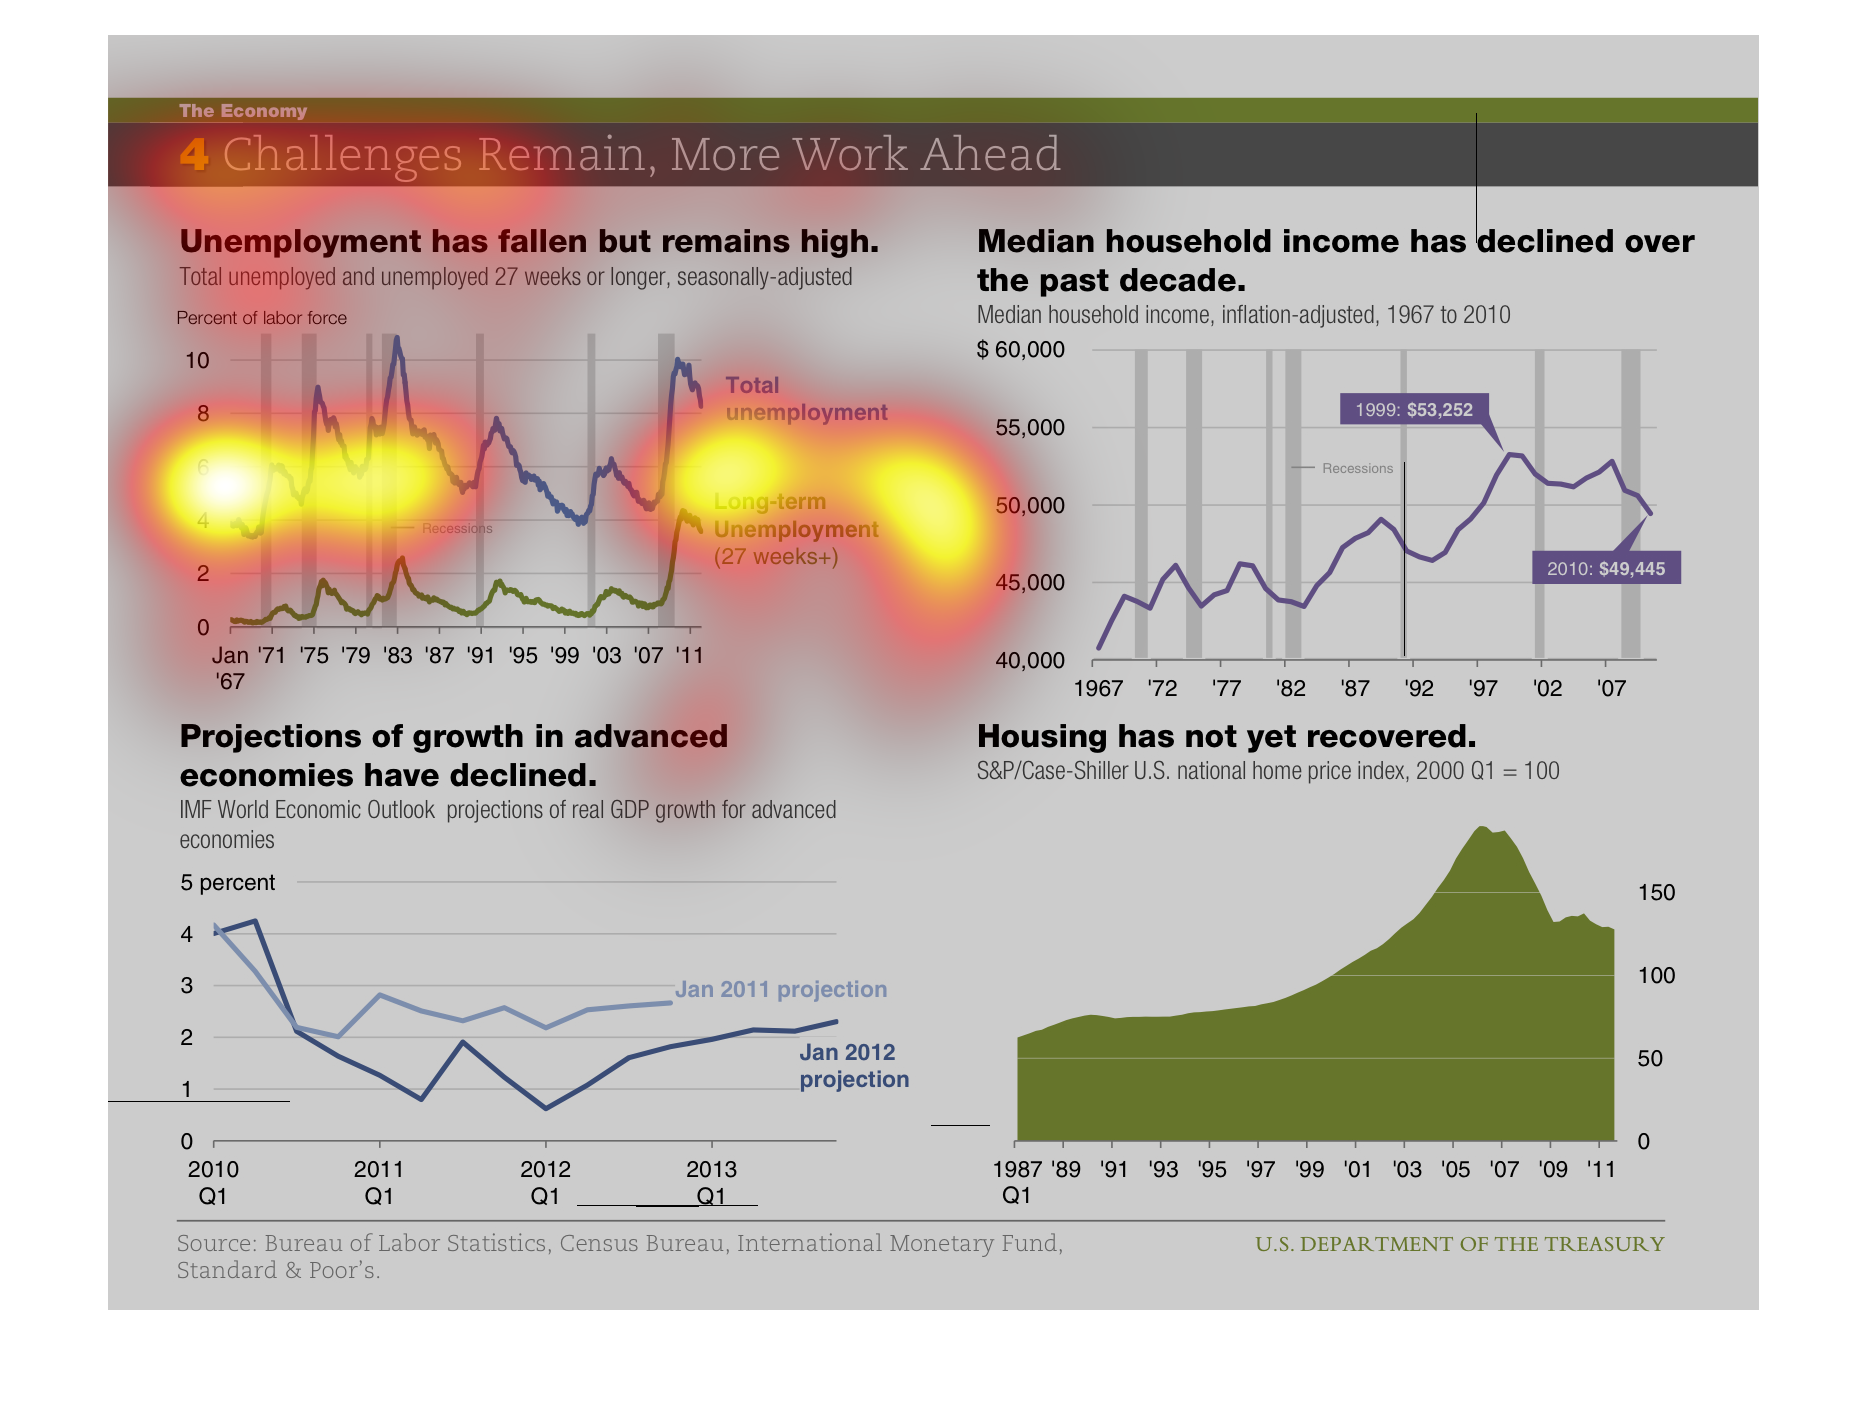
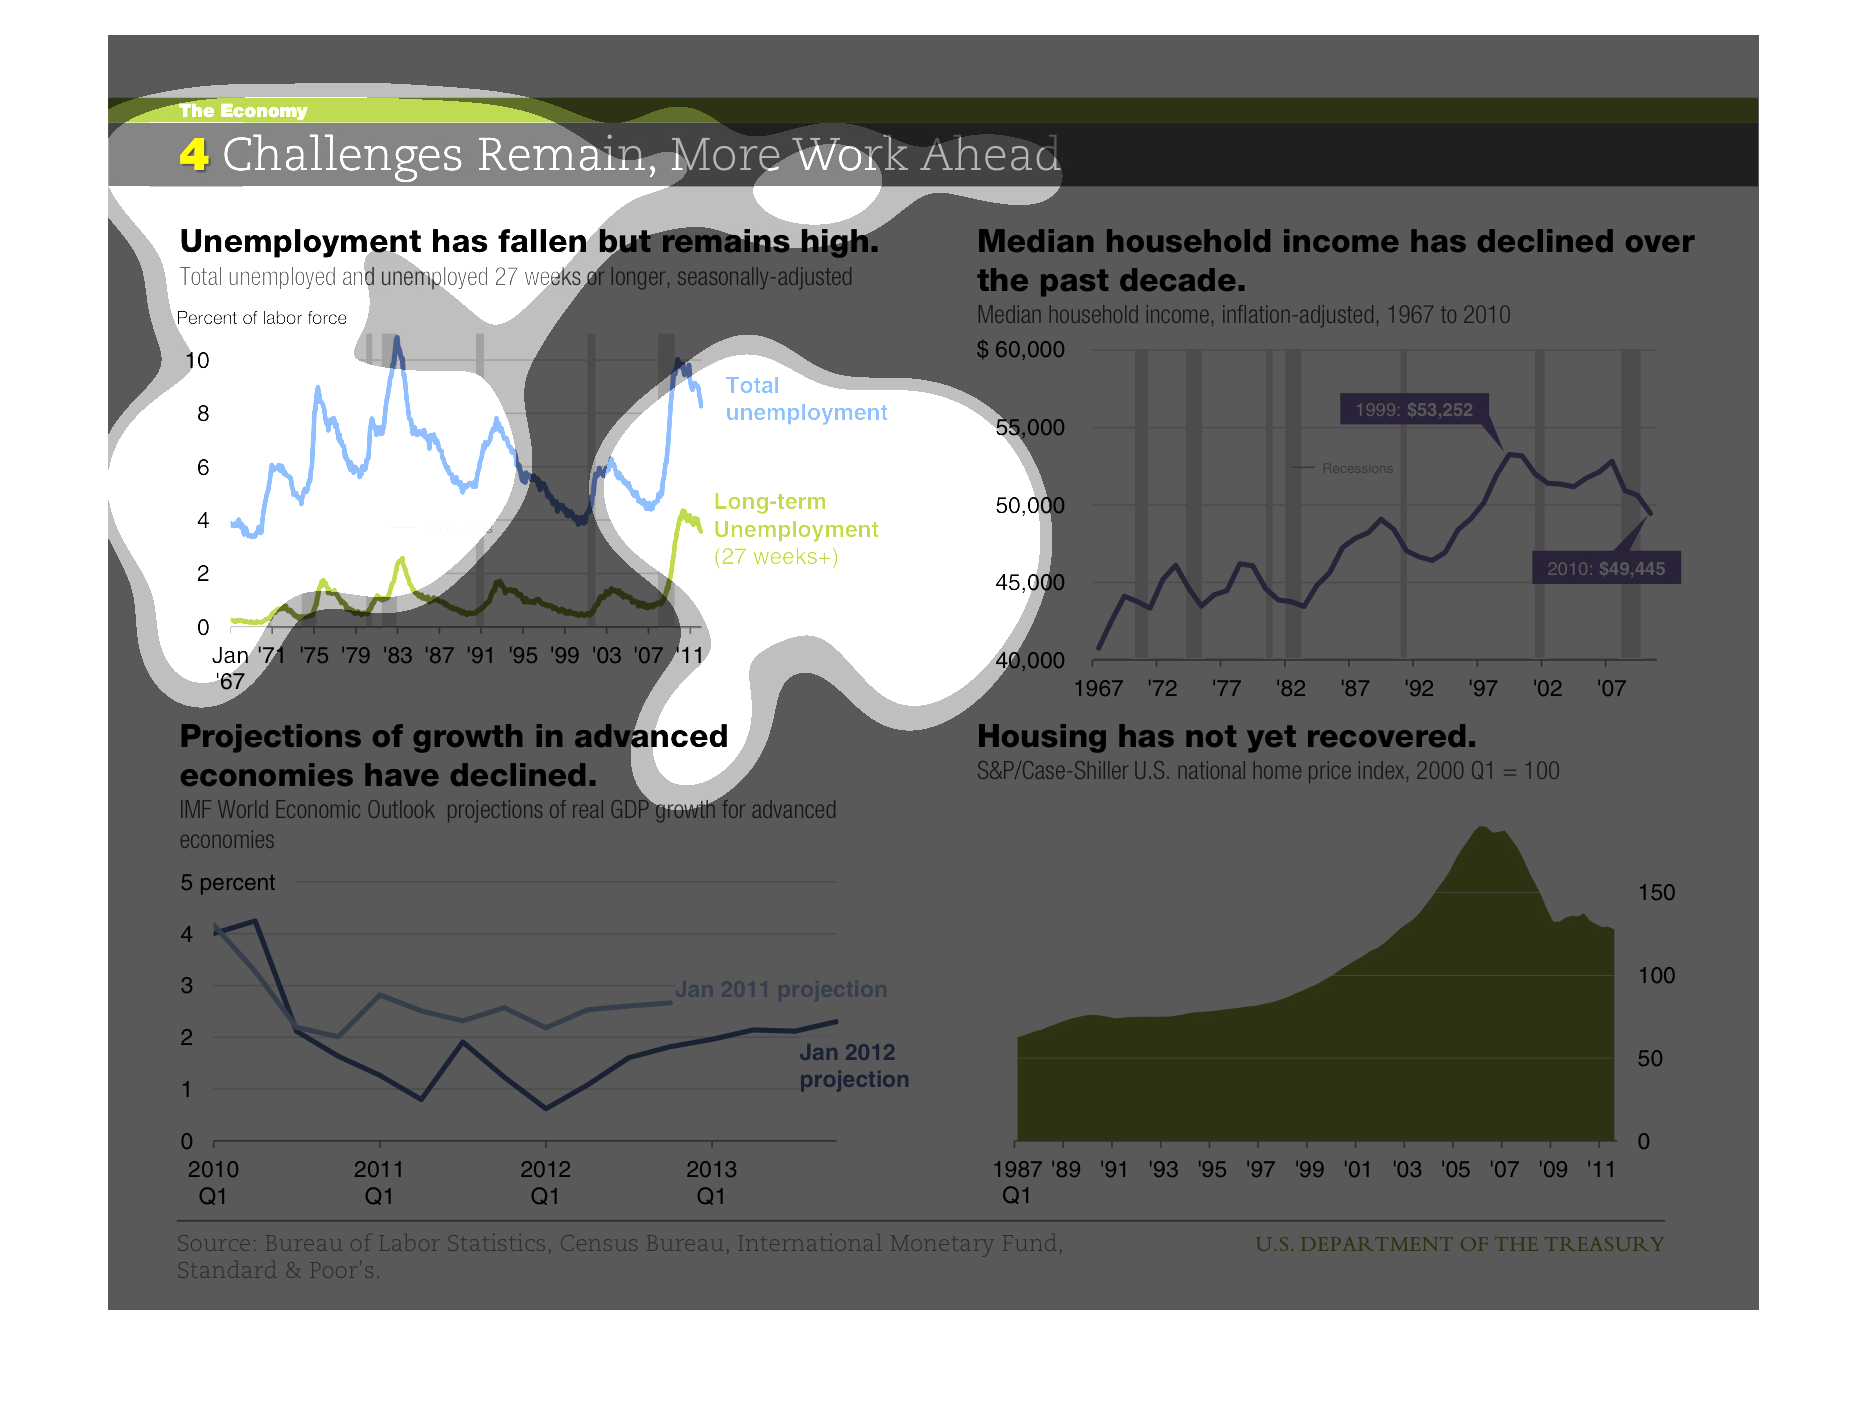
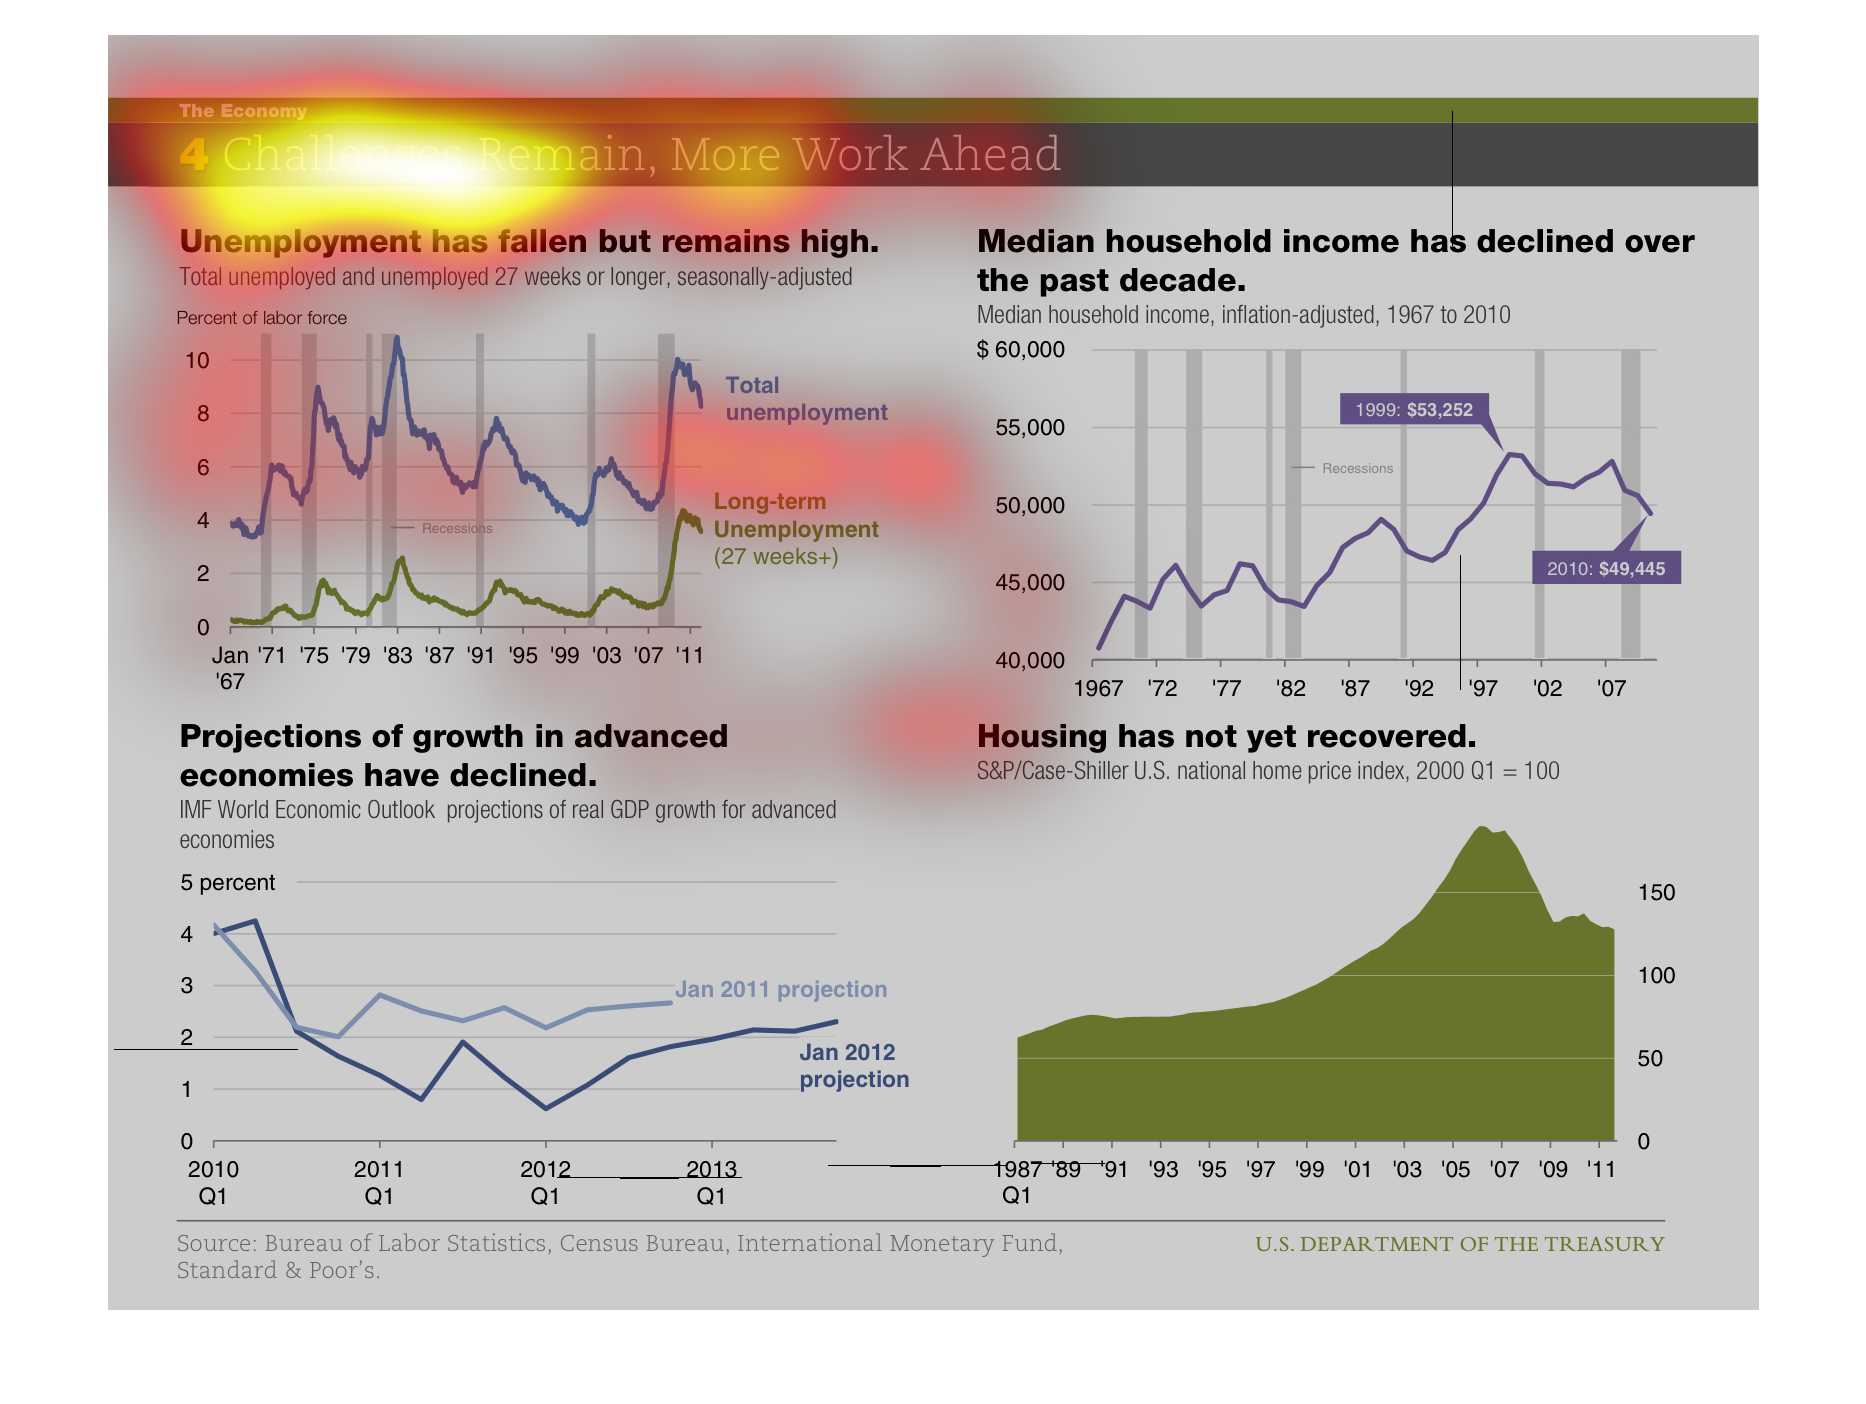
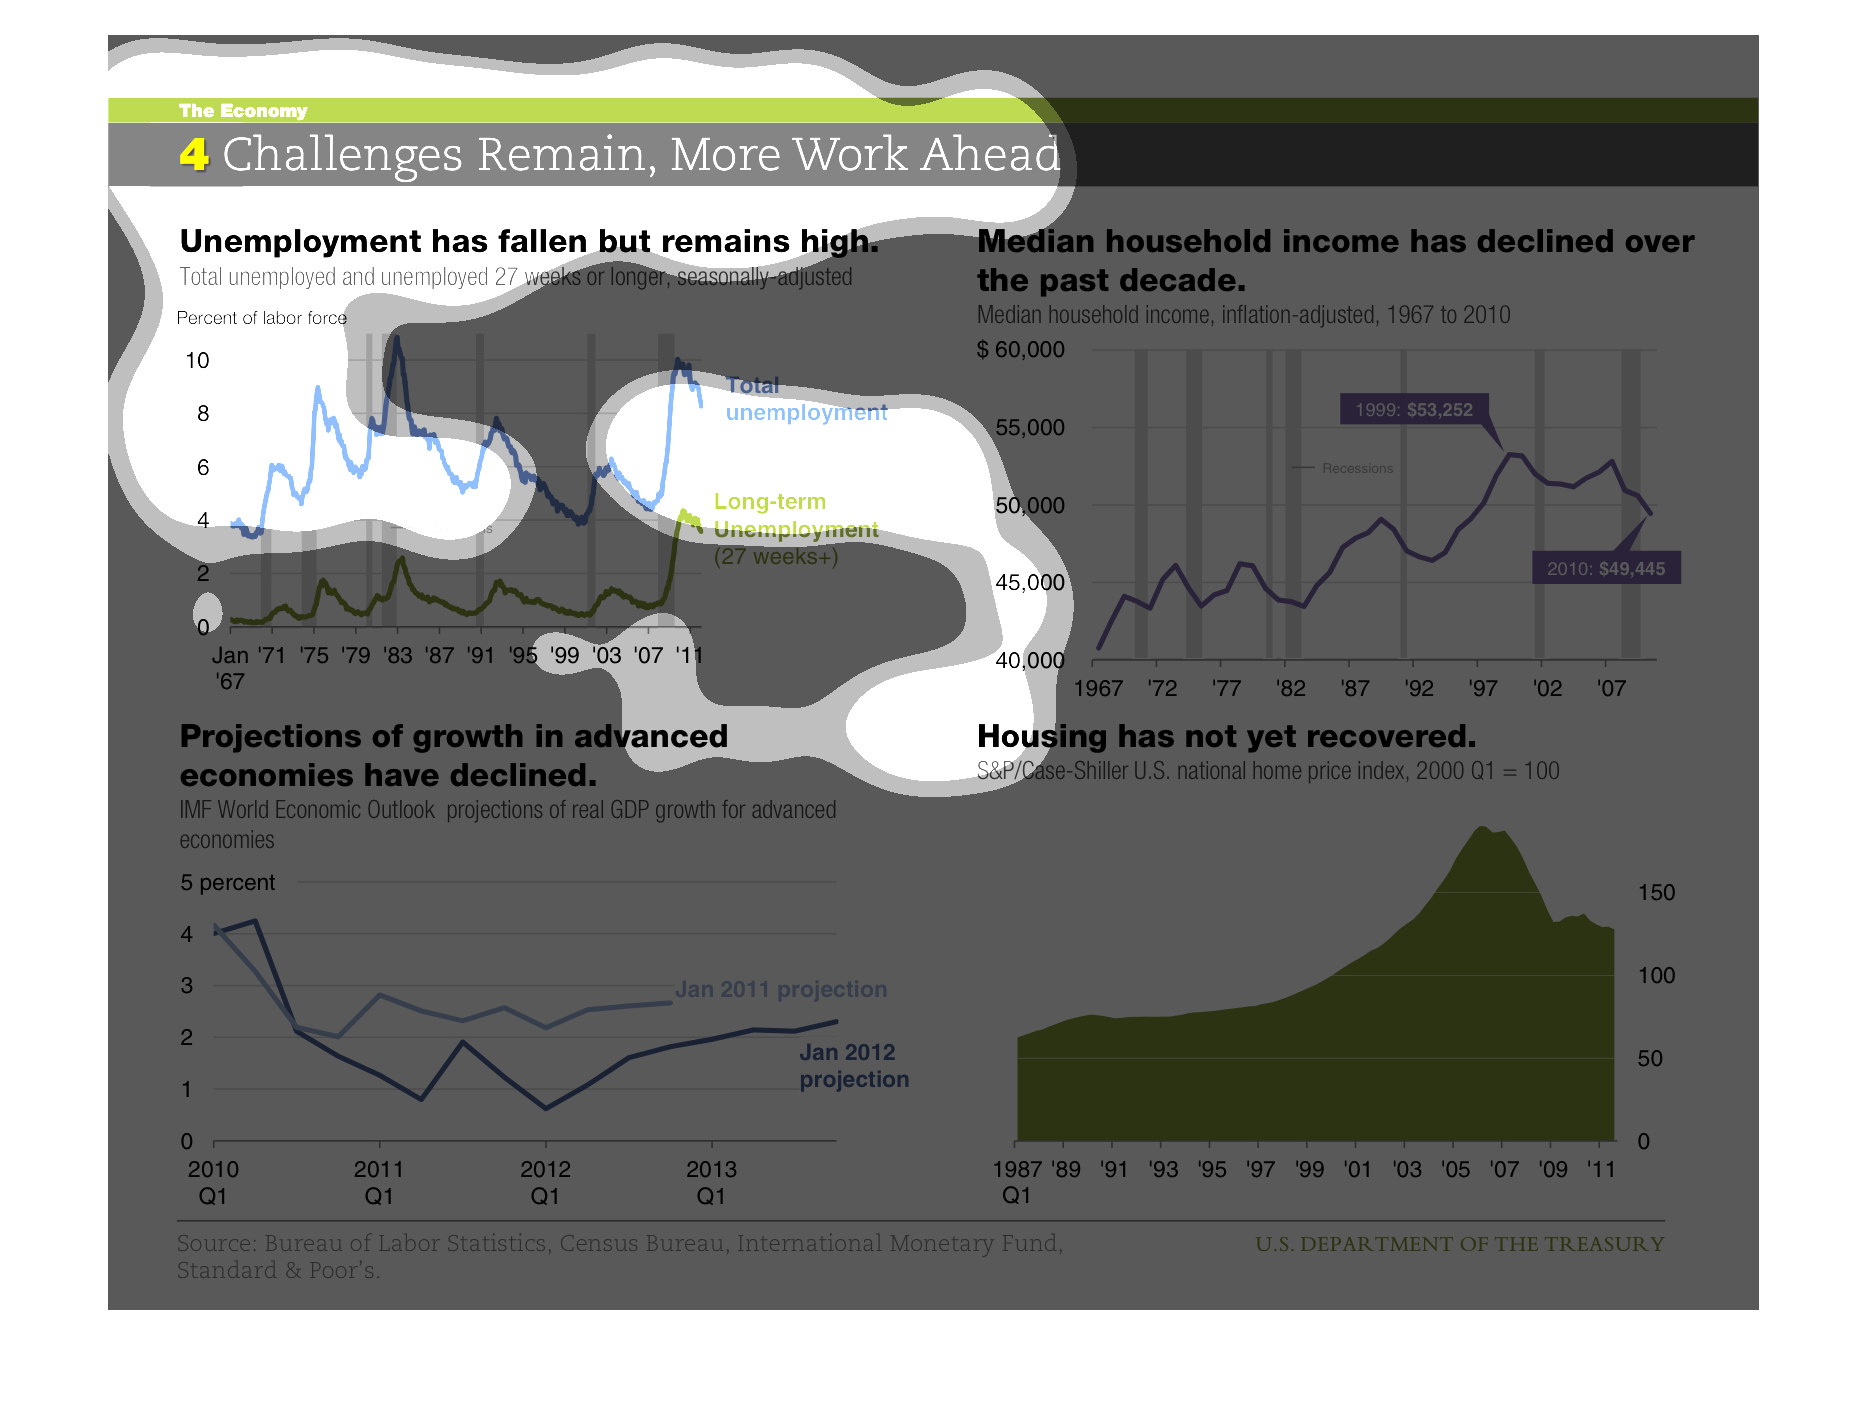
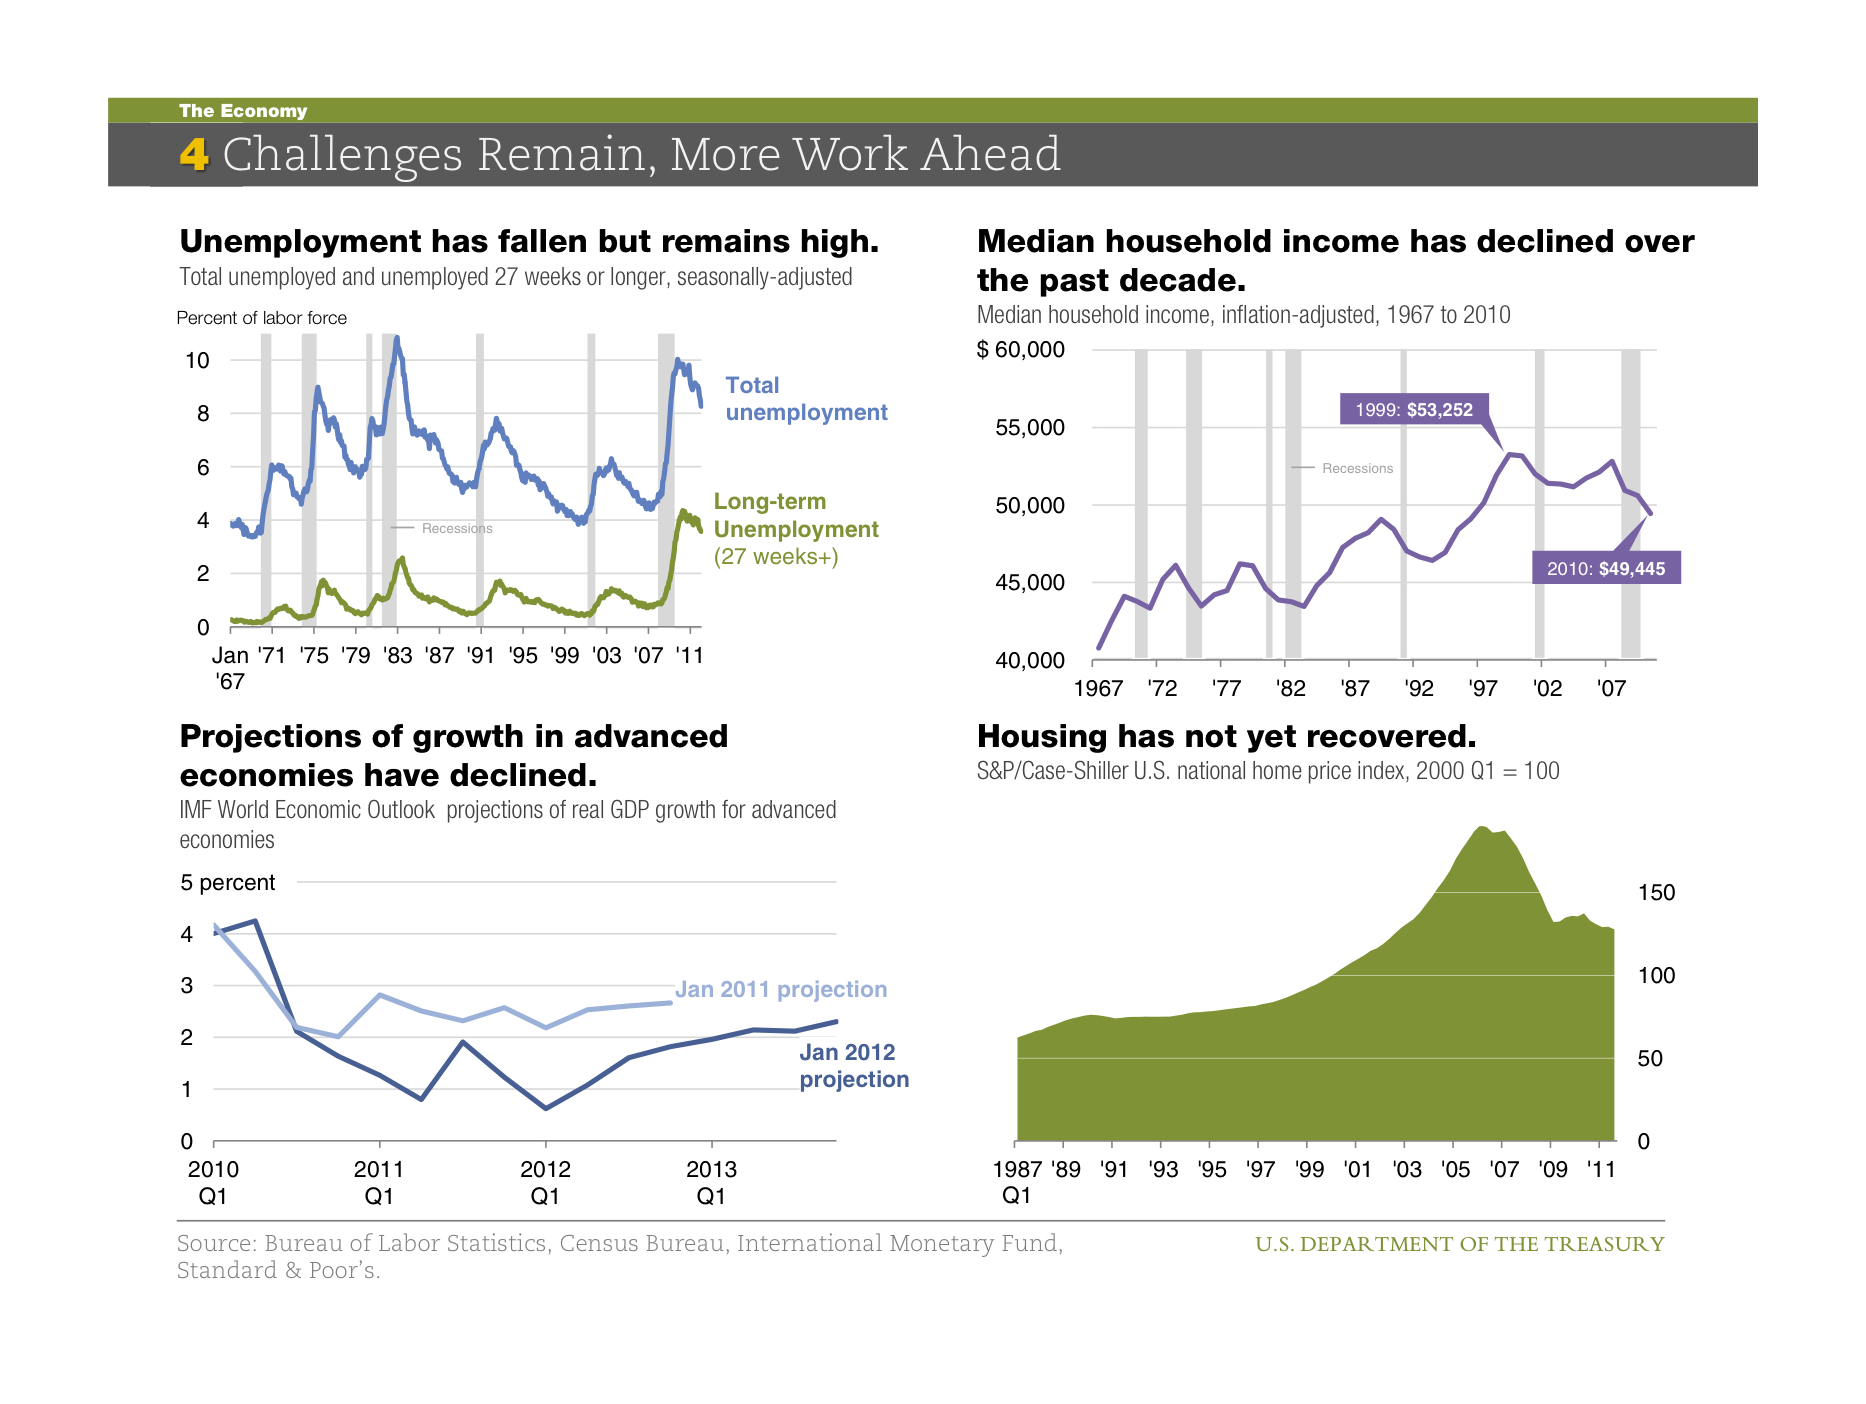
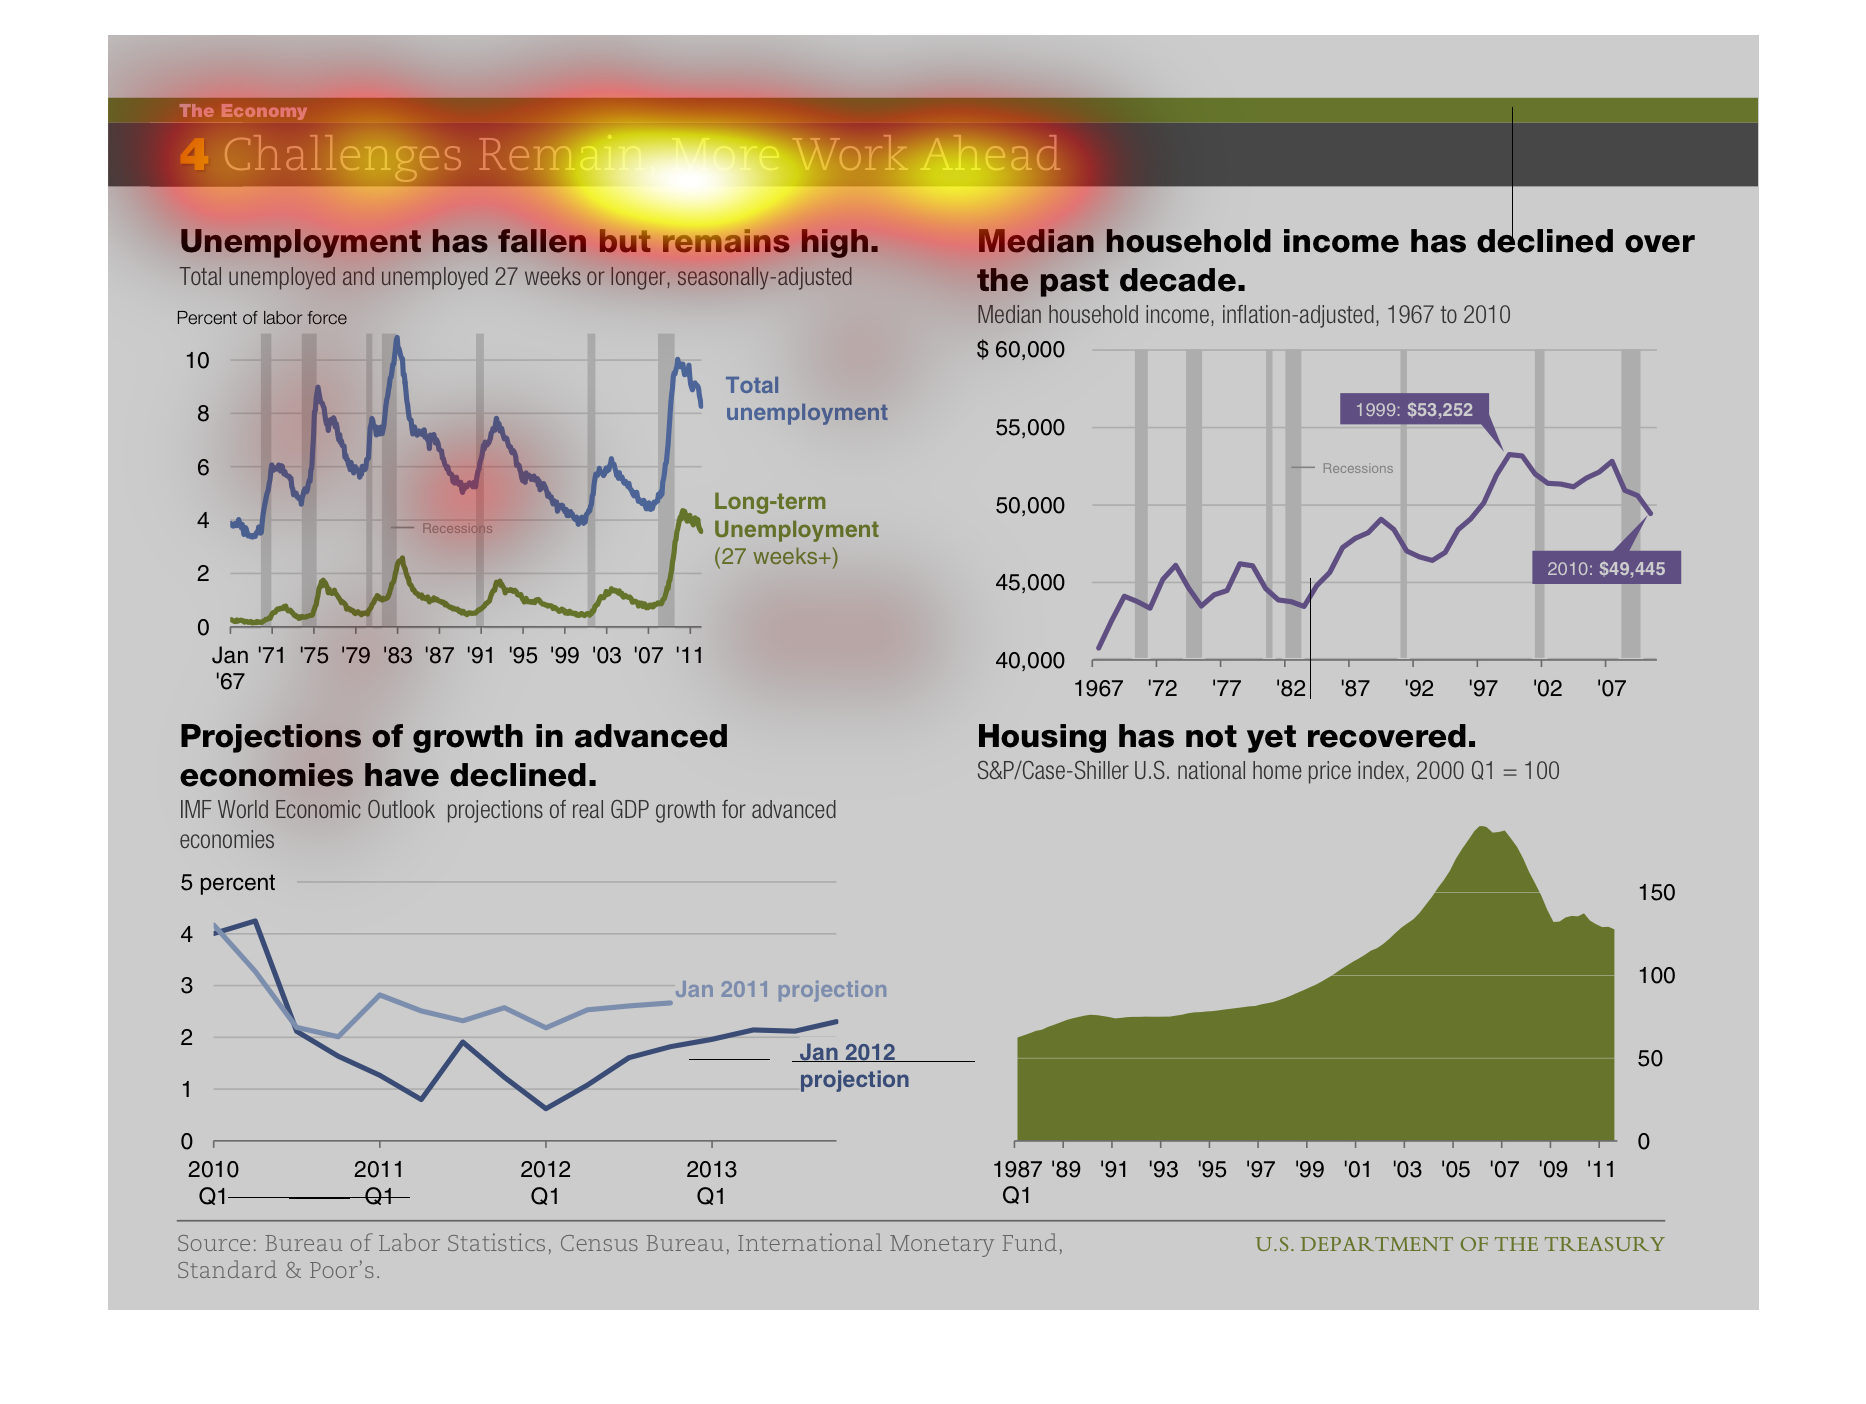
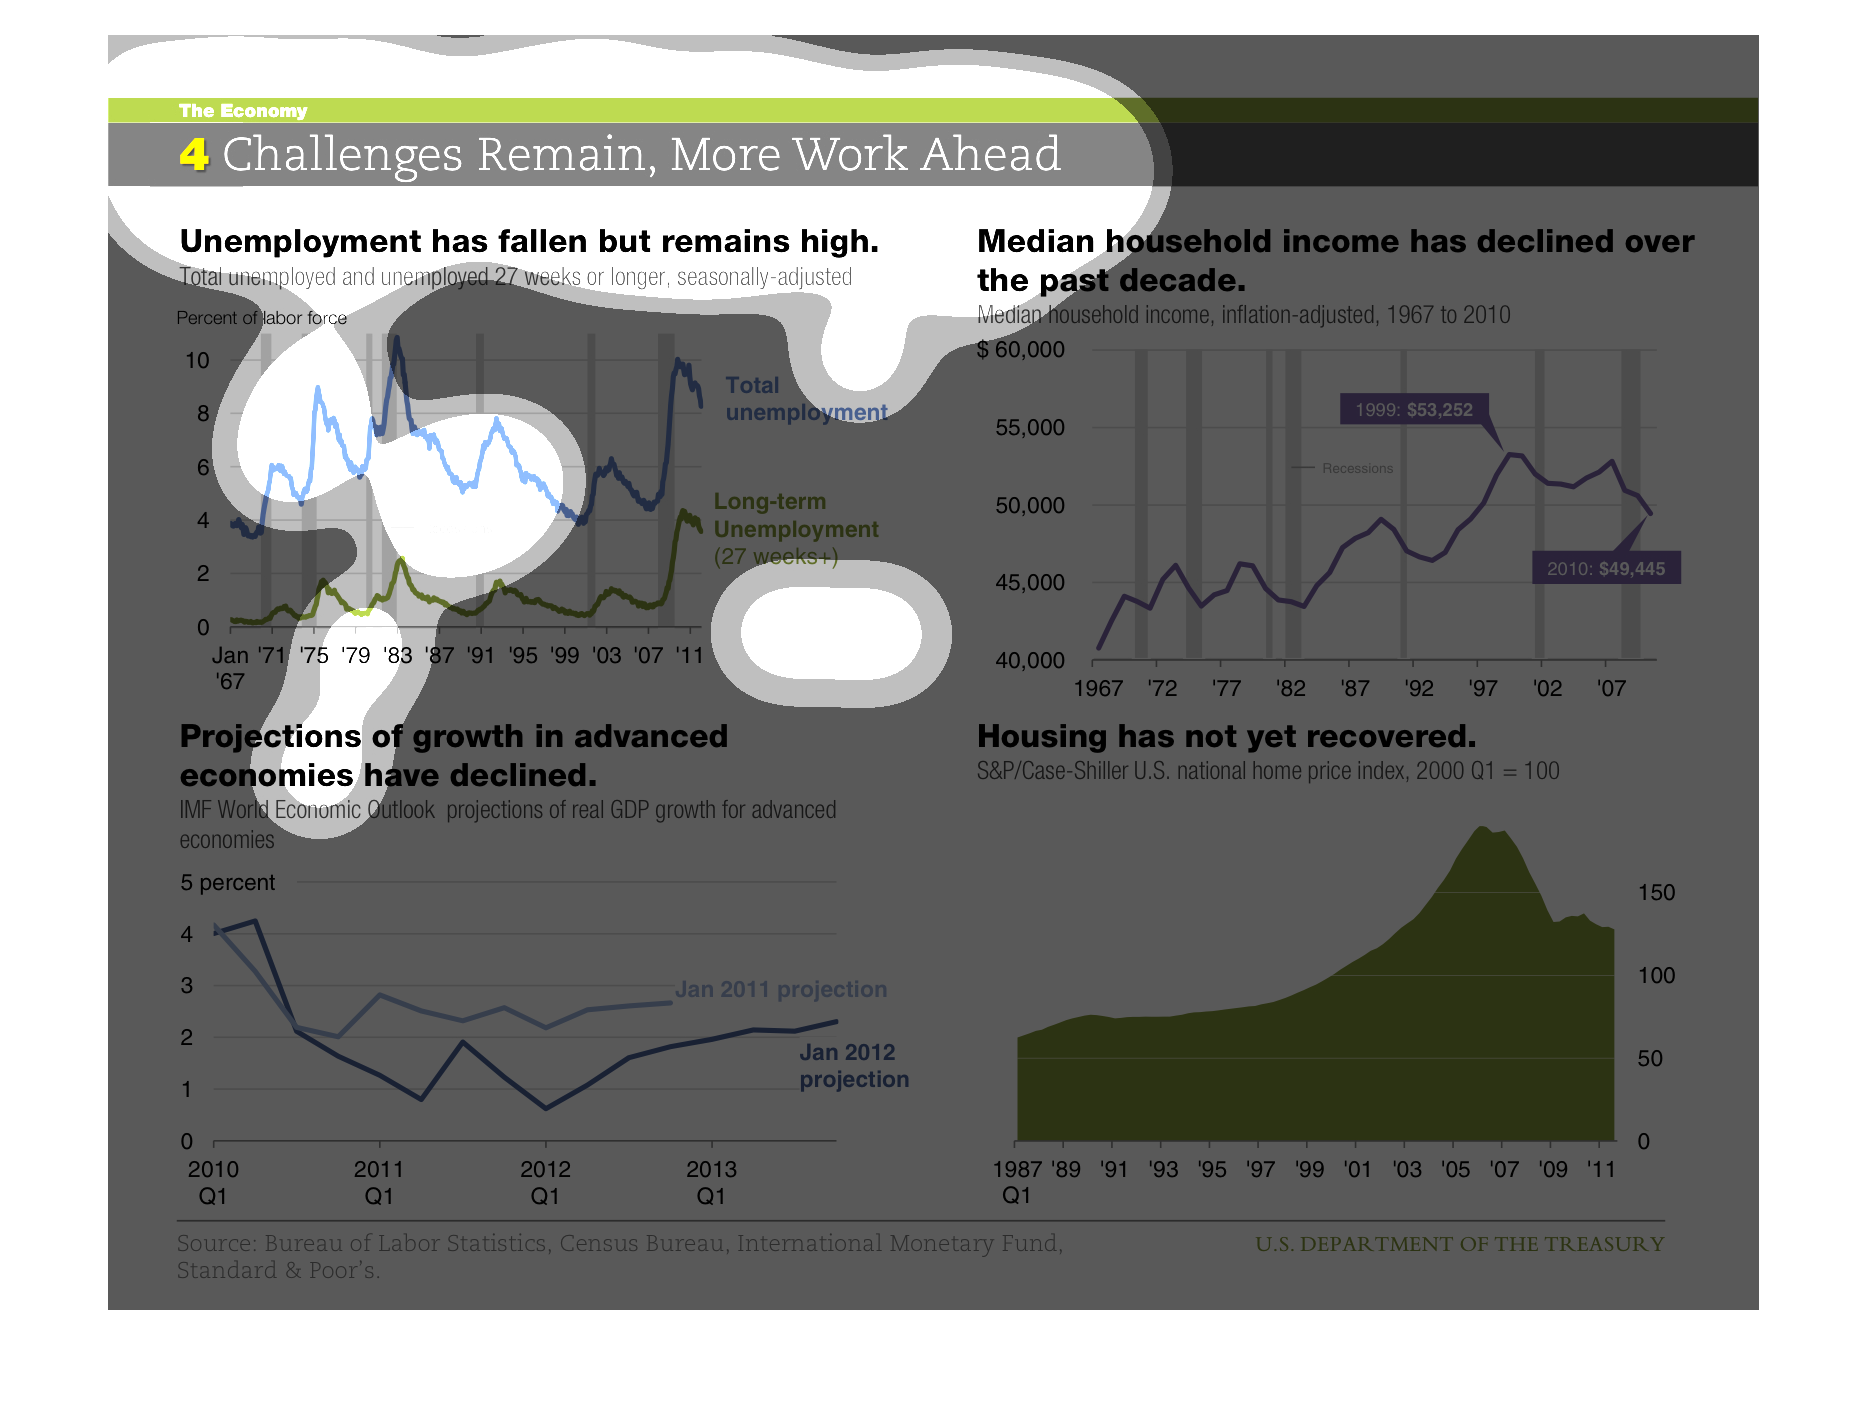
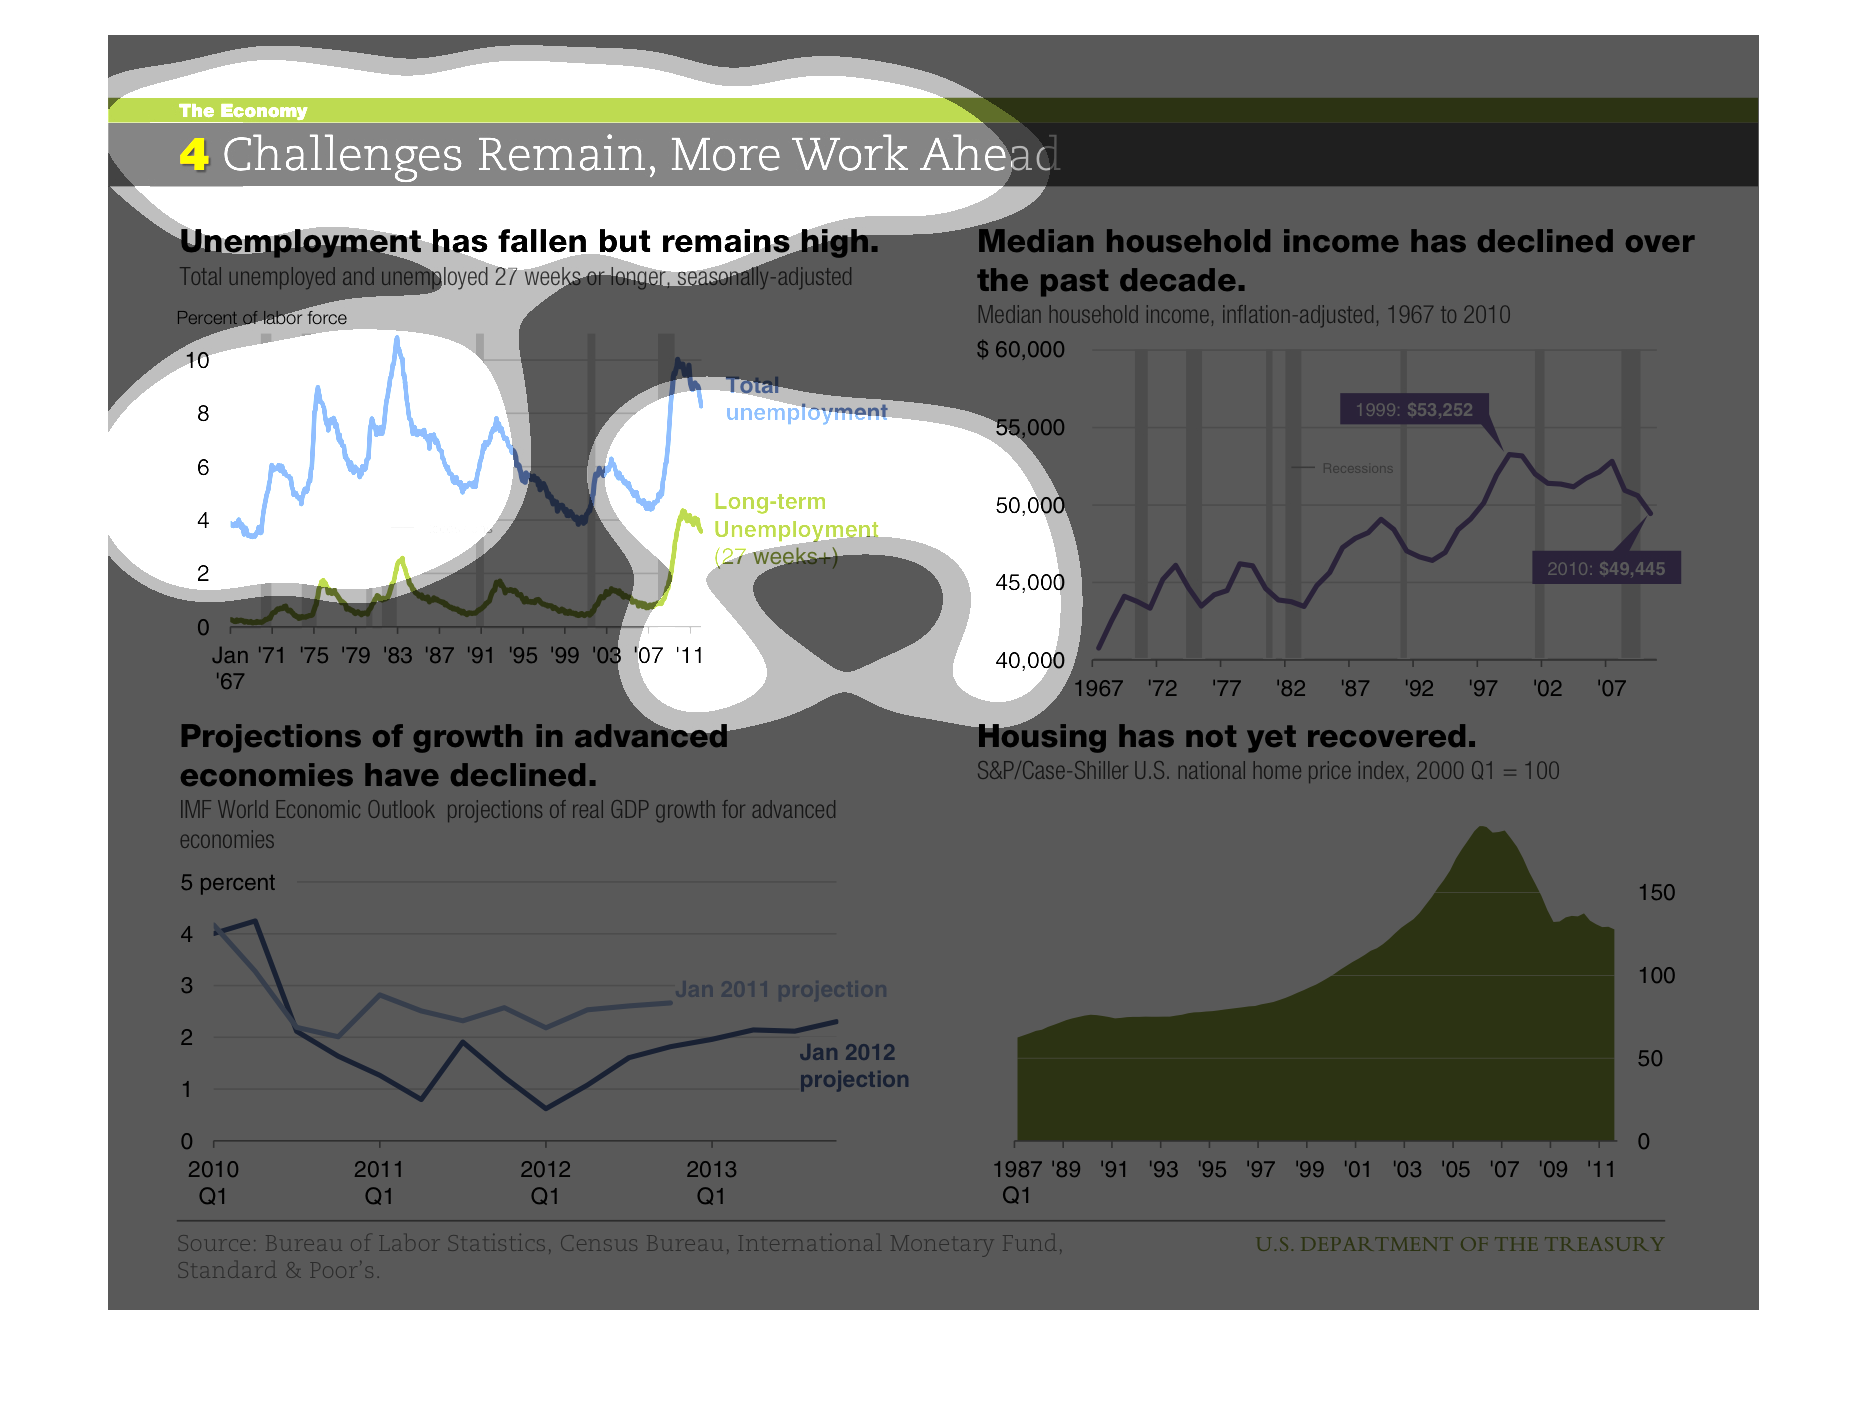
This image shows or depicts in two different graph formats, using statistical line and bar
graphs the relationship of how unemployment has fallen but remains high as well as the median
household income has declined over the past decade.
This is a series of graphs and charts depicting the road ahead in the recovery of the economy
from the financial crises in terms of unemployment, median household income and other metrics.
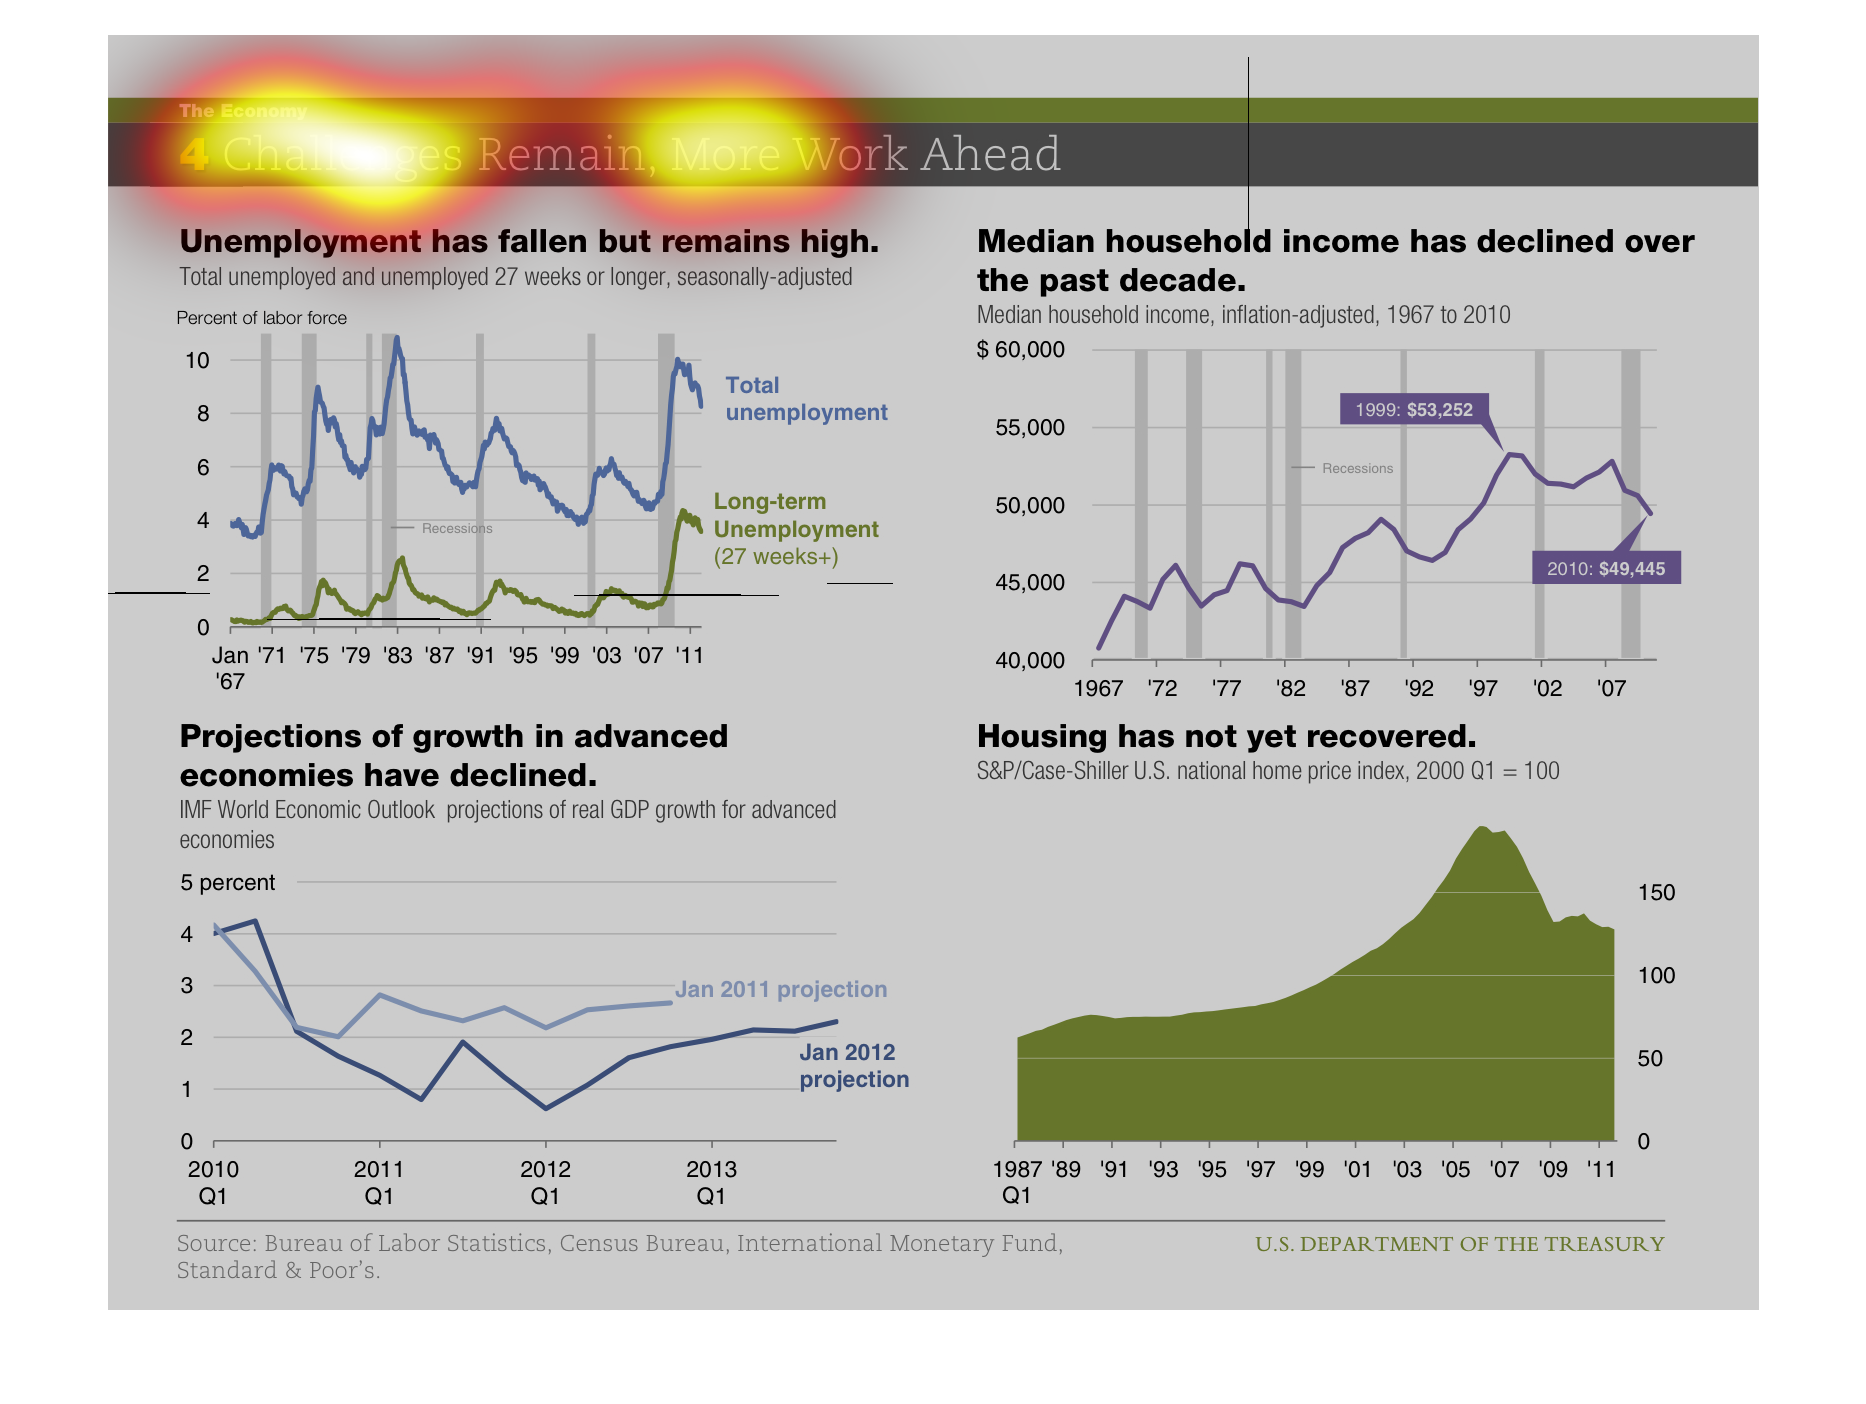
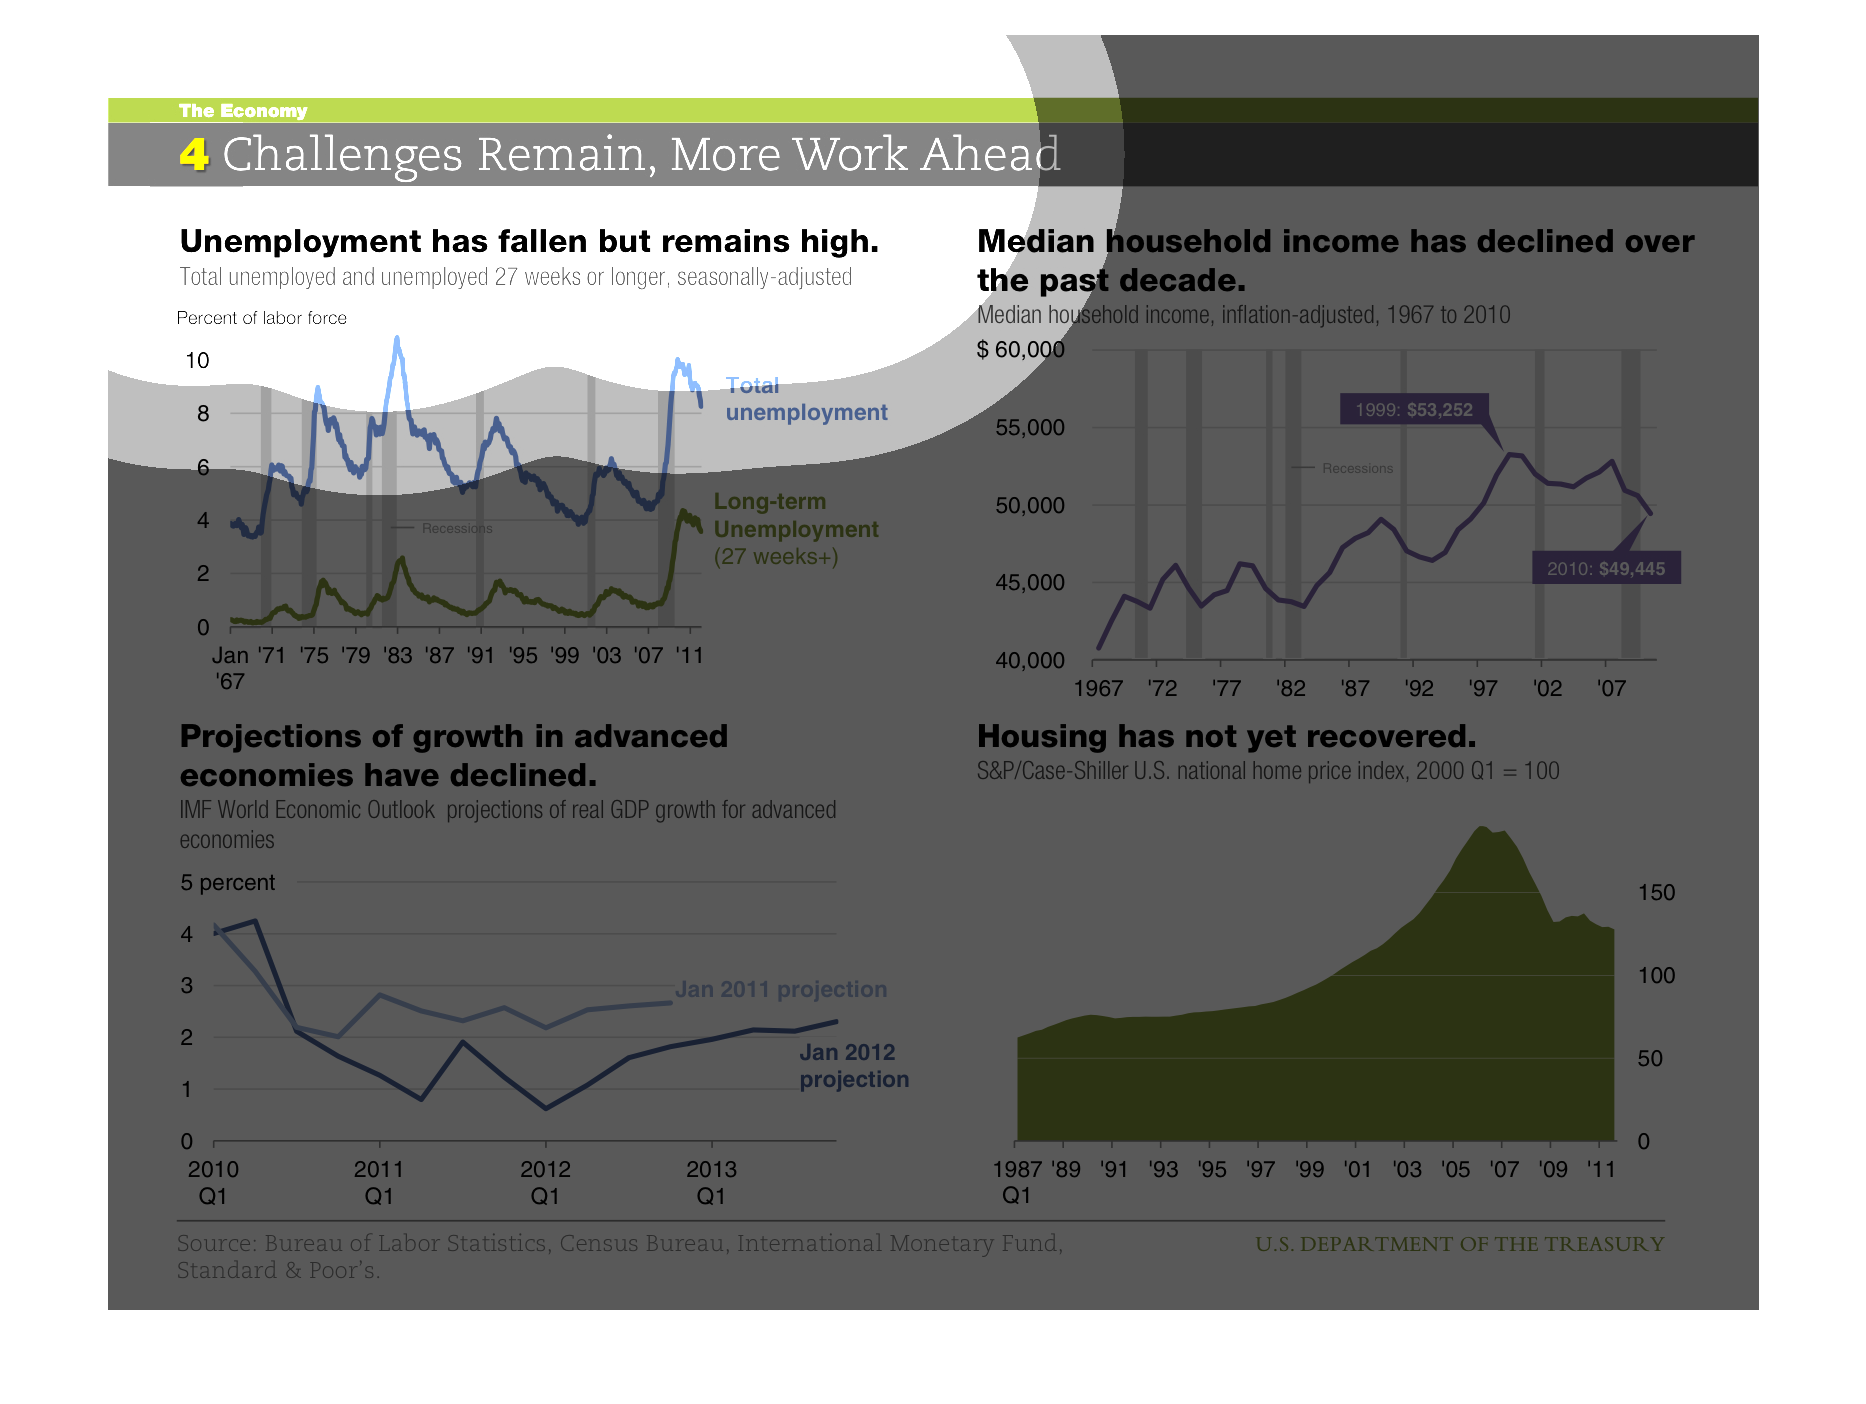
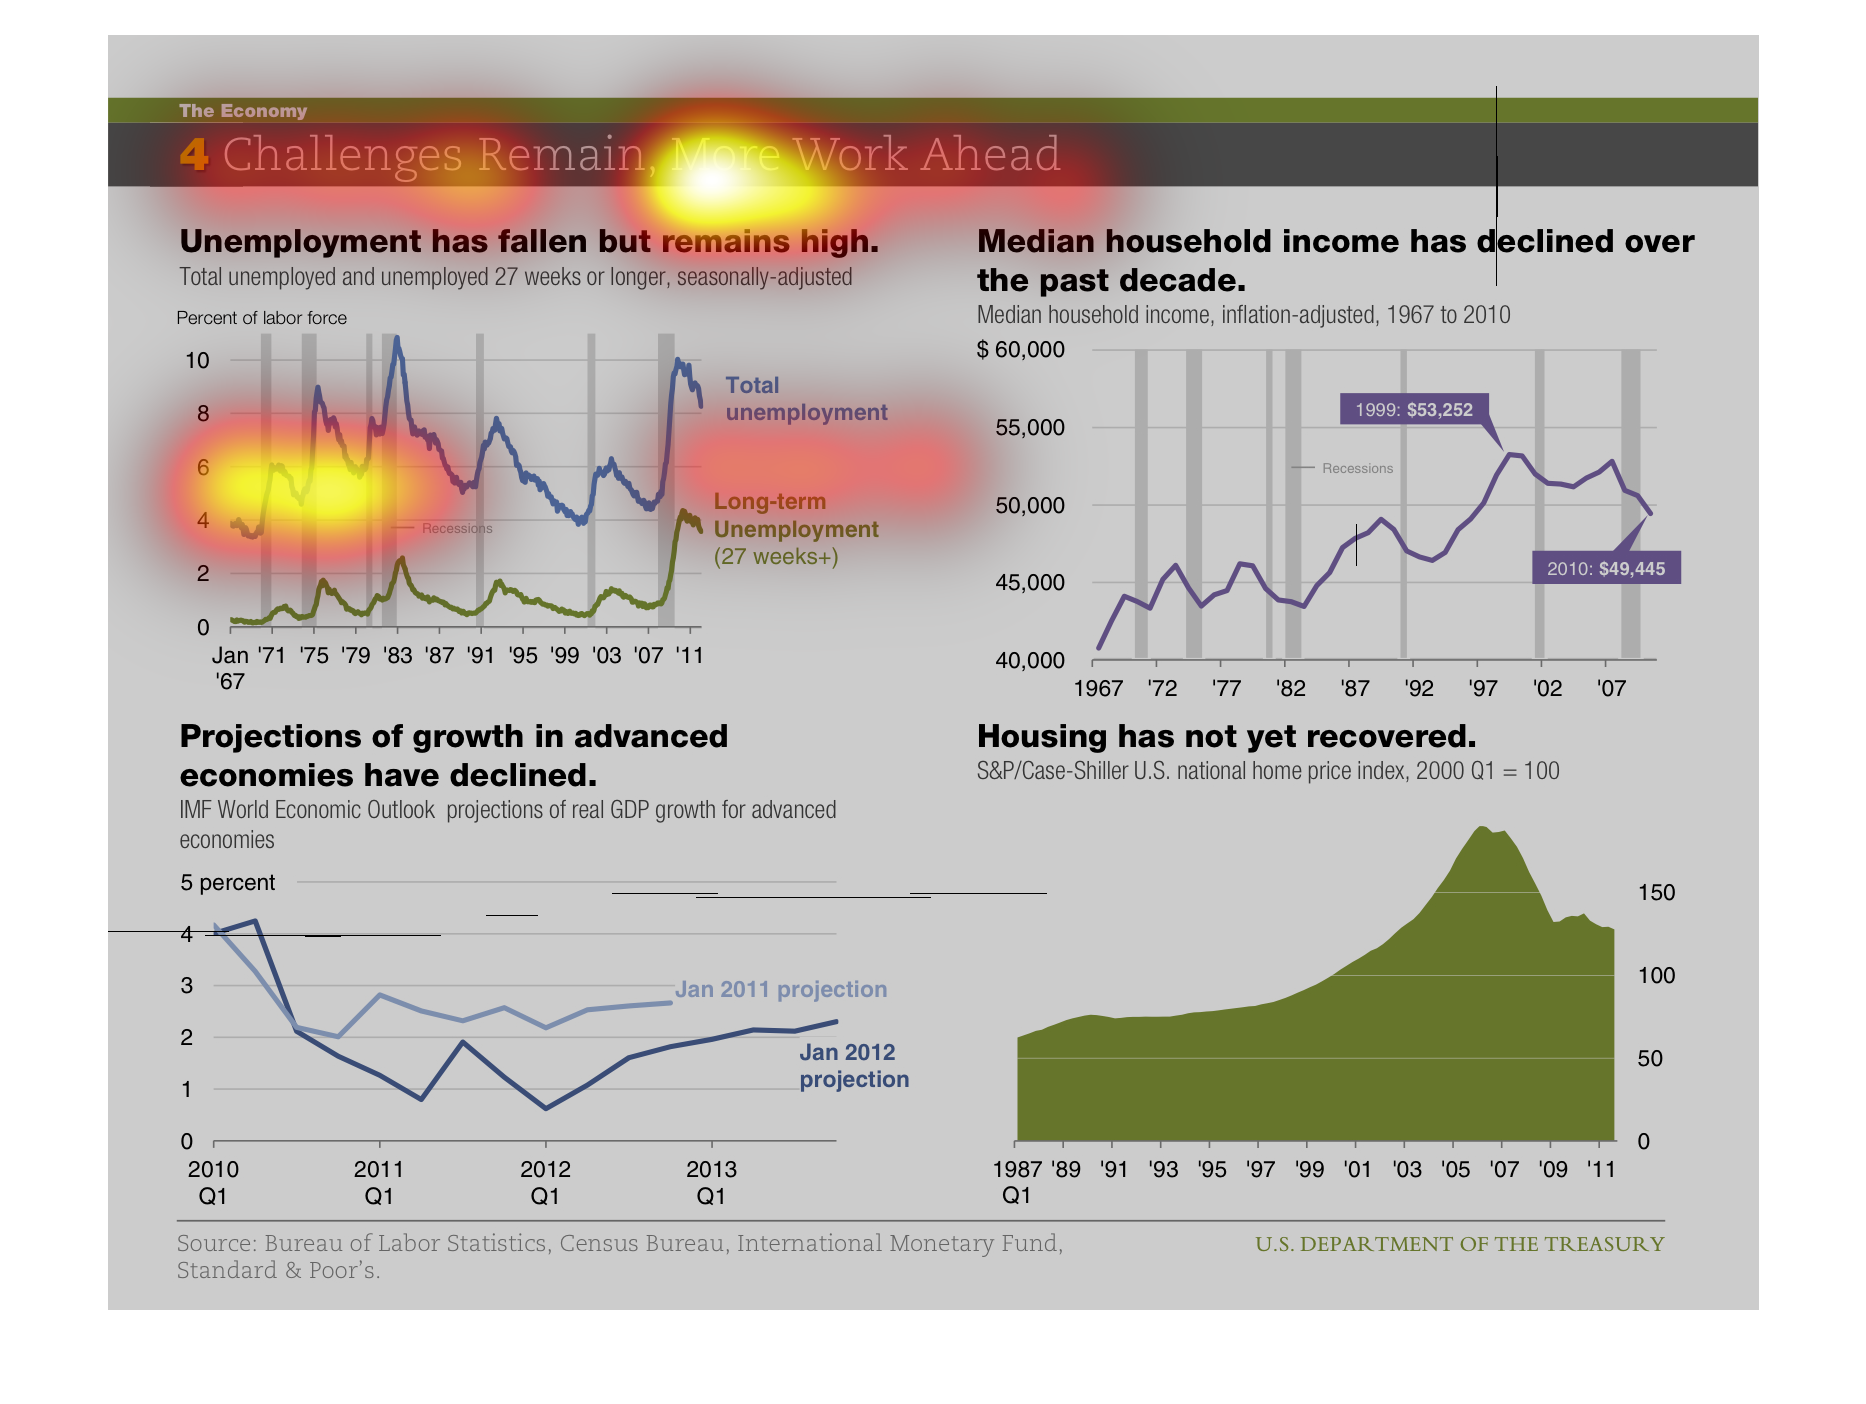
This image describes four economic problems that remain. Unemployment has gone down but it
is still high. Median household income has gone down over the past decade. Housing has not
yet recovered and projected growth rates have fallen.
An infographic displaying four graphs dealing with the housing market. The first graph shows
a drop in unemployment but still high unemployment rates. A second graph shows a decline in
the median household income over the past decade. The third graph shows a projected decline
in advanced economies. And a fourth graph shows that housing has not yet recovered.
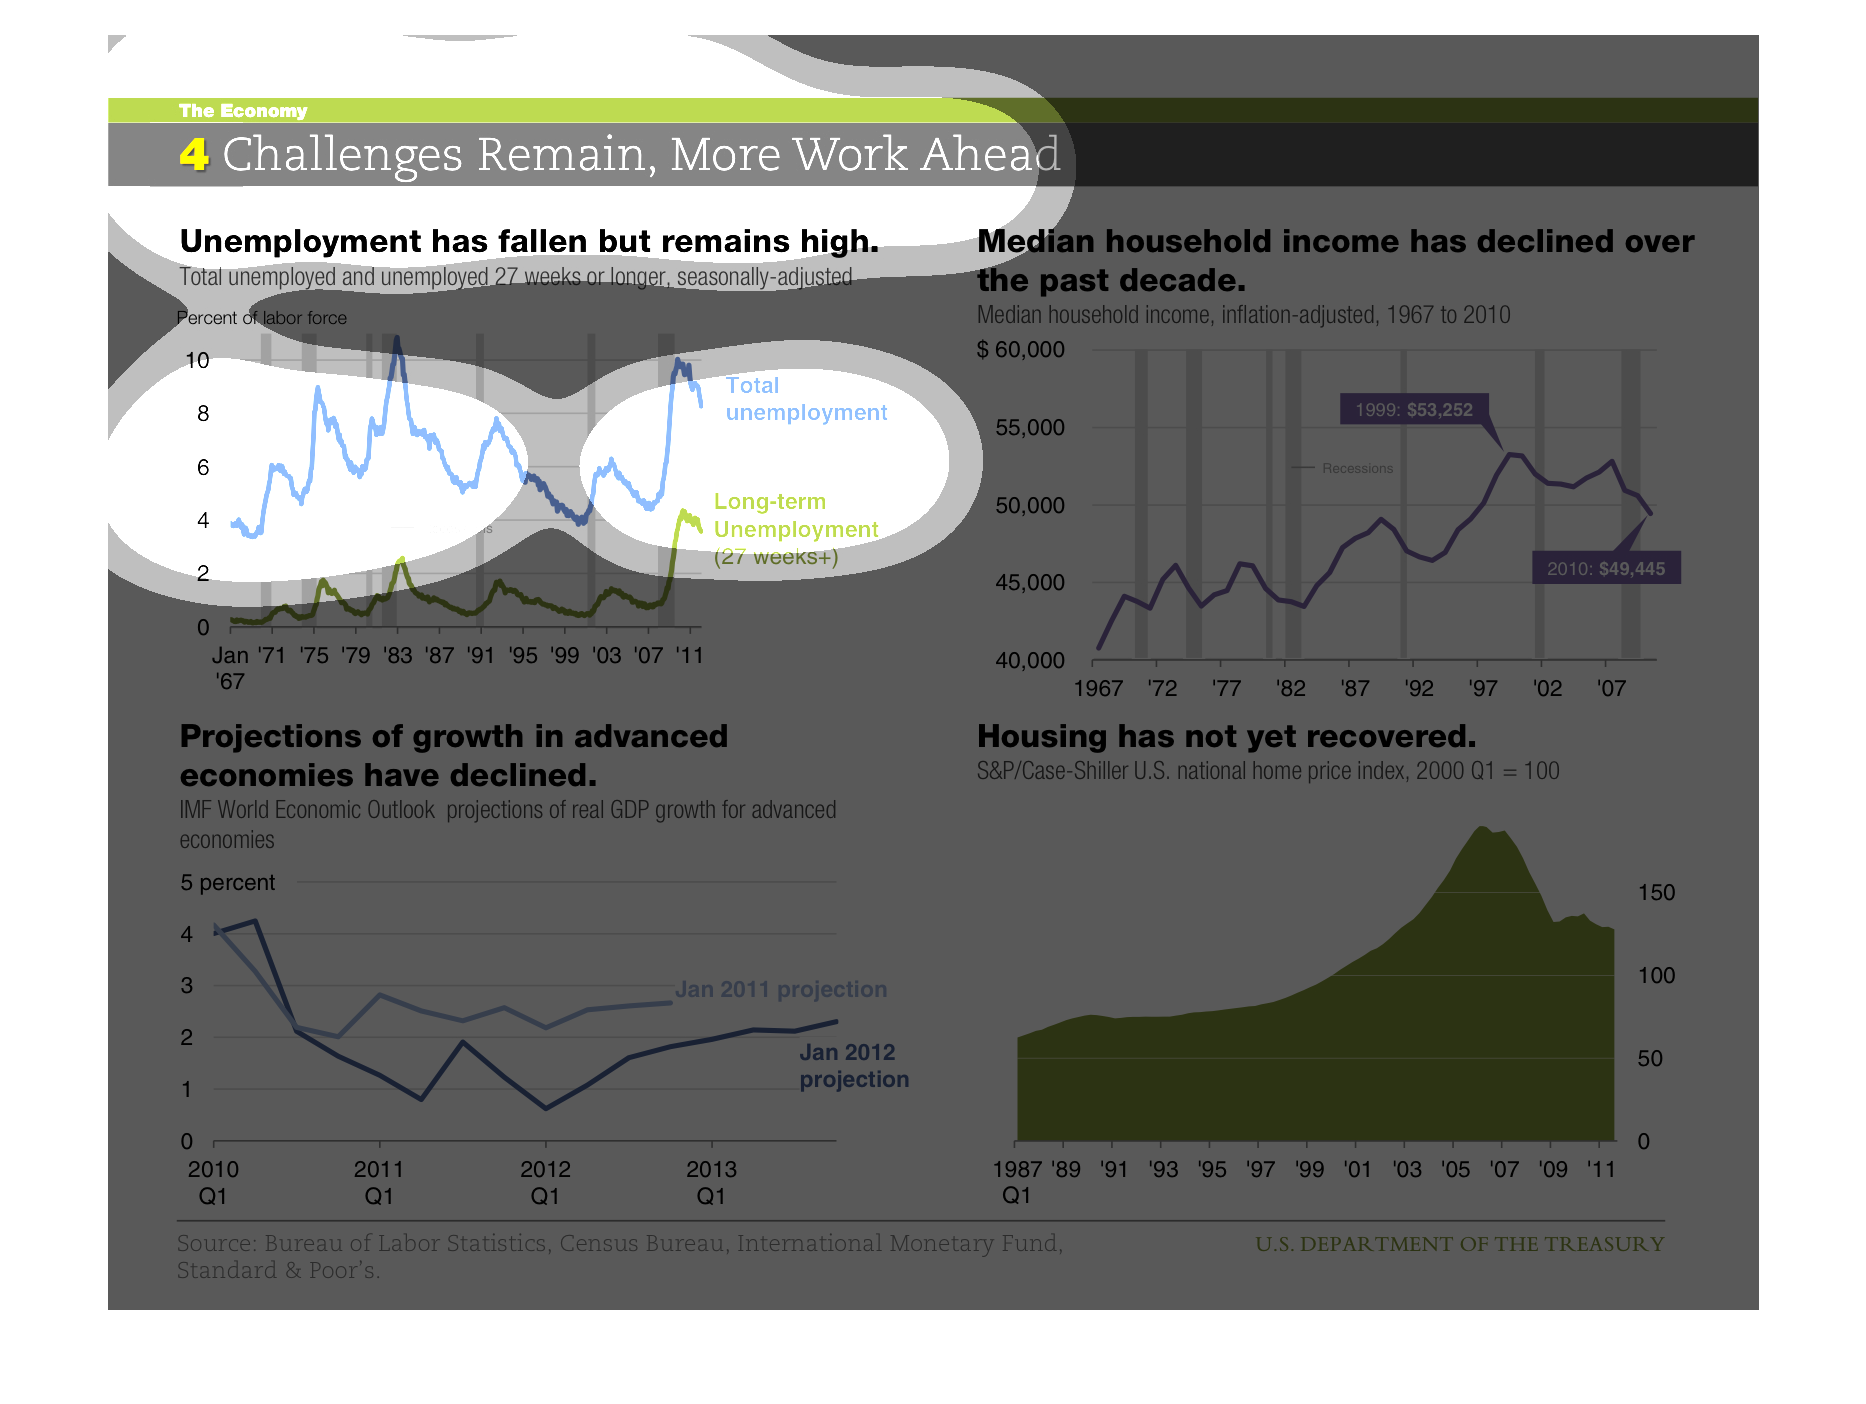
This image describes unemployment figures.  Housing prices have not recovered.  Growth projections
are not good.  Median household income is declining over the decade.
The title of this chart is 4 challenges remain, more work ahead. Below that on the left side
it says Unemployment has fallen, but remains high. On the right side it says, Median household
income has declined over the past decade.
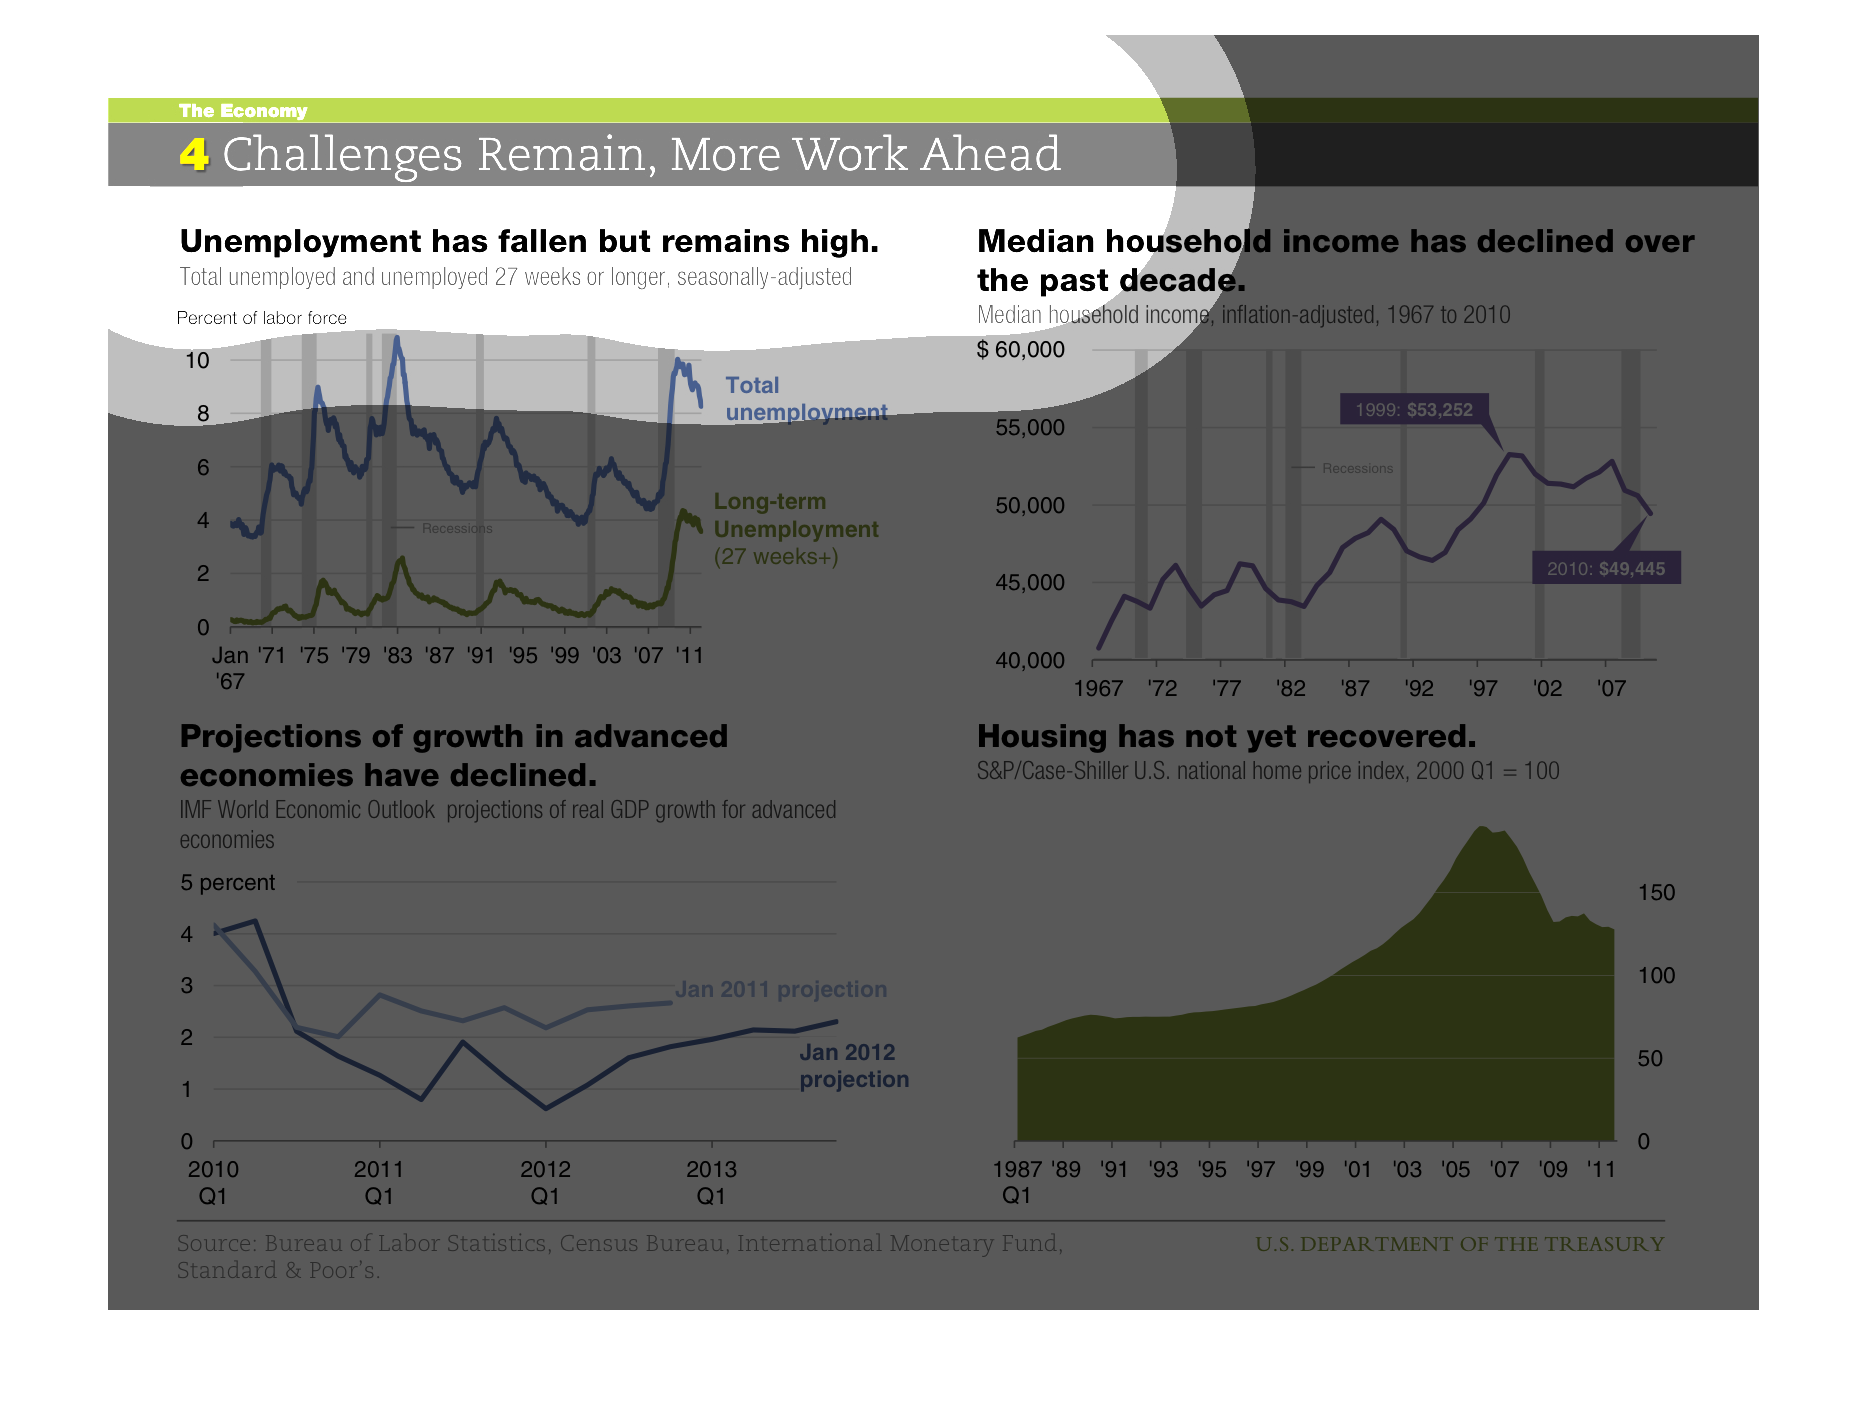
This image describes four common statistics to assess the performance of the economy. Overall,
the chart shows unemployment is down but remains high historically, household income has gone
down over the past 10 years, projections of future growth have declined, and the housing market
has not yet recovered.
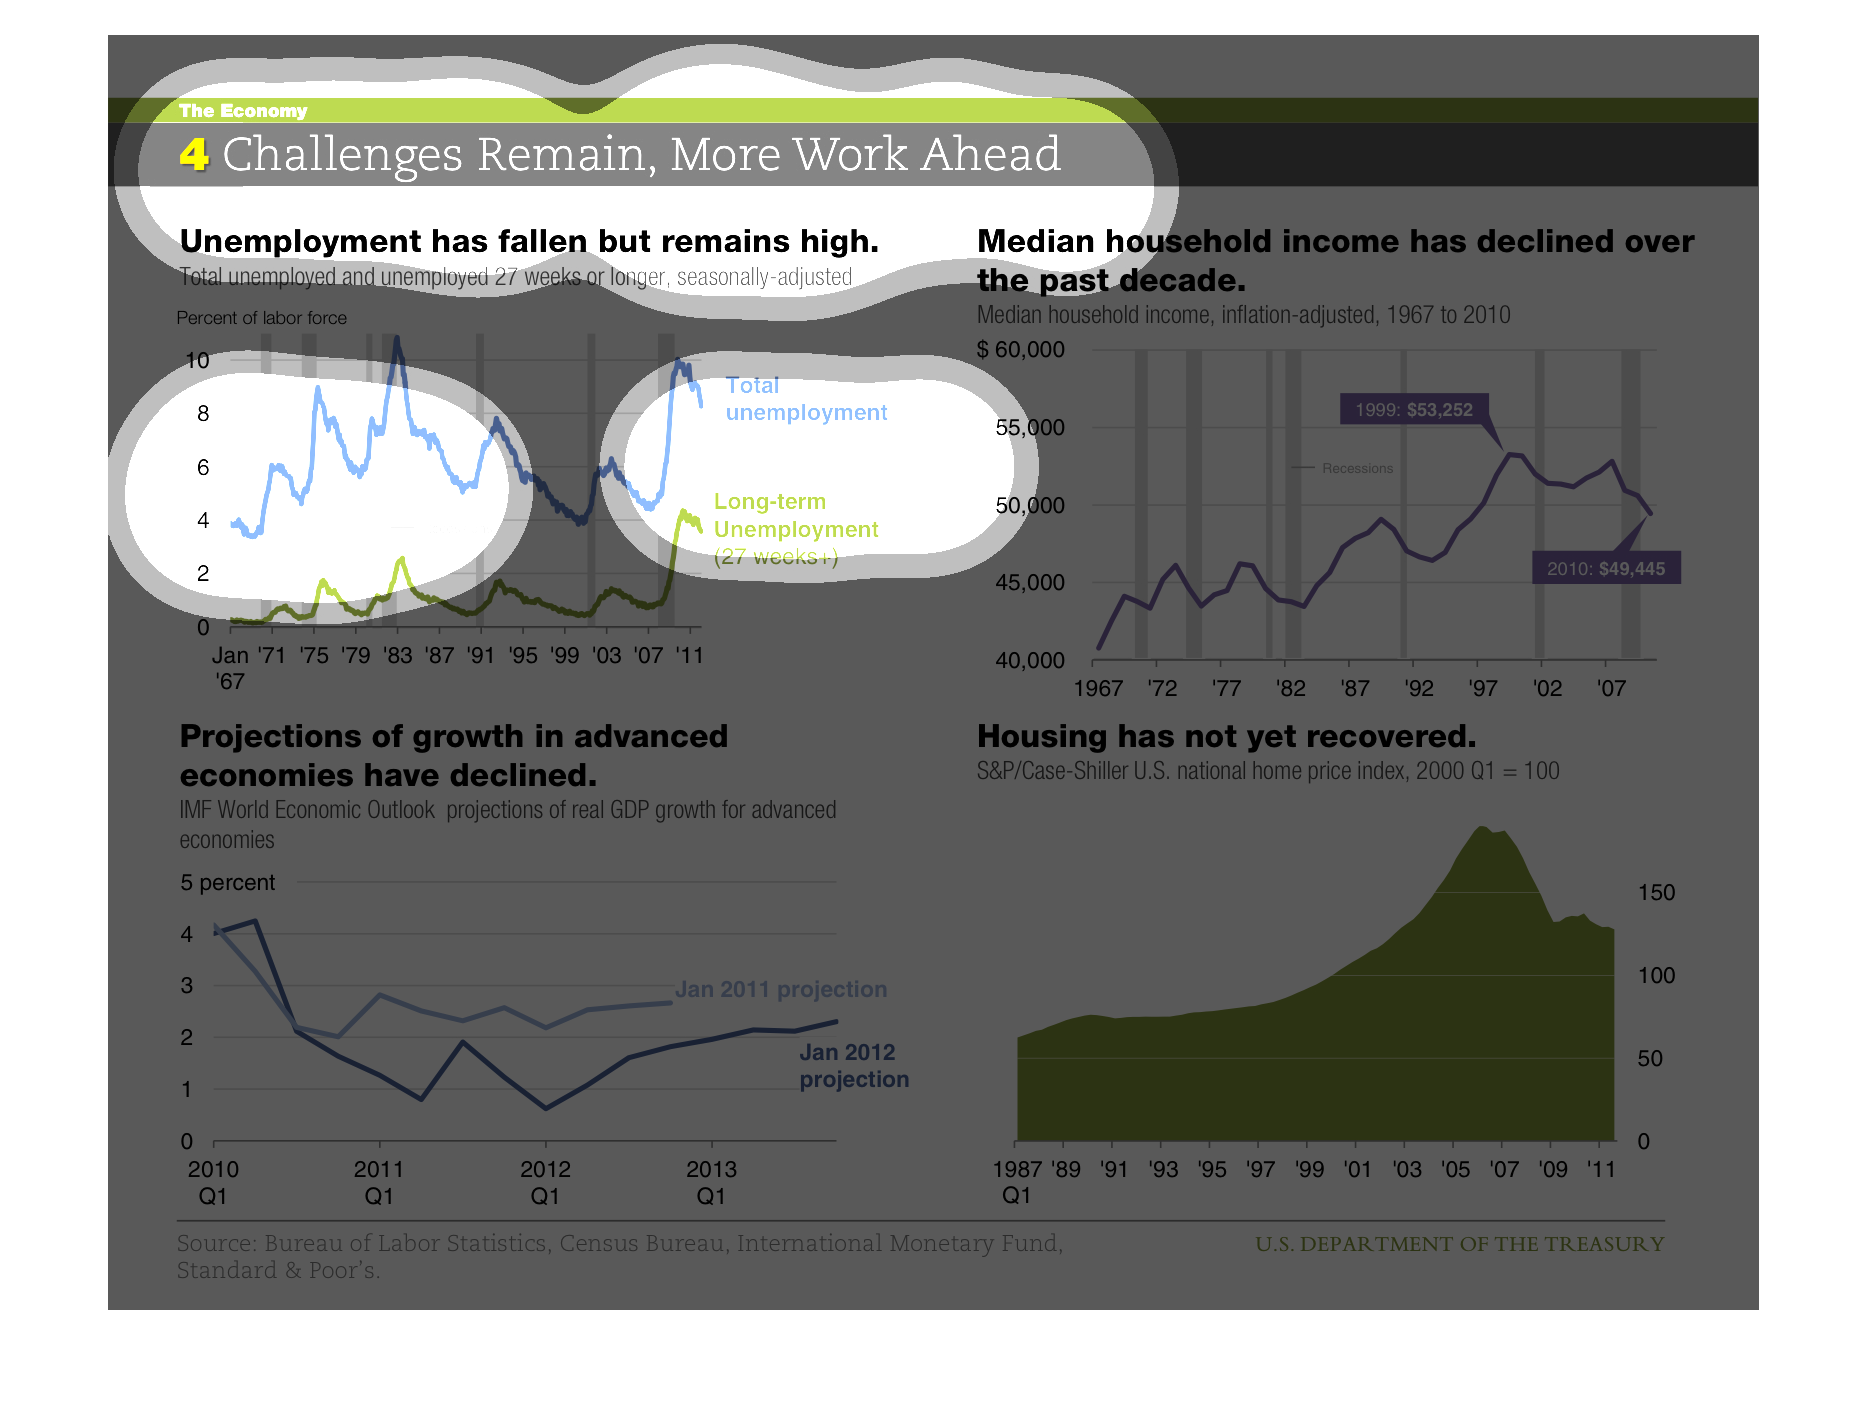
This series of graphs shows the challenges facing the economy. We have a trending line of
the drop but still high rate of unemployment, household income declining, lowering of the
projection of the world economy gains, and a graph of housing prices, which still hasnt recovered
The top left graph shows unemployment has fallen but remain high.  The top right shows median
household income has declined over the past decade.  The bottom left shows projections of
growth in advanced economies has declined.  The bottom right shows housing has not yet recovered.
This chart describes challenges remain, more work ahead. It states that unemployment has fallen
but remains high, and that median household income has declined.
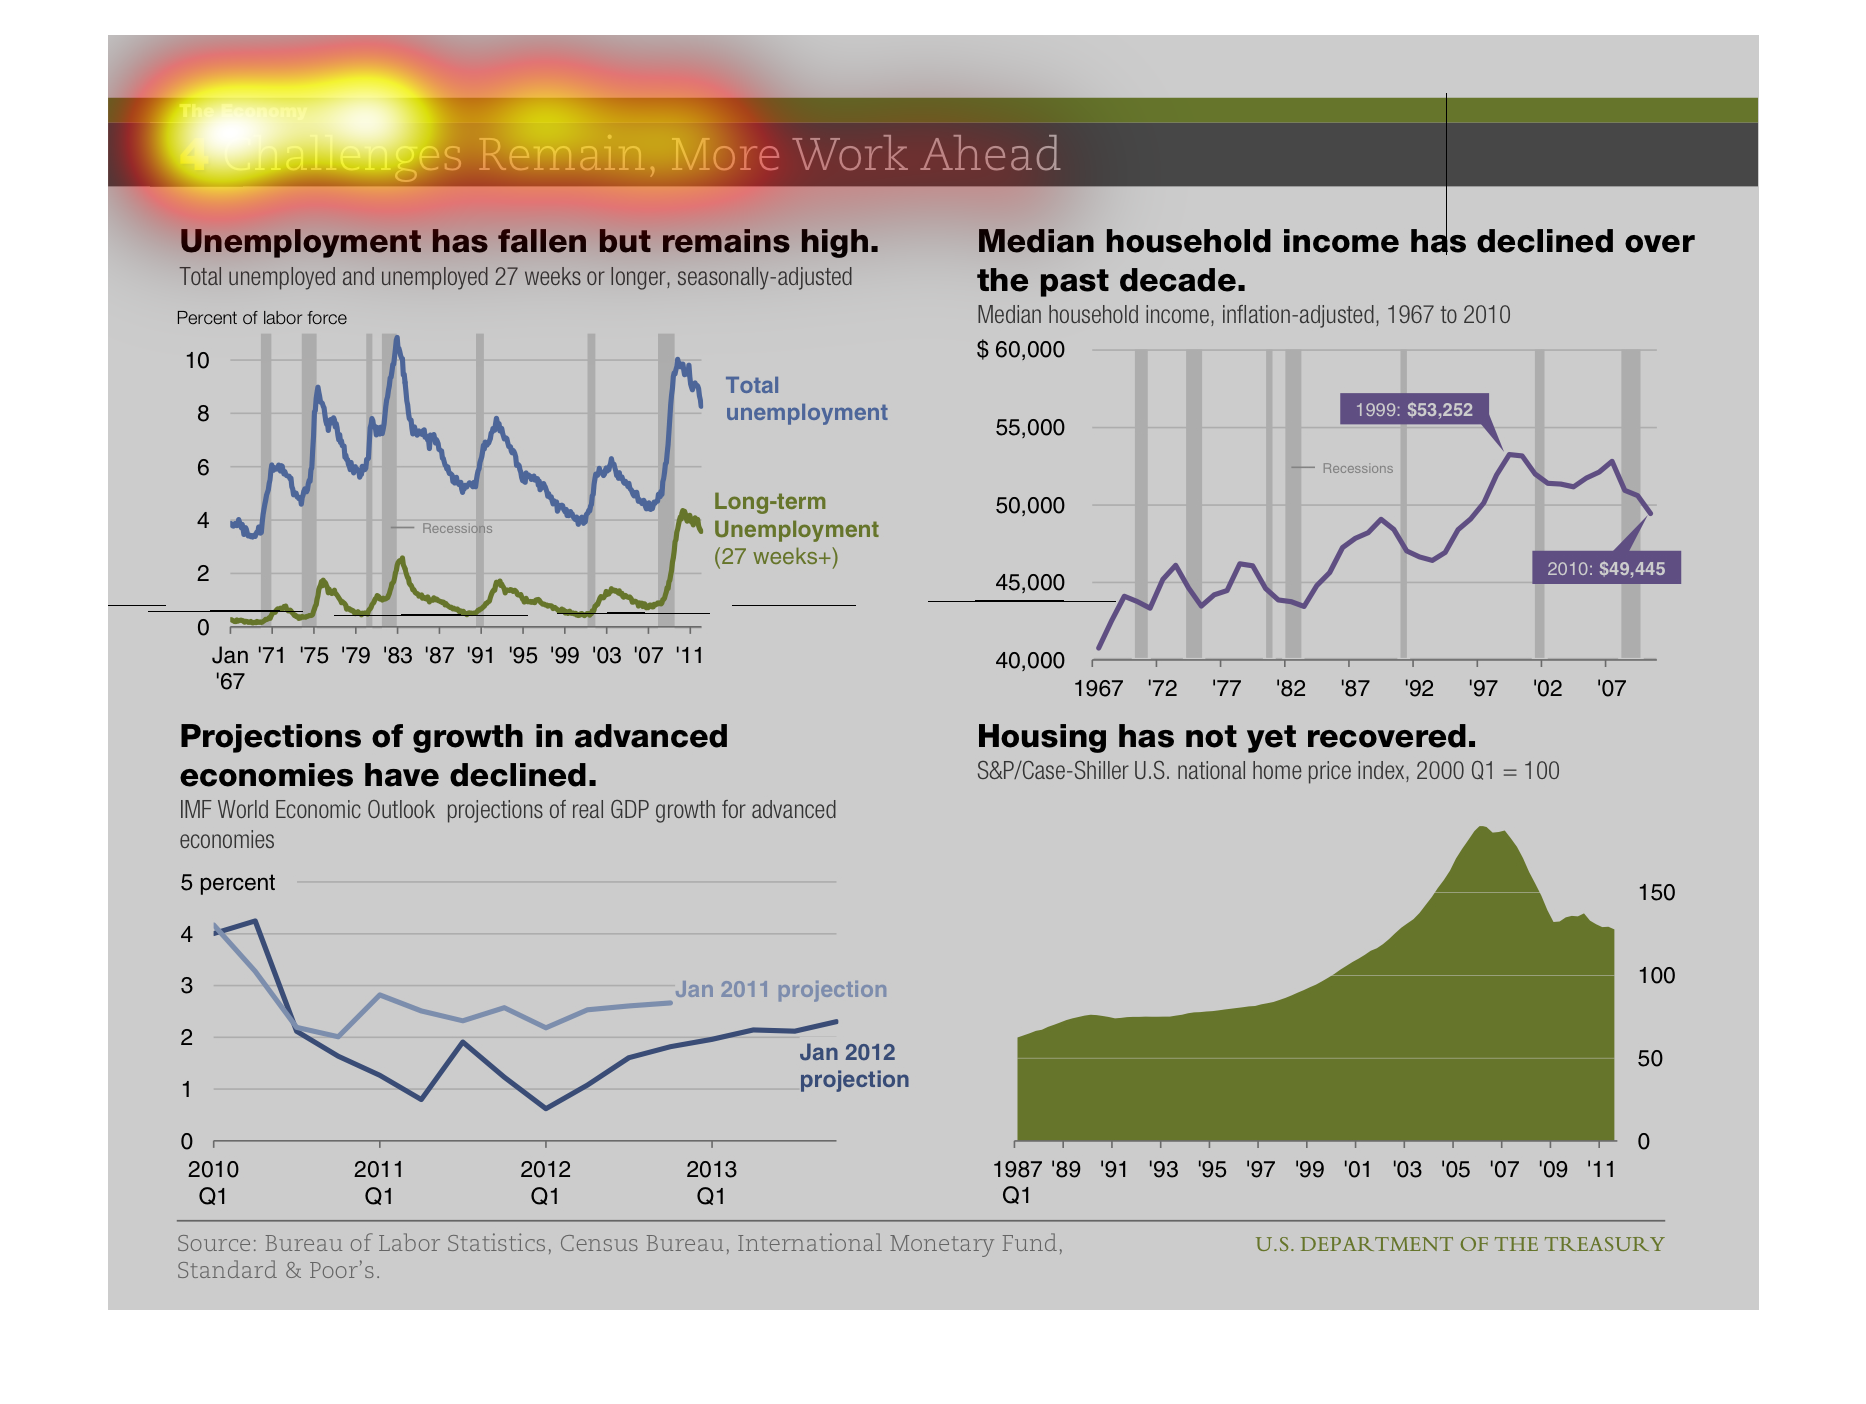
This study indicates that the World has not recovered from the recession a few years back
and even though unemployment is down there is still a lot of work to do in order to finally
get past the economical repercussions.
our economy remains unsteady and not so predictable . while unemployment has fallen it is
still very high. this is in part the cause for the ten year decline in household median income,
which continues today. the housing market had made great strides in the early to mid 2000's
but began an eventuale decline in 2007 that continues today. overall the economy still struggles