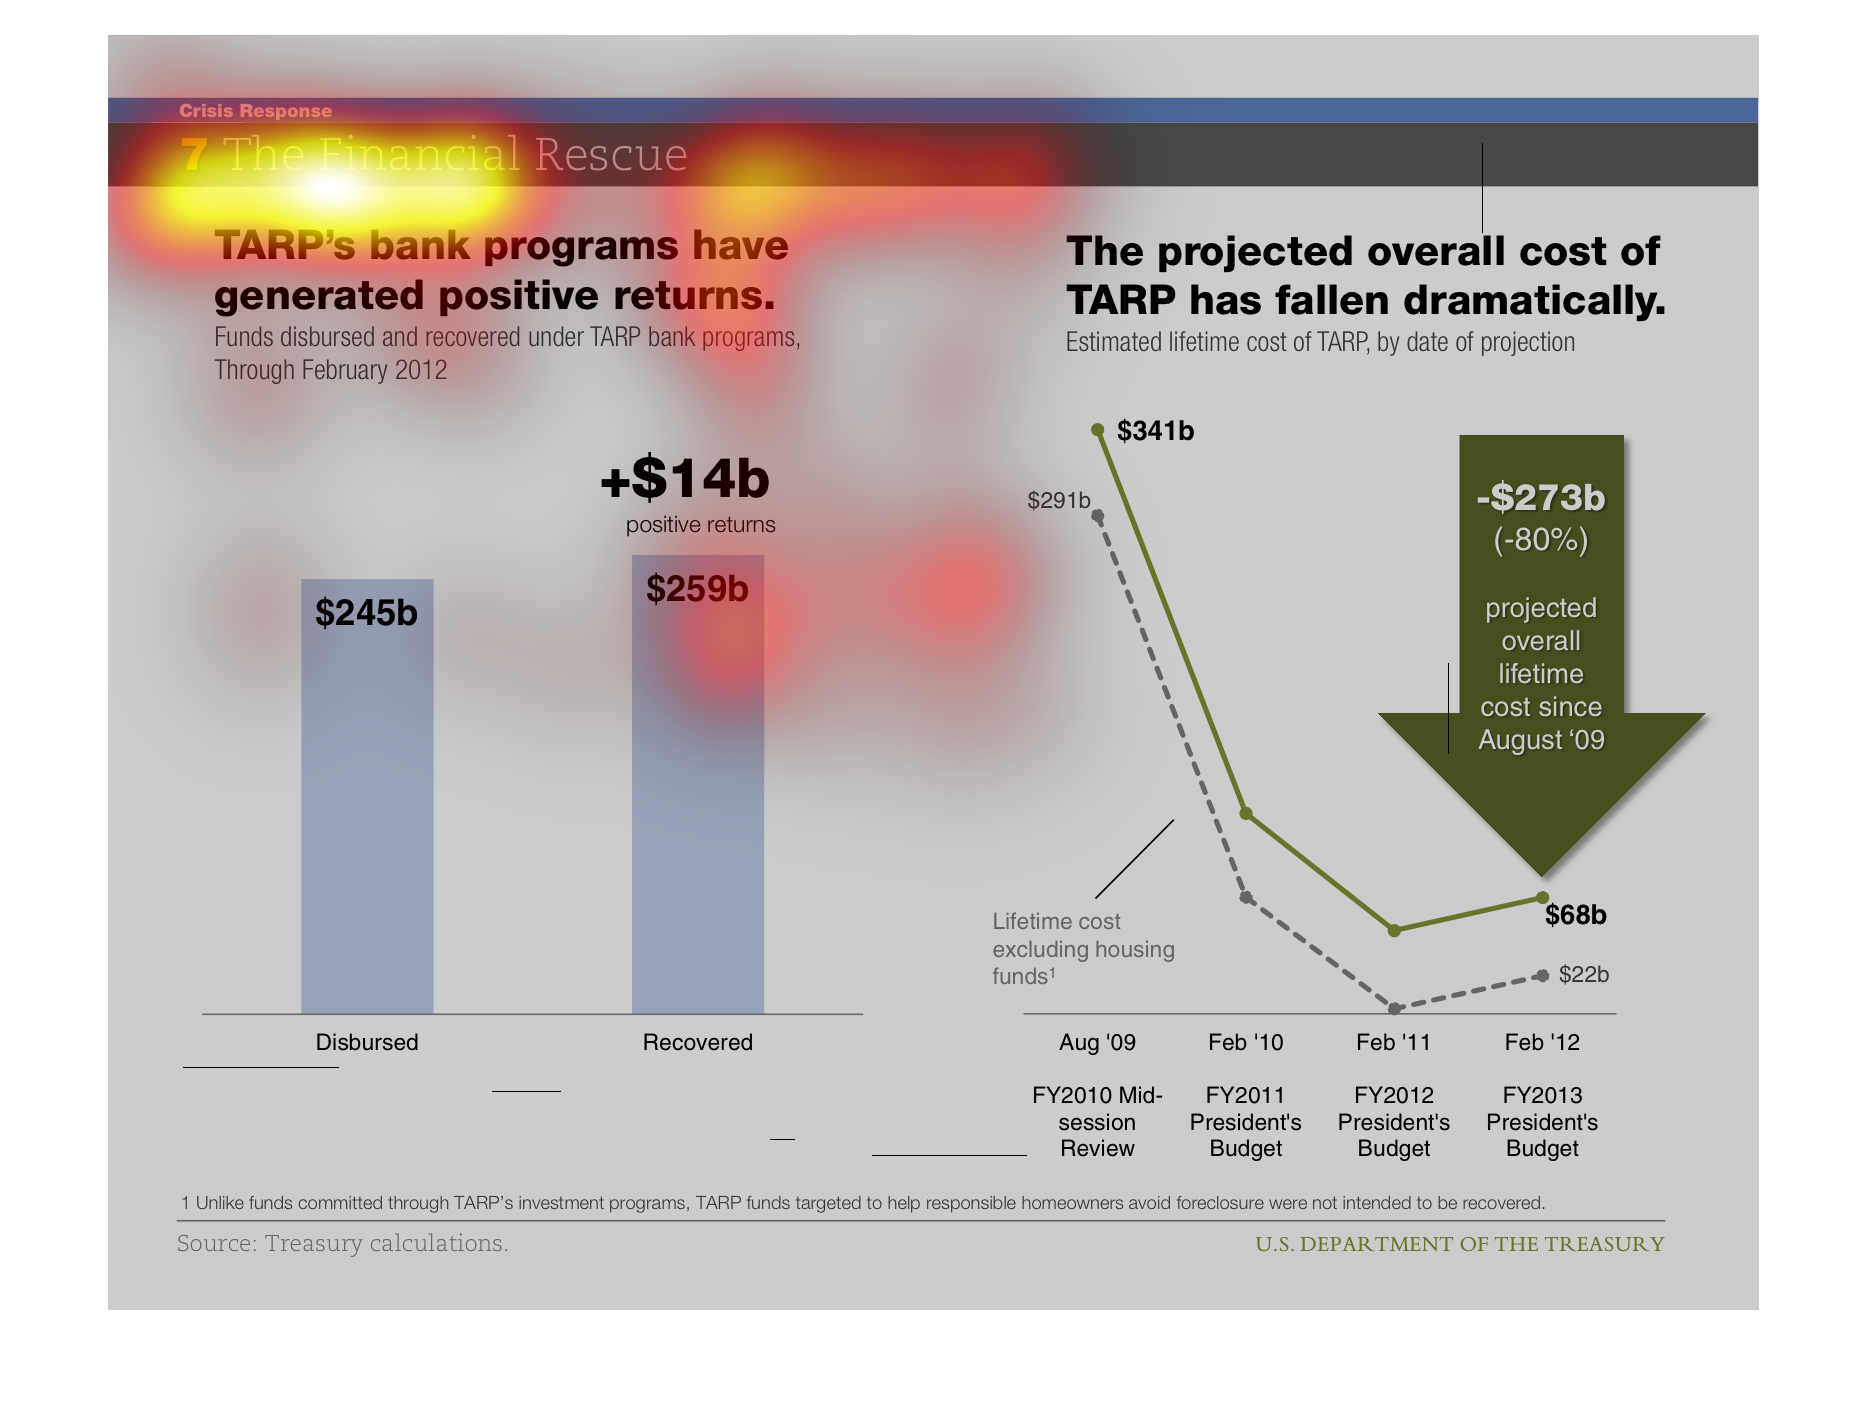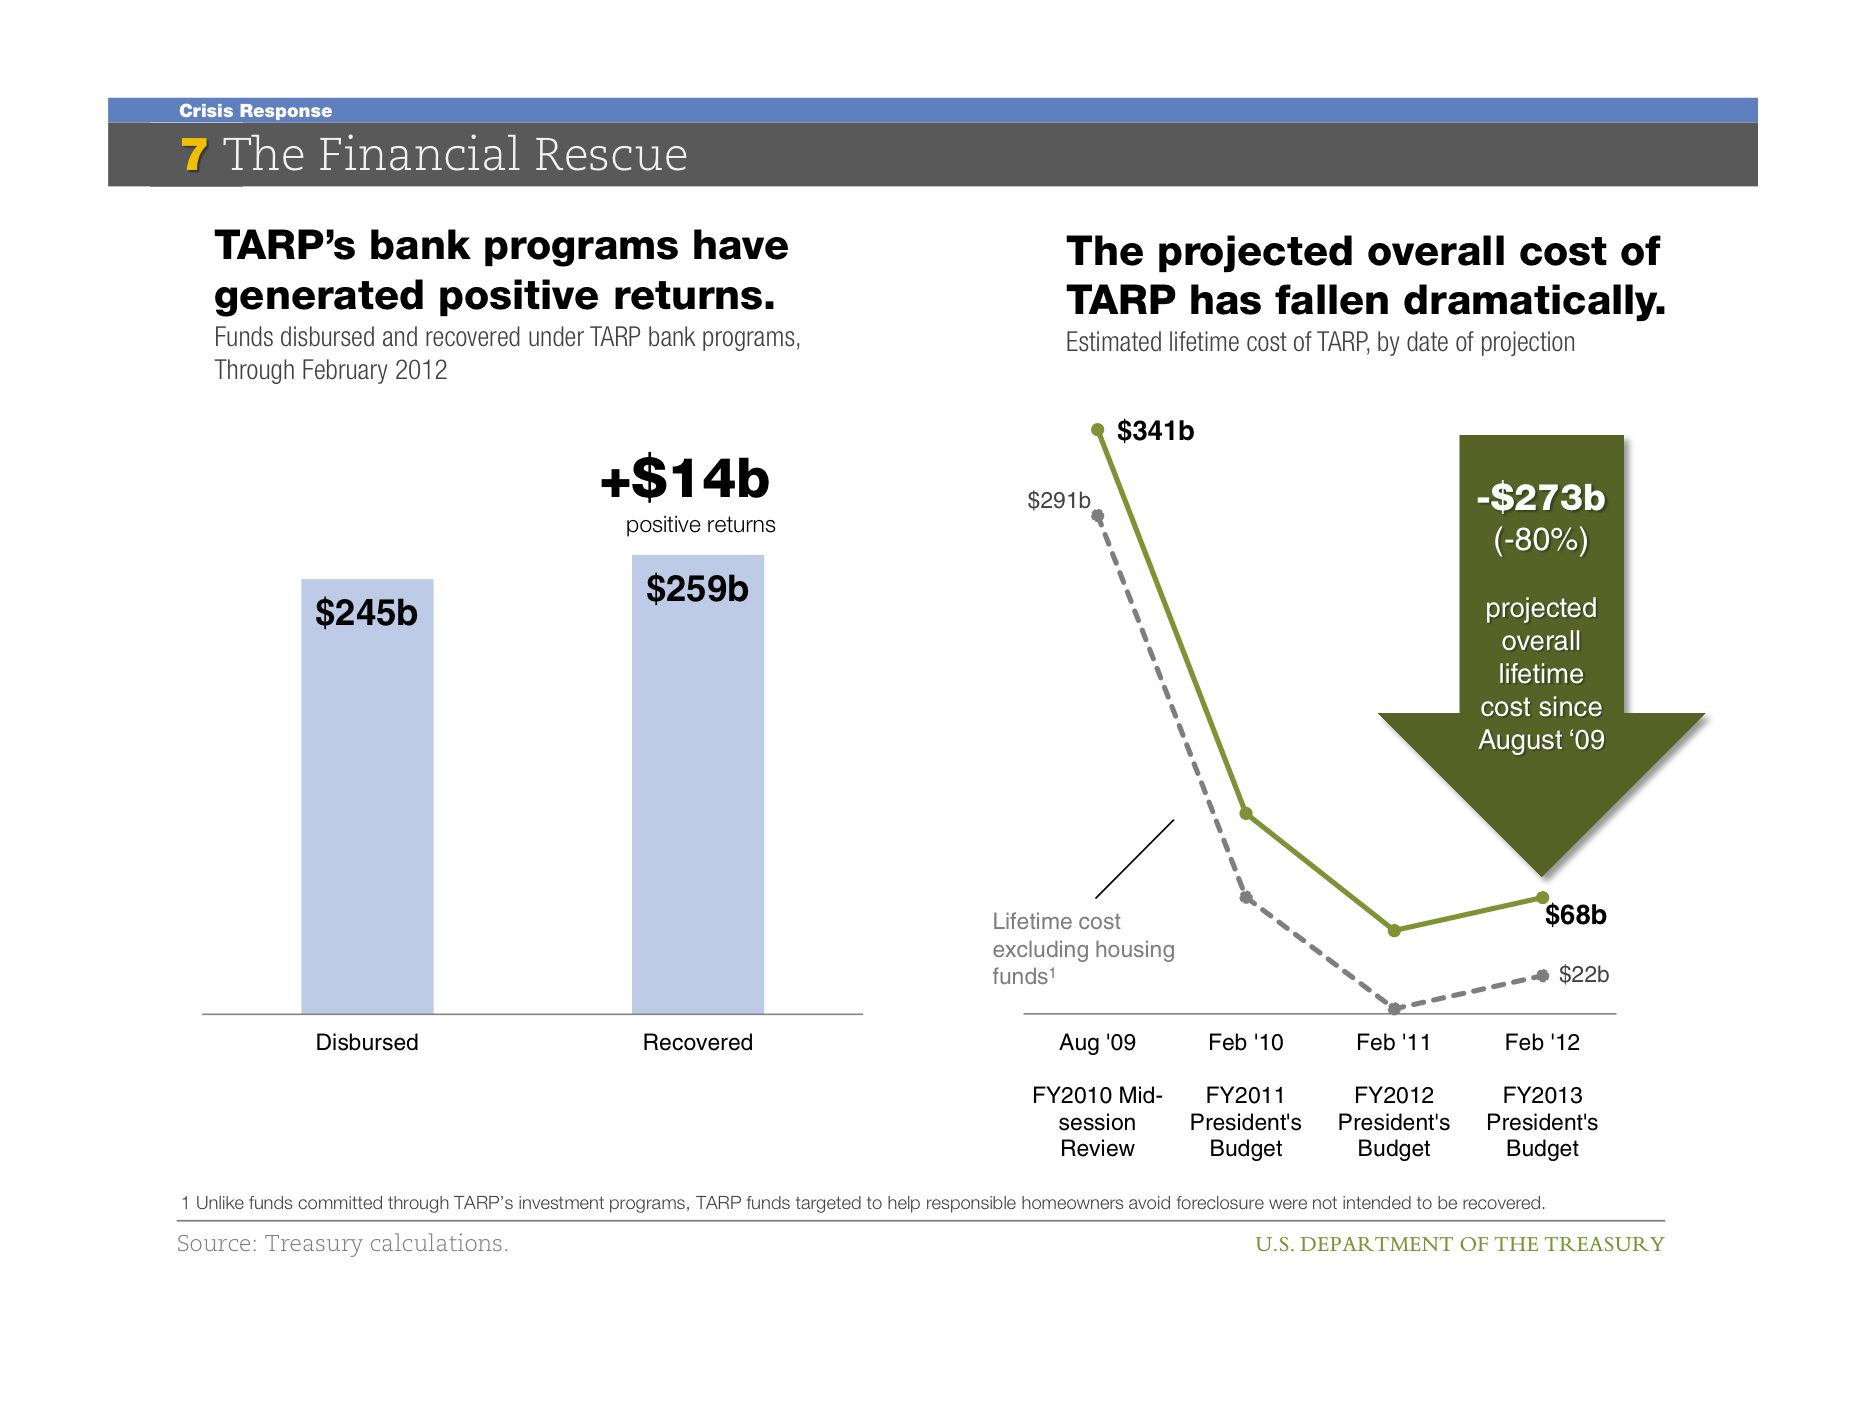
This image shows financial rescues.  There was over fourteen billion dollars recovered and
$245 billion disbursed under TARP.  The cost of TARP has fallen dramatically by $273 billion
dollars.
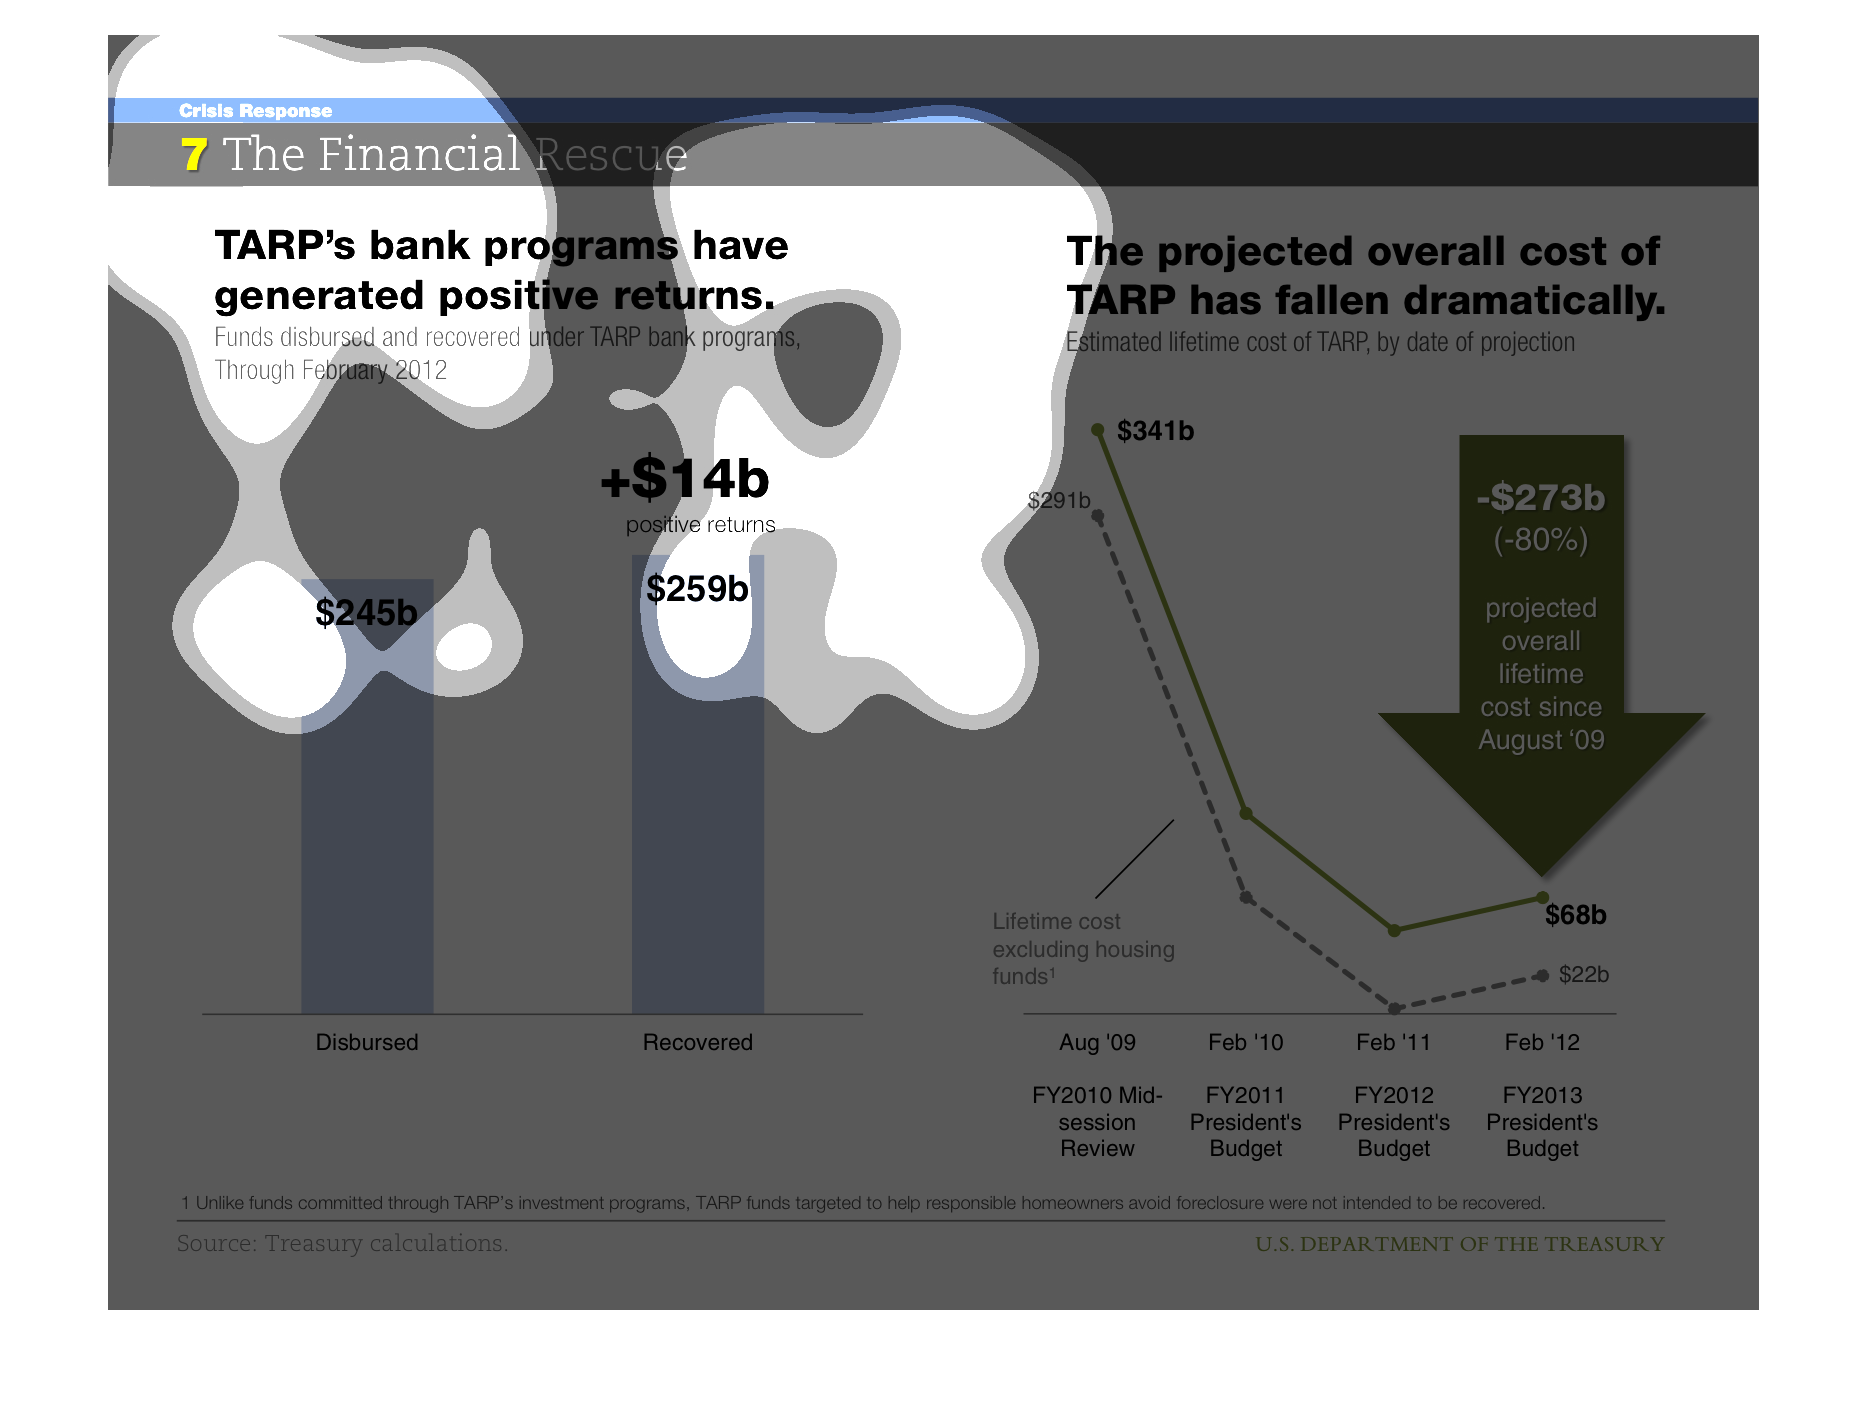
The graph shows how the emergency funds were dis-burst throughout the financial crisis and
that how years later we can actually chart how much of a difference it made.
This infographic shows the funds dispursed and refunded from the TARP bailout, and shows that
it has generated positive gains. To the right, a line chart shows the initial cost estimate,
the tracks it as the cost has fallen over time.
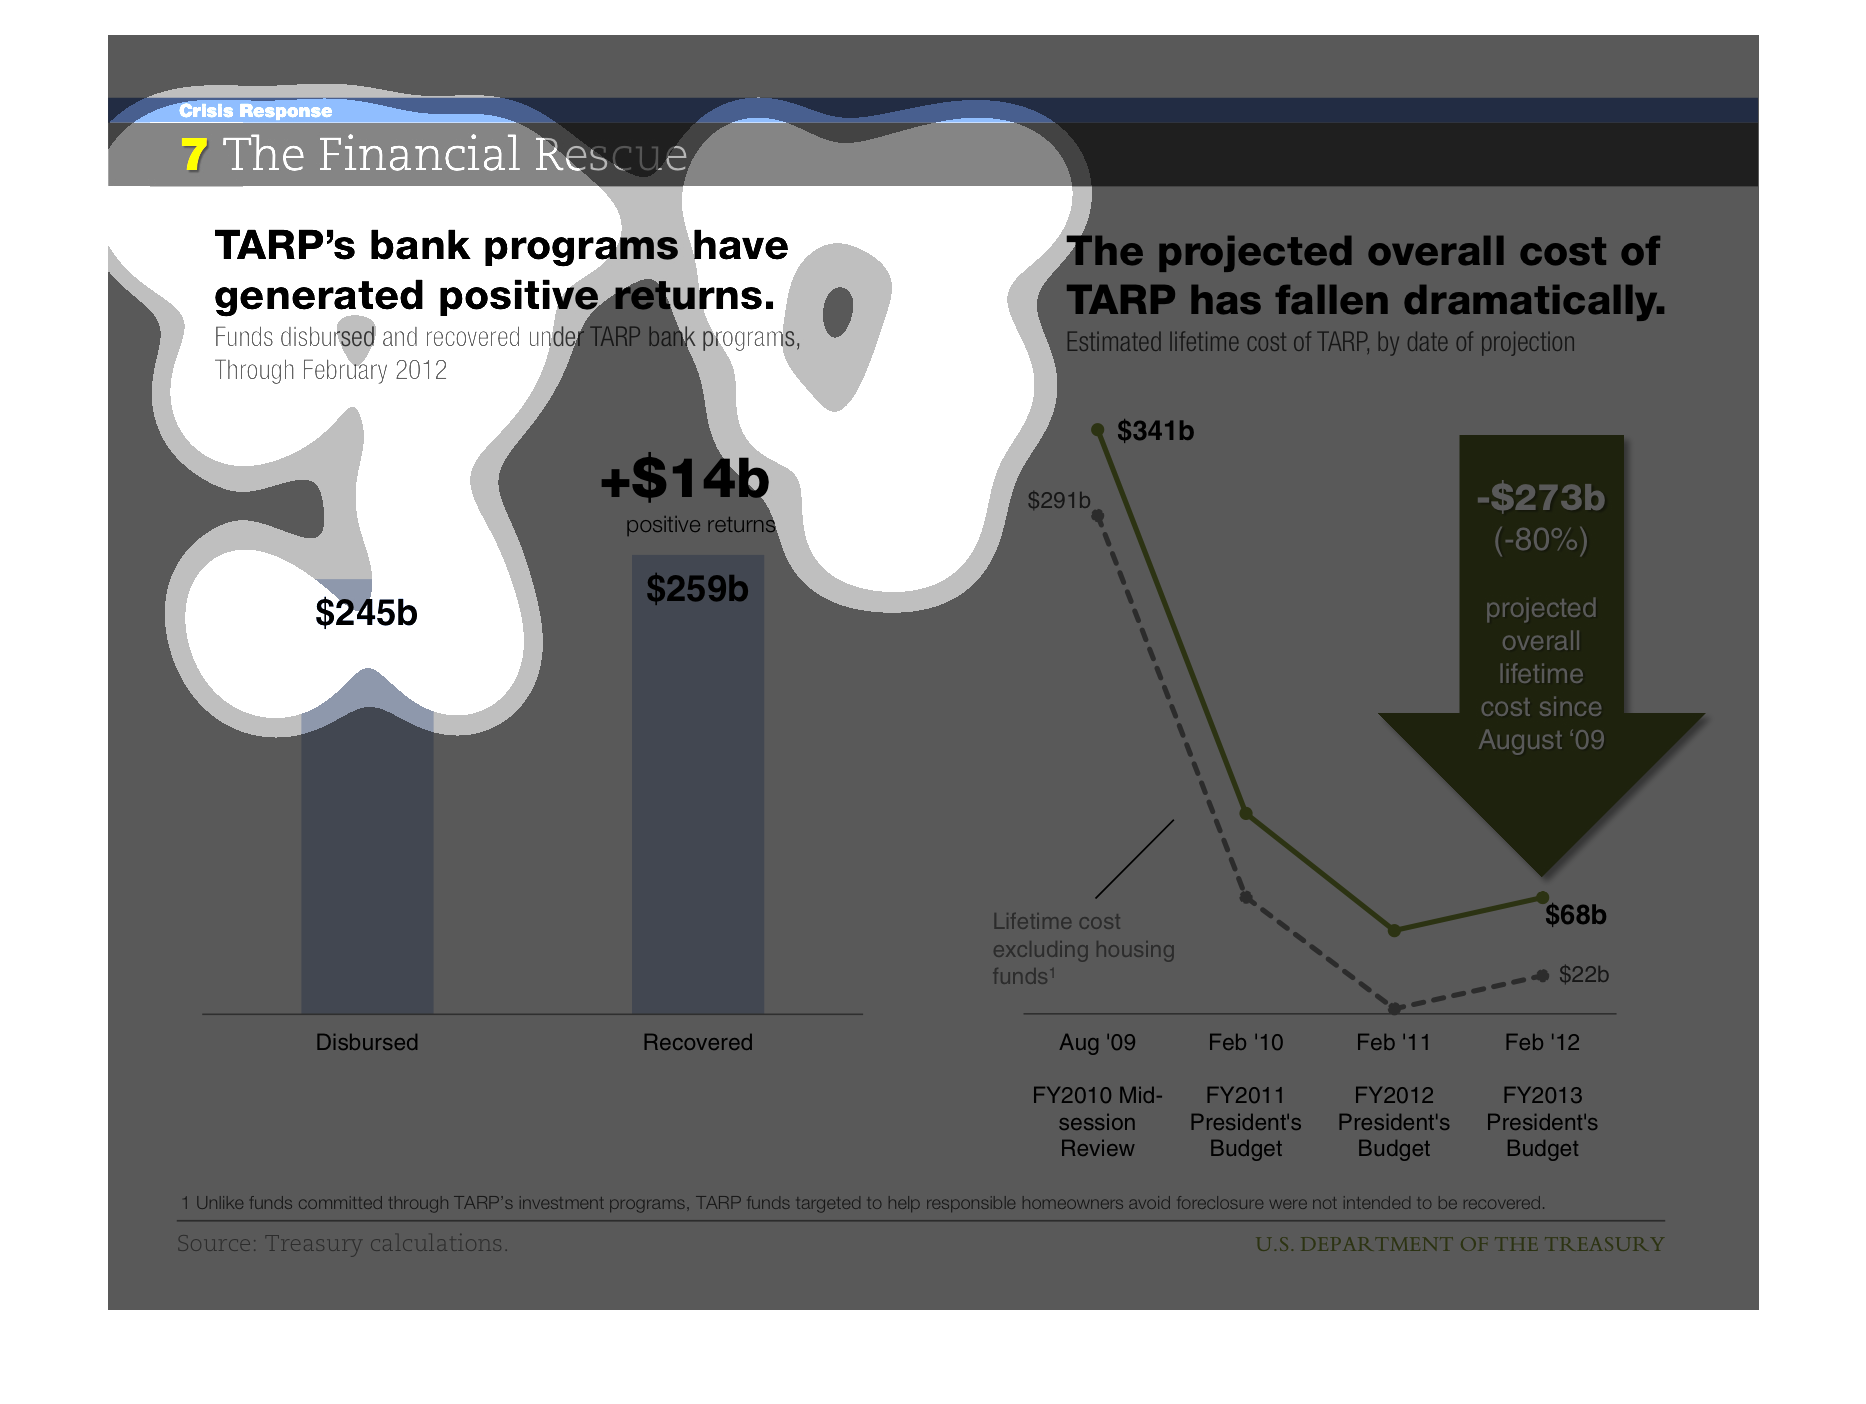
TARP's bank programs generated positive returns. Disbursed $245 Billion.  Receieved Positive
returns of $14 Billion of the $259 Billion   The projects over all cost of TARP has fallen
dramtically.
The title of this graph is, 'The Financial Rescue'.  There are two main components of this
graph.  On the left is a graph subtitled  is, 'TARP's bank programs have generated positive
returns.  This graph features two bar graphs laid out in a vertical fashion.  One graph lists
amount of funds disbursed and the other funds recovered.  The Second graph on the right, subtitled,
'The projected overall cost of TARP has fallen dramatically.
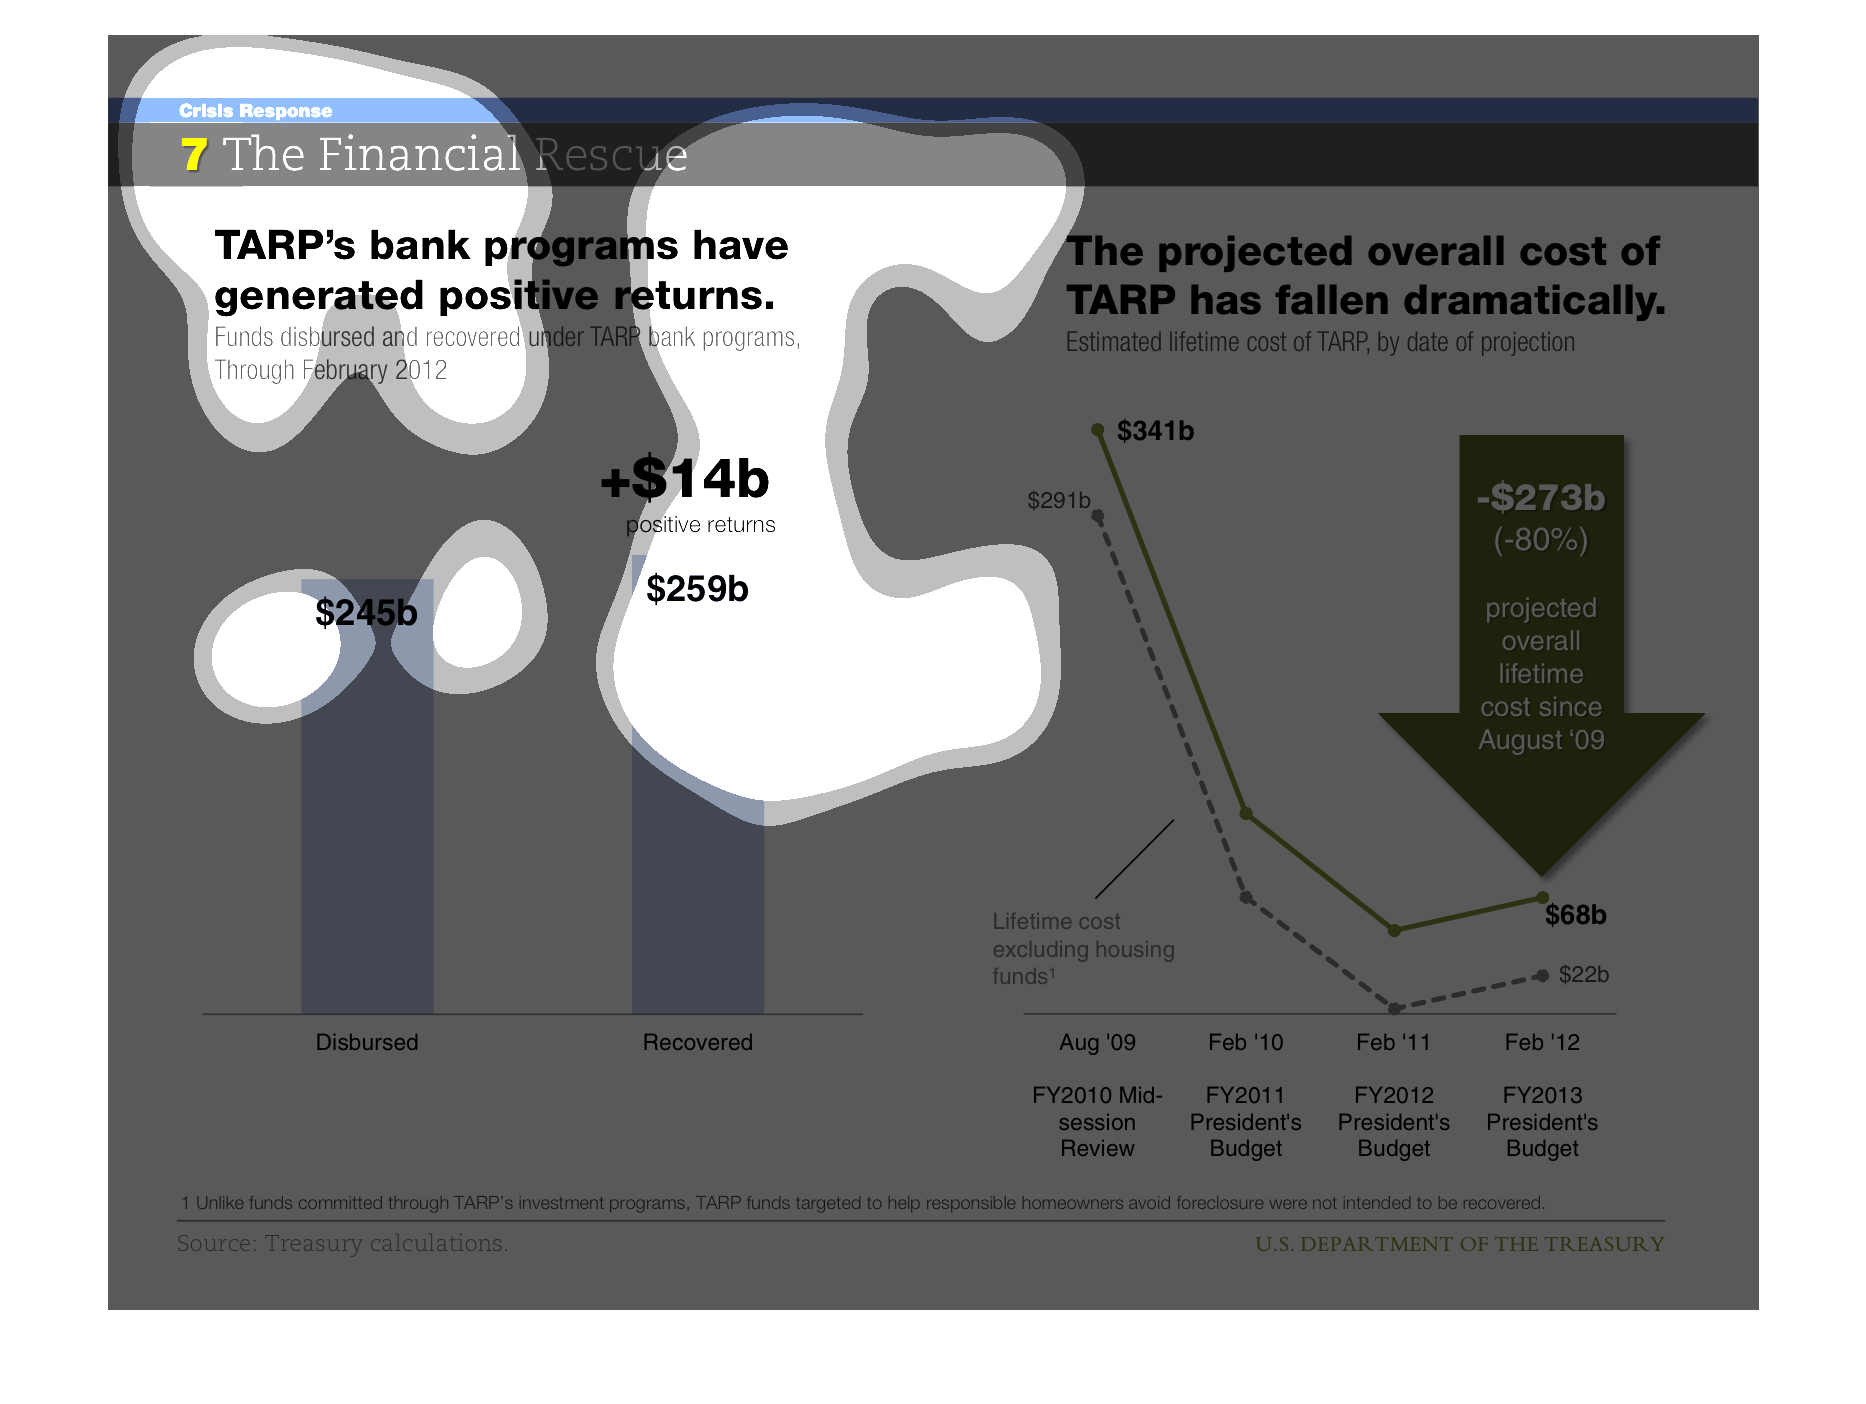
This chart describes that Tarp's bank programs have generated positive returns. The chart
also covers the fact that the projected overall cost tarp has fallen dramatically.
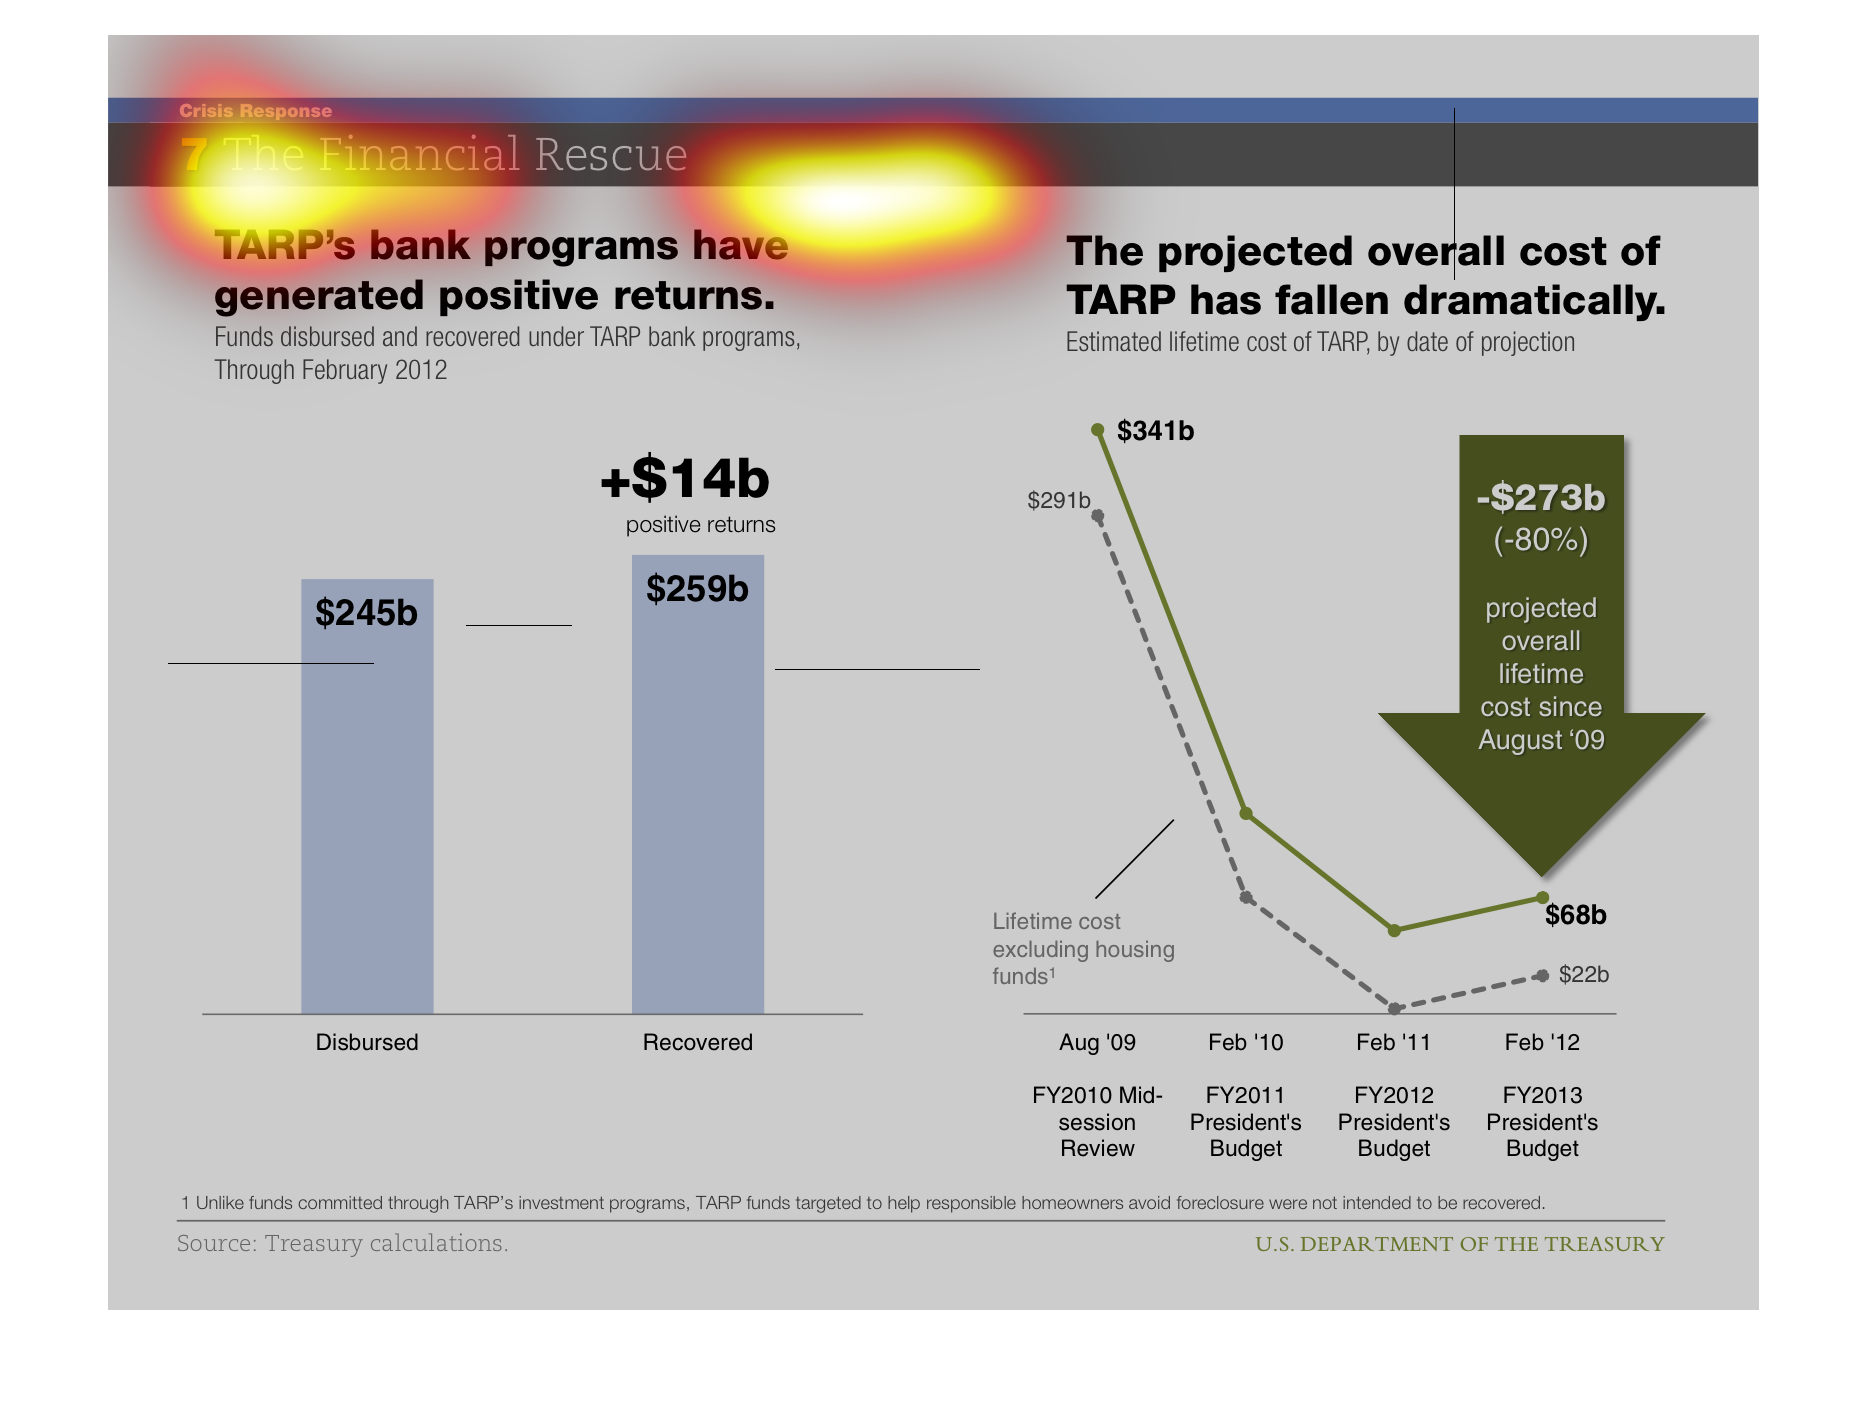
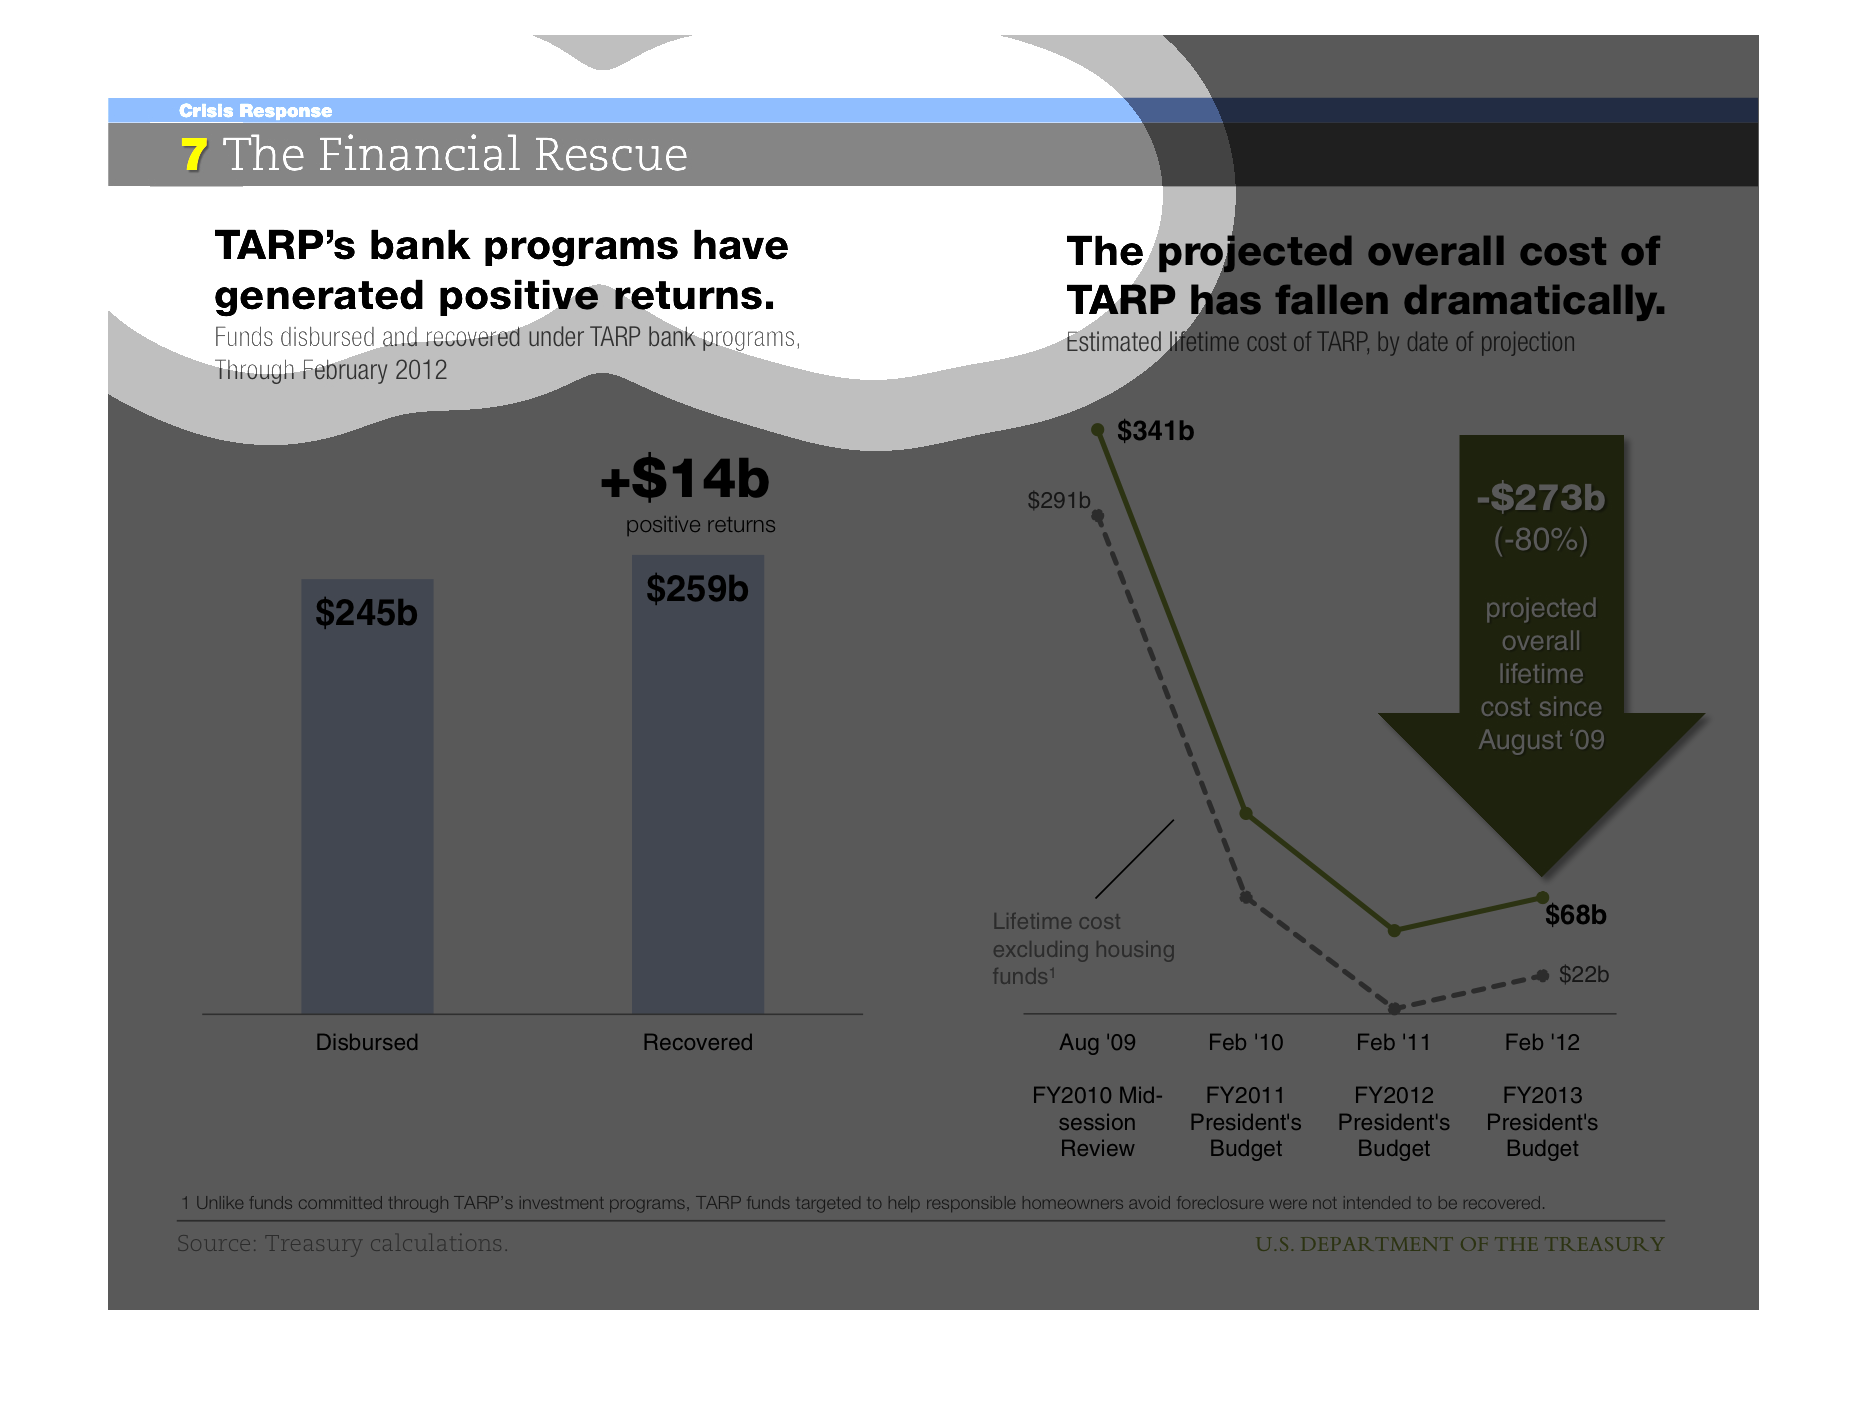
This image shows or depicts in statistical bar graph and line graph format the effects and
benefits TARP's bank programs have had on various institutions.
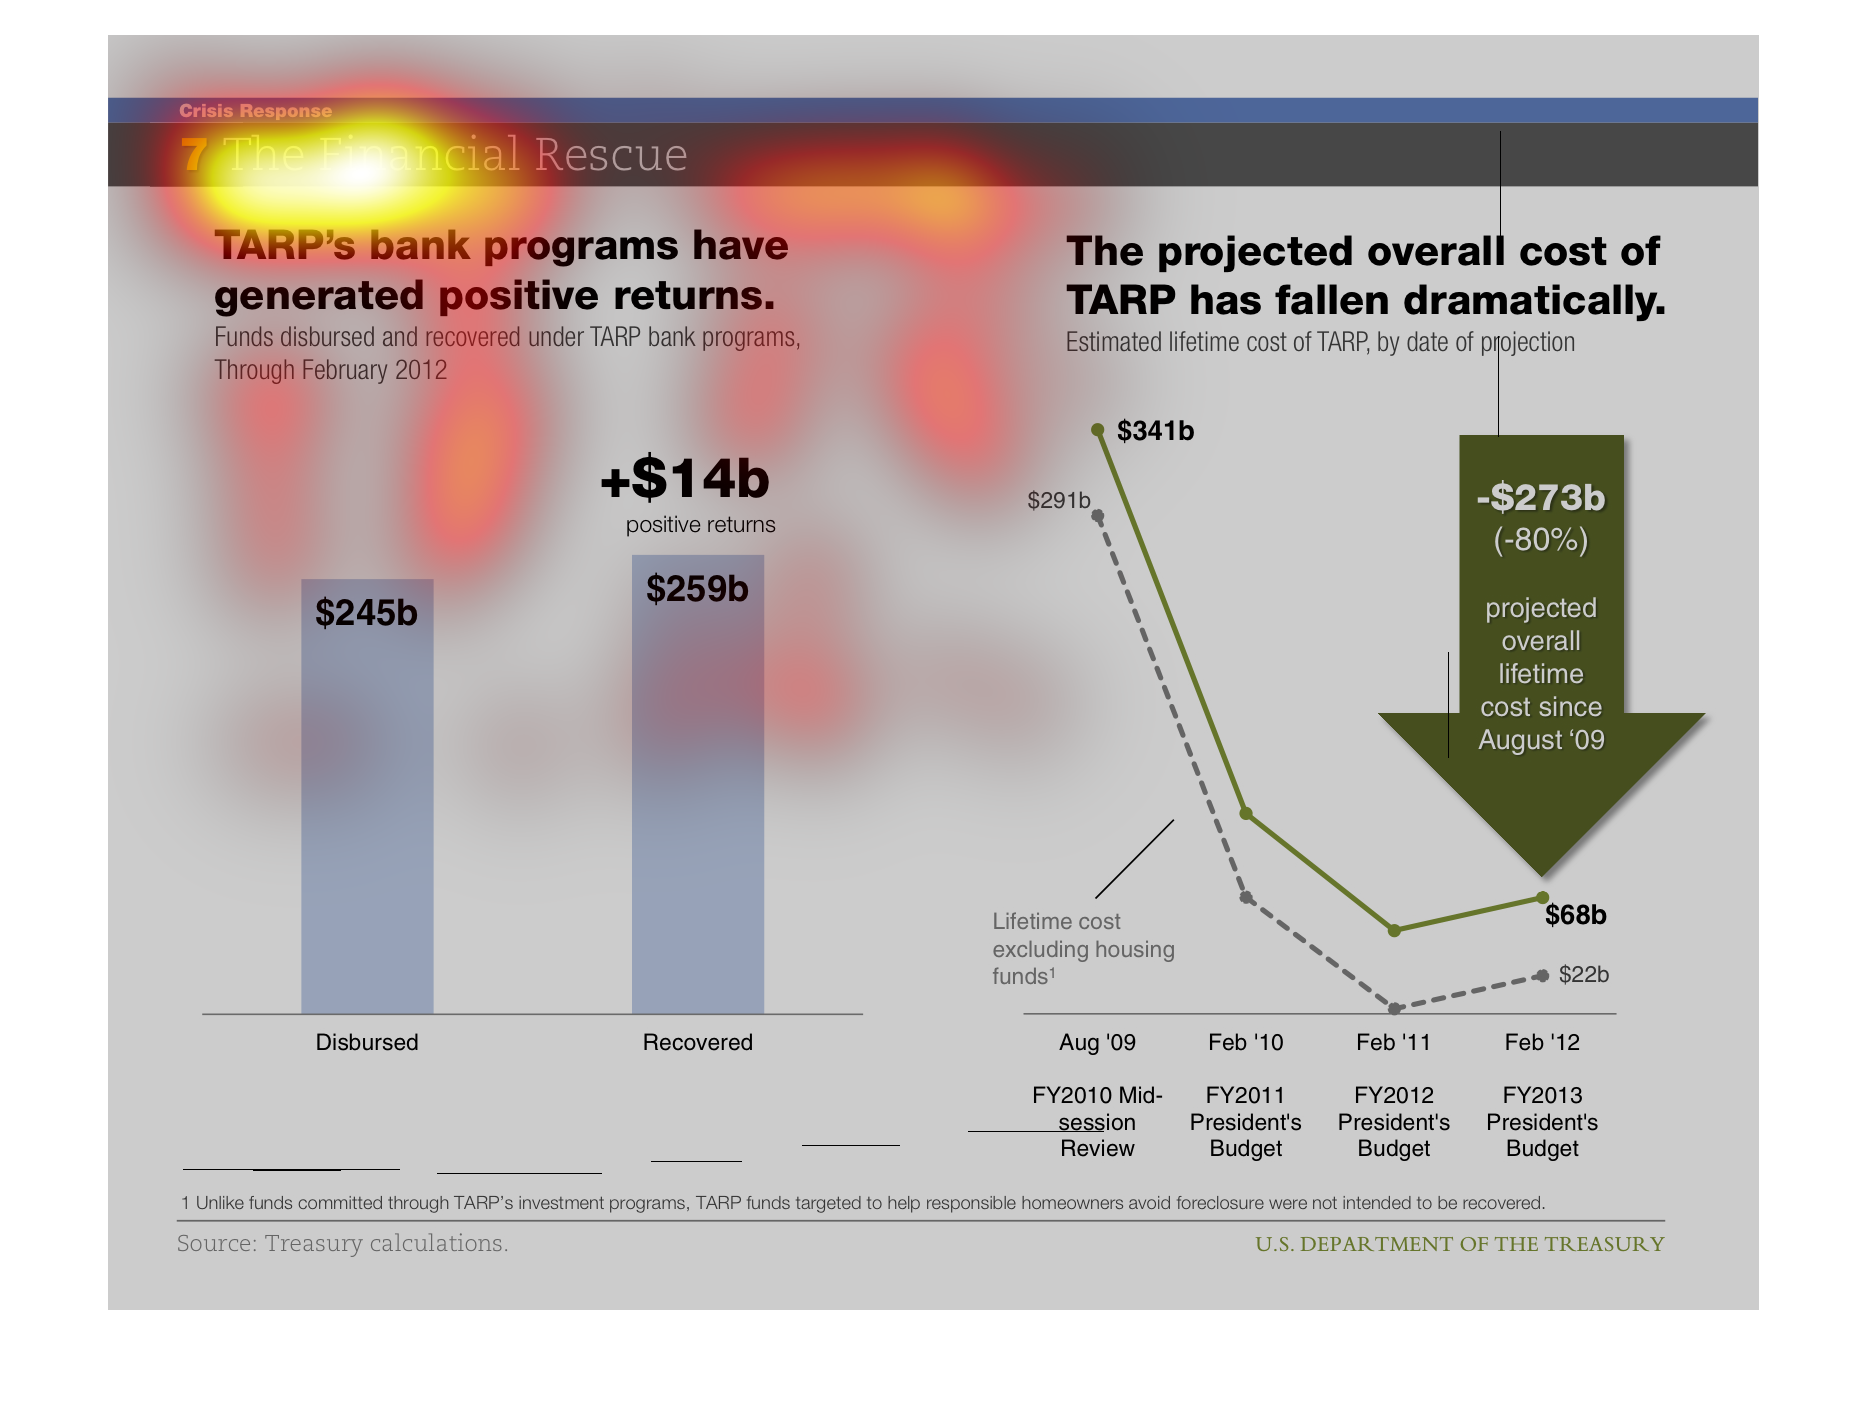
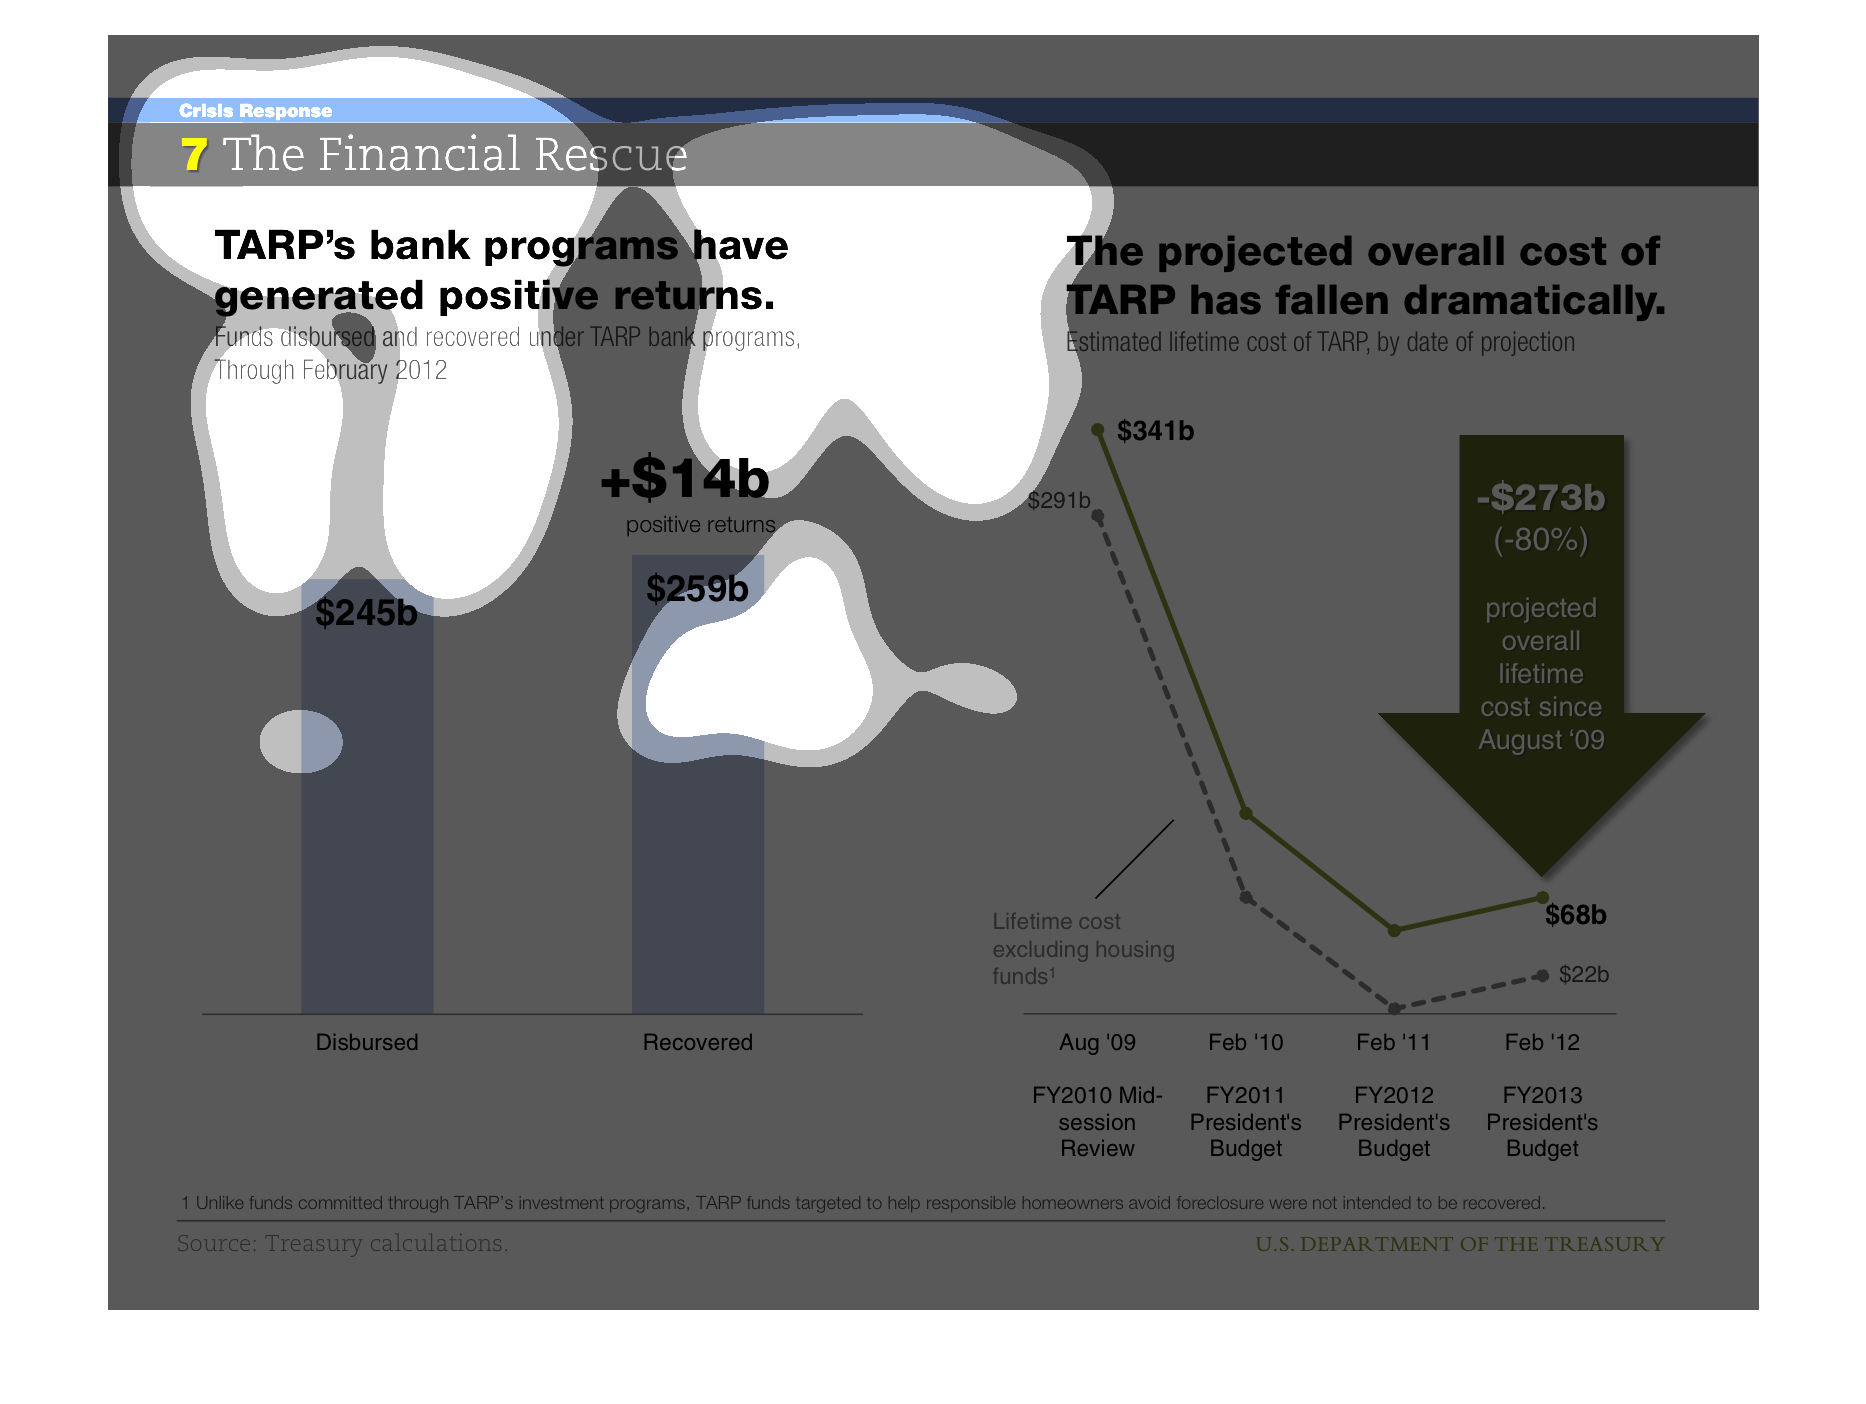
This image is showing information about the TARP programs, with the positive returns from
the TARP program on the left ($14 Billion in positive returns) and the cost of the program
on the right, which has dramatically decreased in the three years shown.
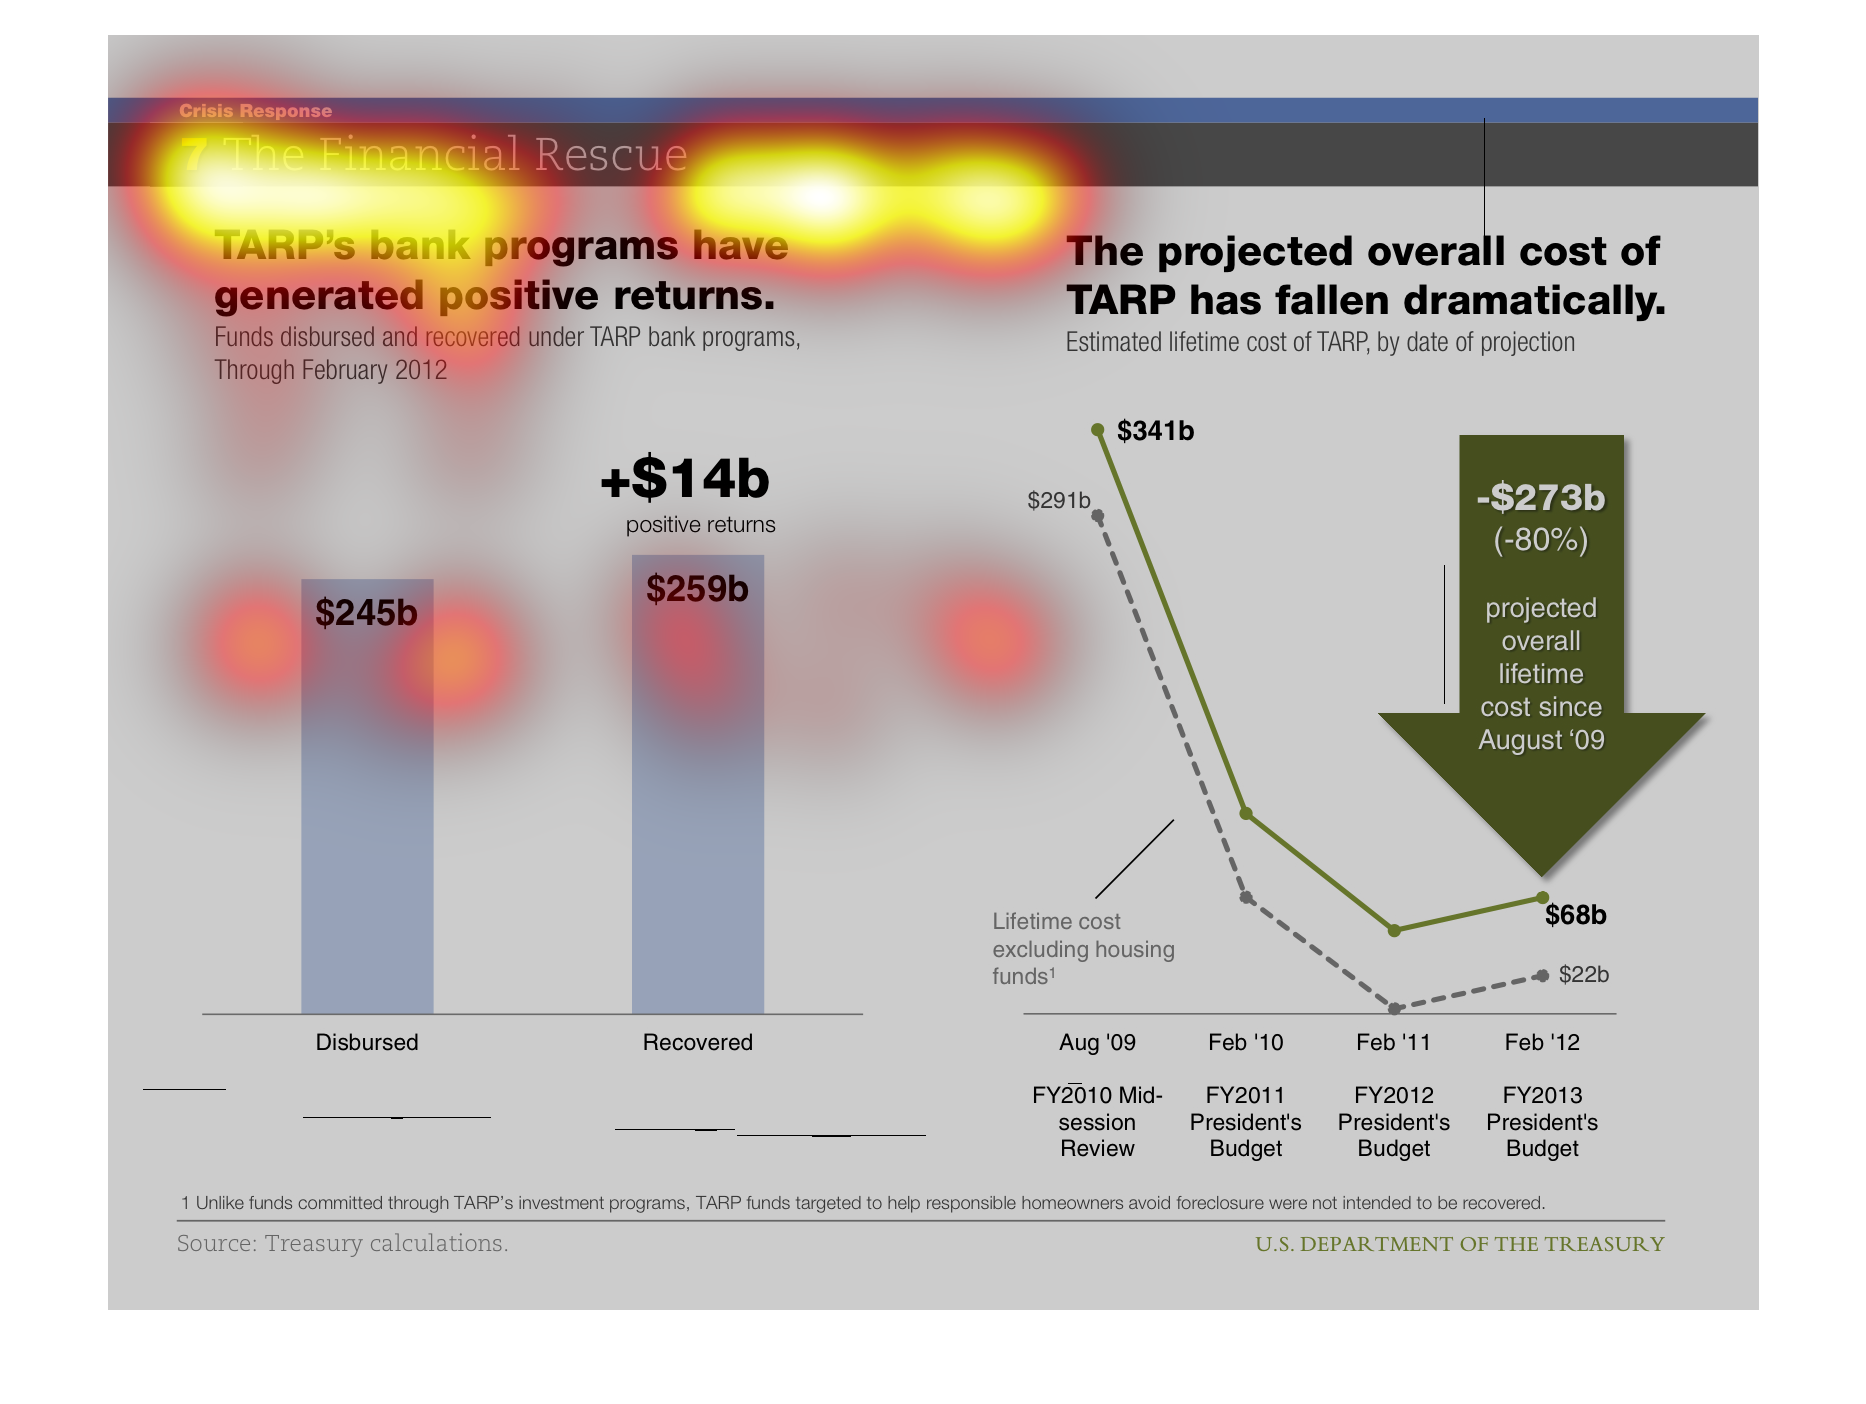
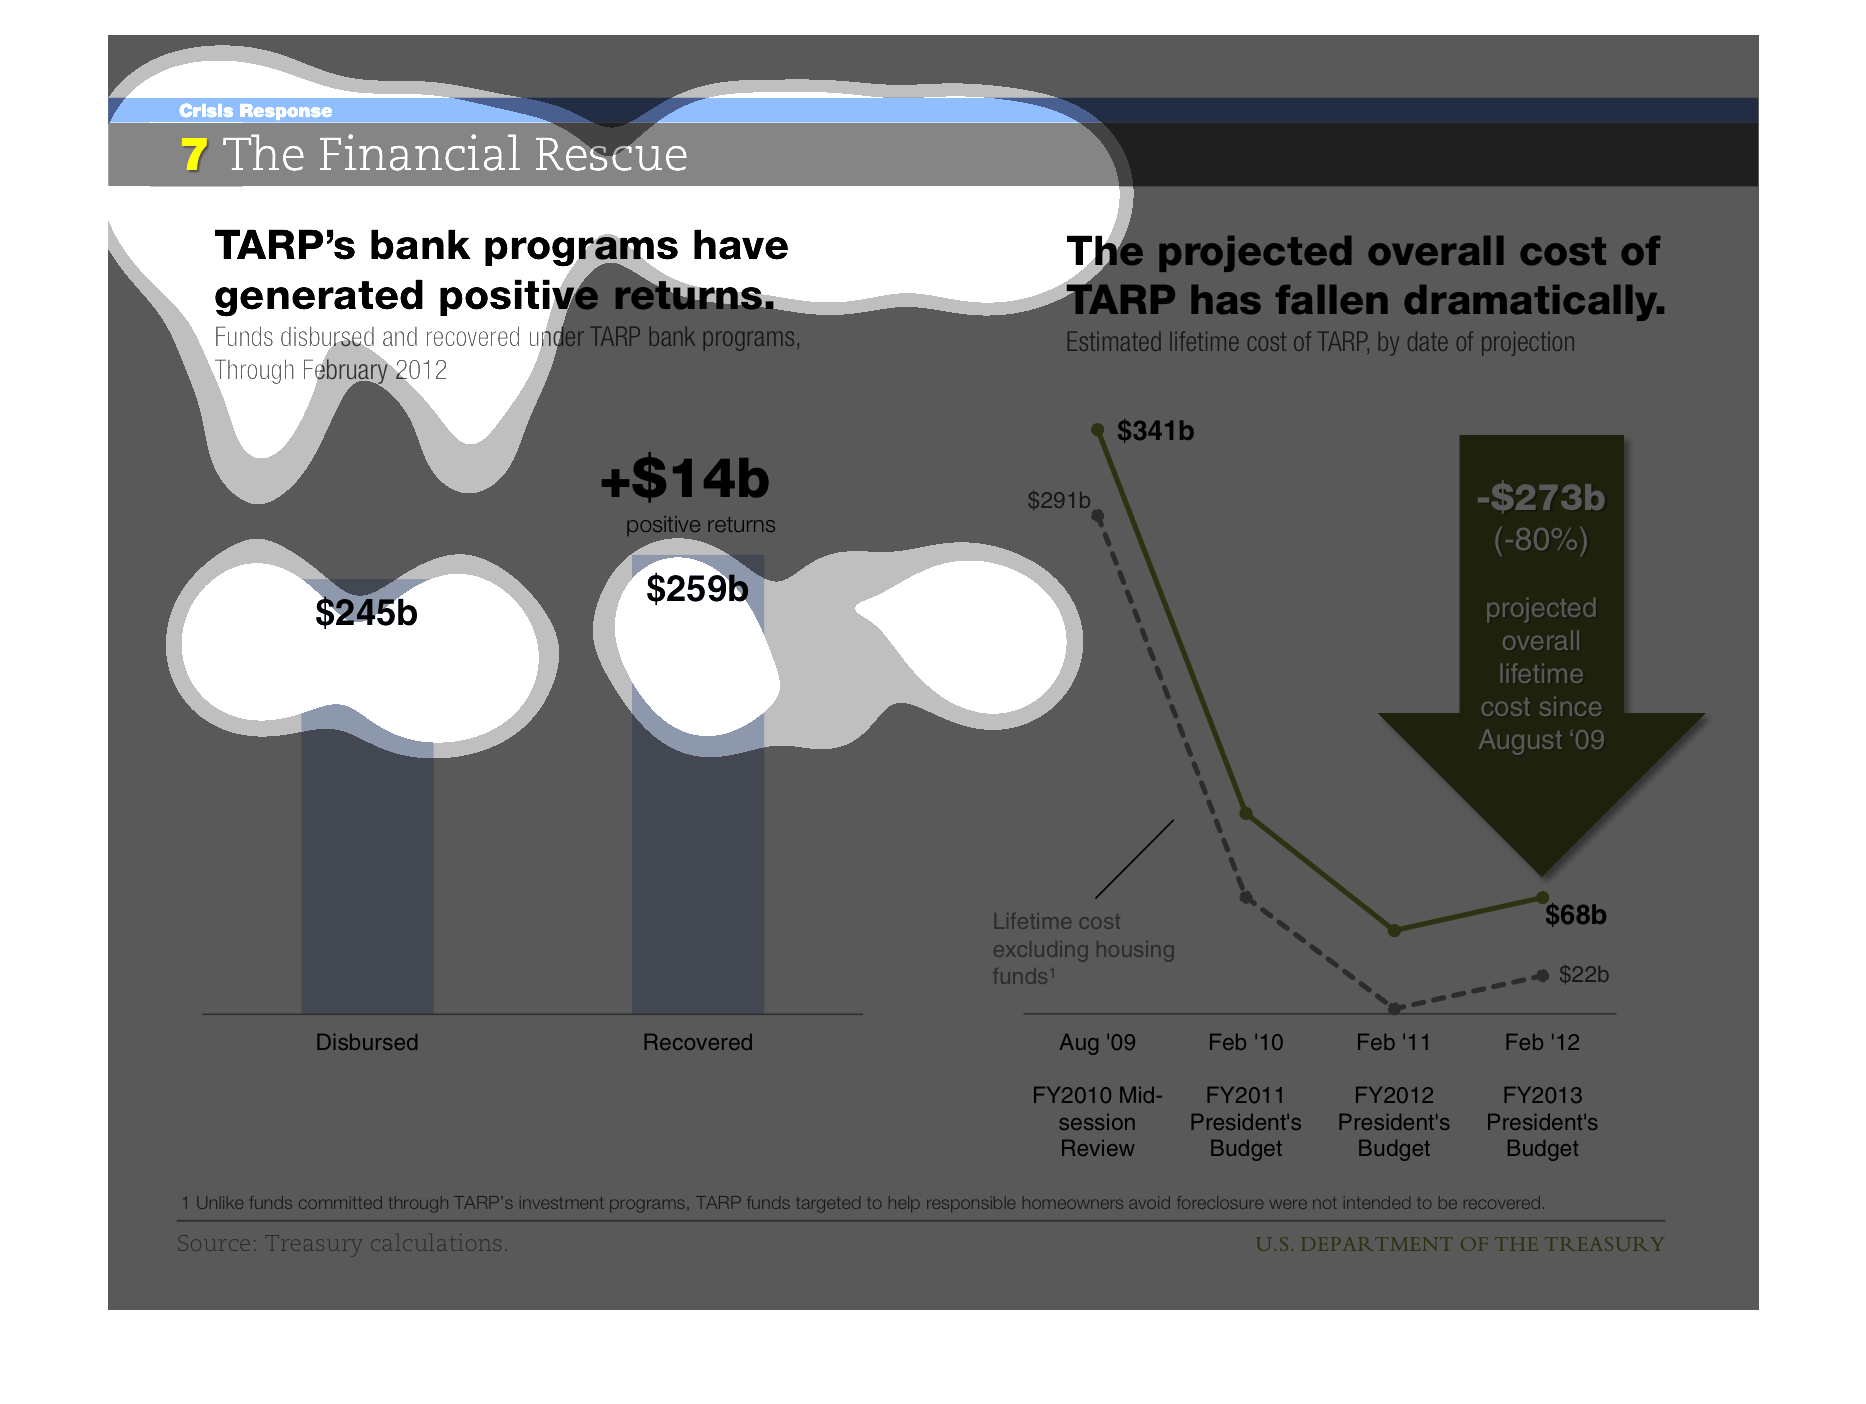
THIS PLOT SHOWS THE EFFECT OF TARP. AT LEFT IS SHOWN THE DIFFERENCE BETWEEN FUNDS DISBERSED
AND RECOVERED, WITH MORE BEING RECOVERED. AT RIGHT IT IS SHOWN THAT THE OVERALL COST OF TARP
HAS DECREASED.
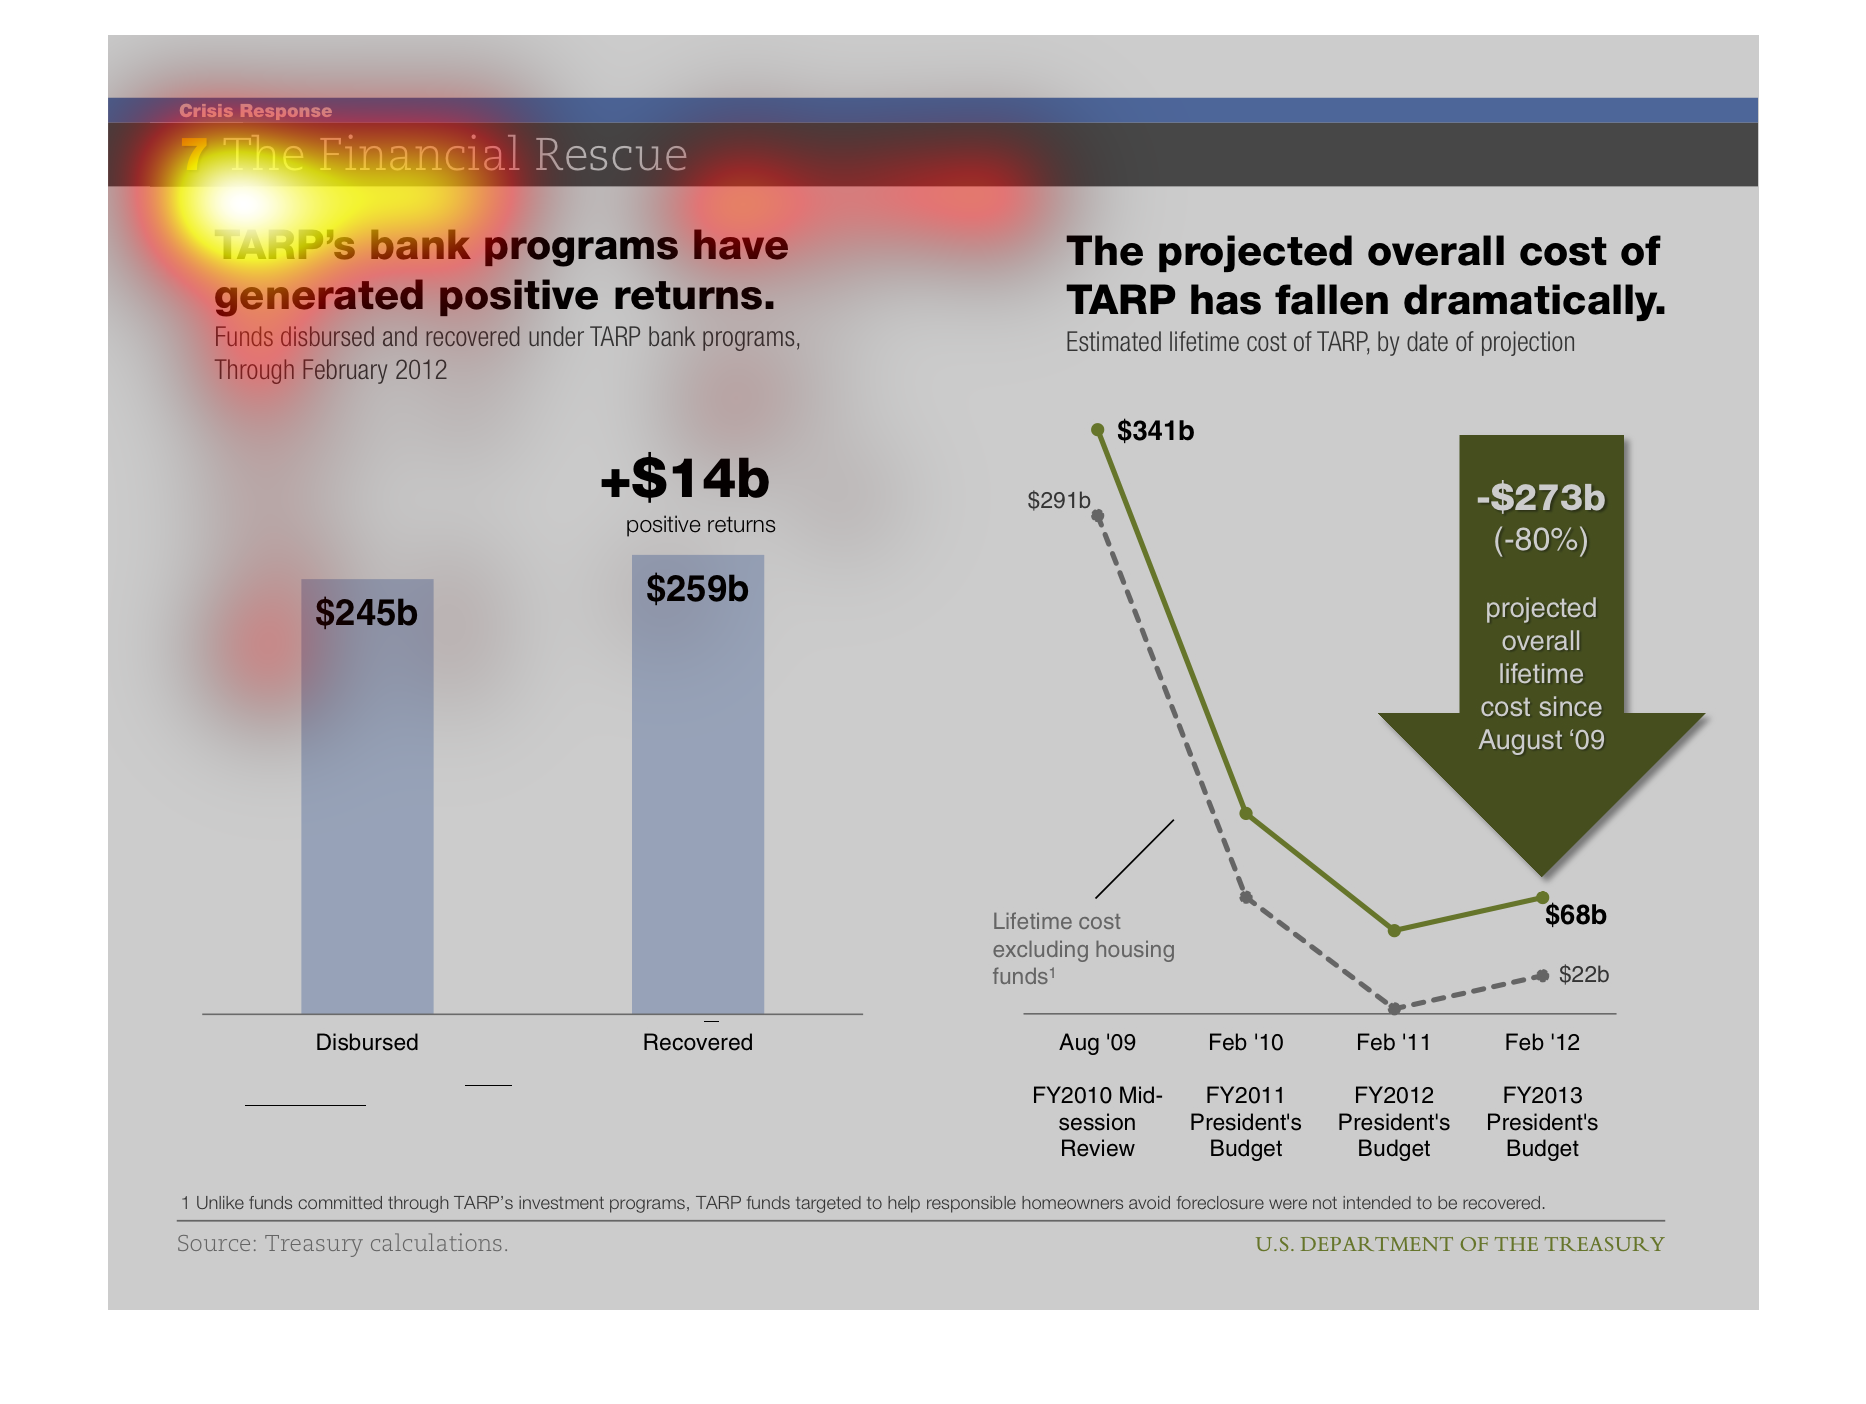
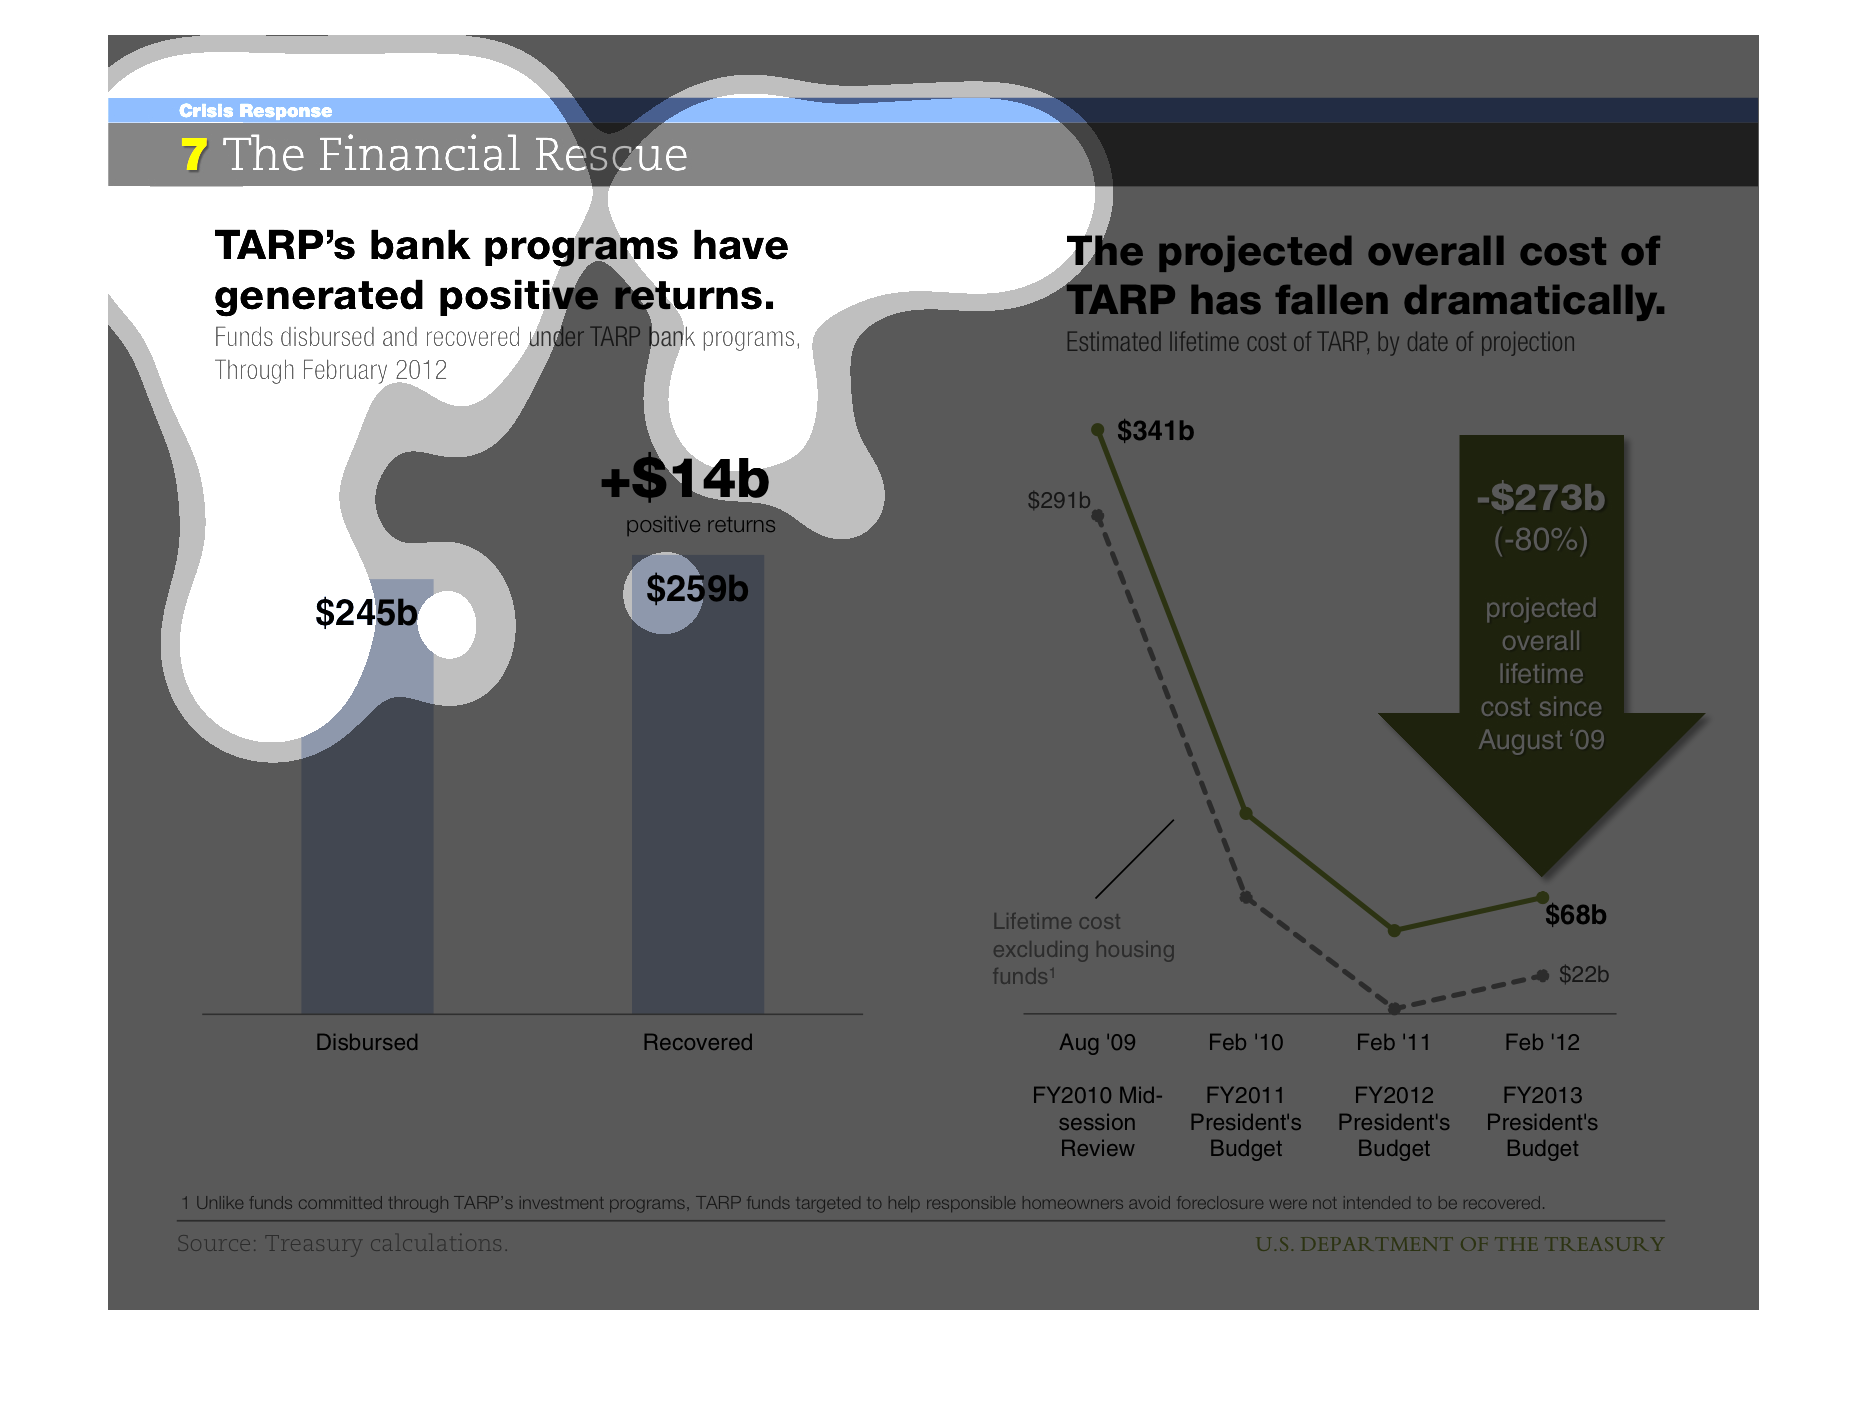
This is a chart showing the effects of the financial rescue. On the left it shows tram disbursed
$245 billion and returned that plus $14 billion. On the right it was projected to cost $341
billion in August of 09, and Feb of 12 it was down to 6$68 billion.
TARP's programs and how they have impacted the economy on the first chart. Then the second
one shows that that the cost for TARP has gone down dramatically
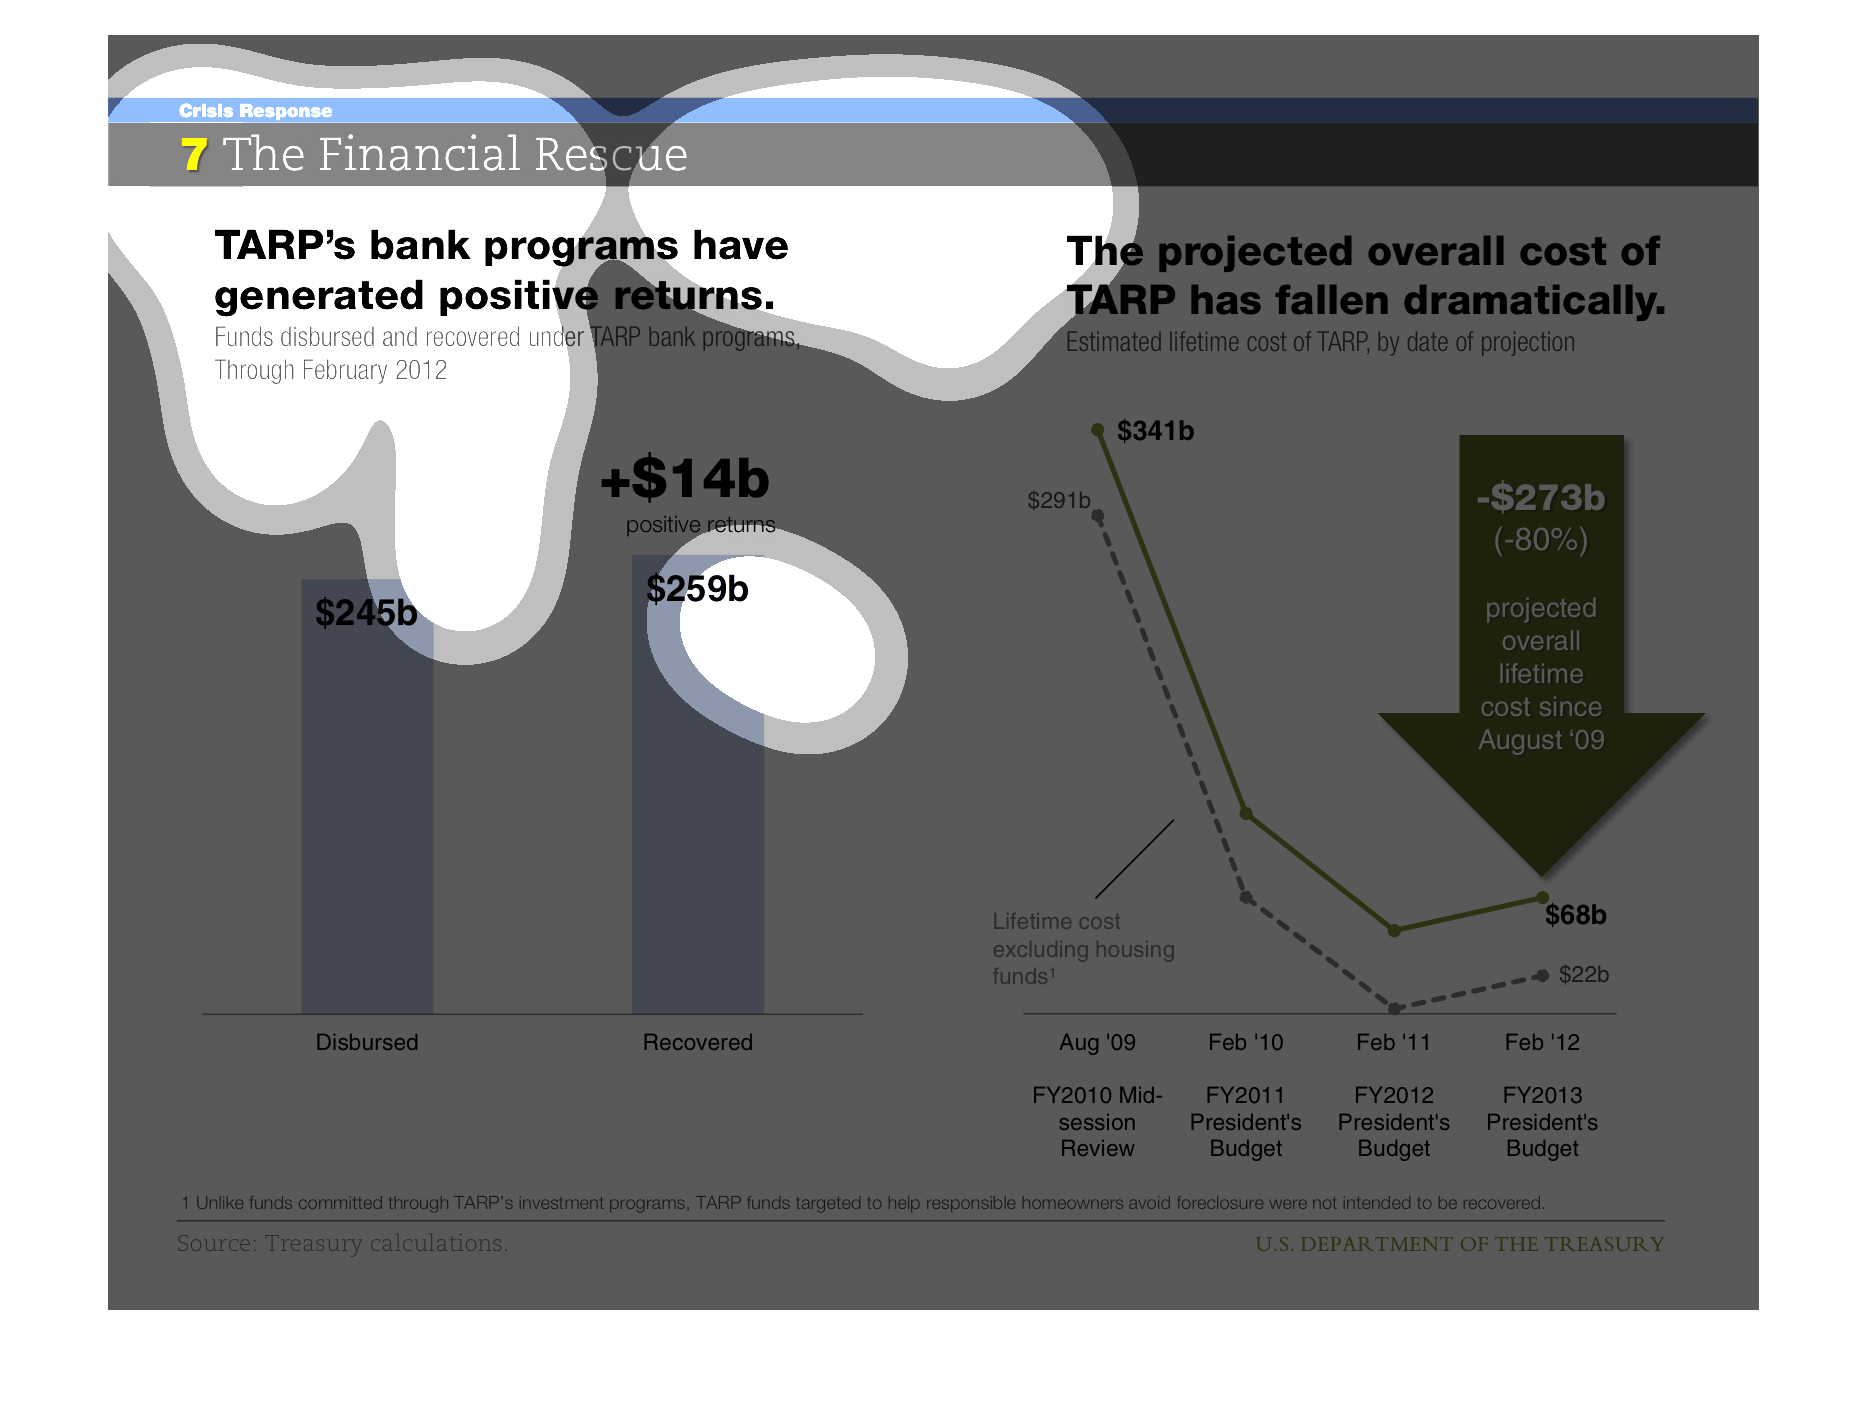
This graphic analyzes TARP bank programs - both in terms of cost and returns. The graph shows
that projected cost has declined ($341 billion down to $68 billion) whereas returns have risen
(up $14 billion from $245 billion, a 5% increase).