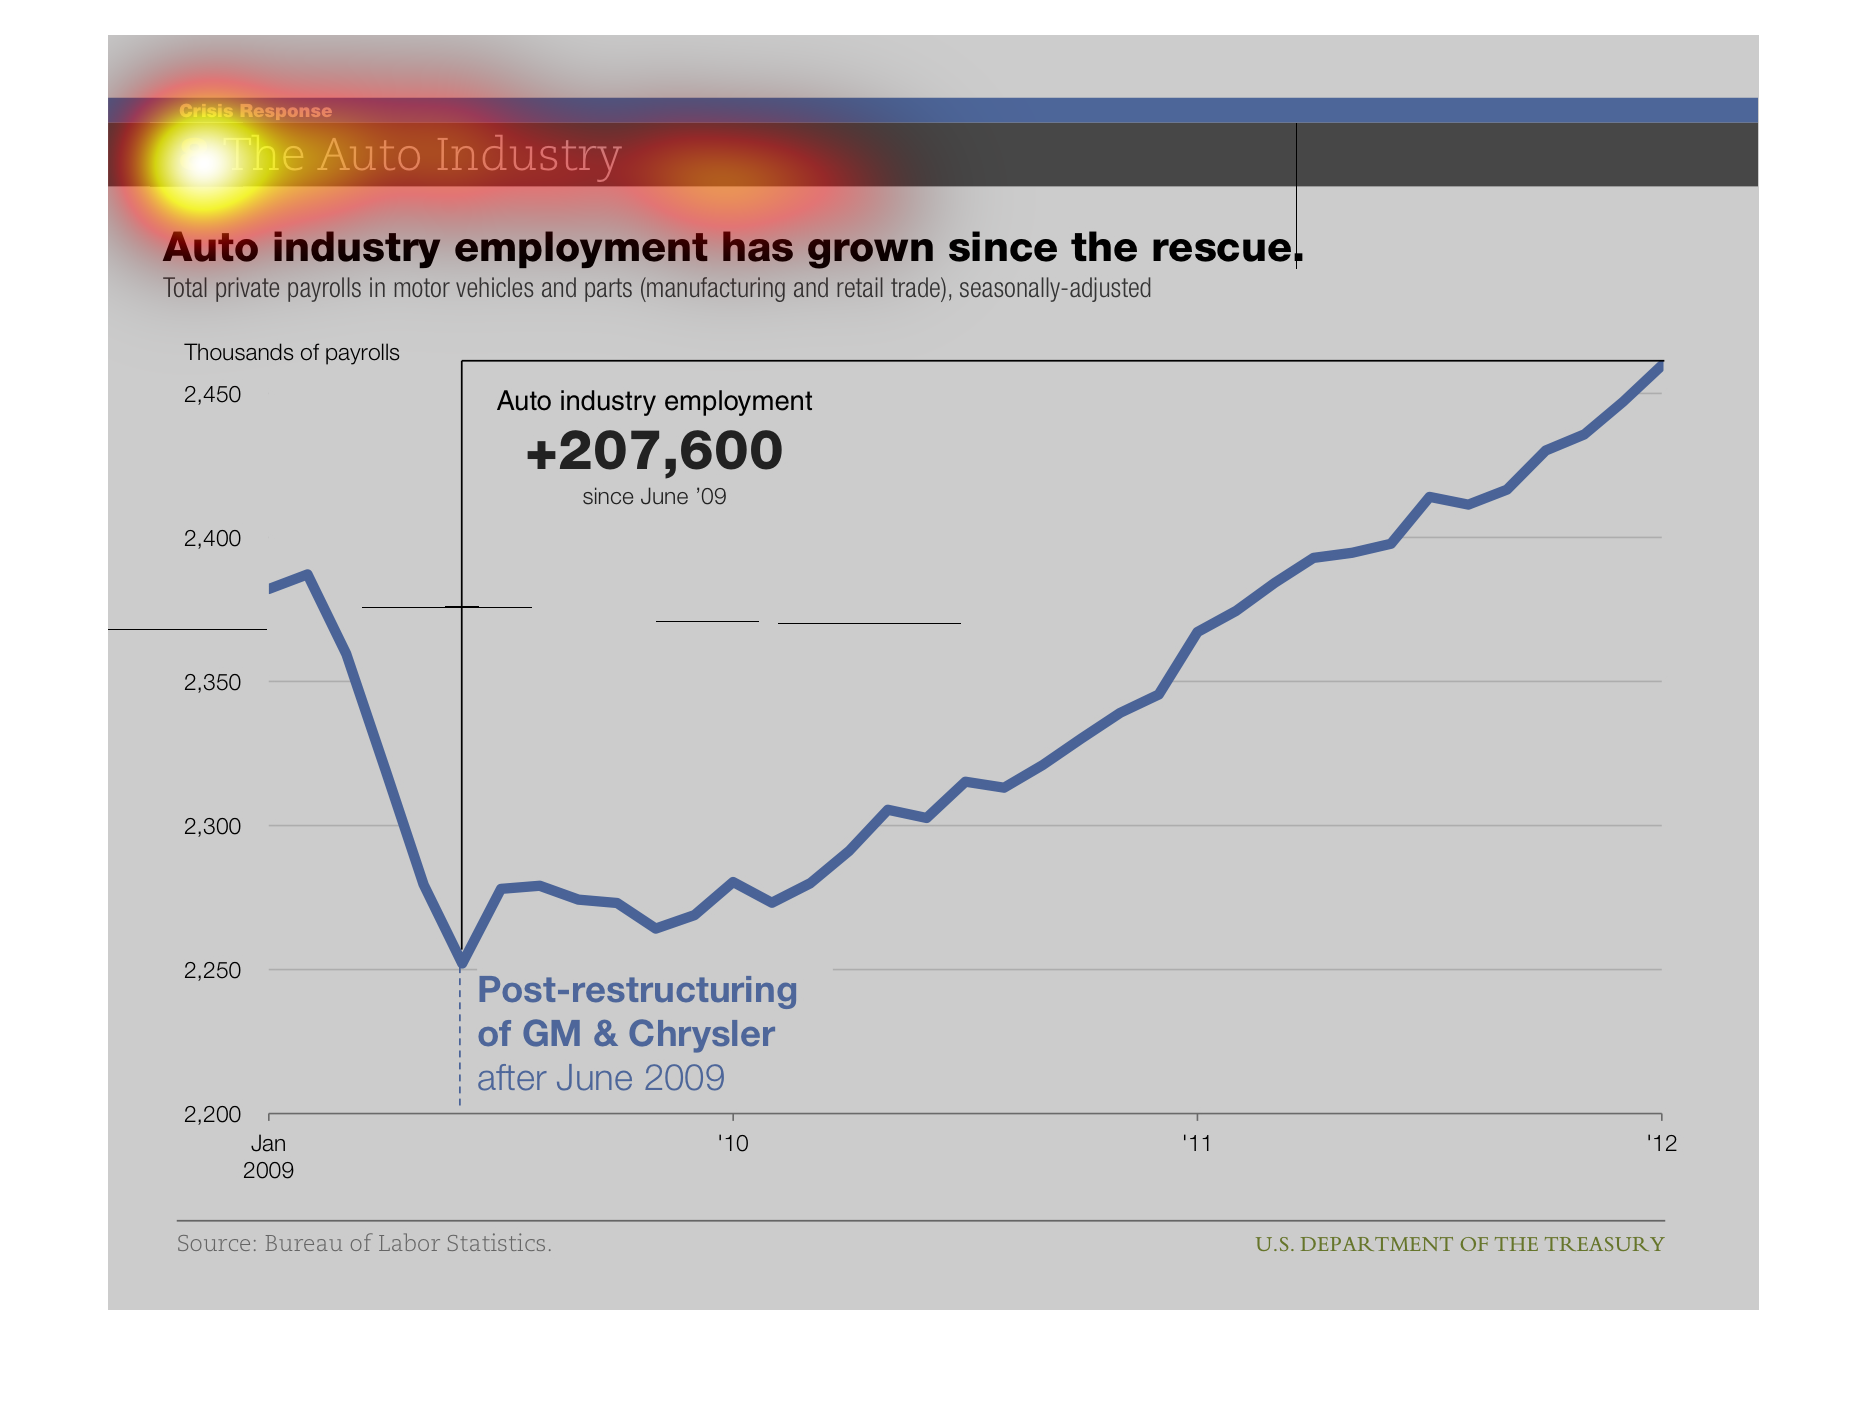
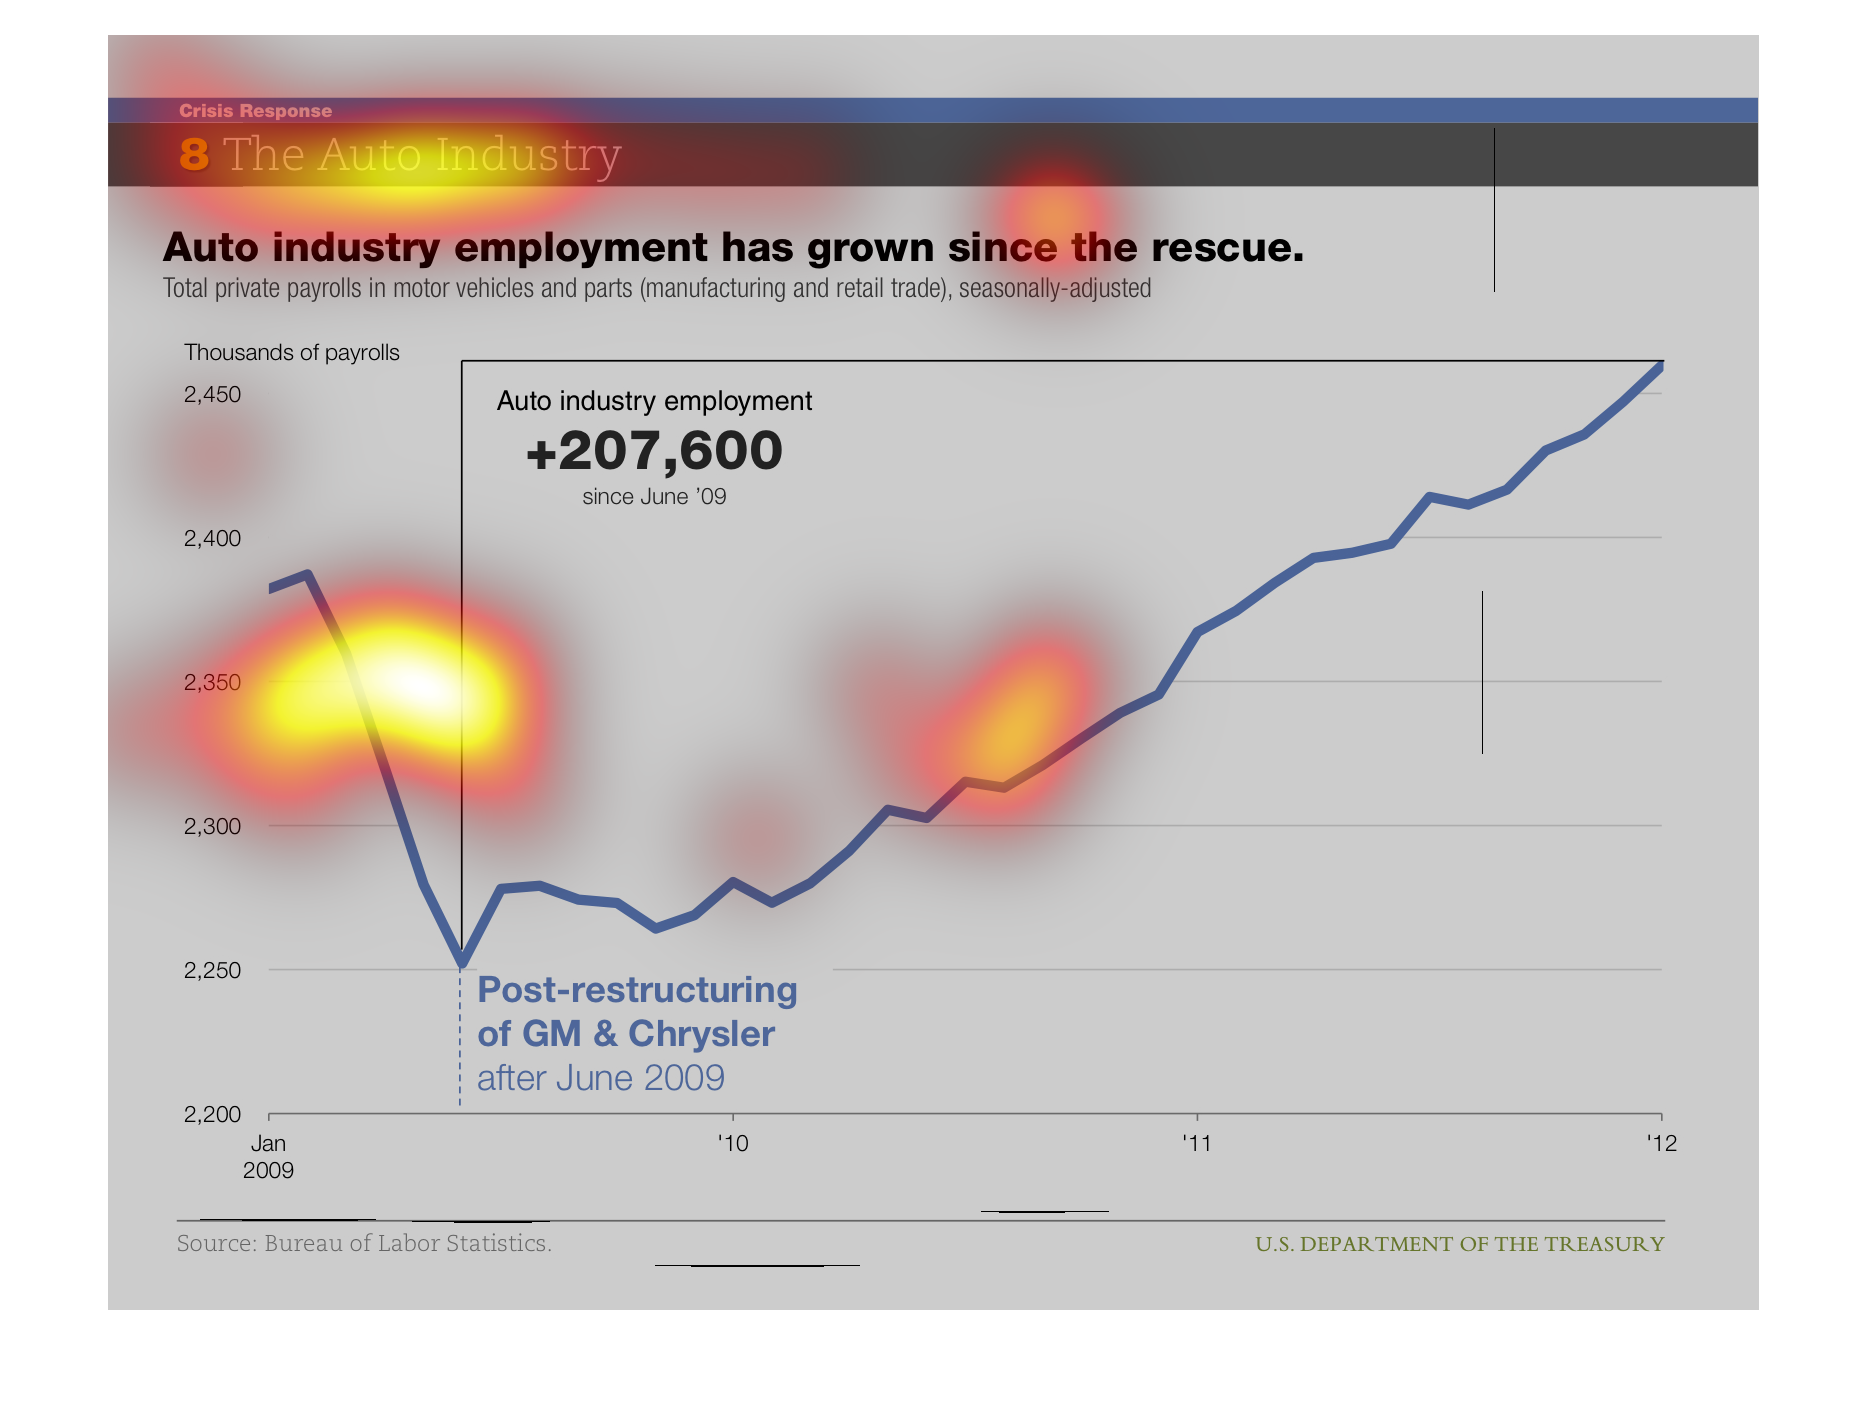
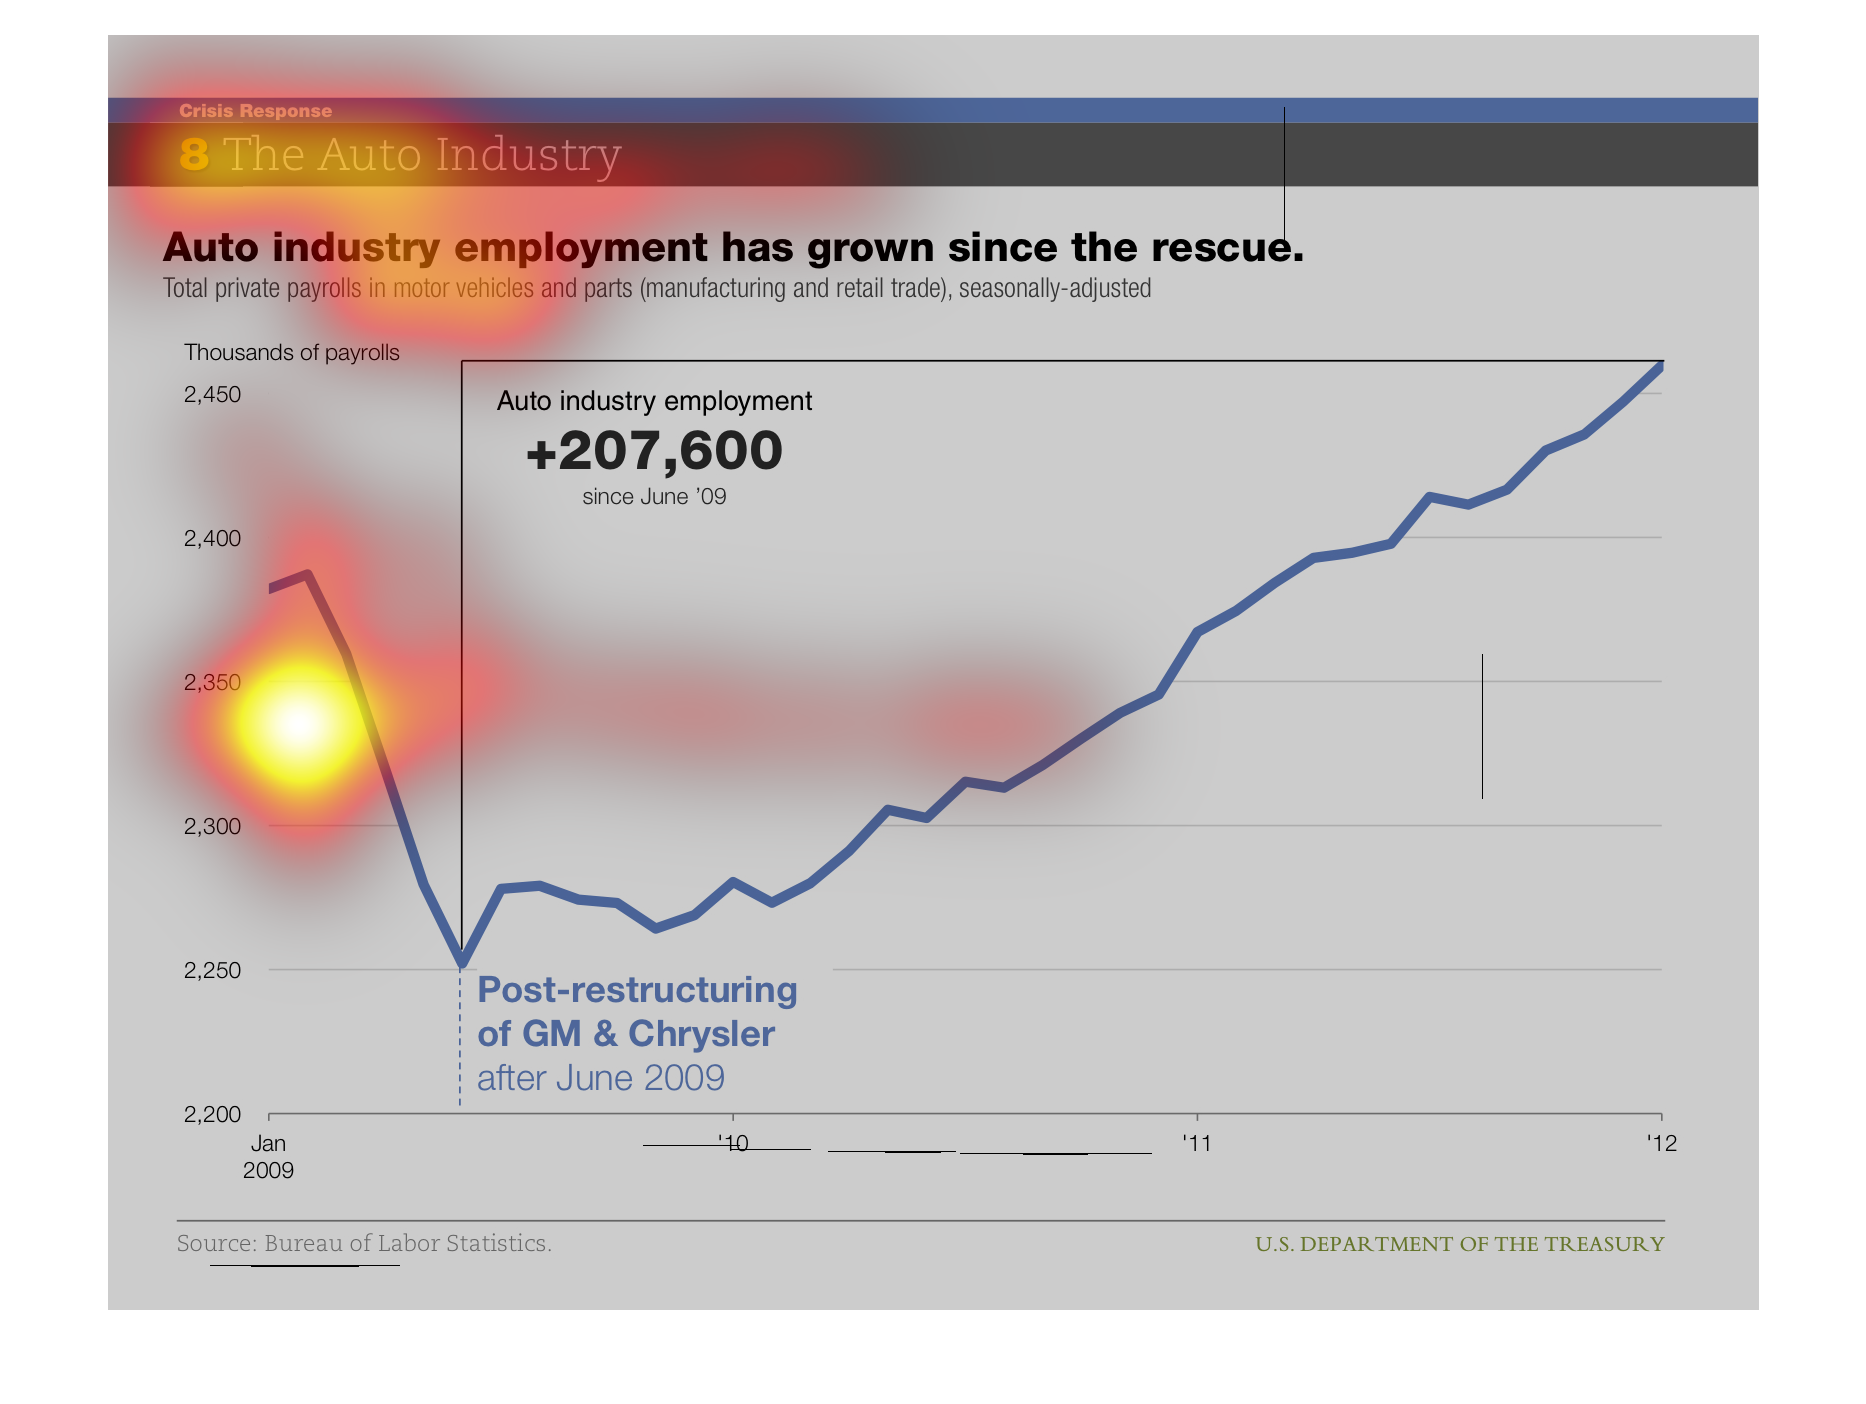
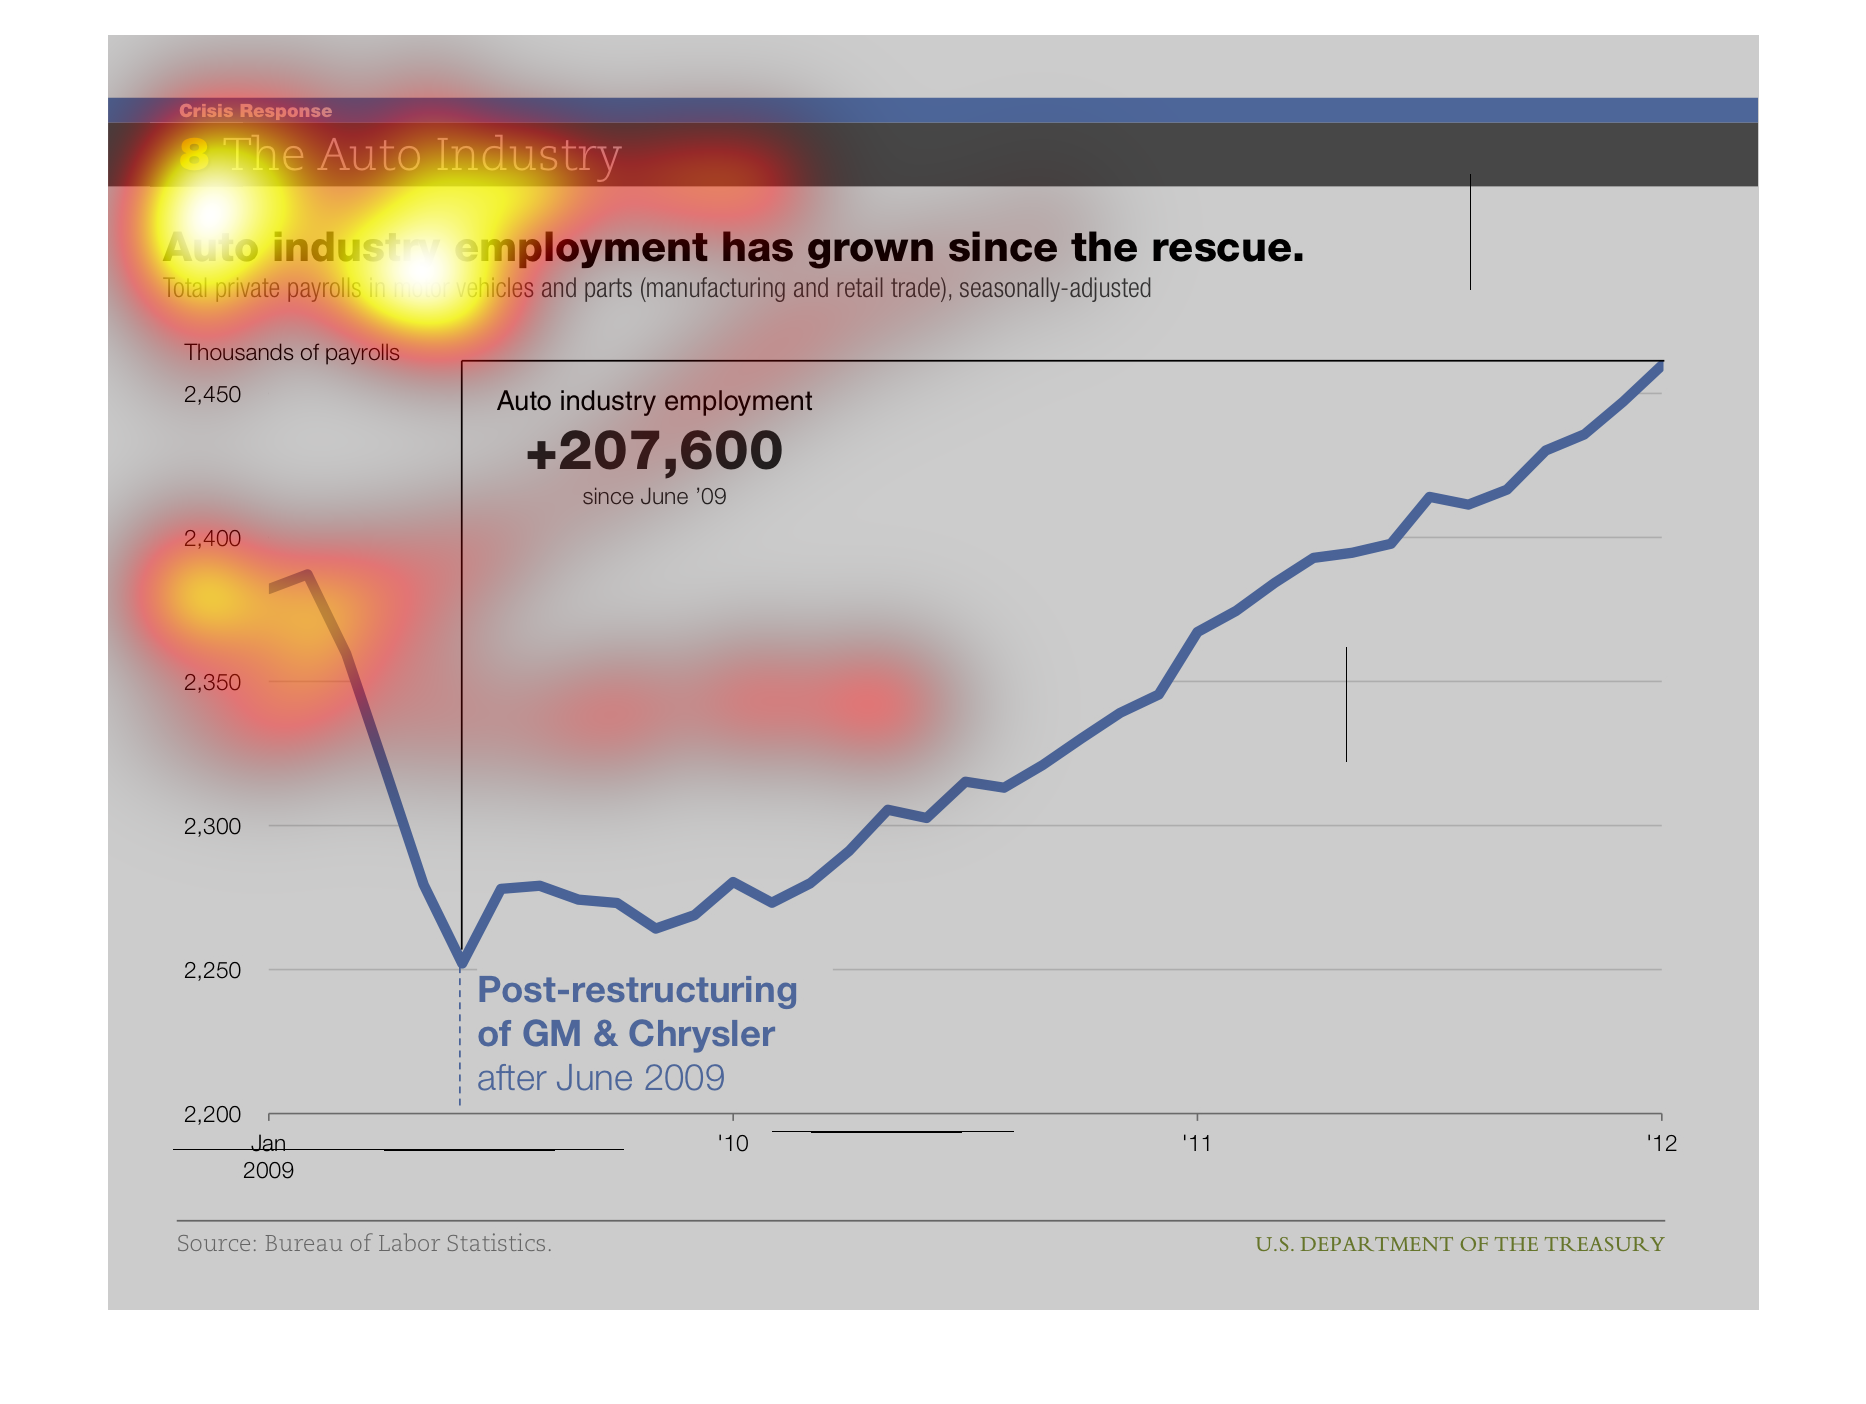
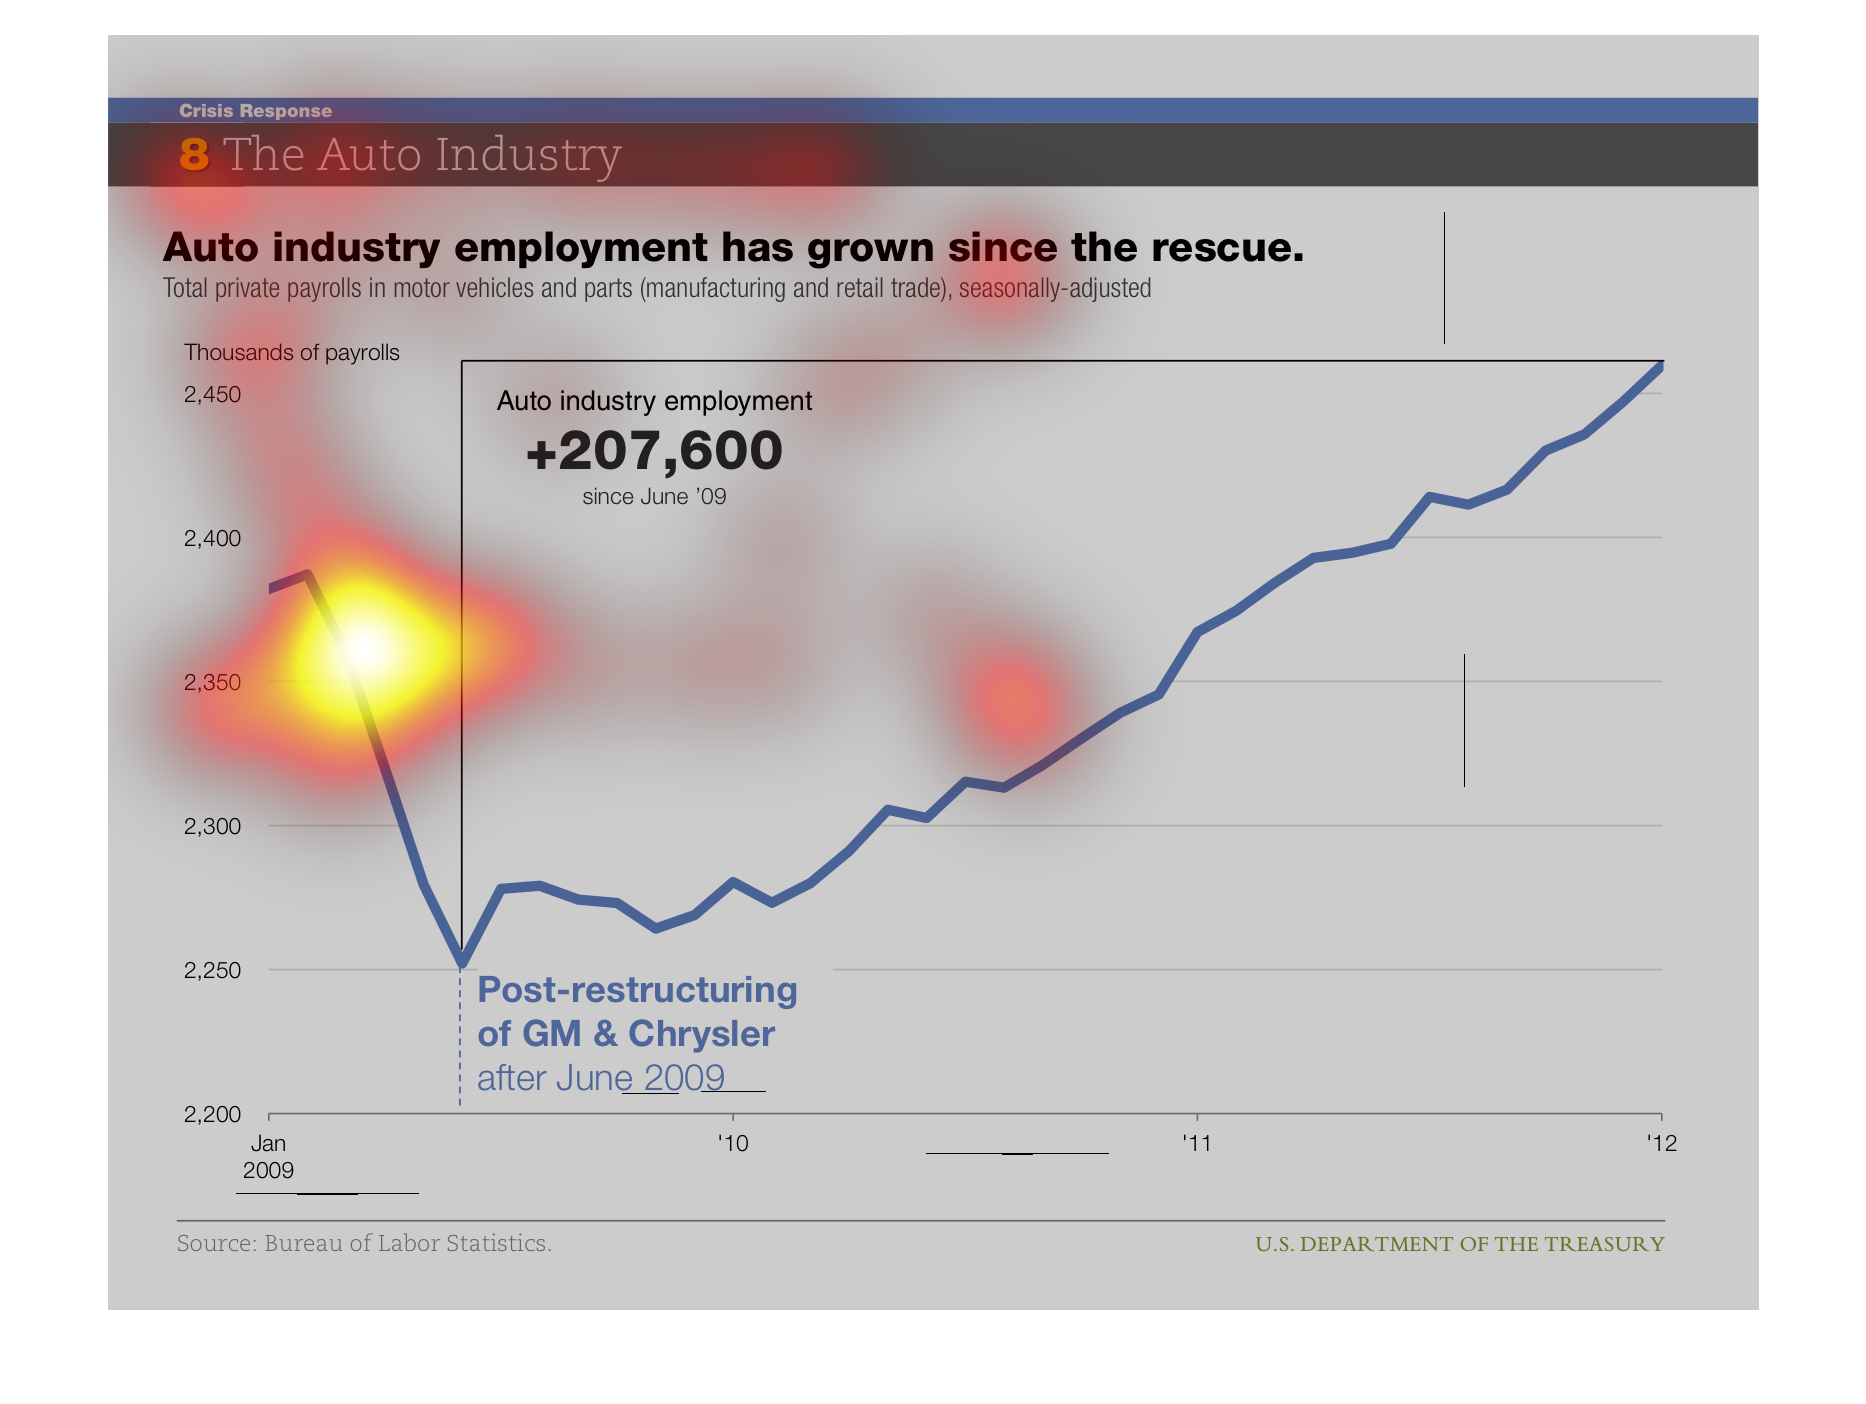
This chart displays the Auto industry. It is information for the Auto industry employment
has growth since the rescue, which was the bailout that Obama initiated.
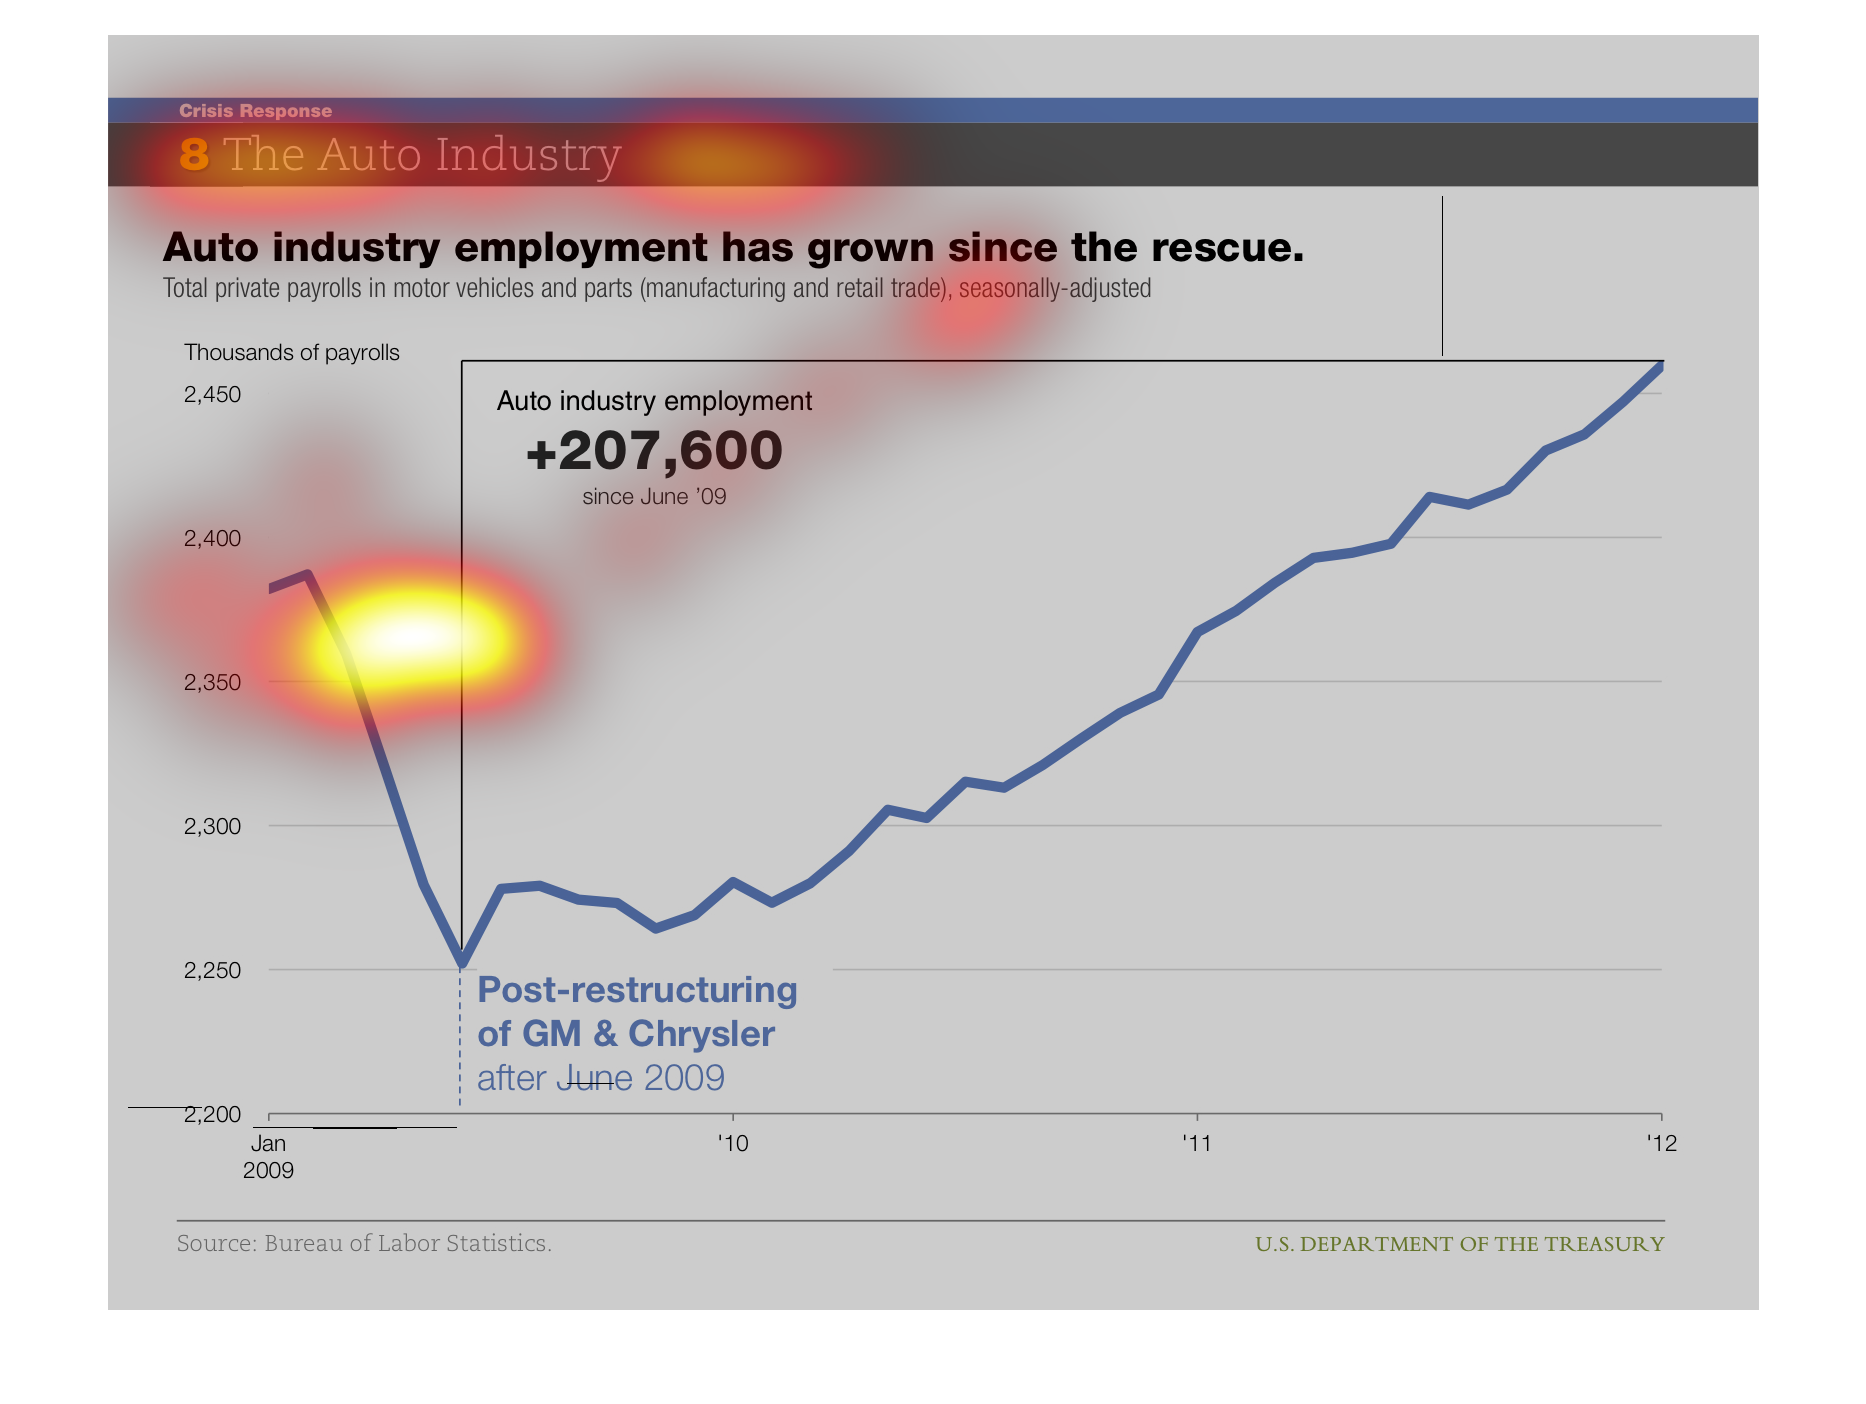
Auto industry employment has grown since rescue. 207,600 jobs since the rescue, showing a
steady increase in jobs since June 2009, rescue referring to the GM and chrysler rescue
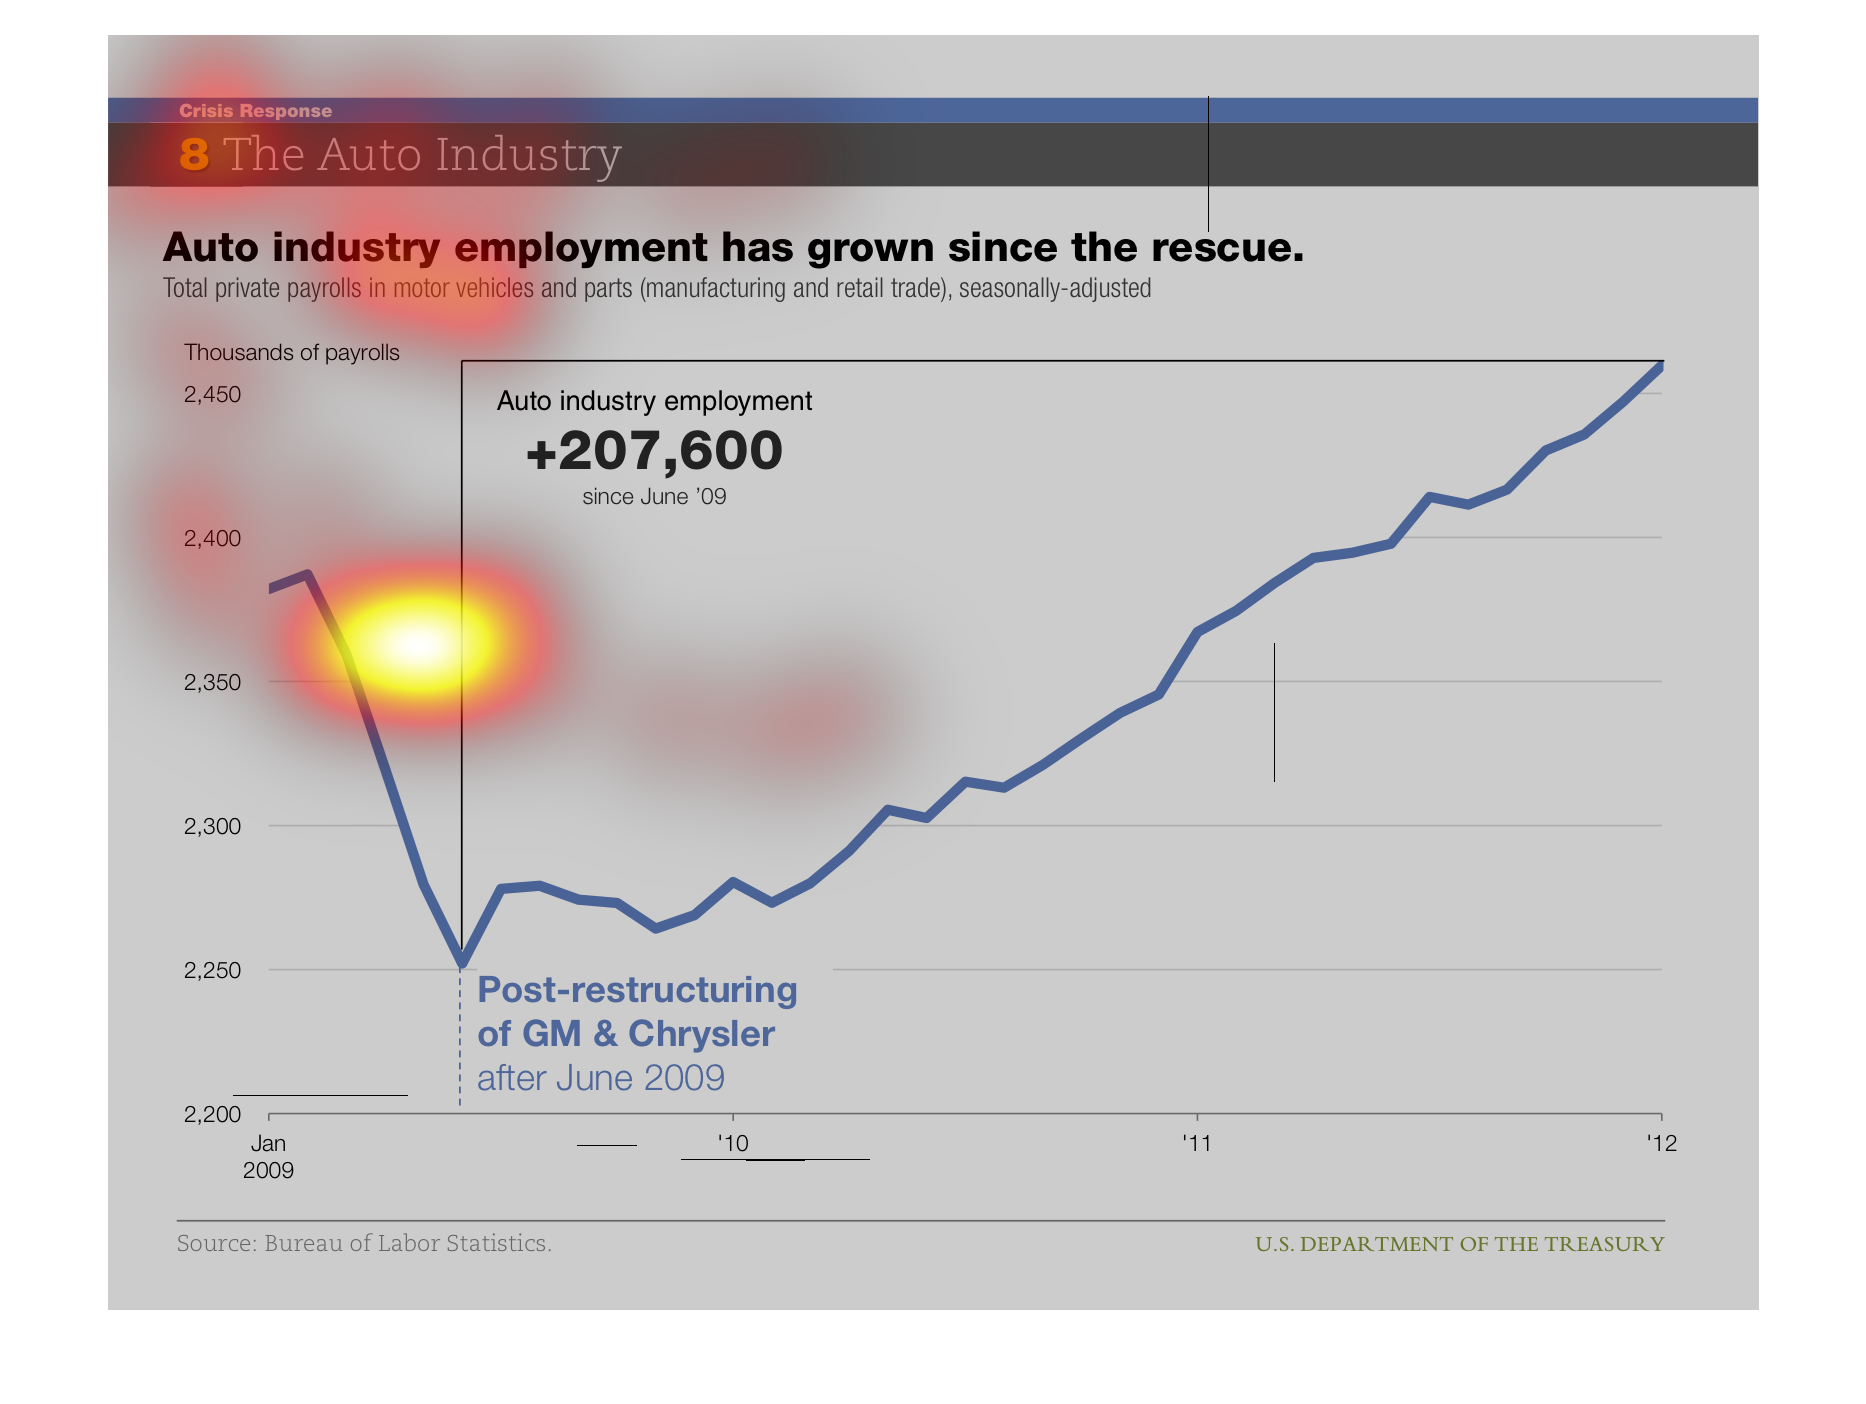
the auto industry employment had an increase of over 200,000 new employees since june 2009.
after the reconstruction of the the auto industry there was an all time high year spike regarding
new employees in the year 2012.
This chart describes that auto industry employment has grow since the rescue. The highest
peak on the chart occurred in the year 2012. And the chart is sourced of the Bureau of Labor
Statistics.
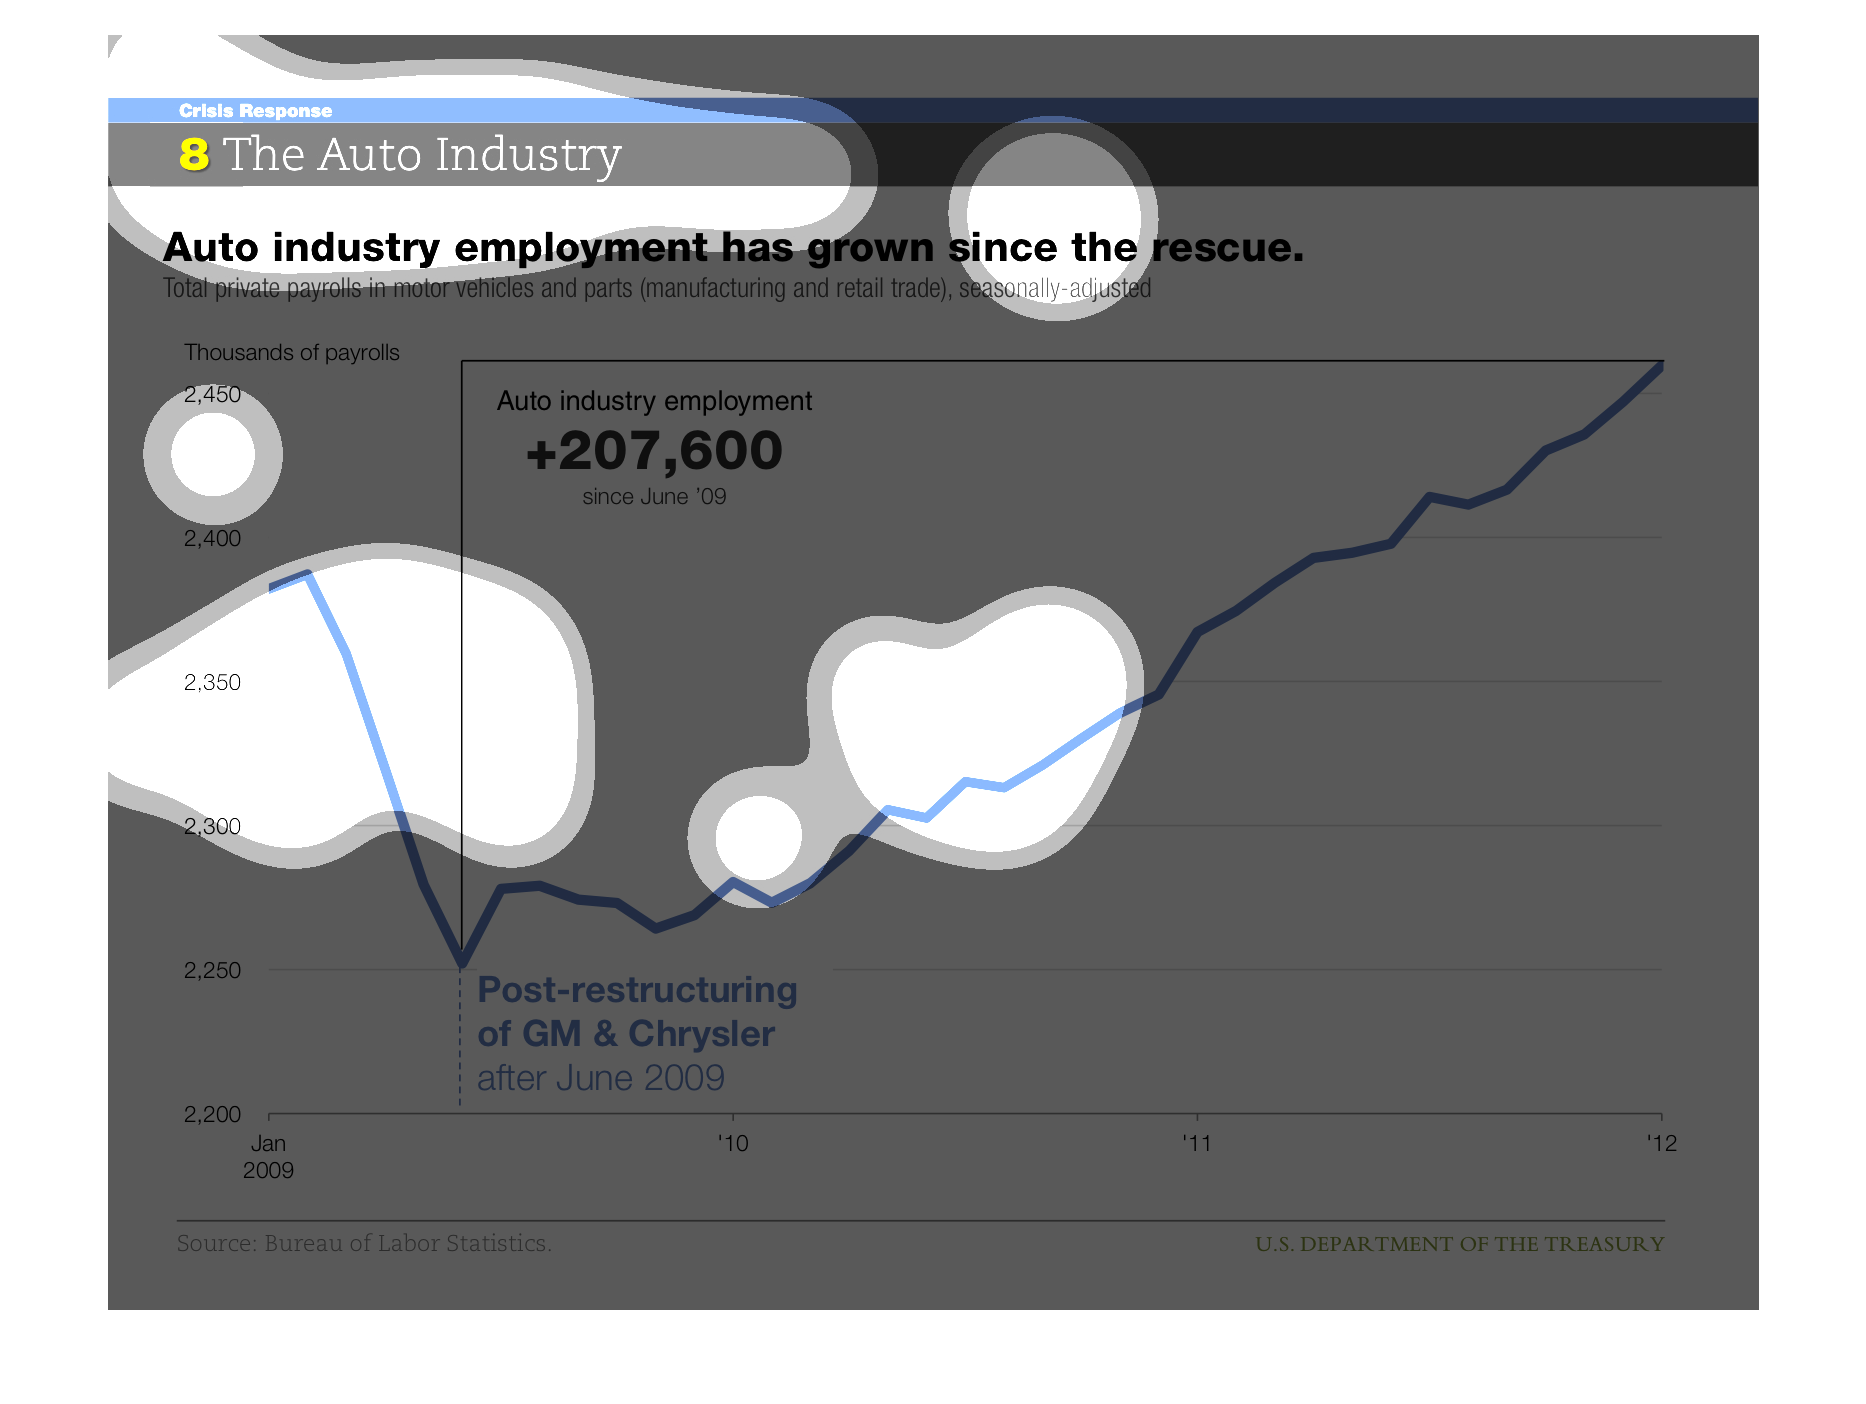
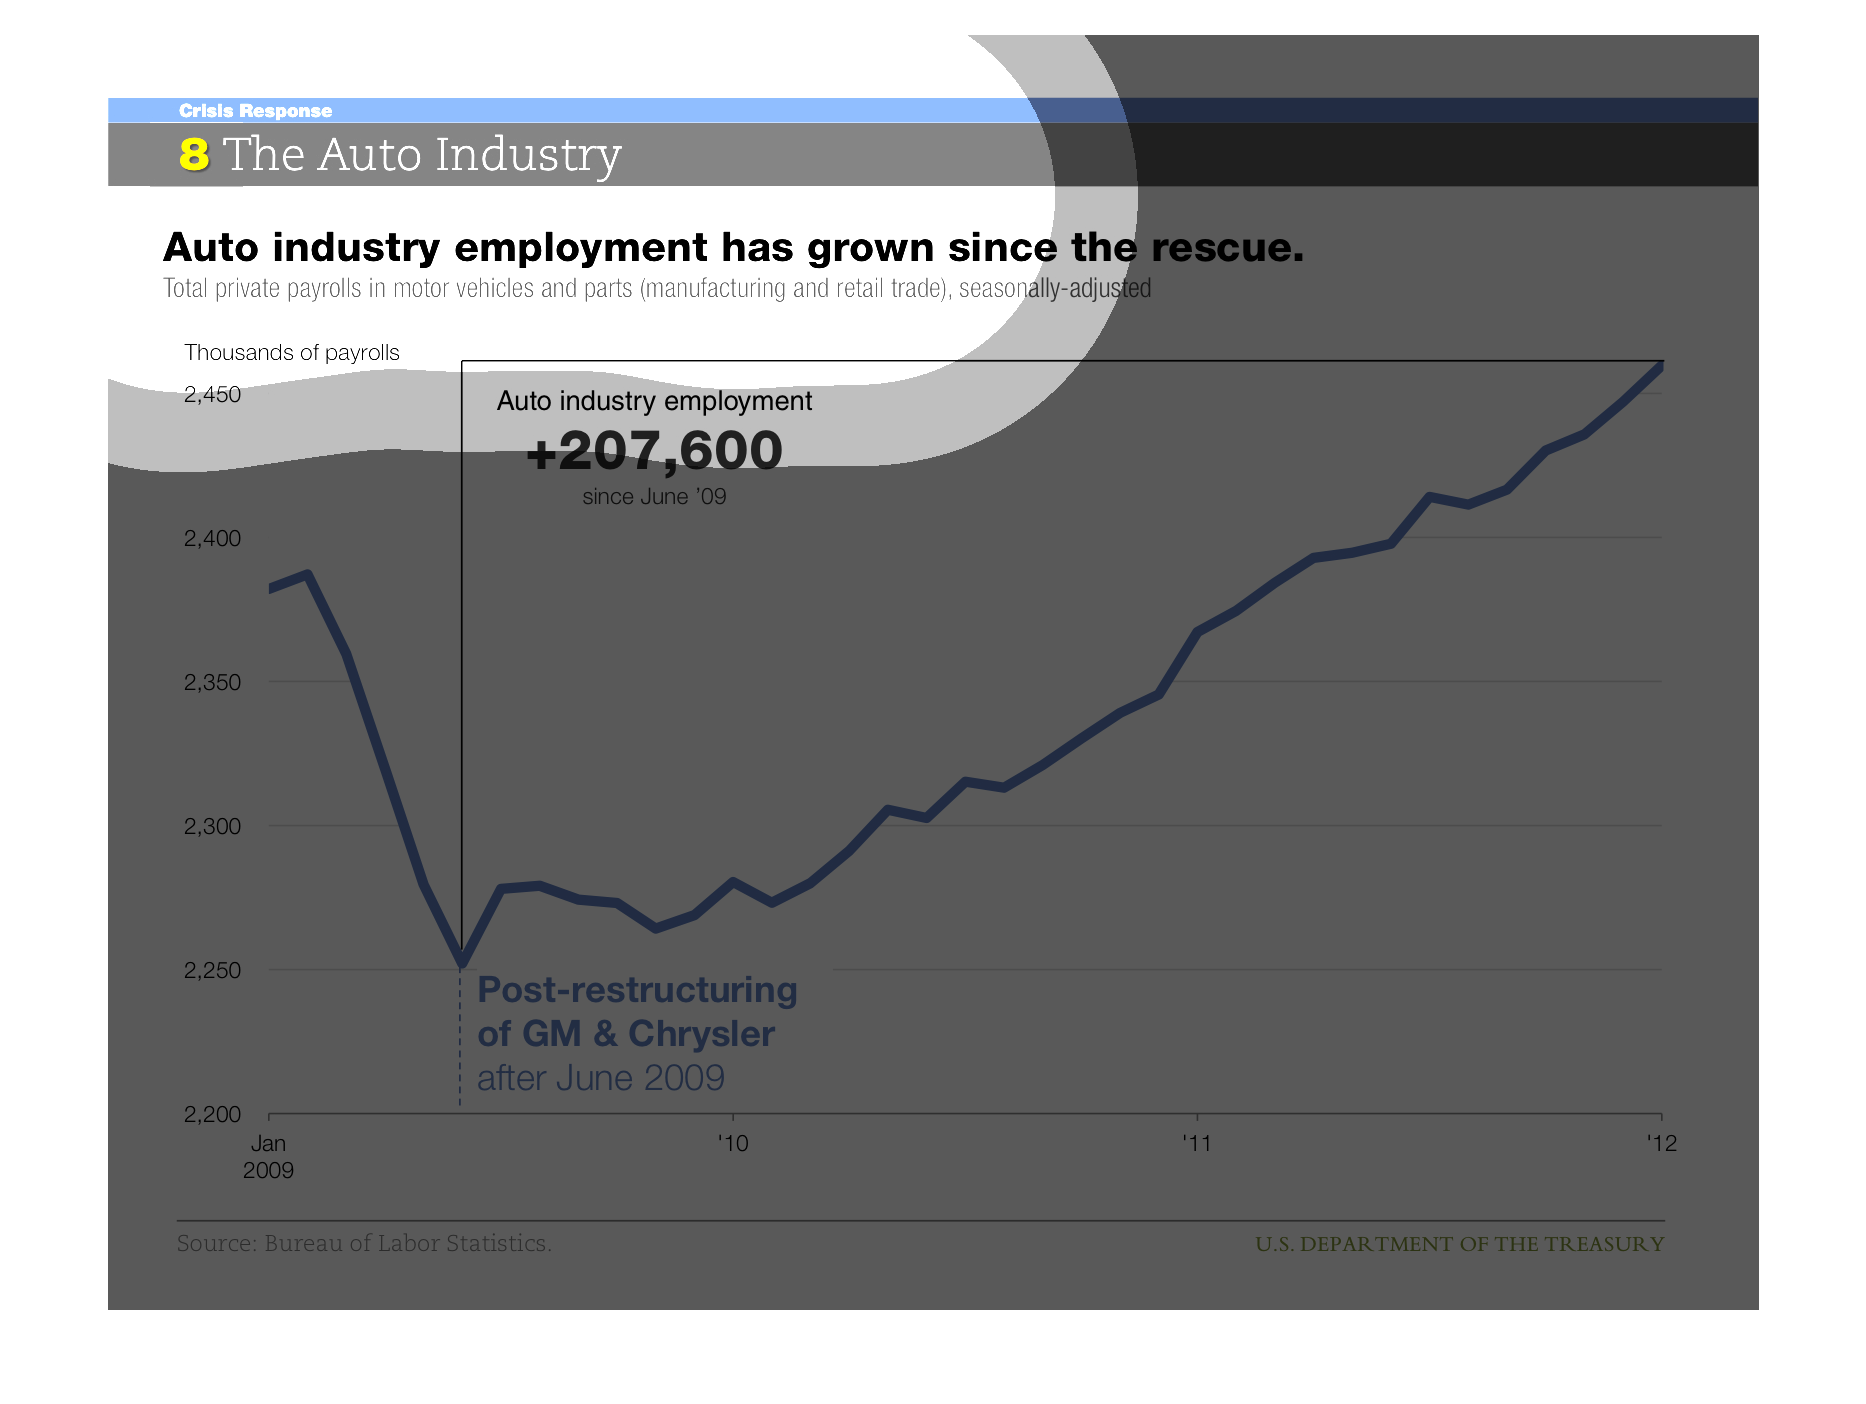
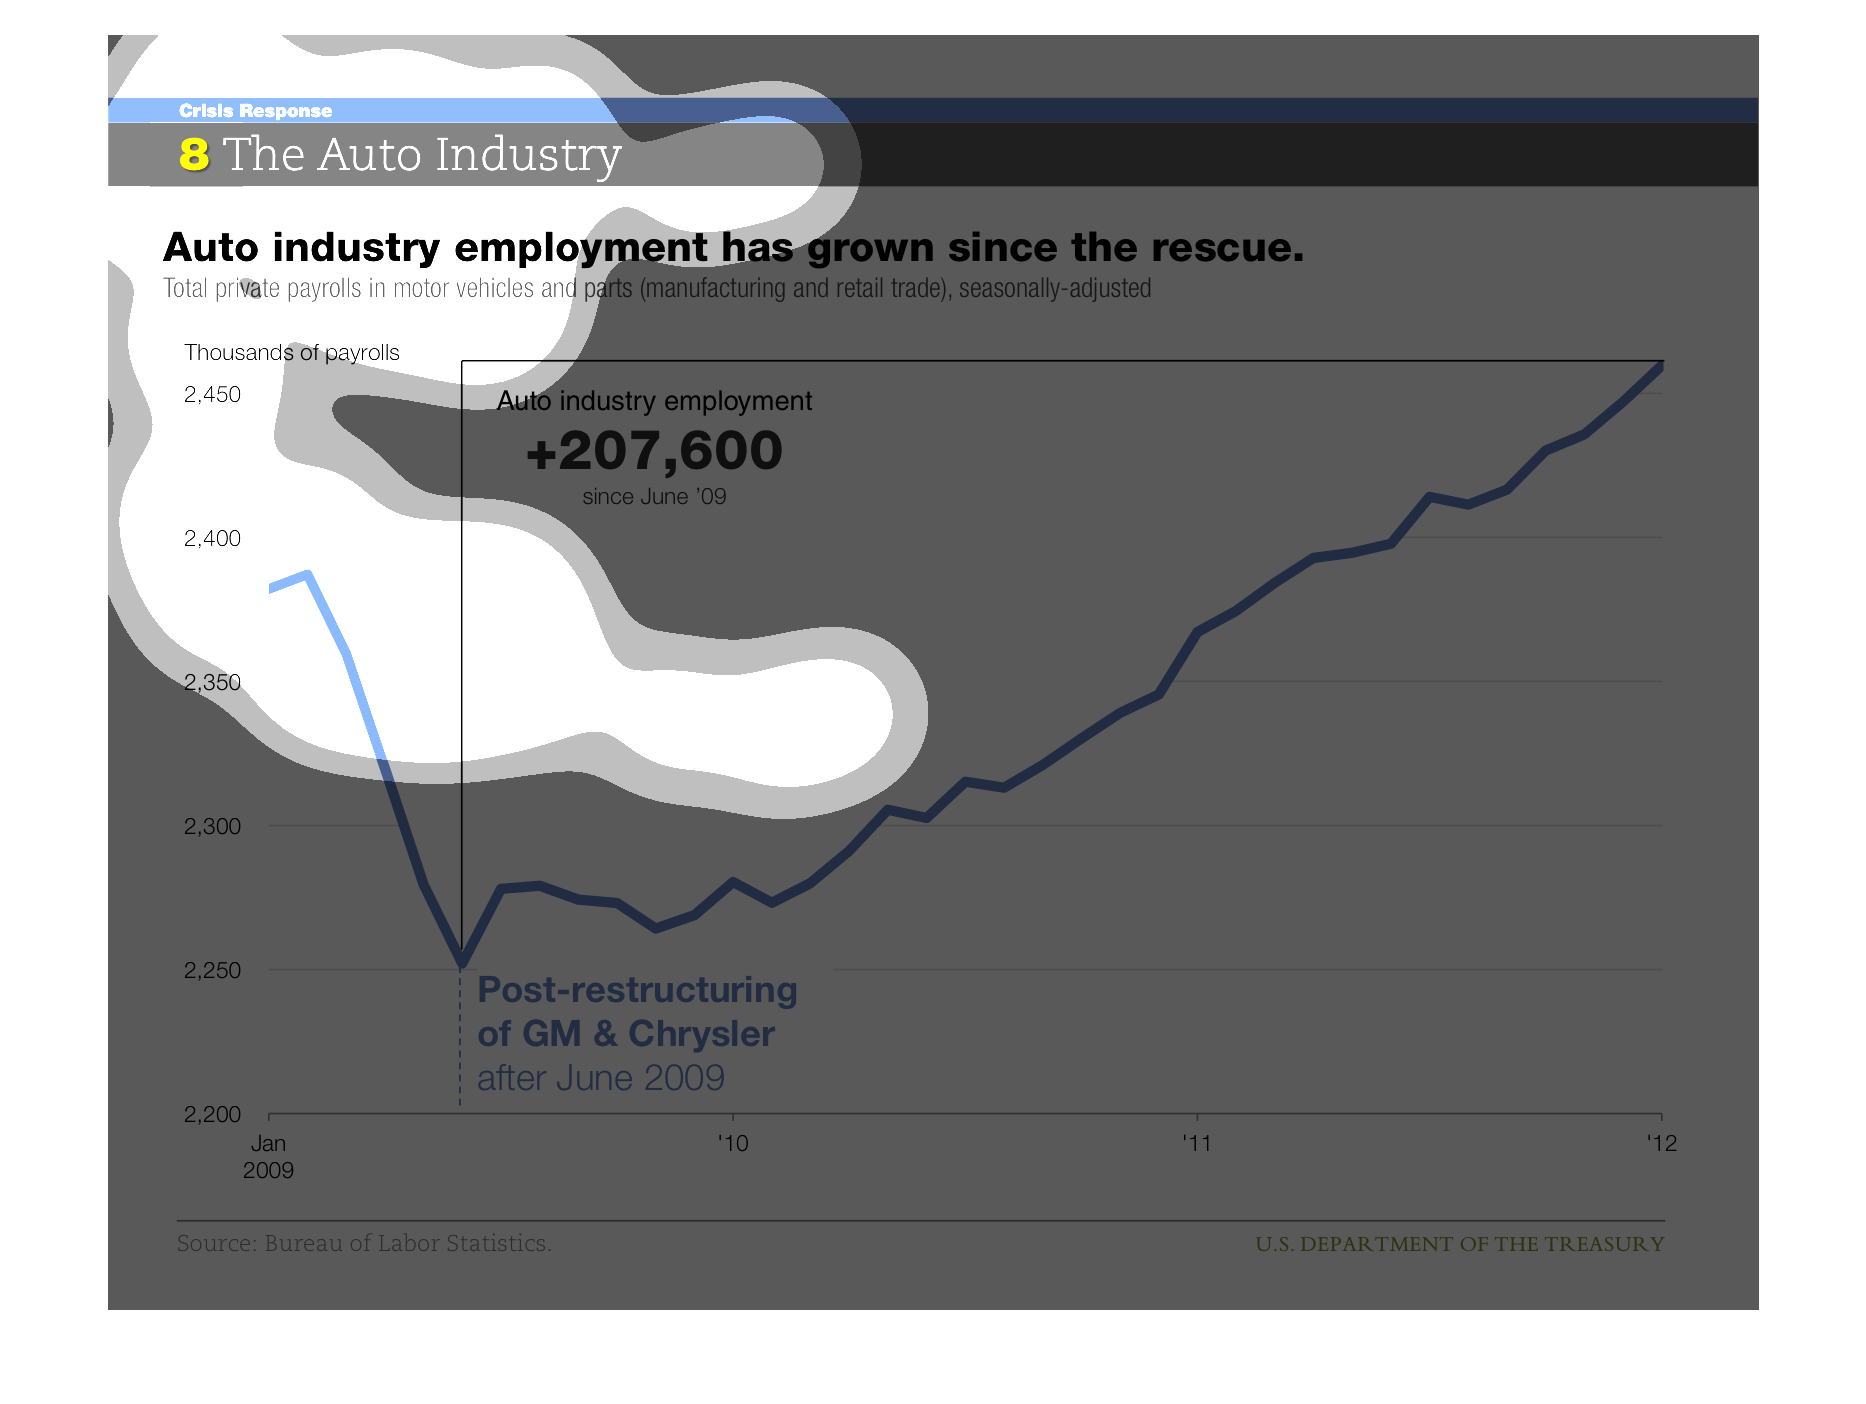
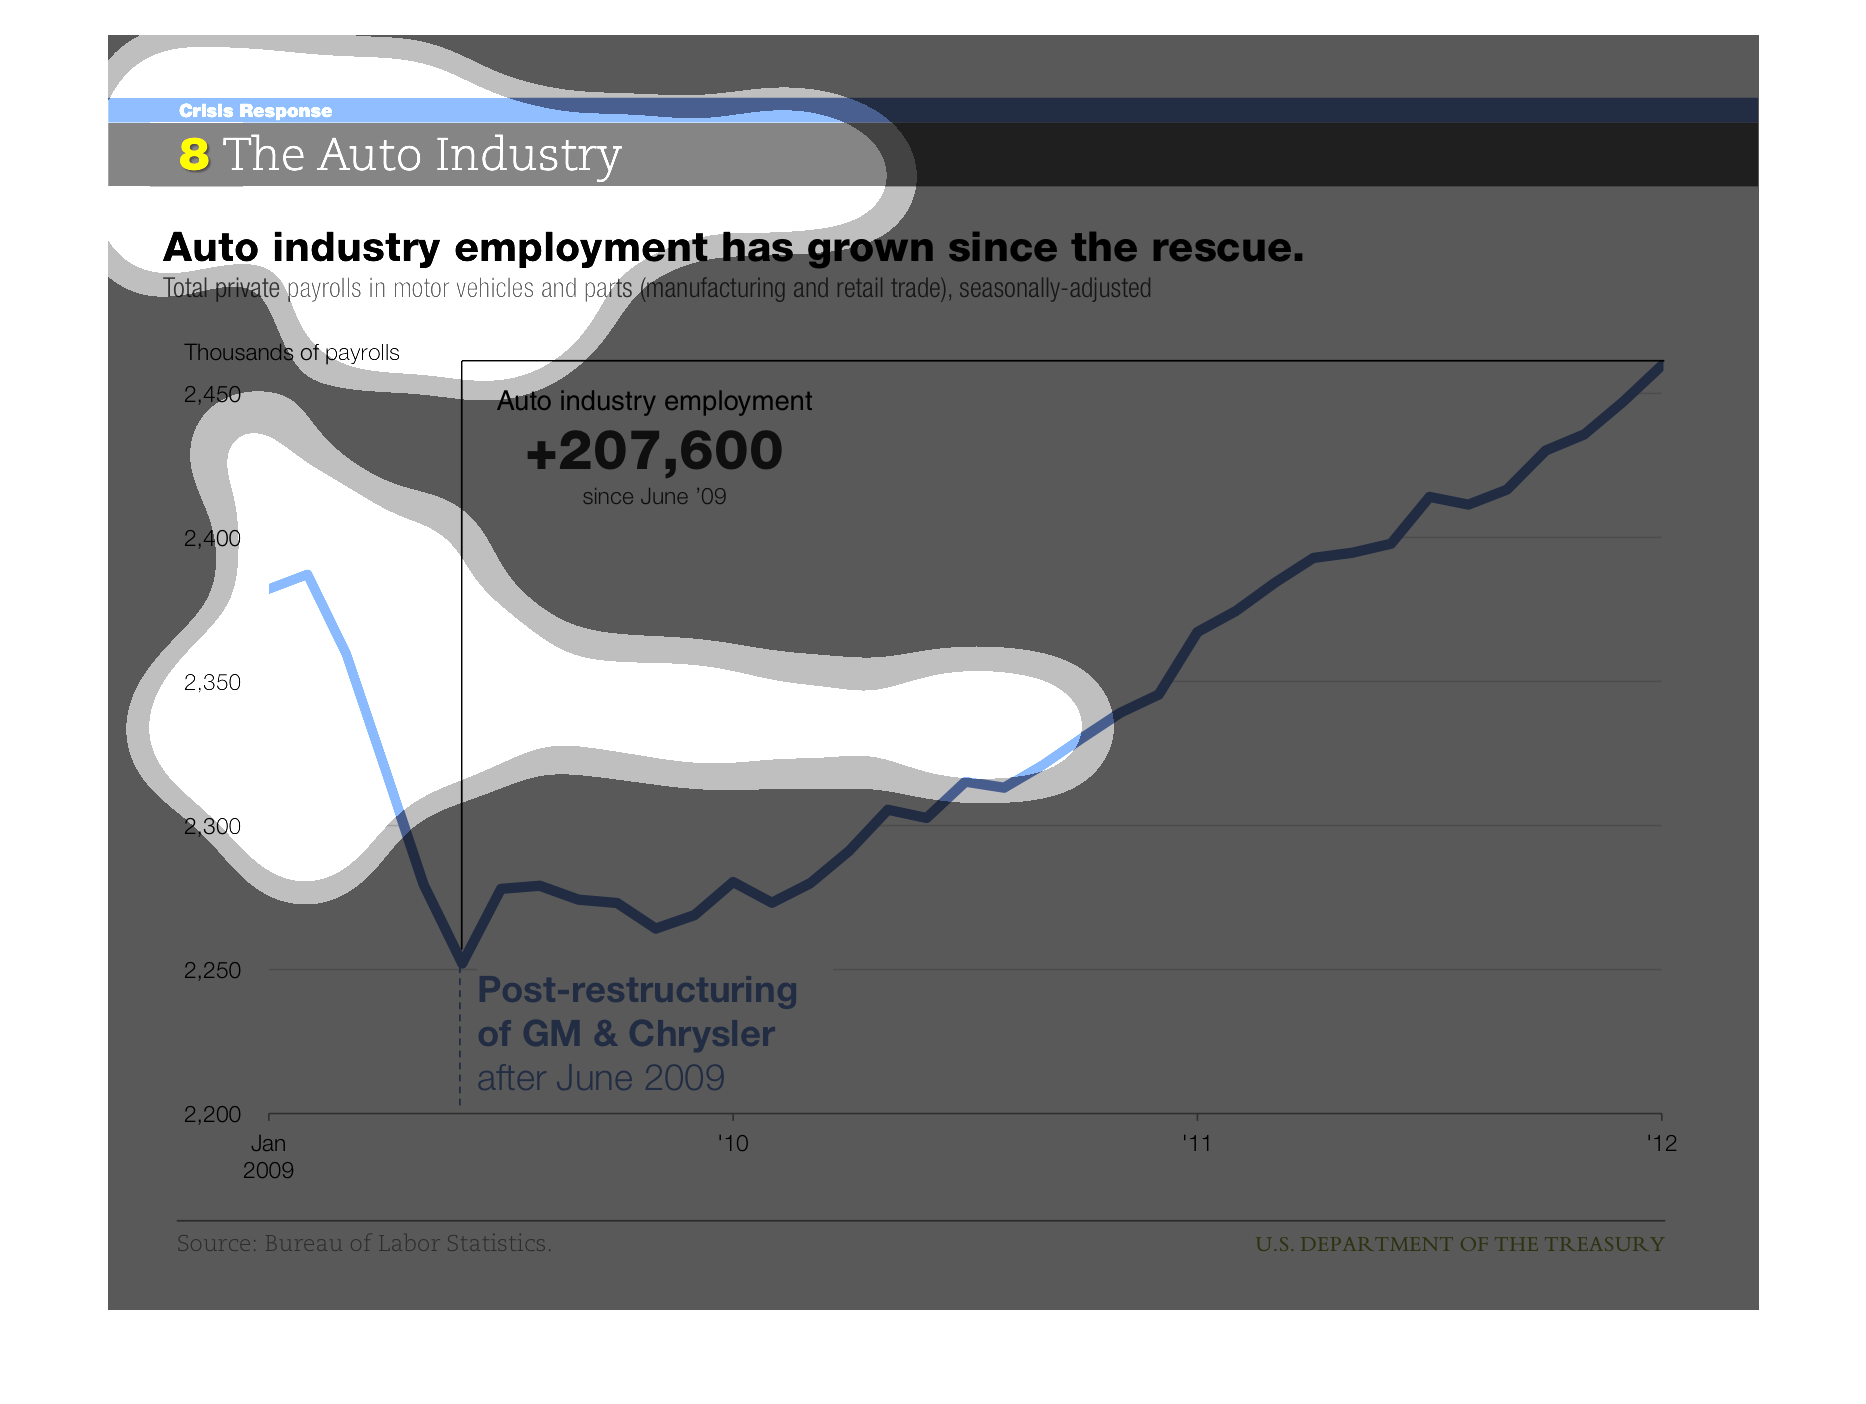
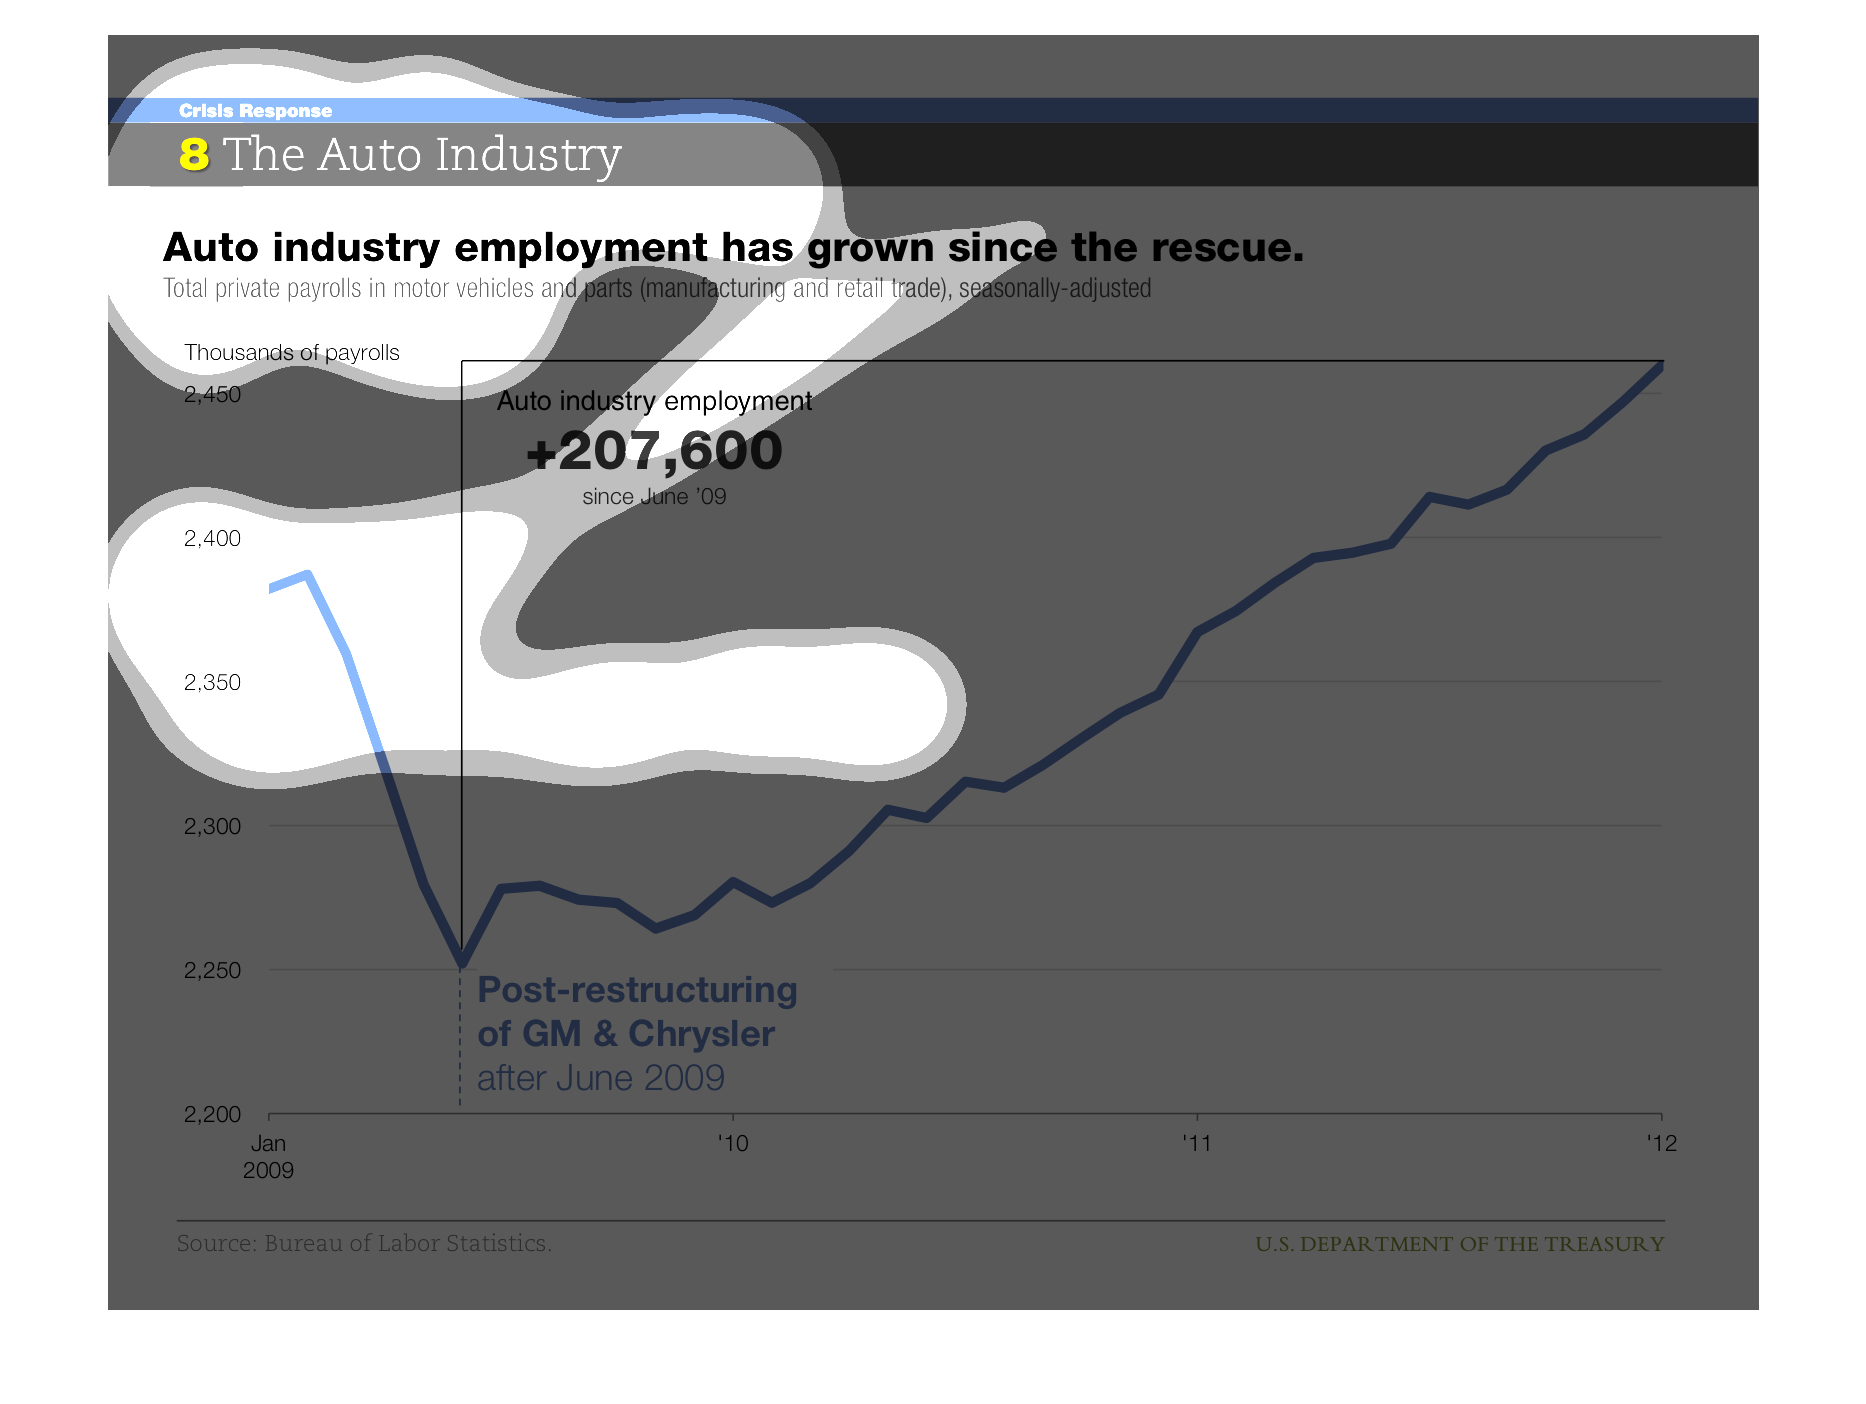
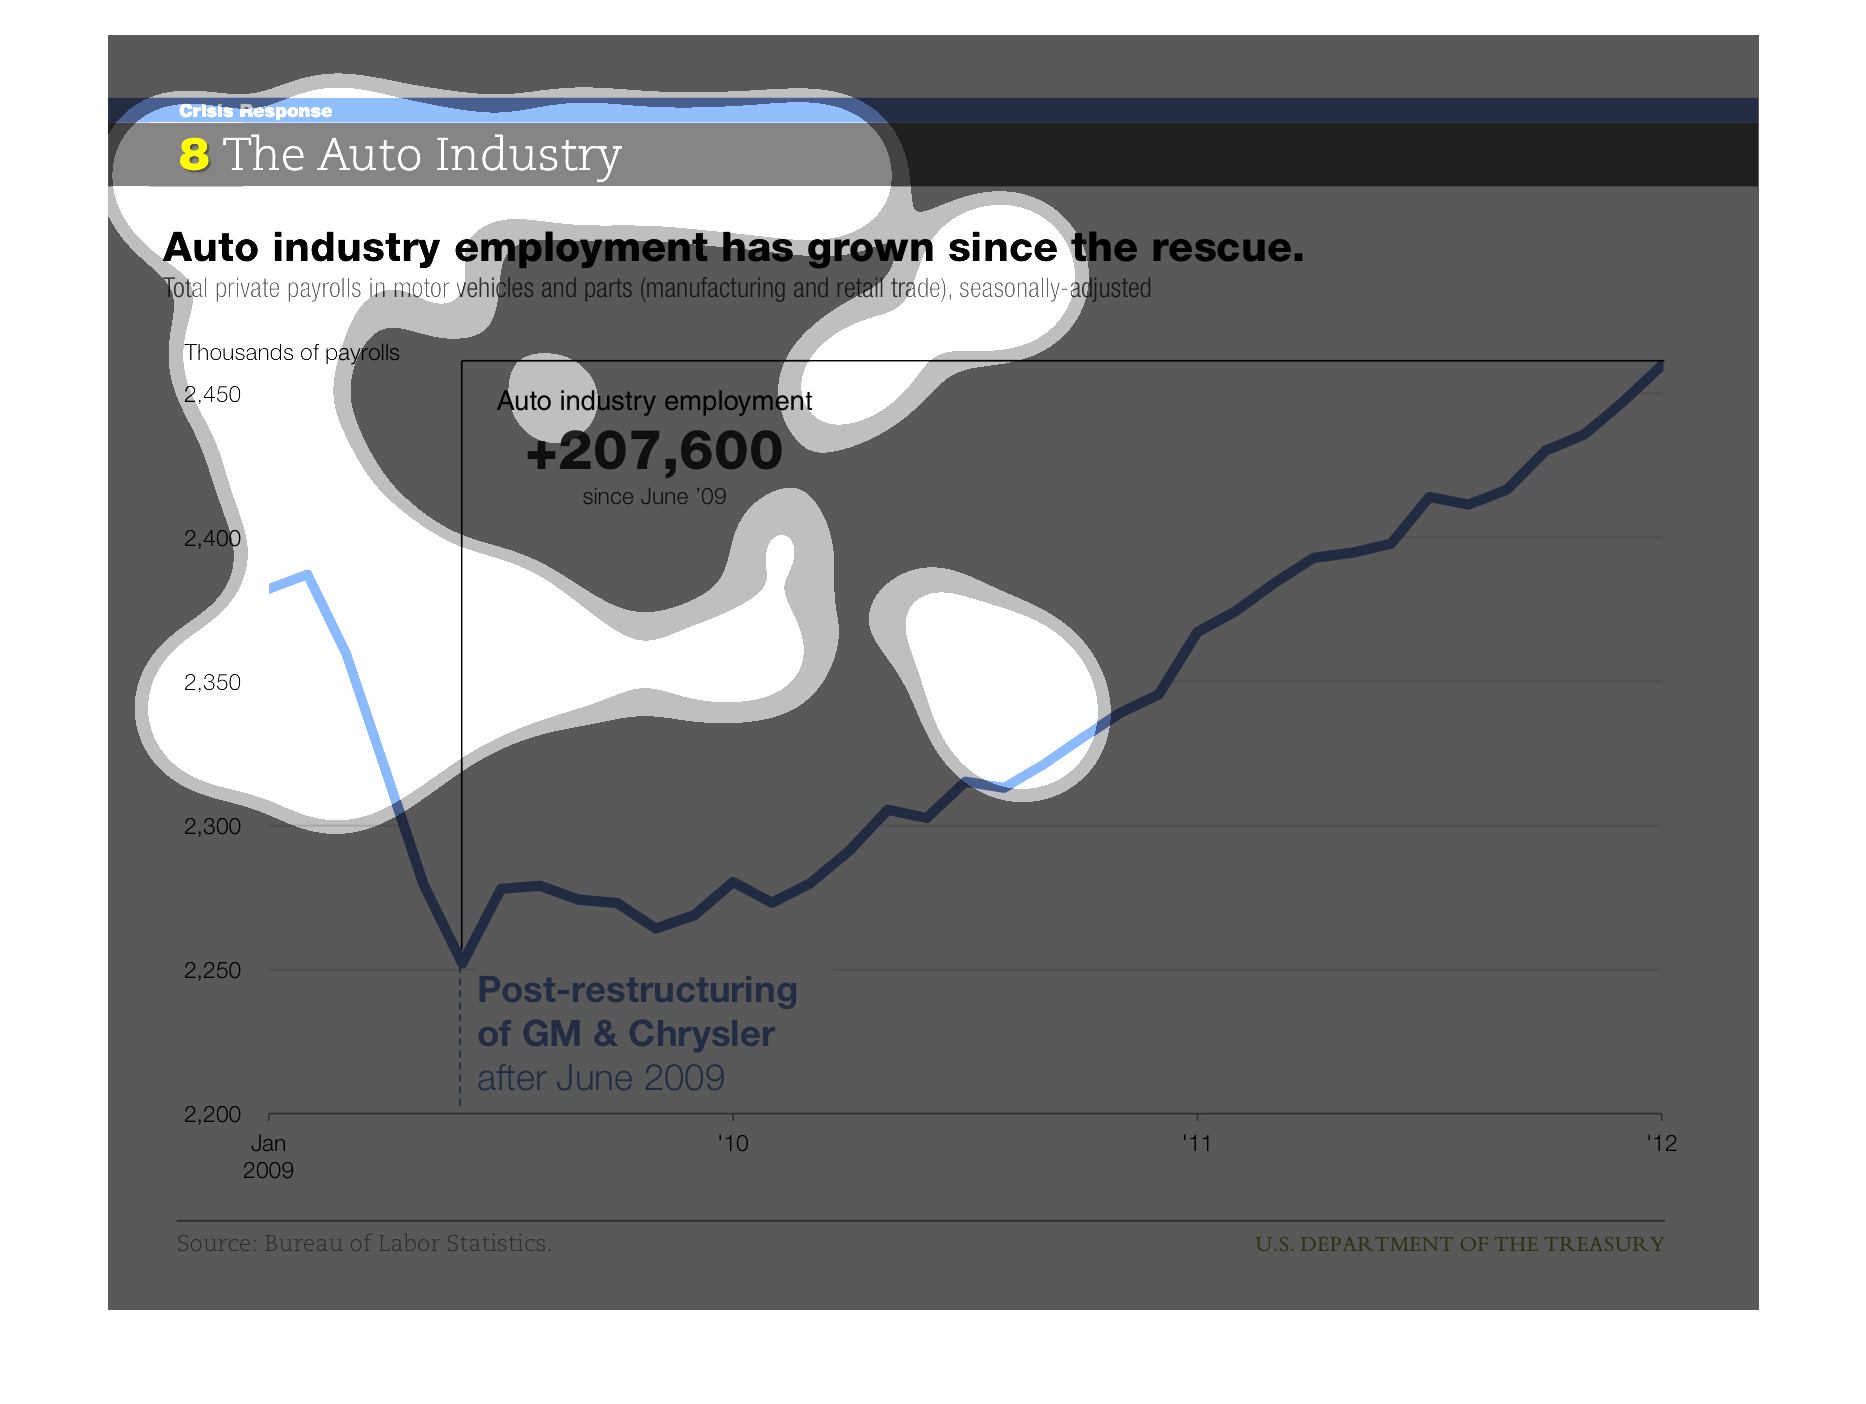
The title of this graph is, "The Auto Industry''.  The sub heading is, 'Auto industry employment
has grown since the rescue'.  The data in this graphs displays information on GM and Chrysler
after the two companies have been restructured.
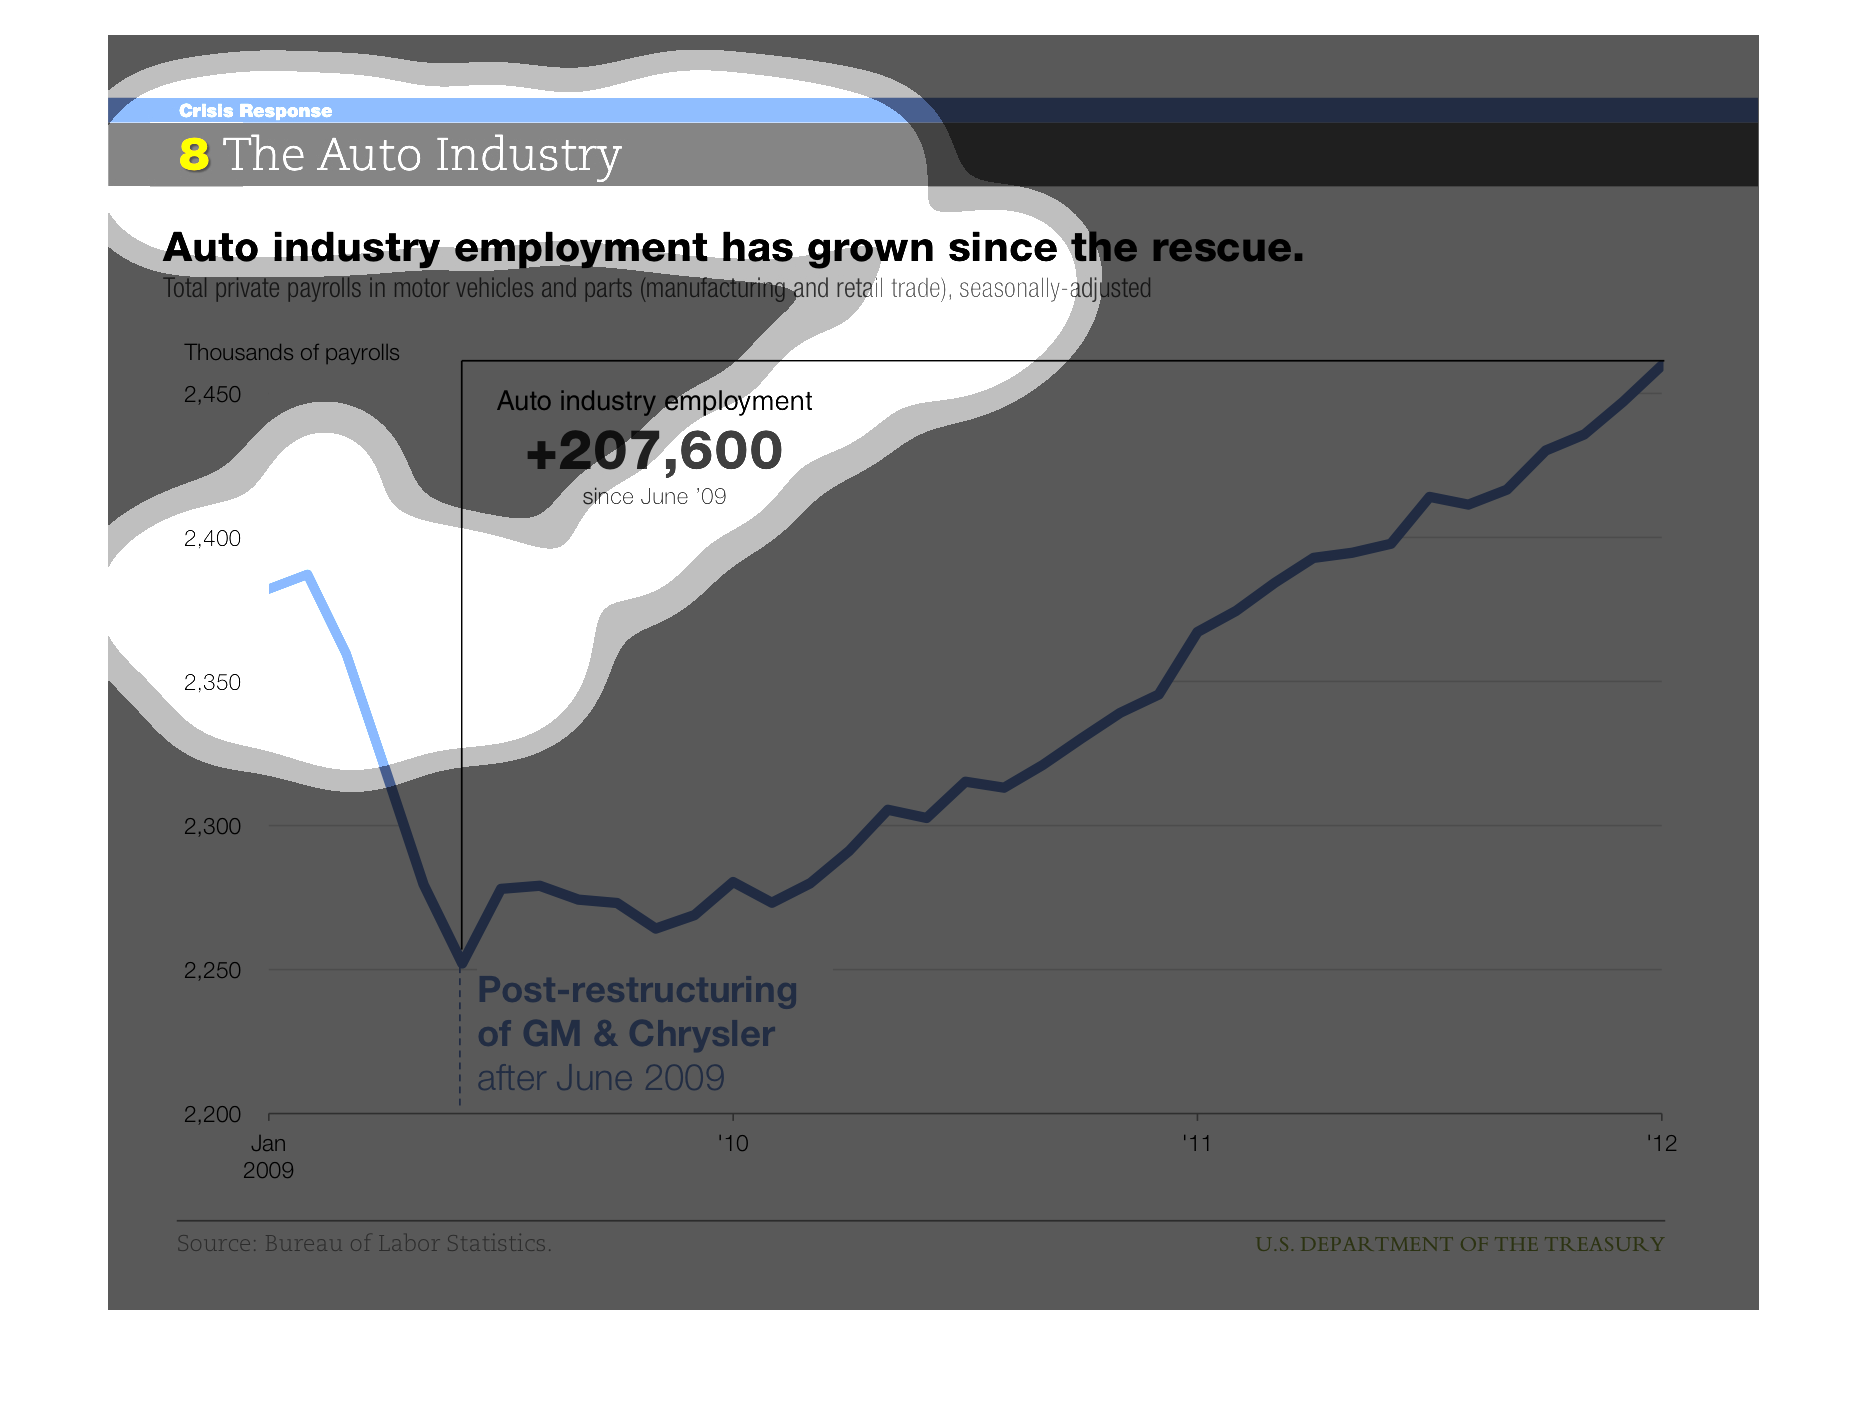
This is an image about the auto industry from 2009 to 2012. Mid 2009 there was a signifiant
decline but quickly increased throughout 2012. Since June 2009 there are more than 207, 600
employees in the auto industry.
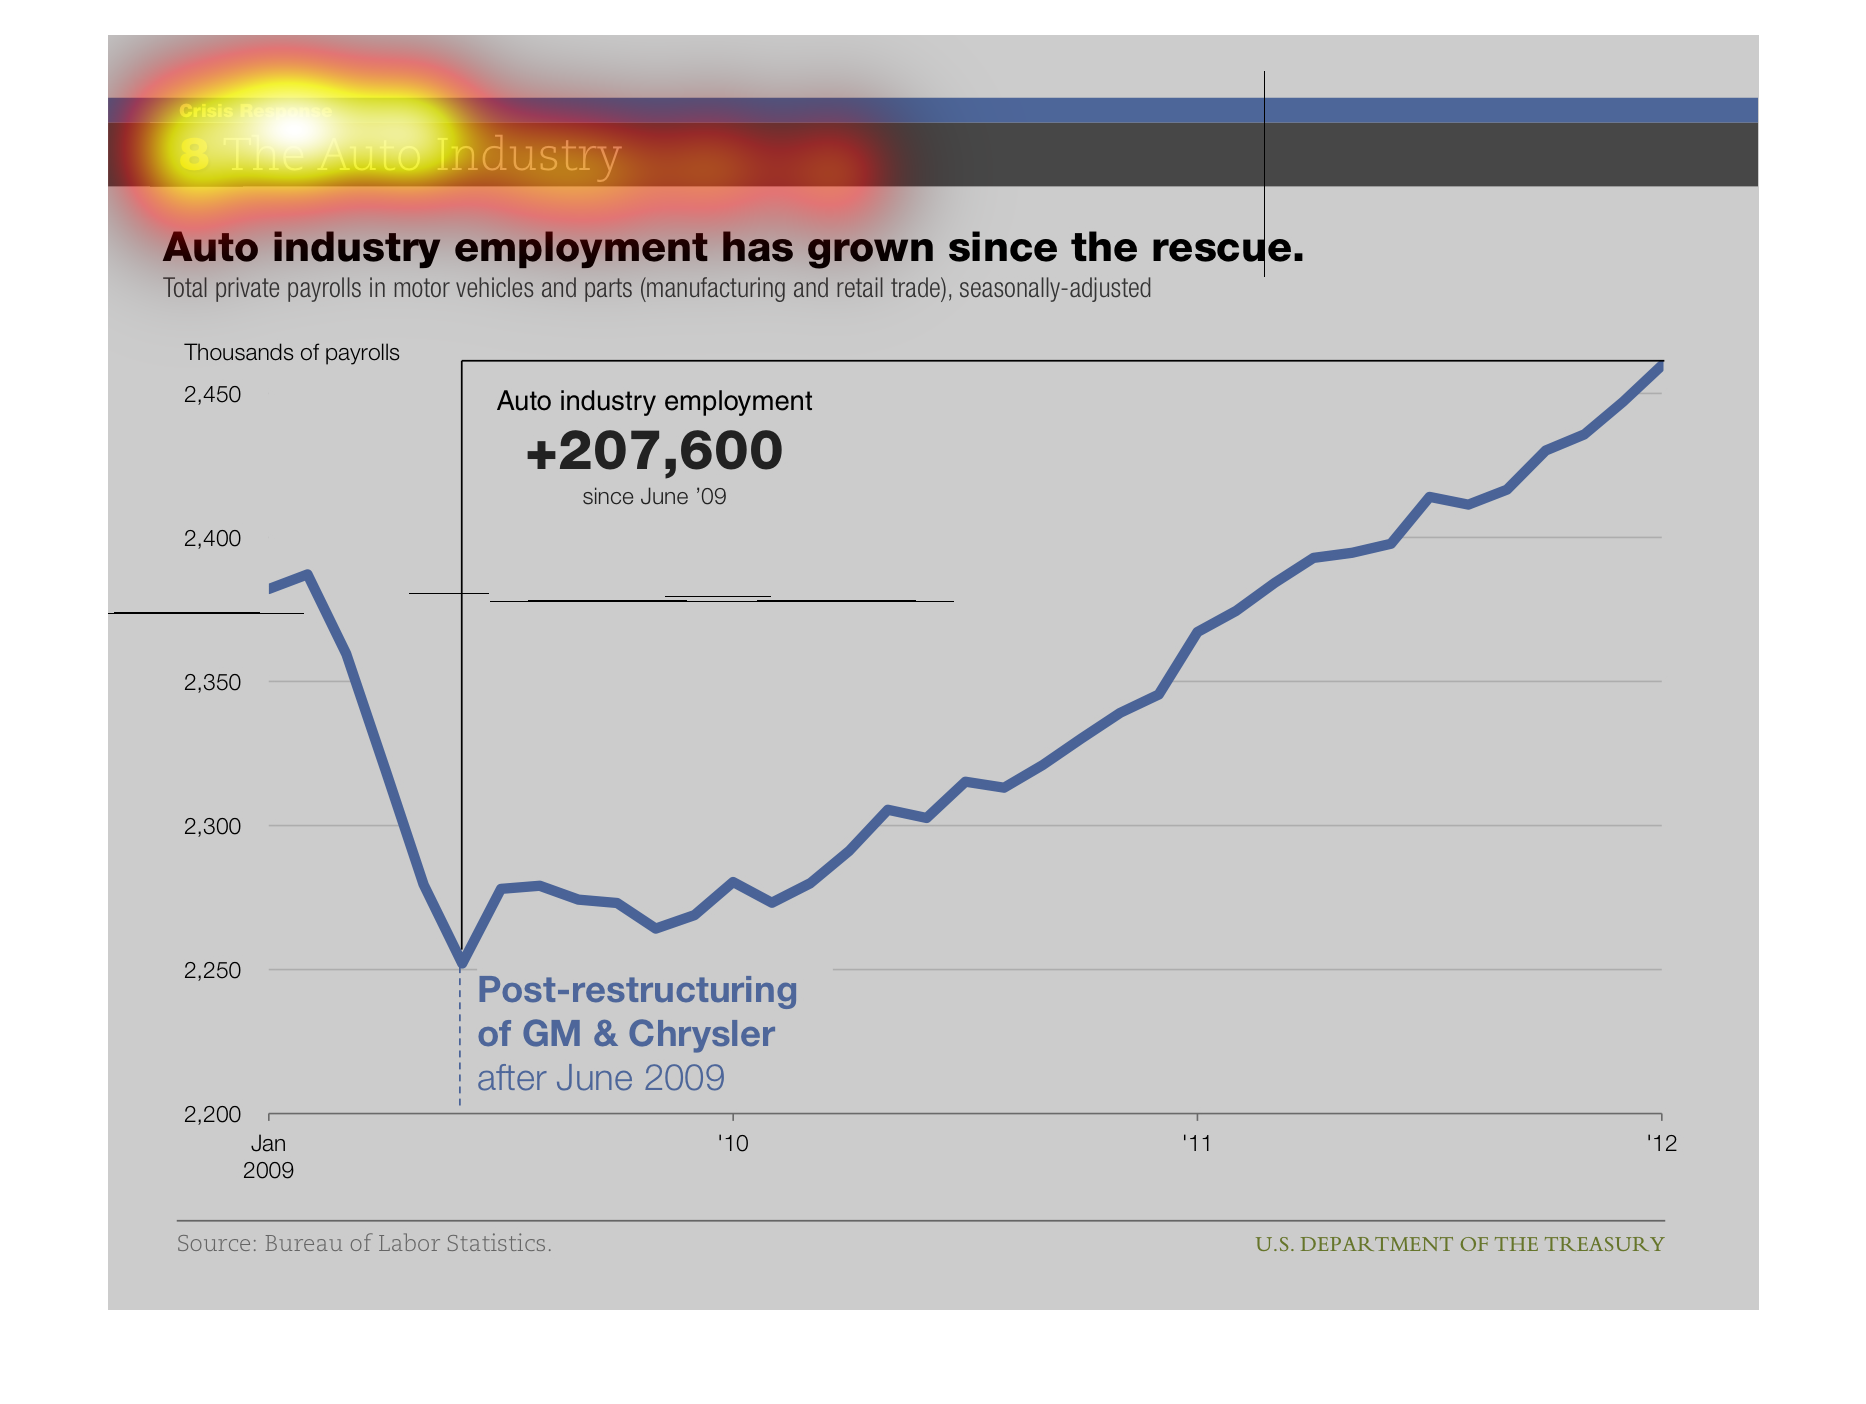
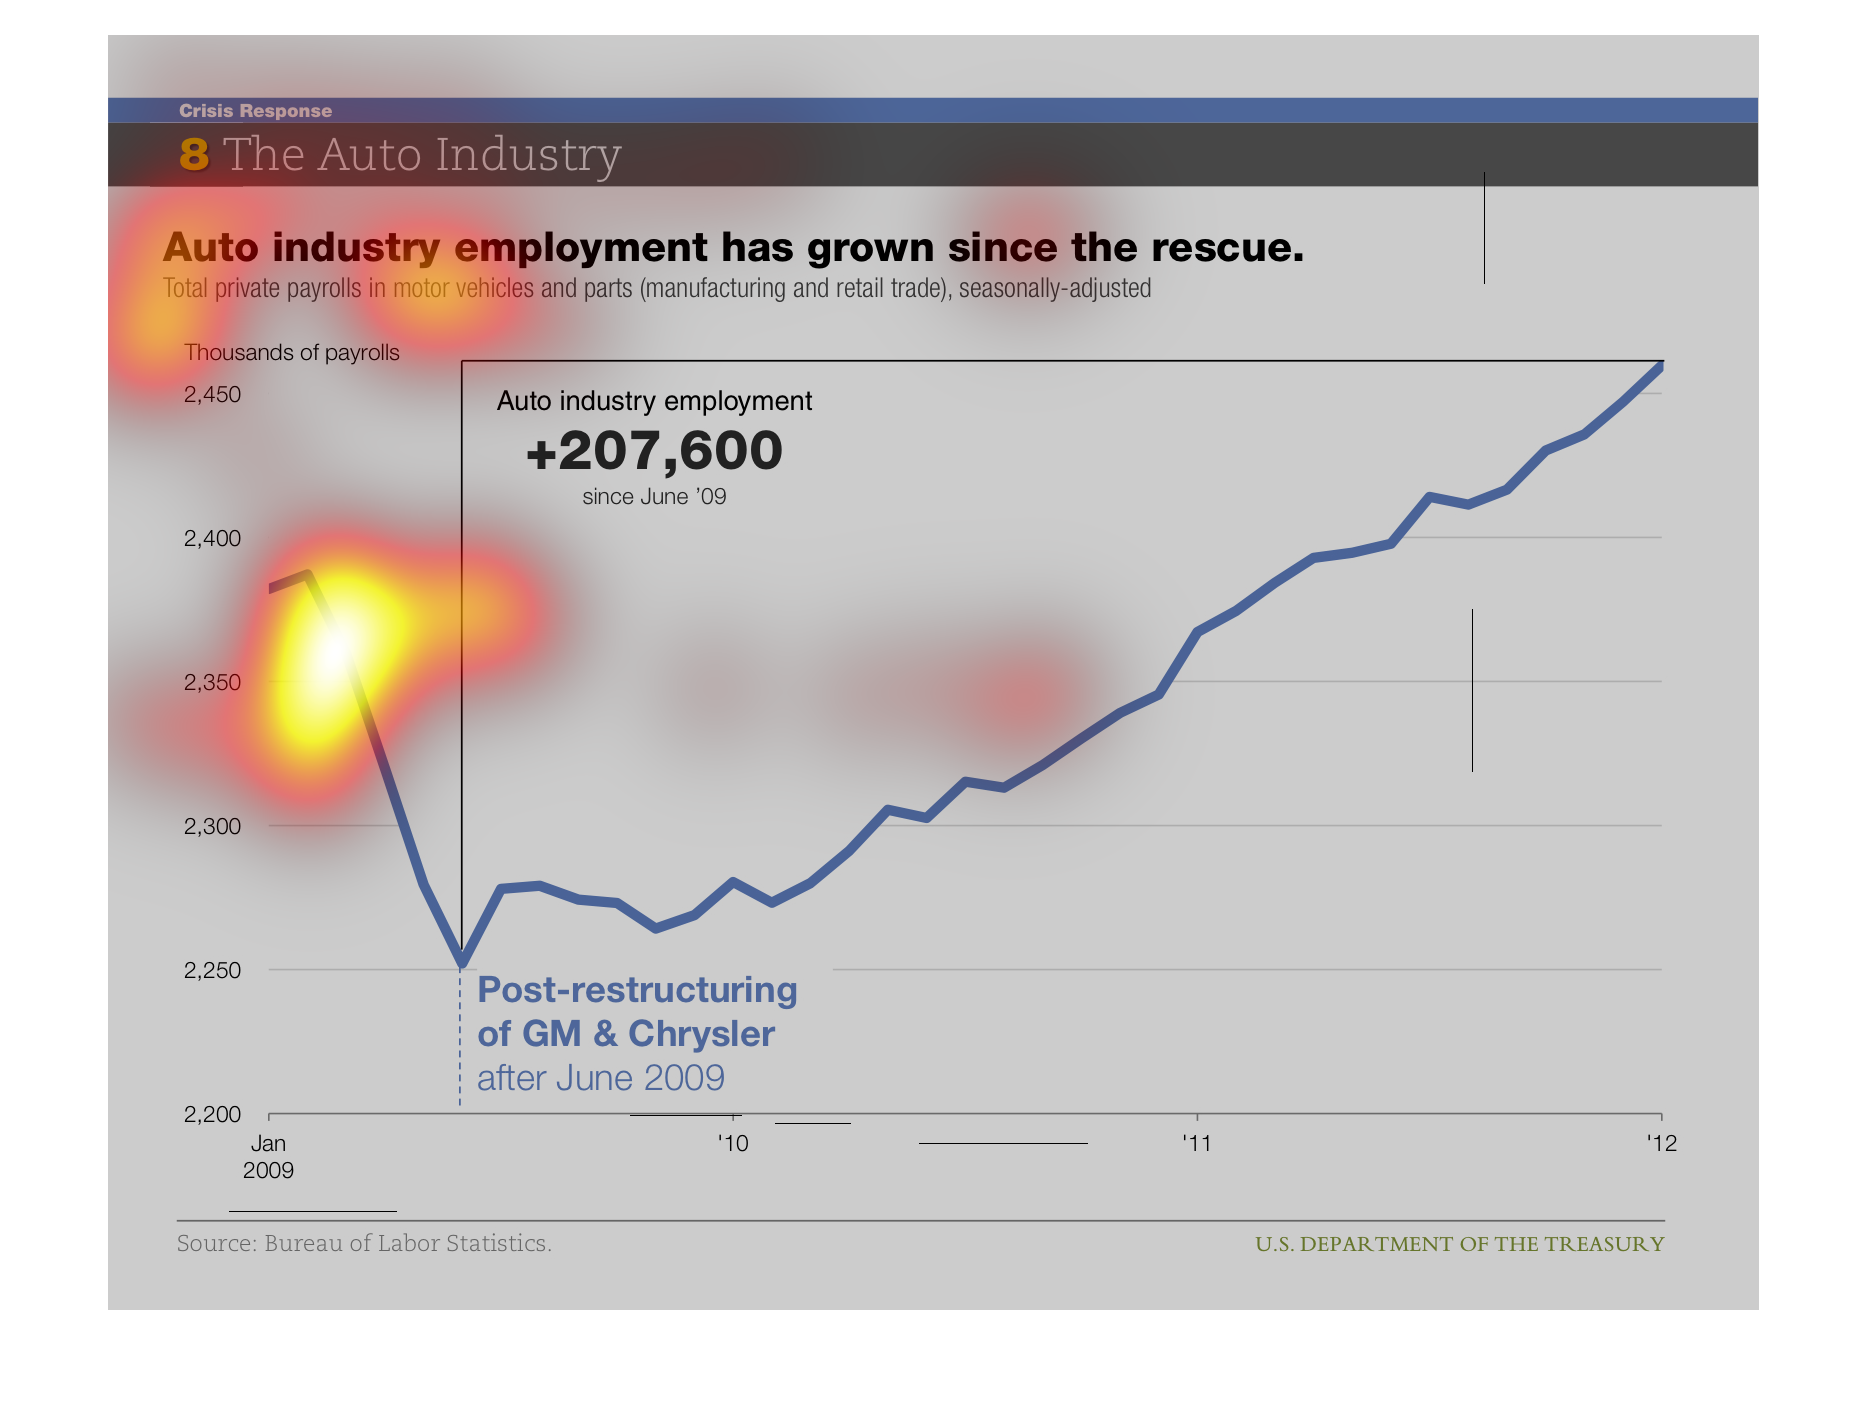
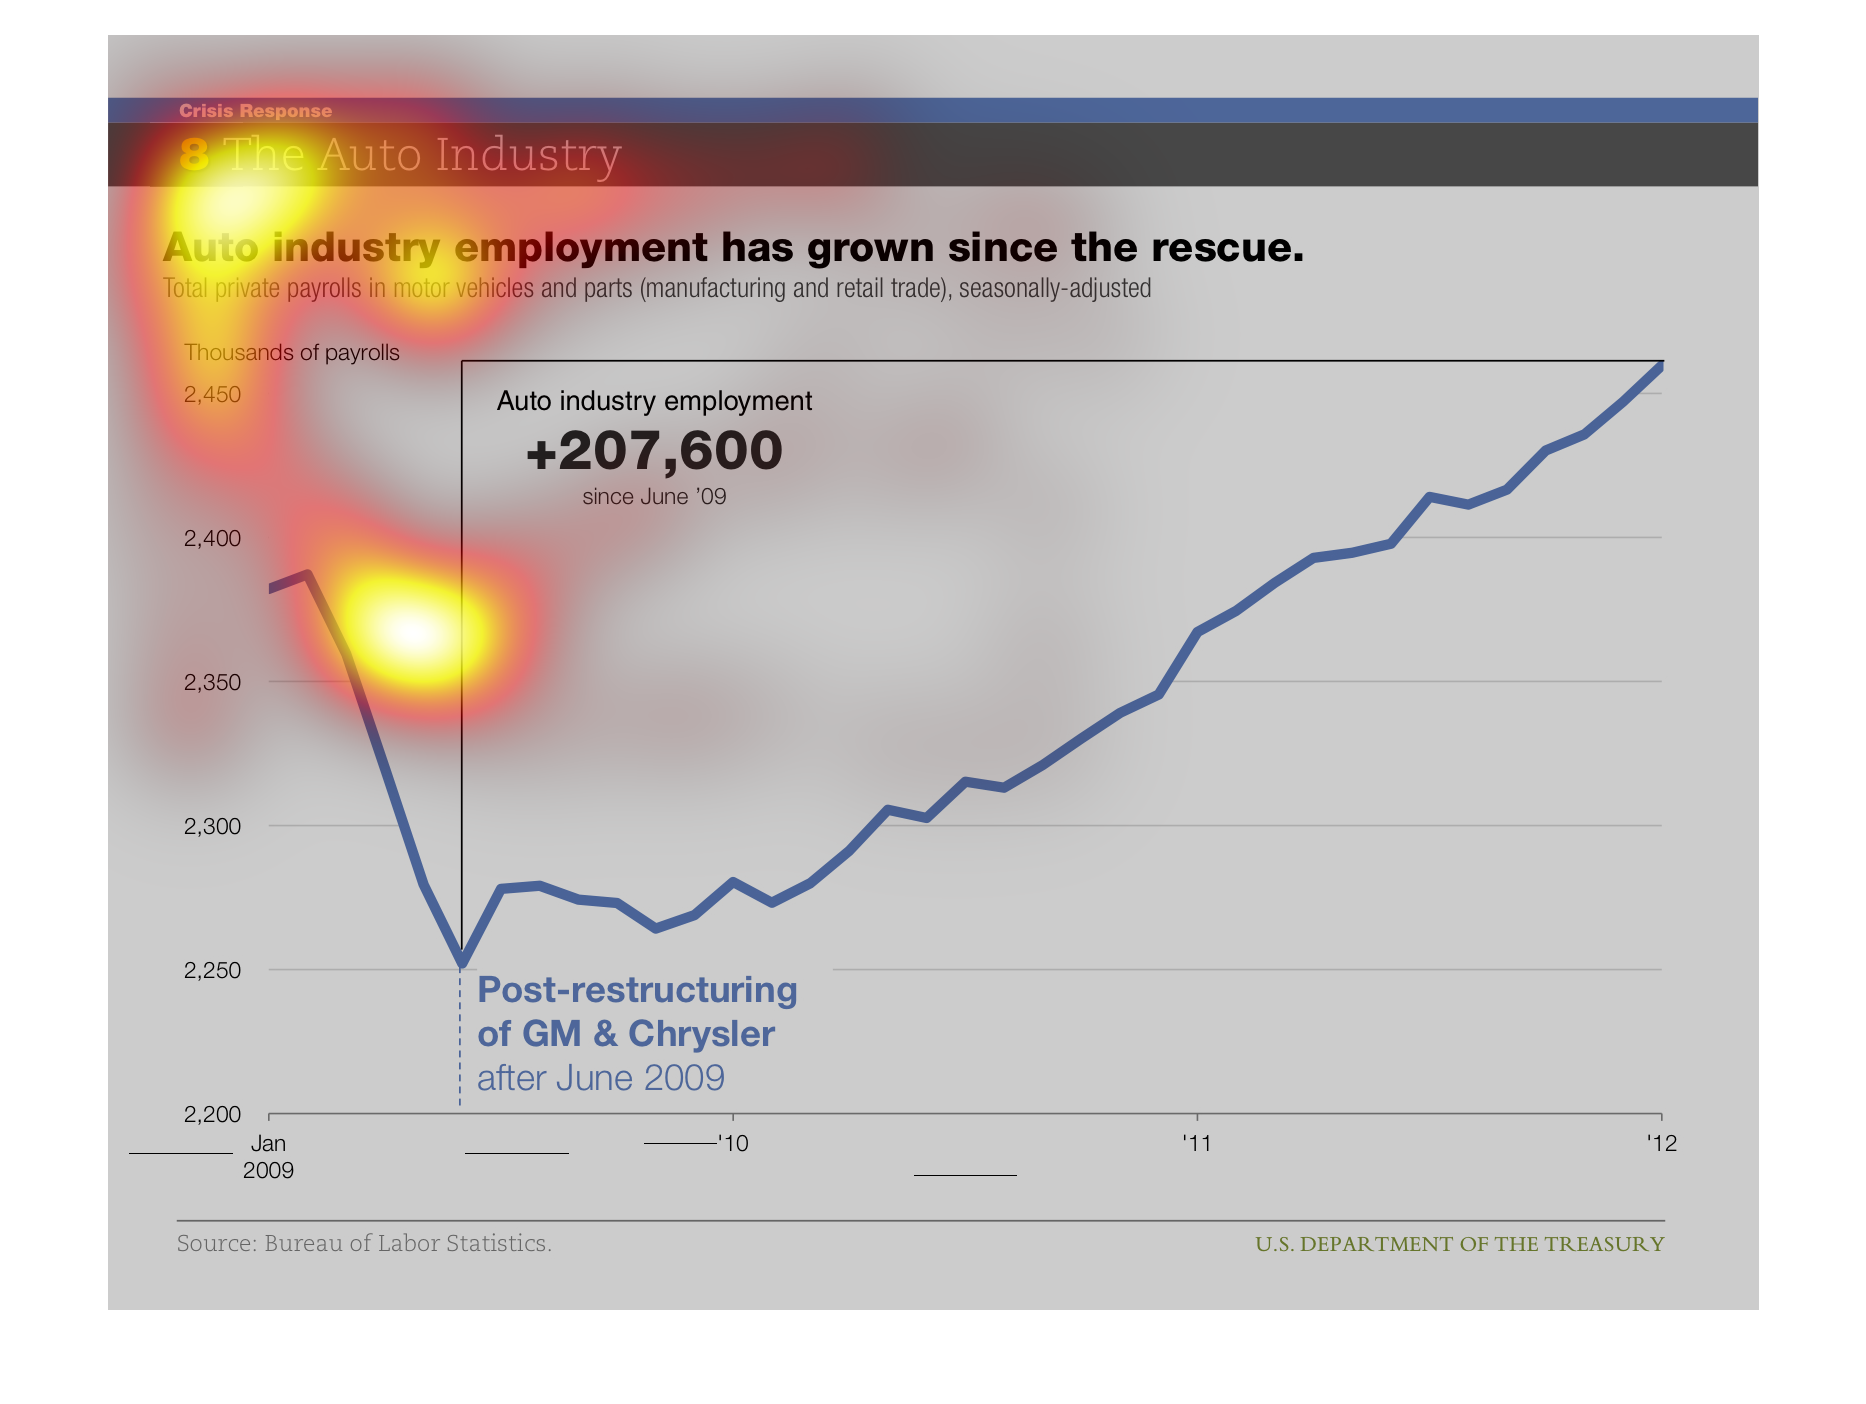
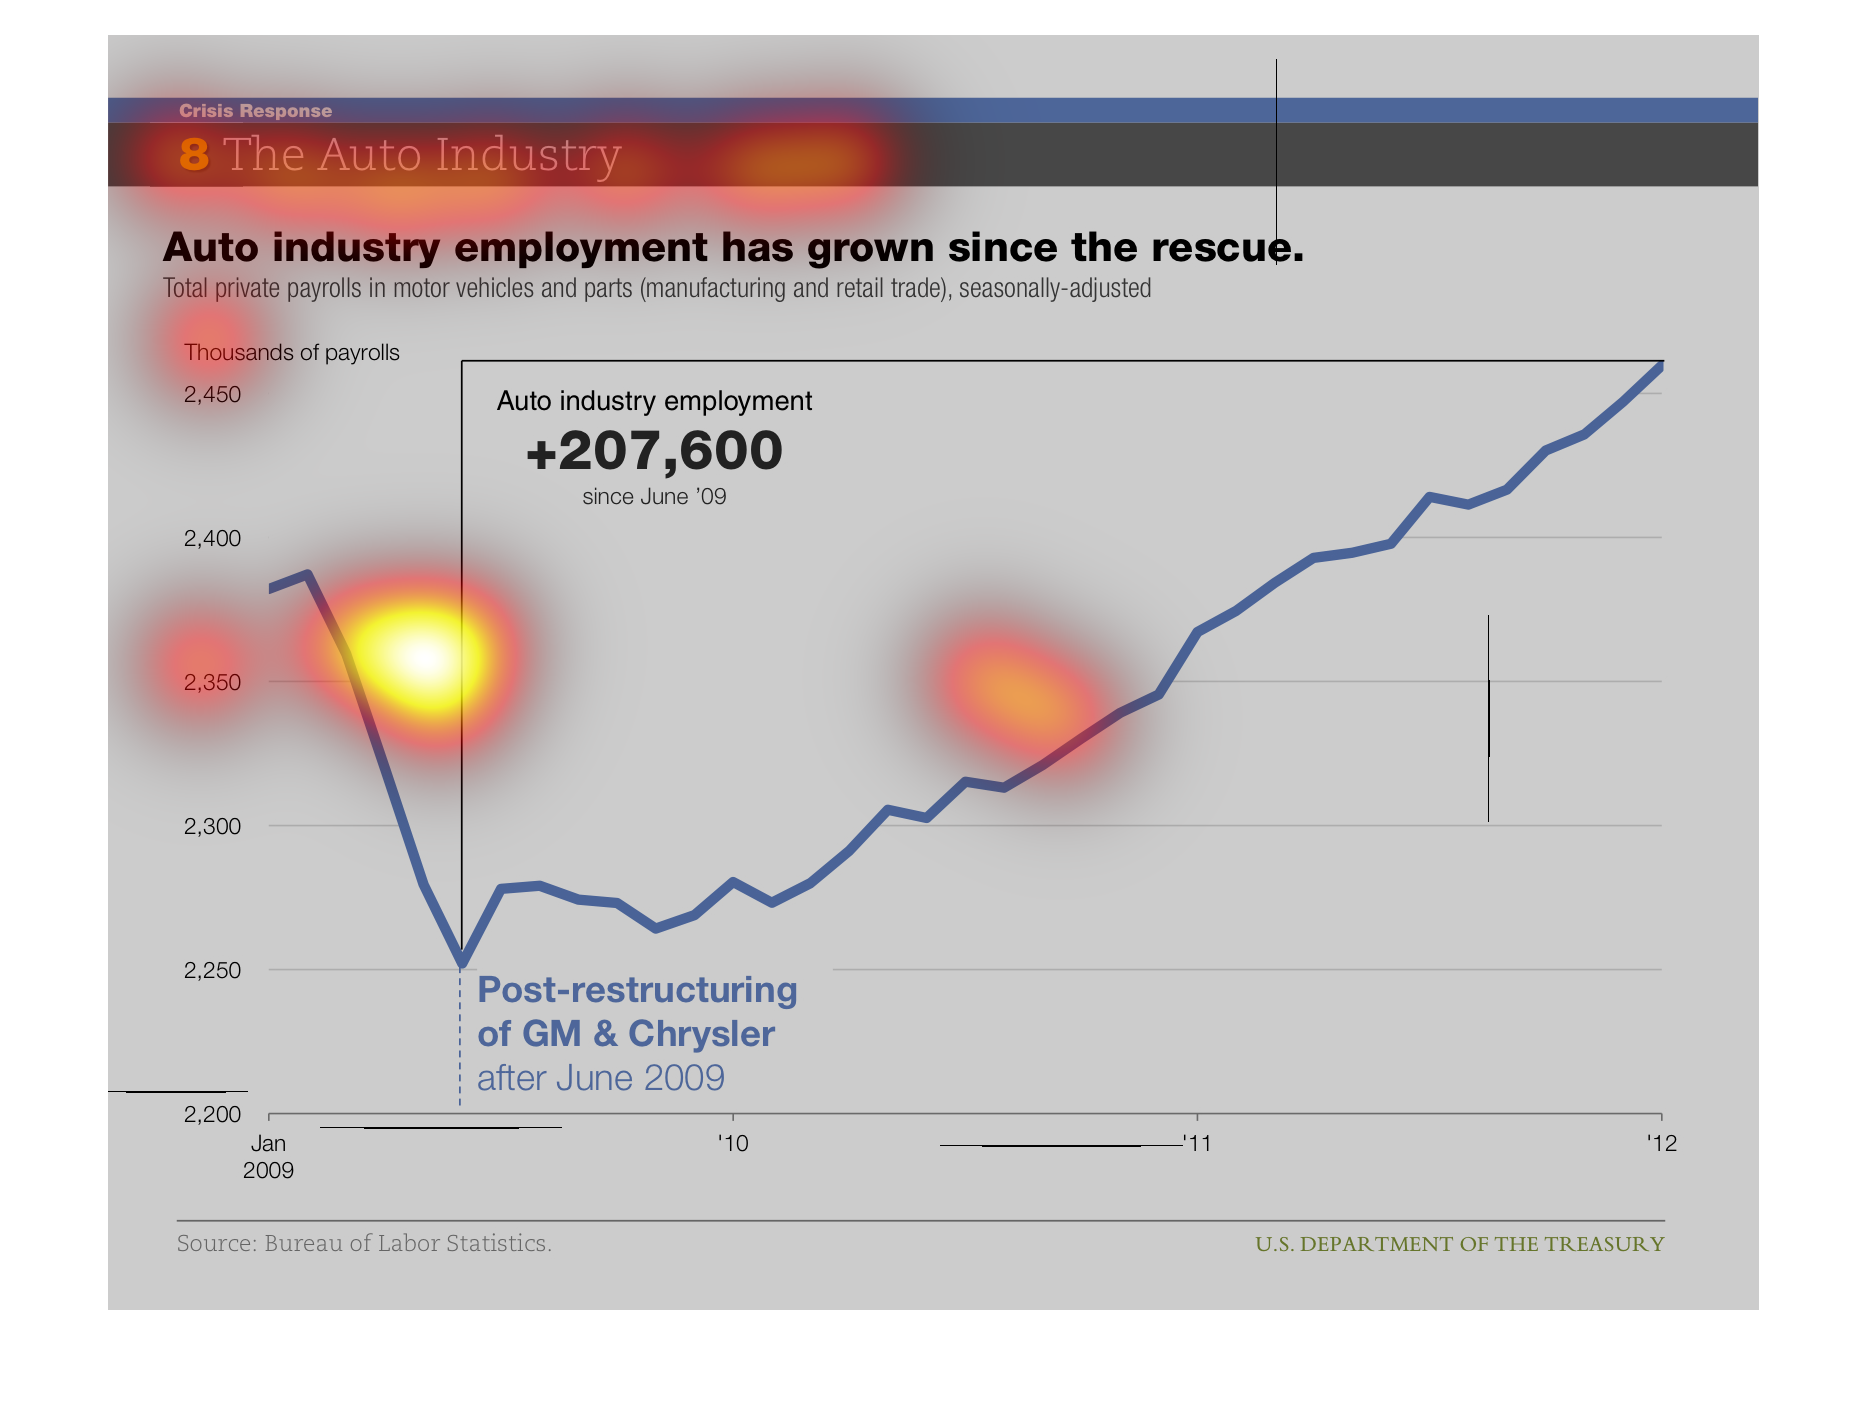
This is a moving average of employment in the automotive industry between 2009 and 2012. There's
a sharp decline during the recession in 2009, and steady growth after that.
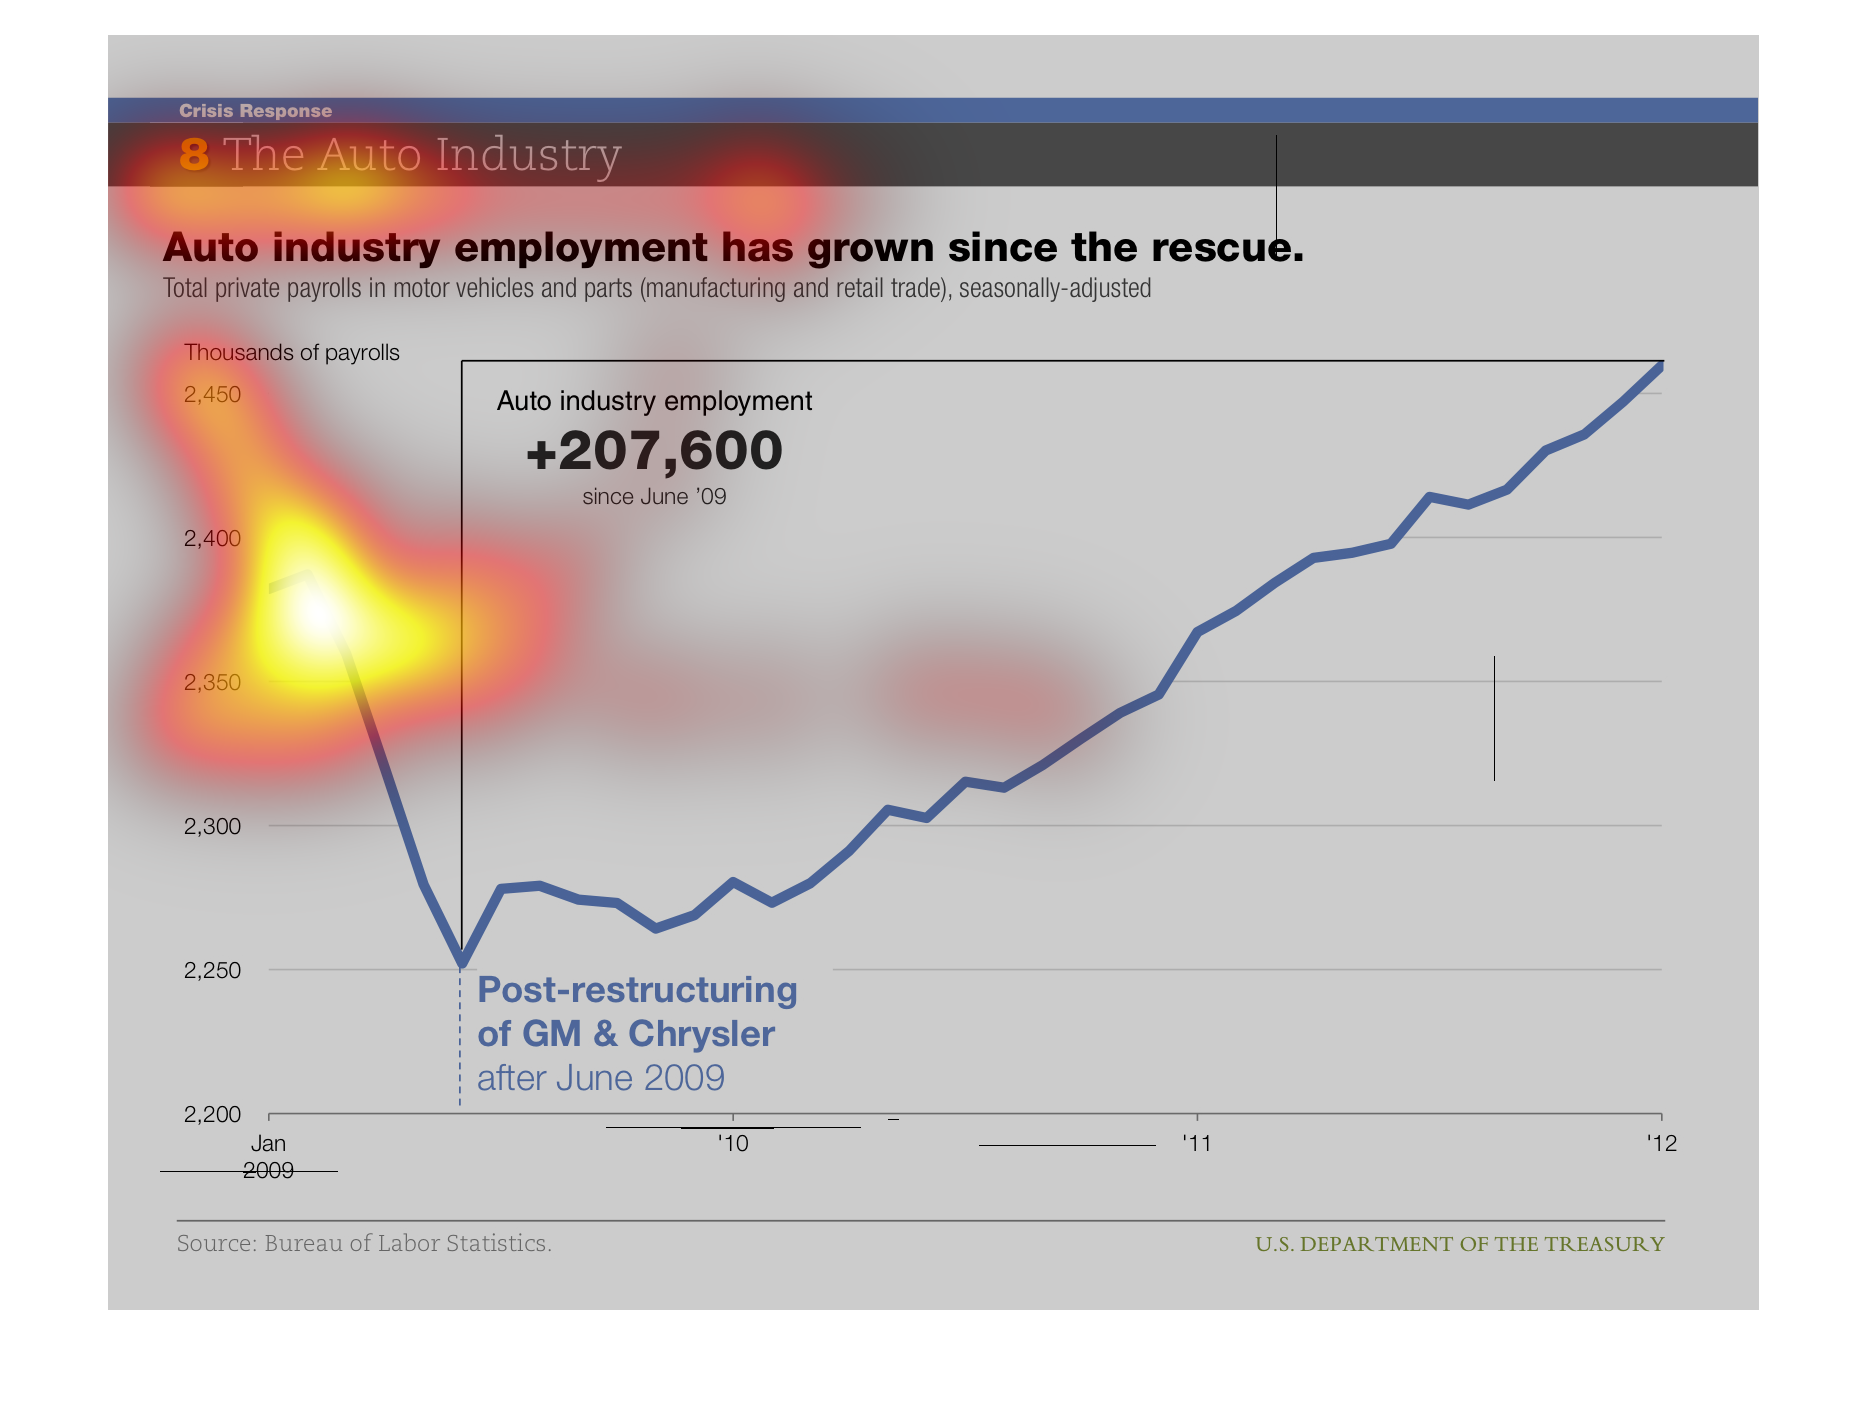
This is a chart showing increased employment in the Auto industry since their bailout. The
chart shows the 2009 numbers dipped dramatically but there have been 207,6000 new jobs by
2011.
The auto industry employment has grown since the rescue (the restructuring of GM and Chrysler
around 2009). The employment numbers are up by over 200,000.
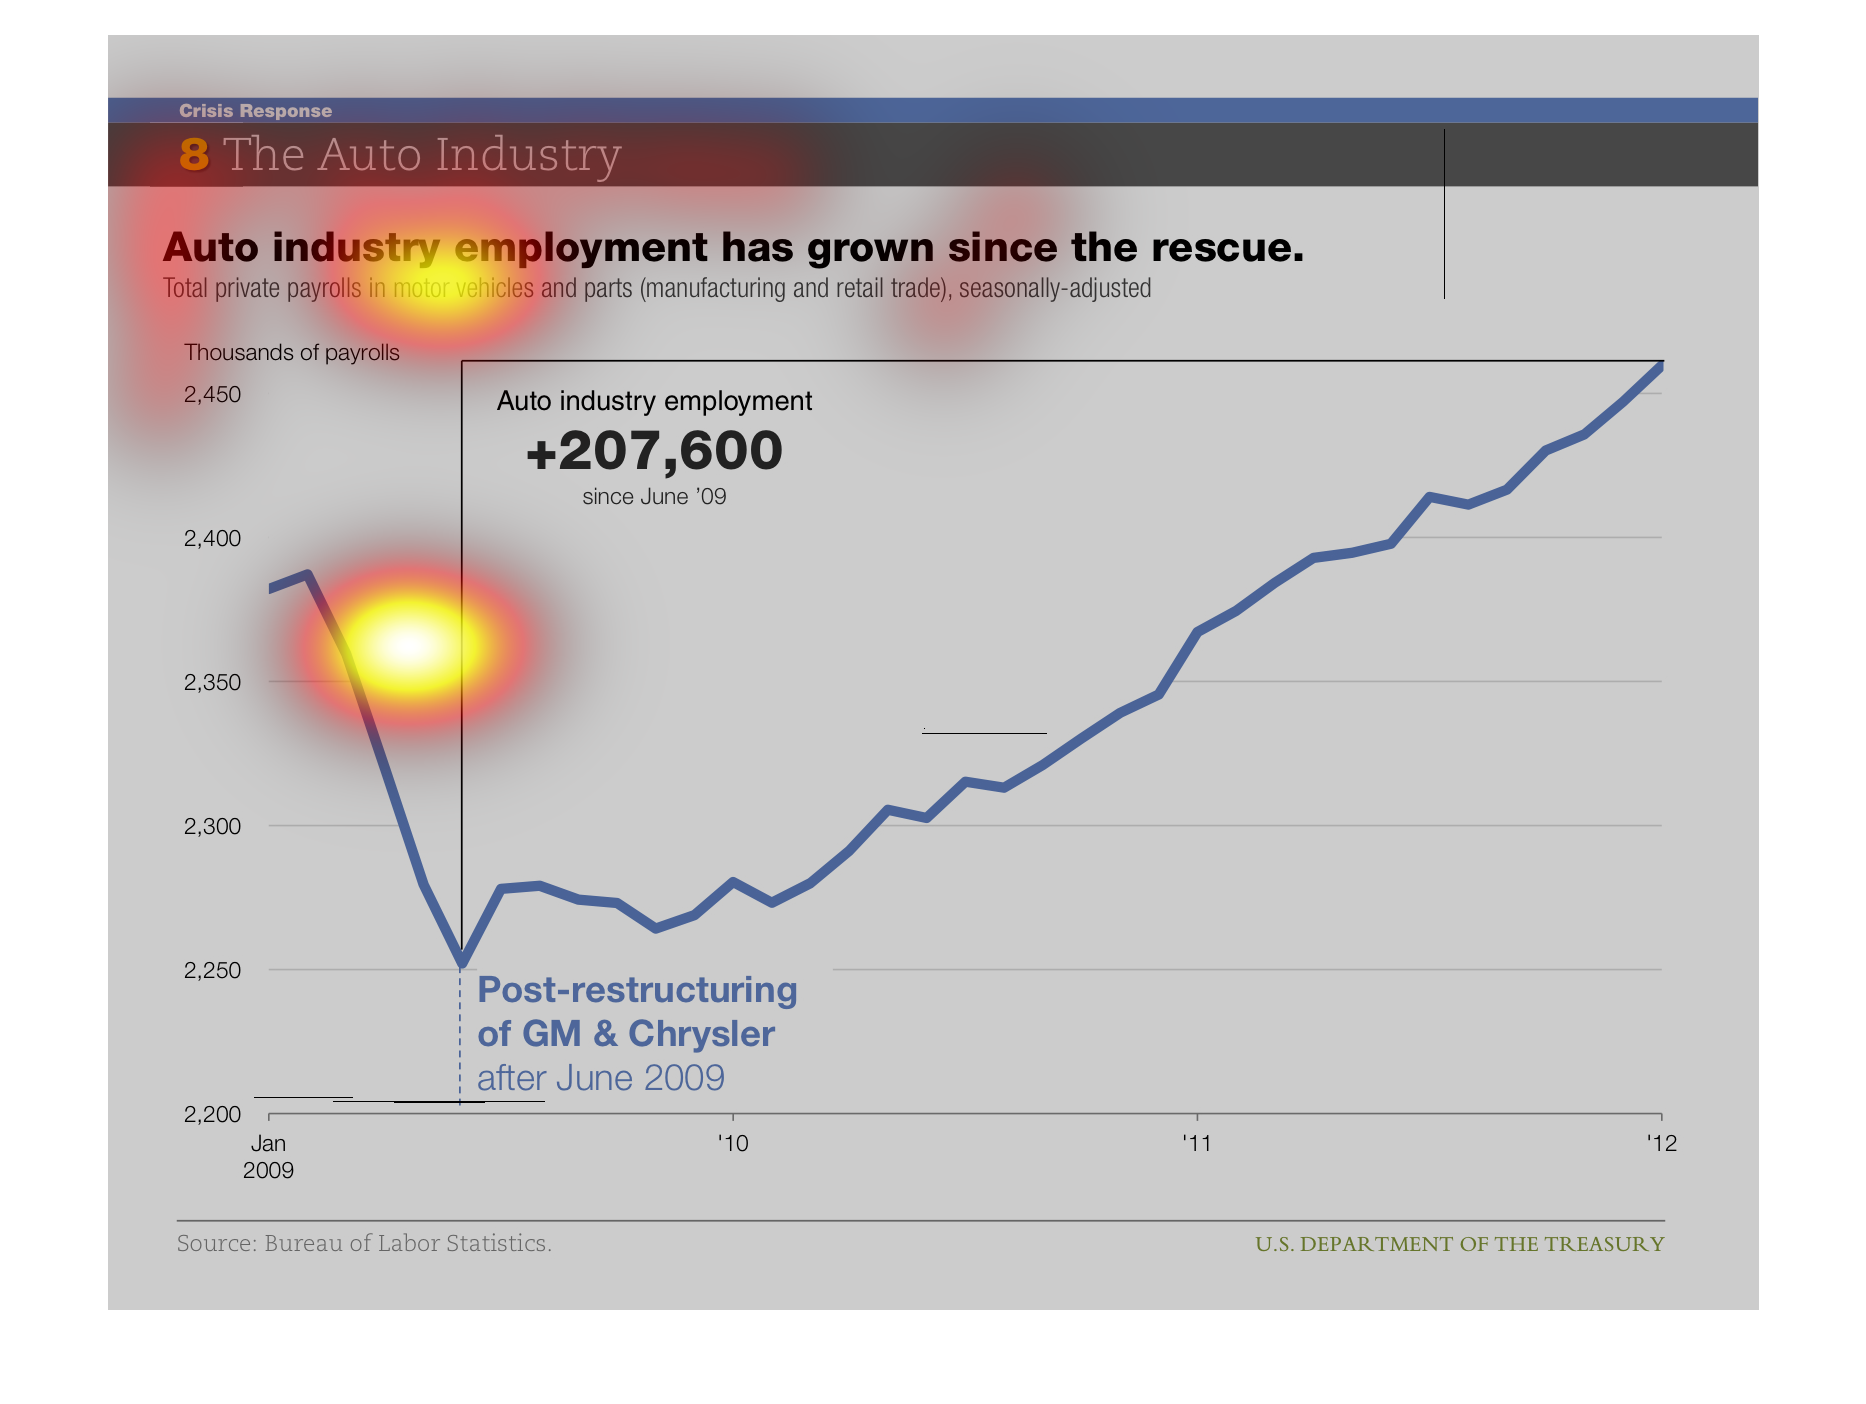
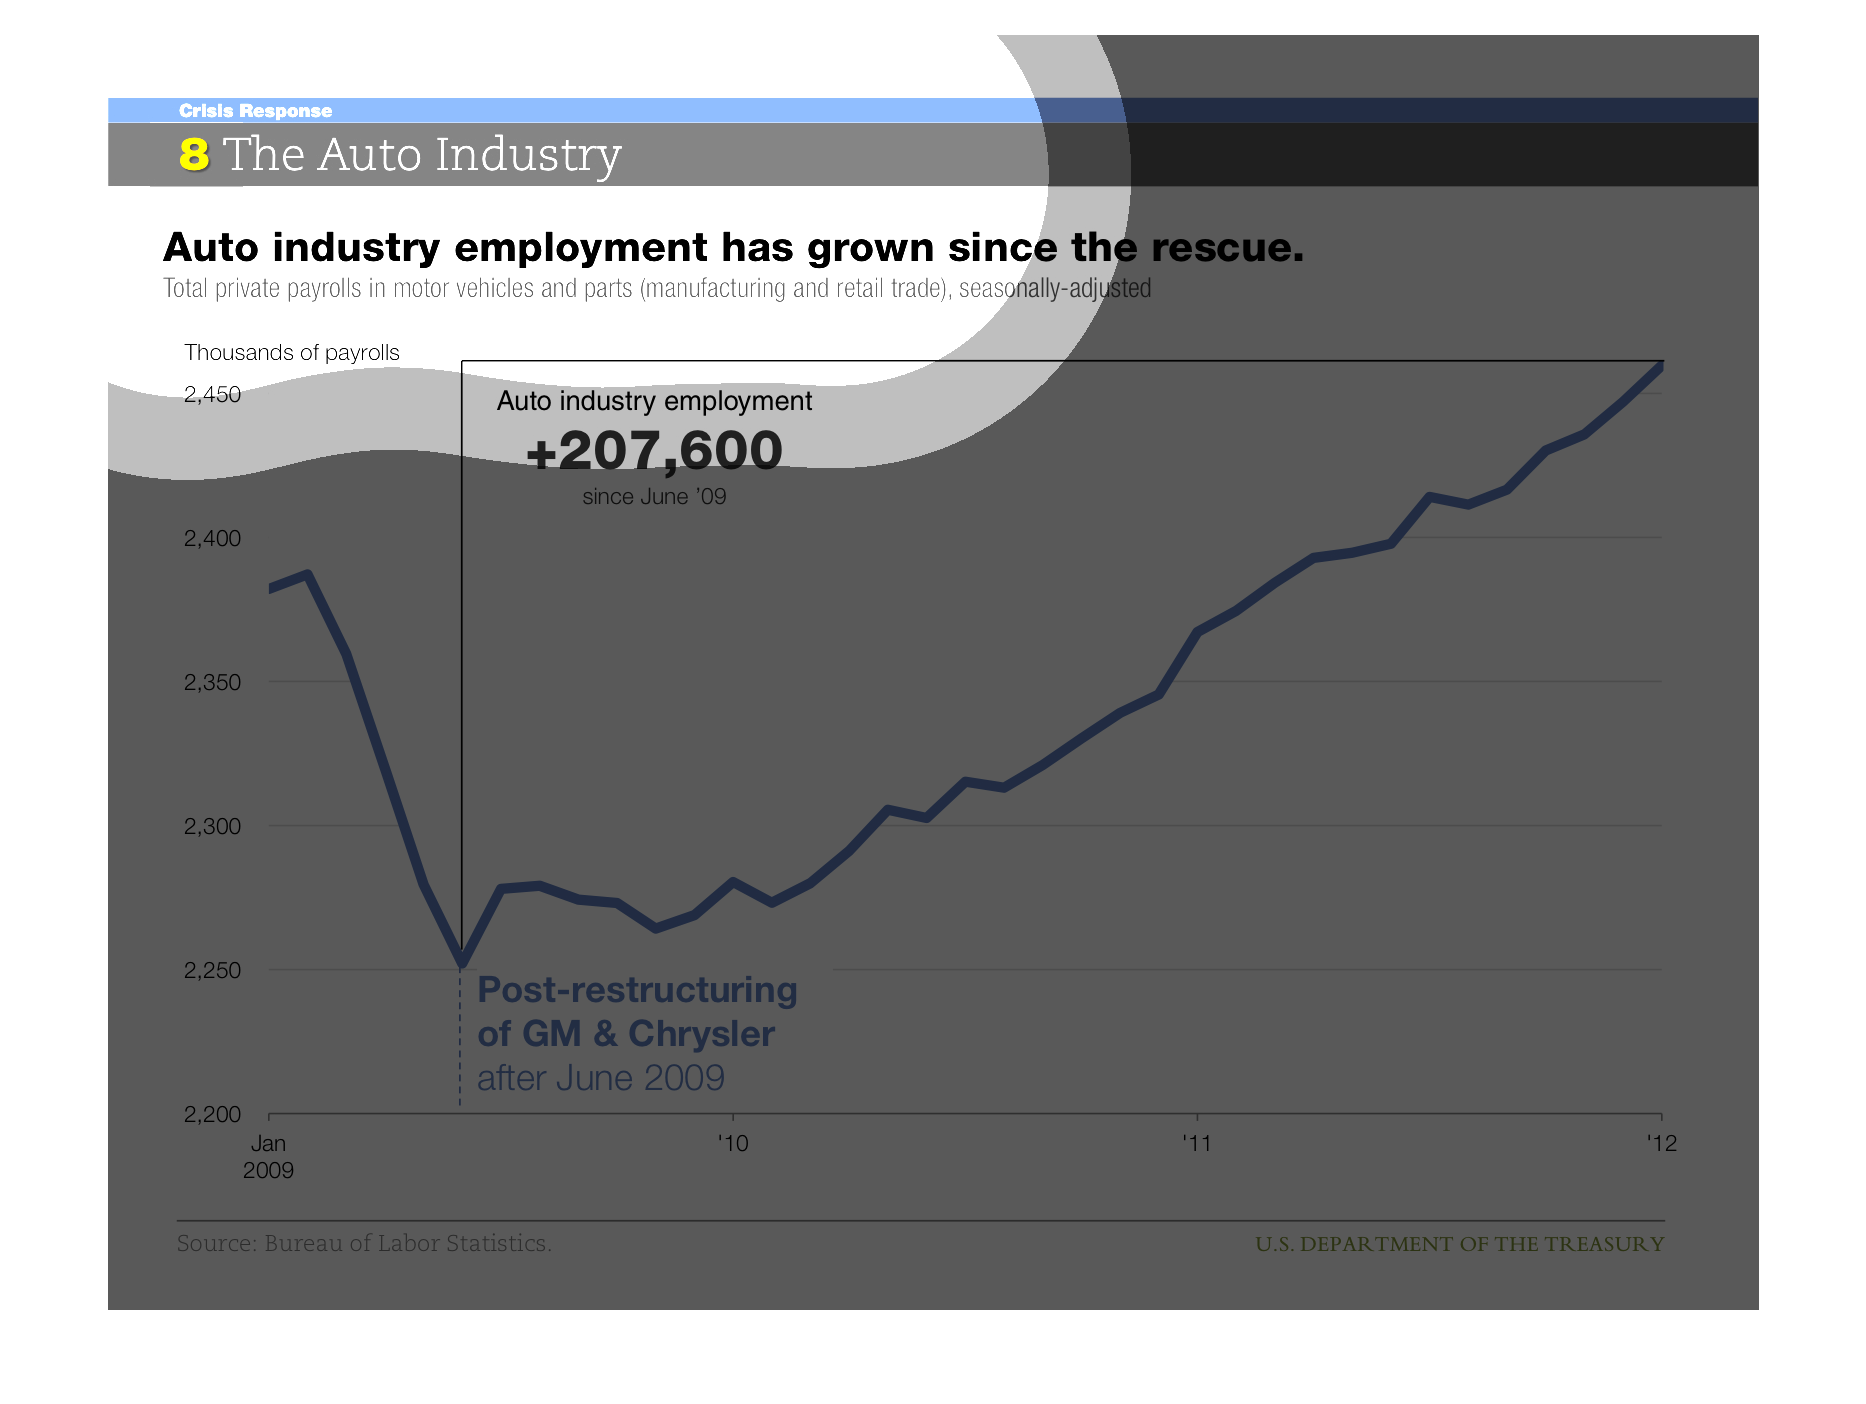
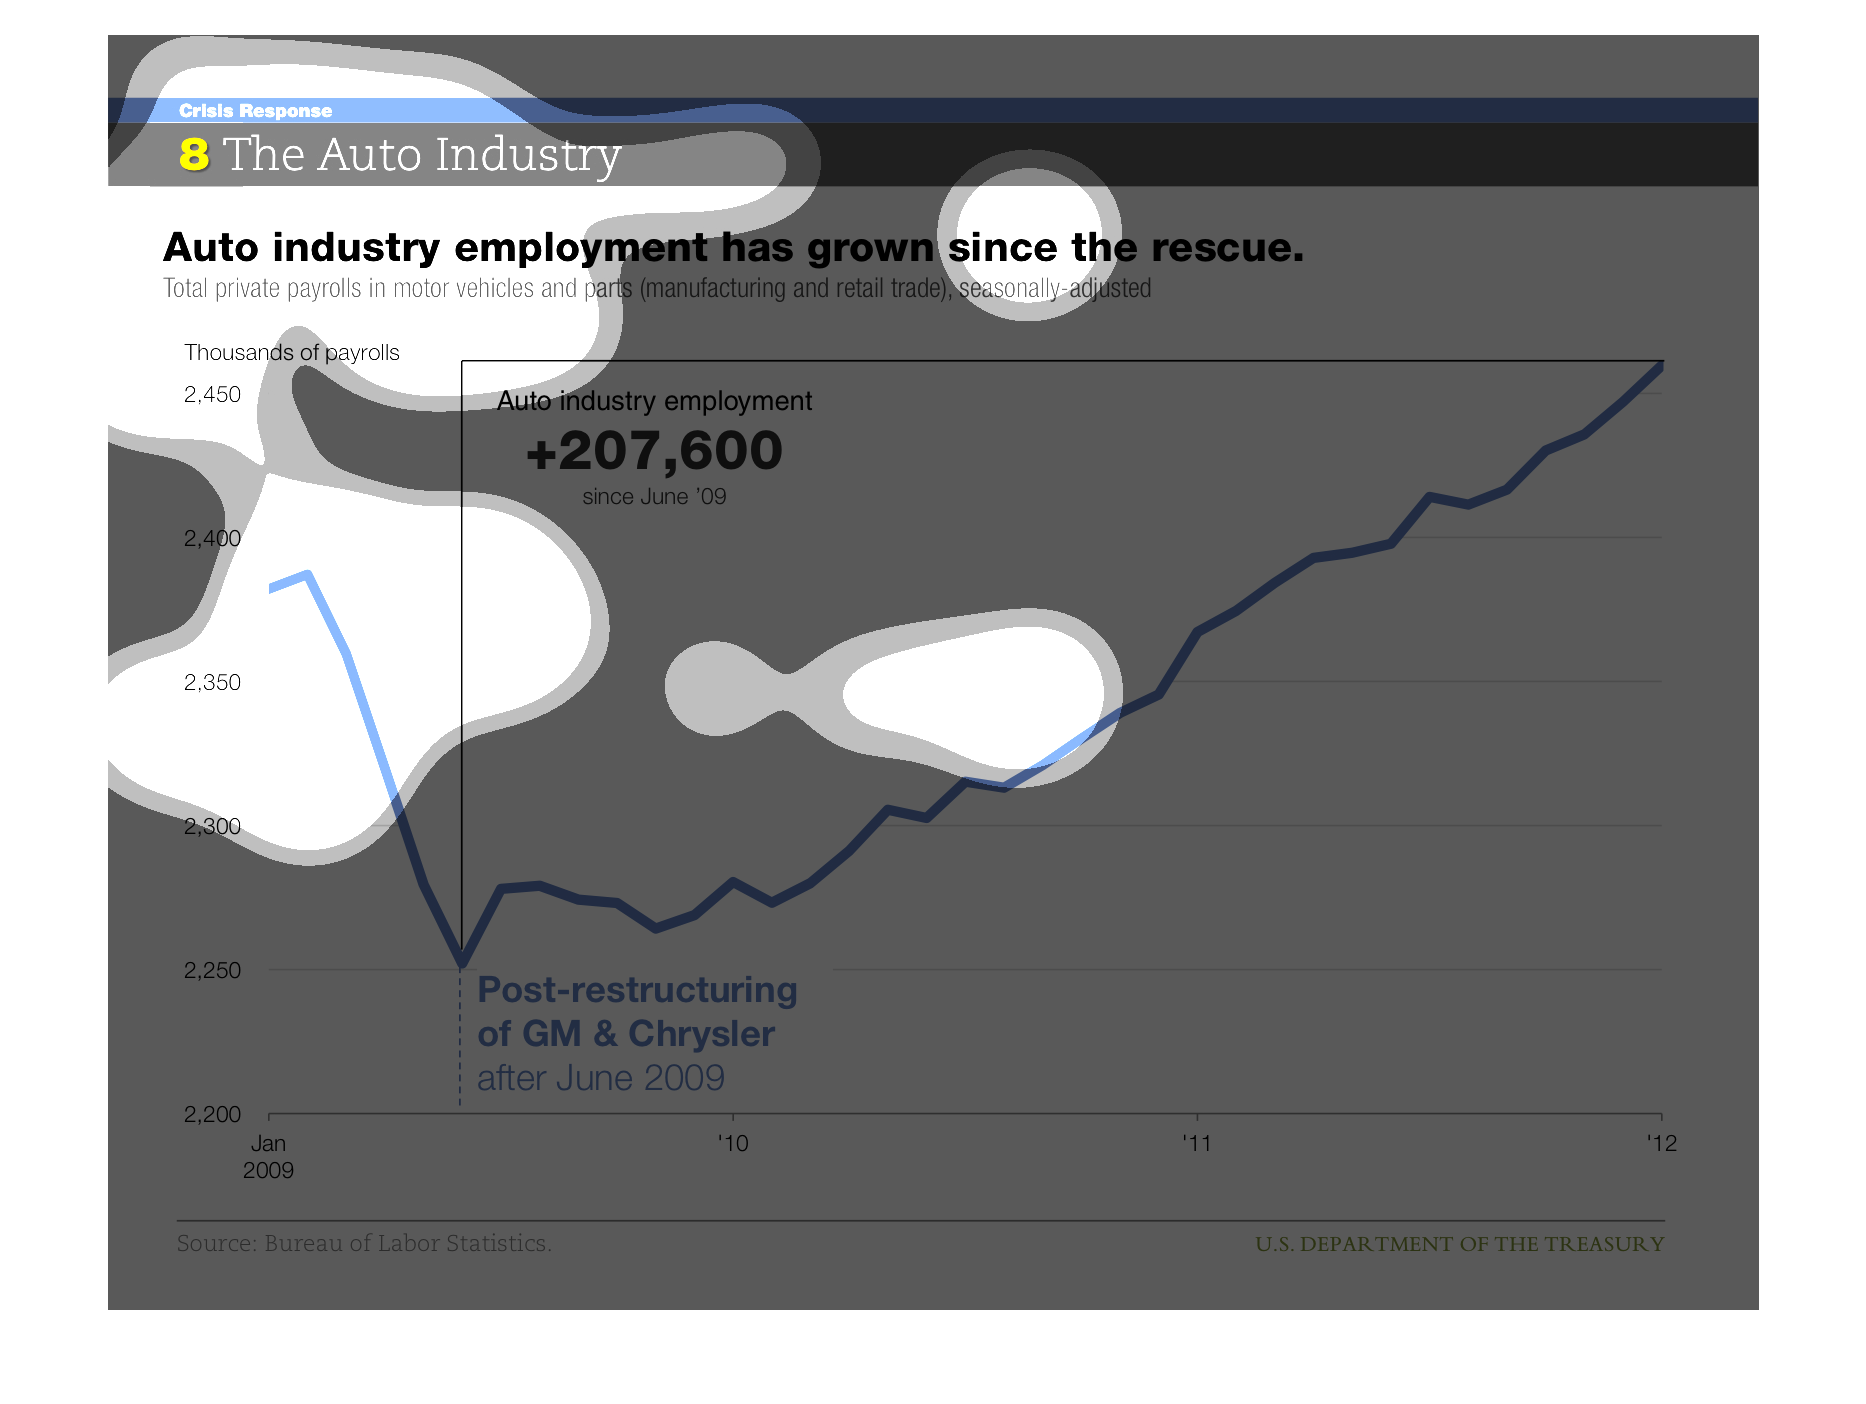
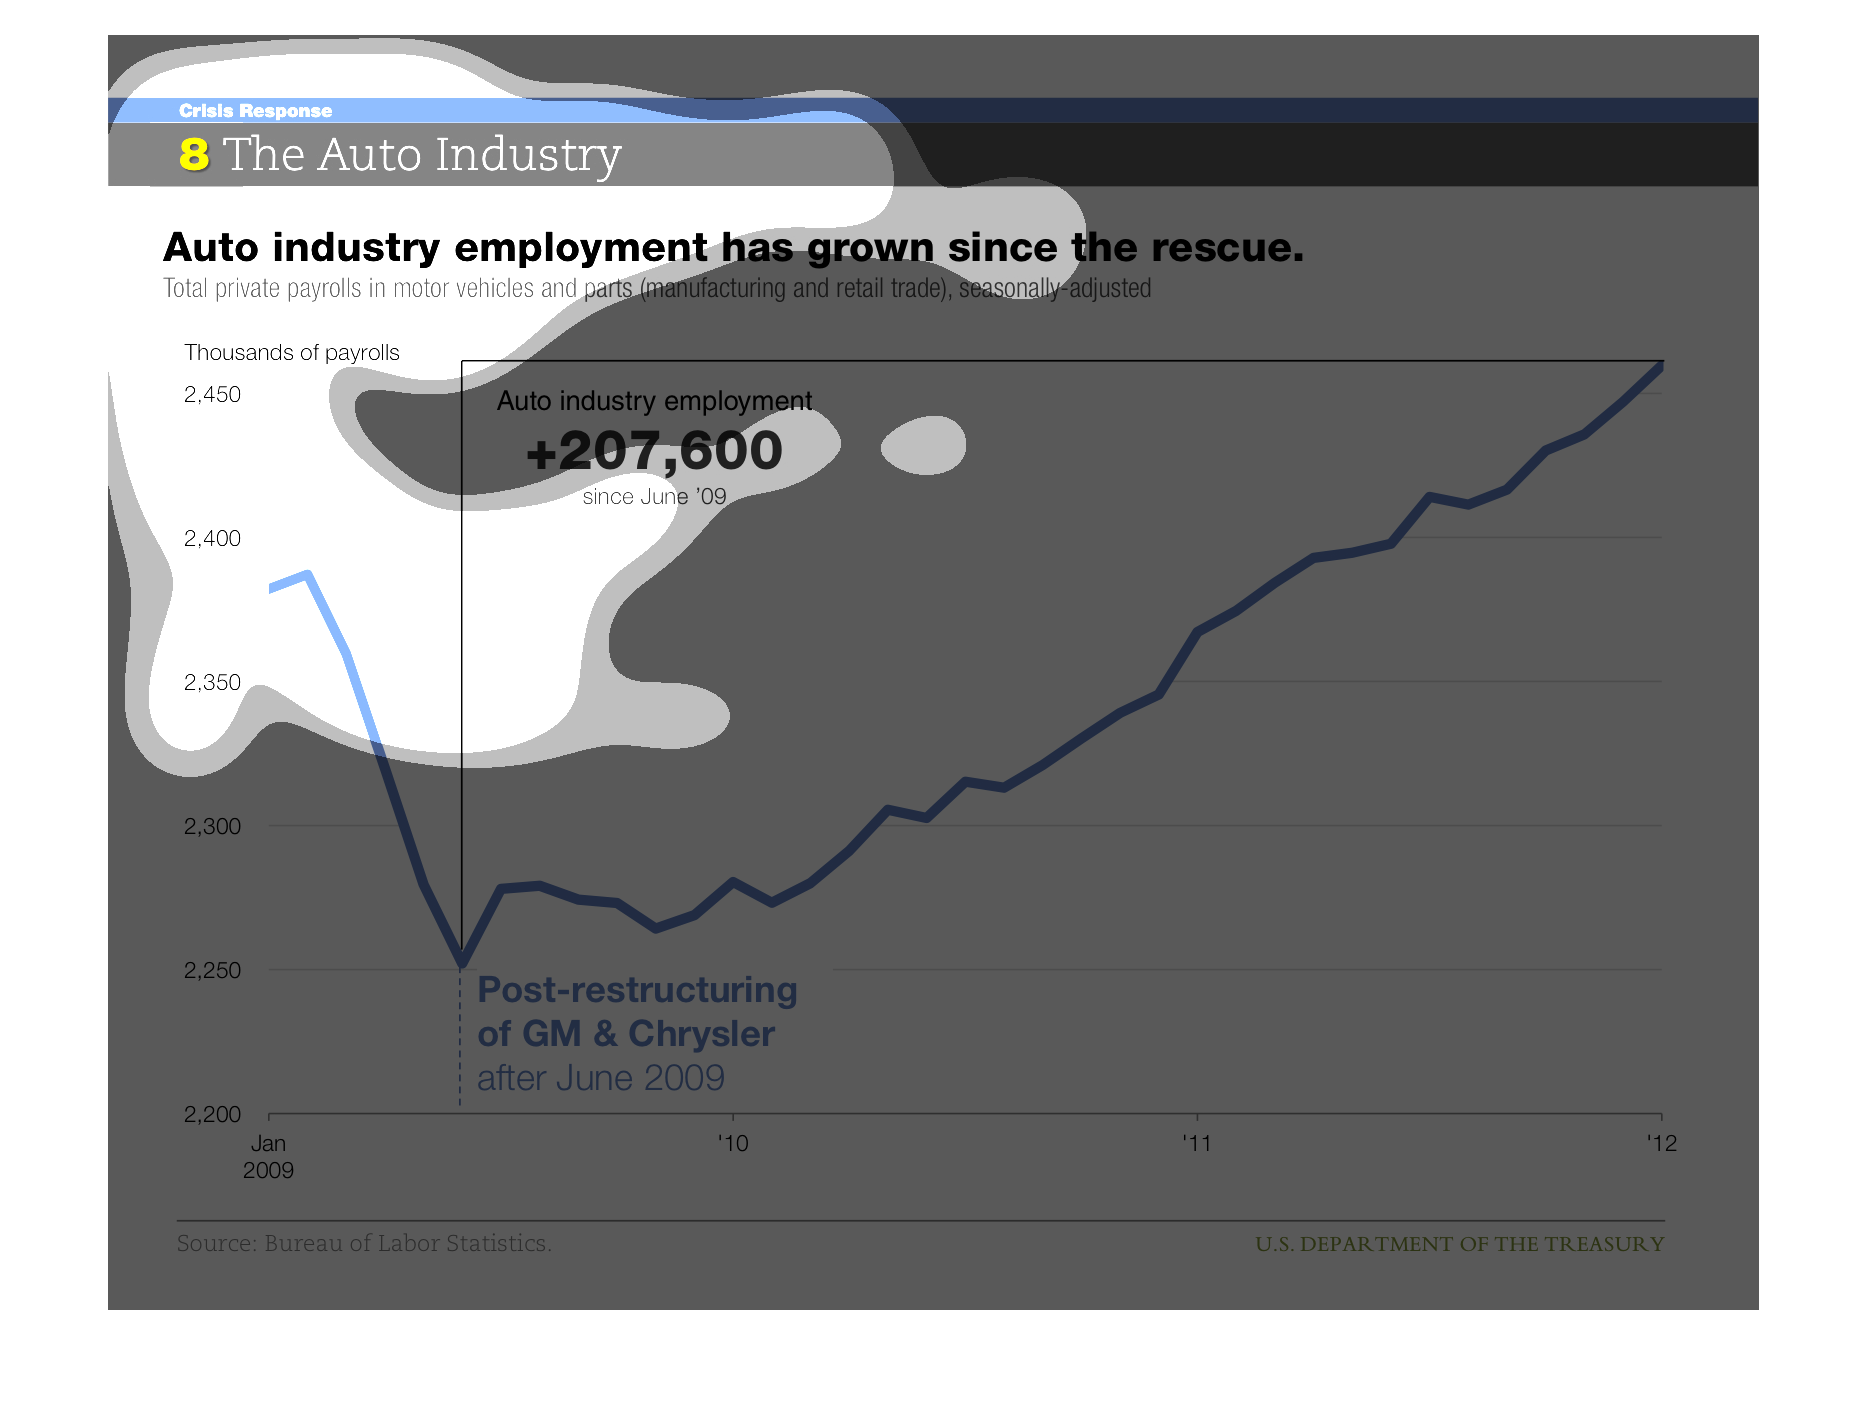
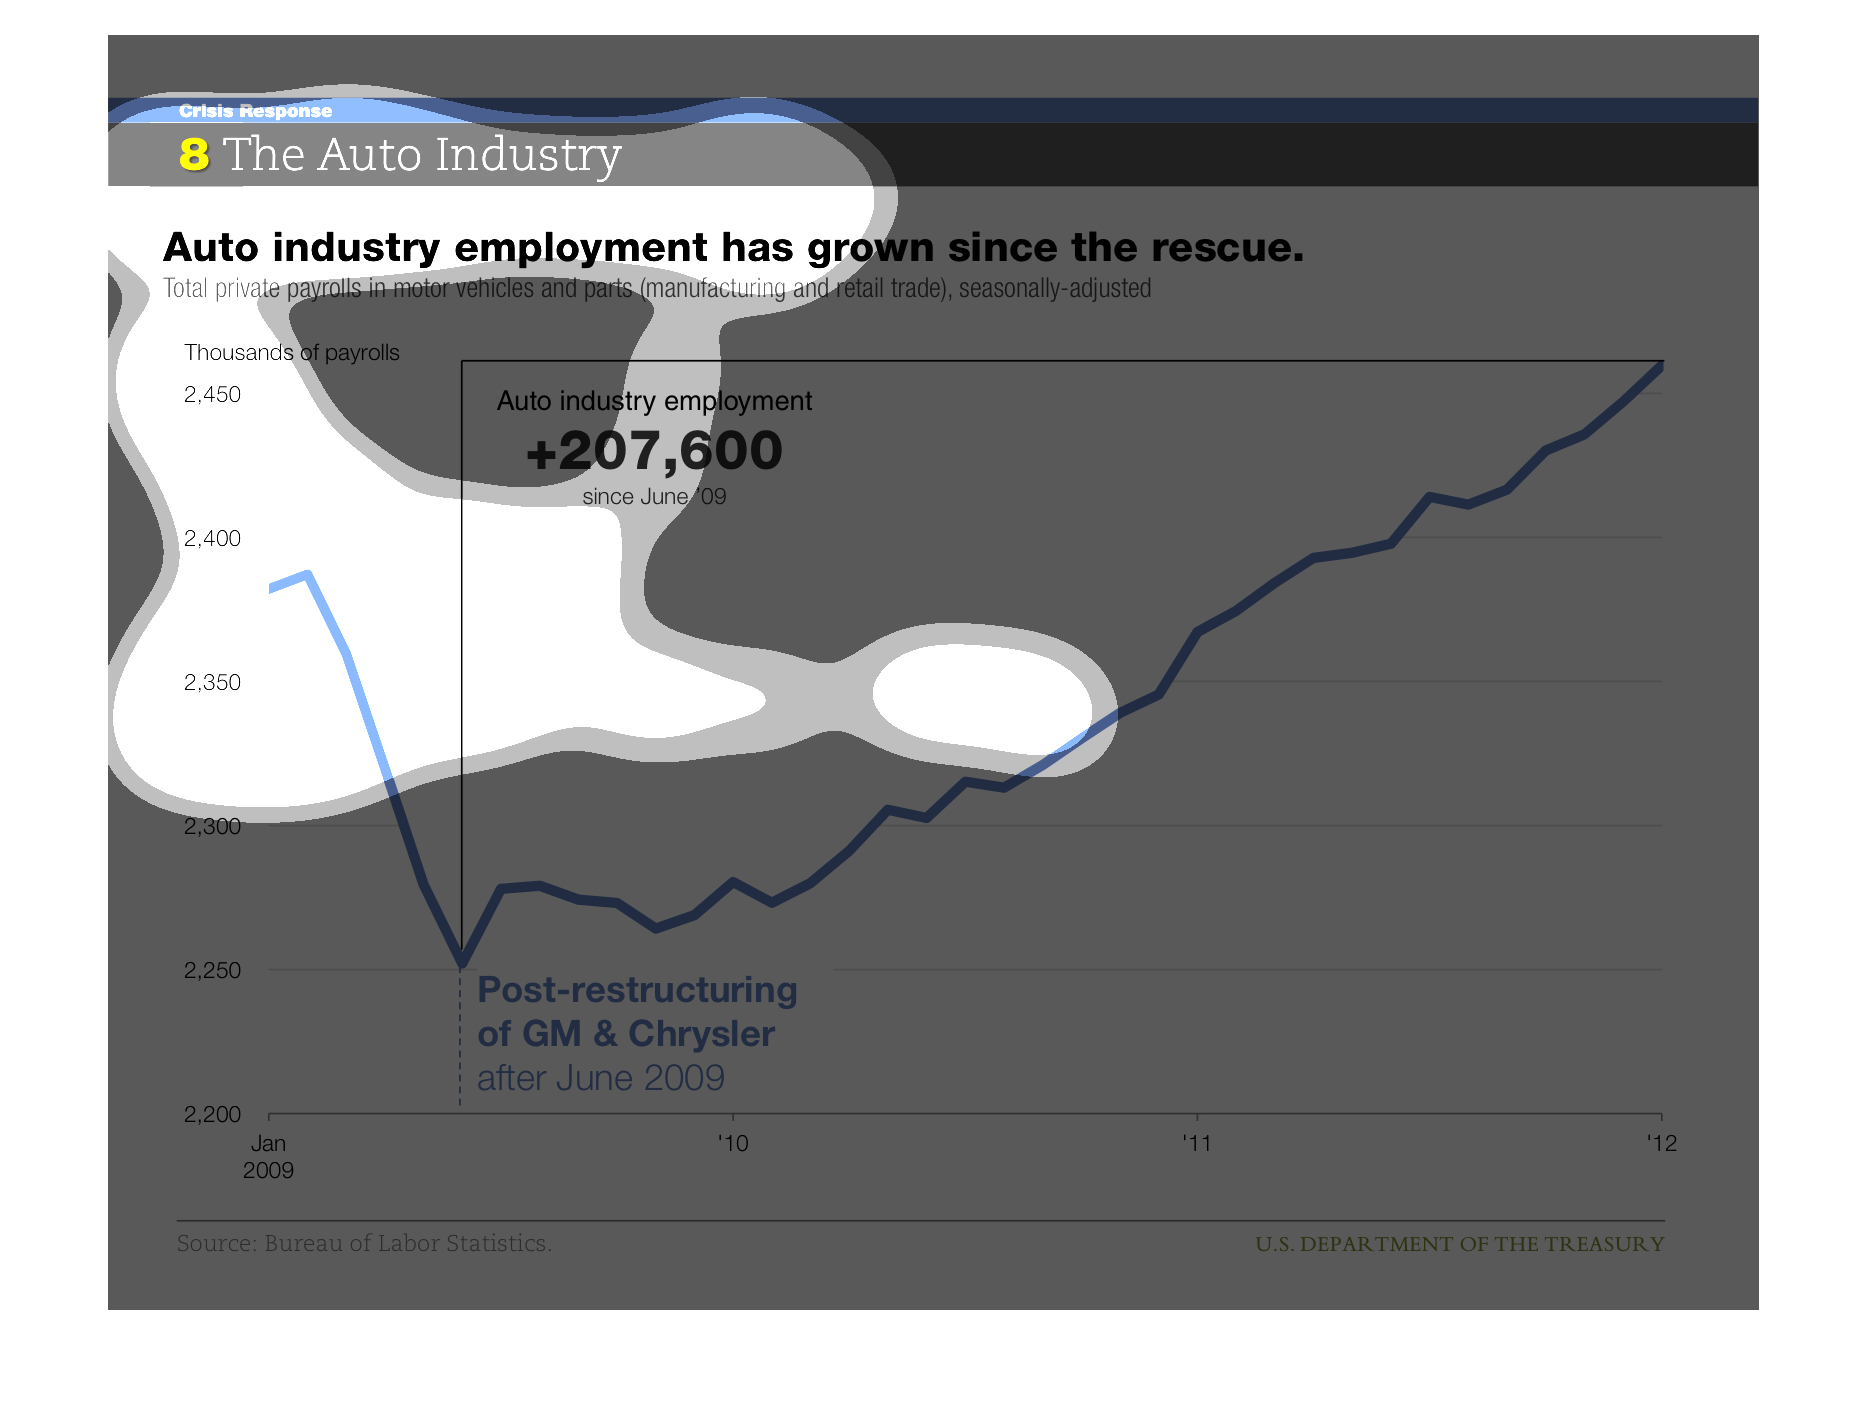
THIS PLOT SHOWS THAT THE NUMBER OF PEOPLE EMPLOYED IN THE AUTOMOTIVE INDUSTRY BOTTOMED AROUND
THE TIME OF THE BAILOUTS IN 2009 THEN STEADILY INCREASED UNTIL 2012.
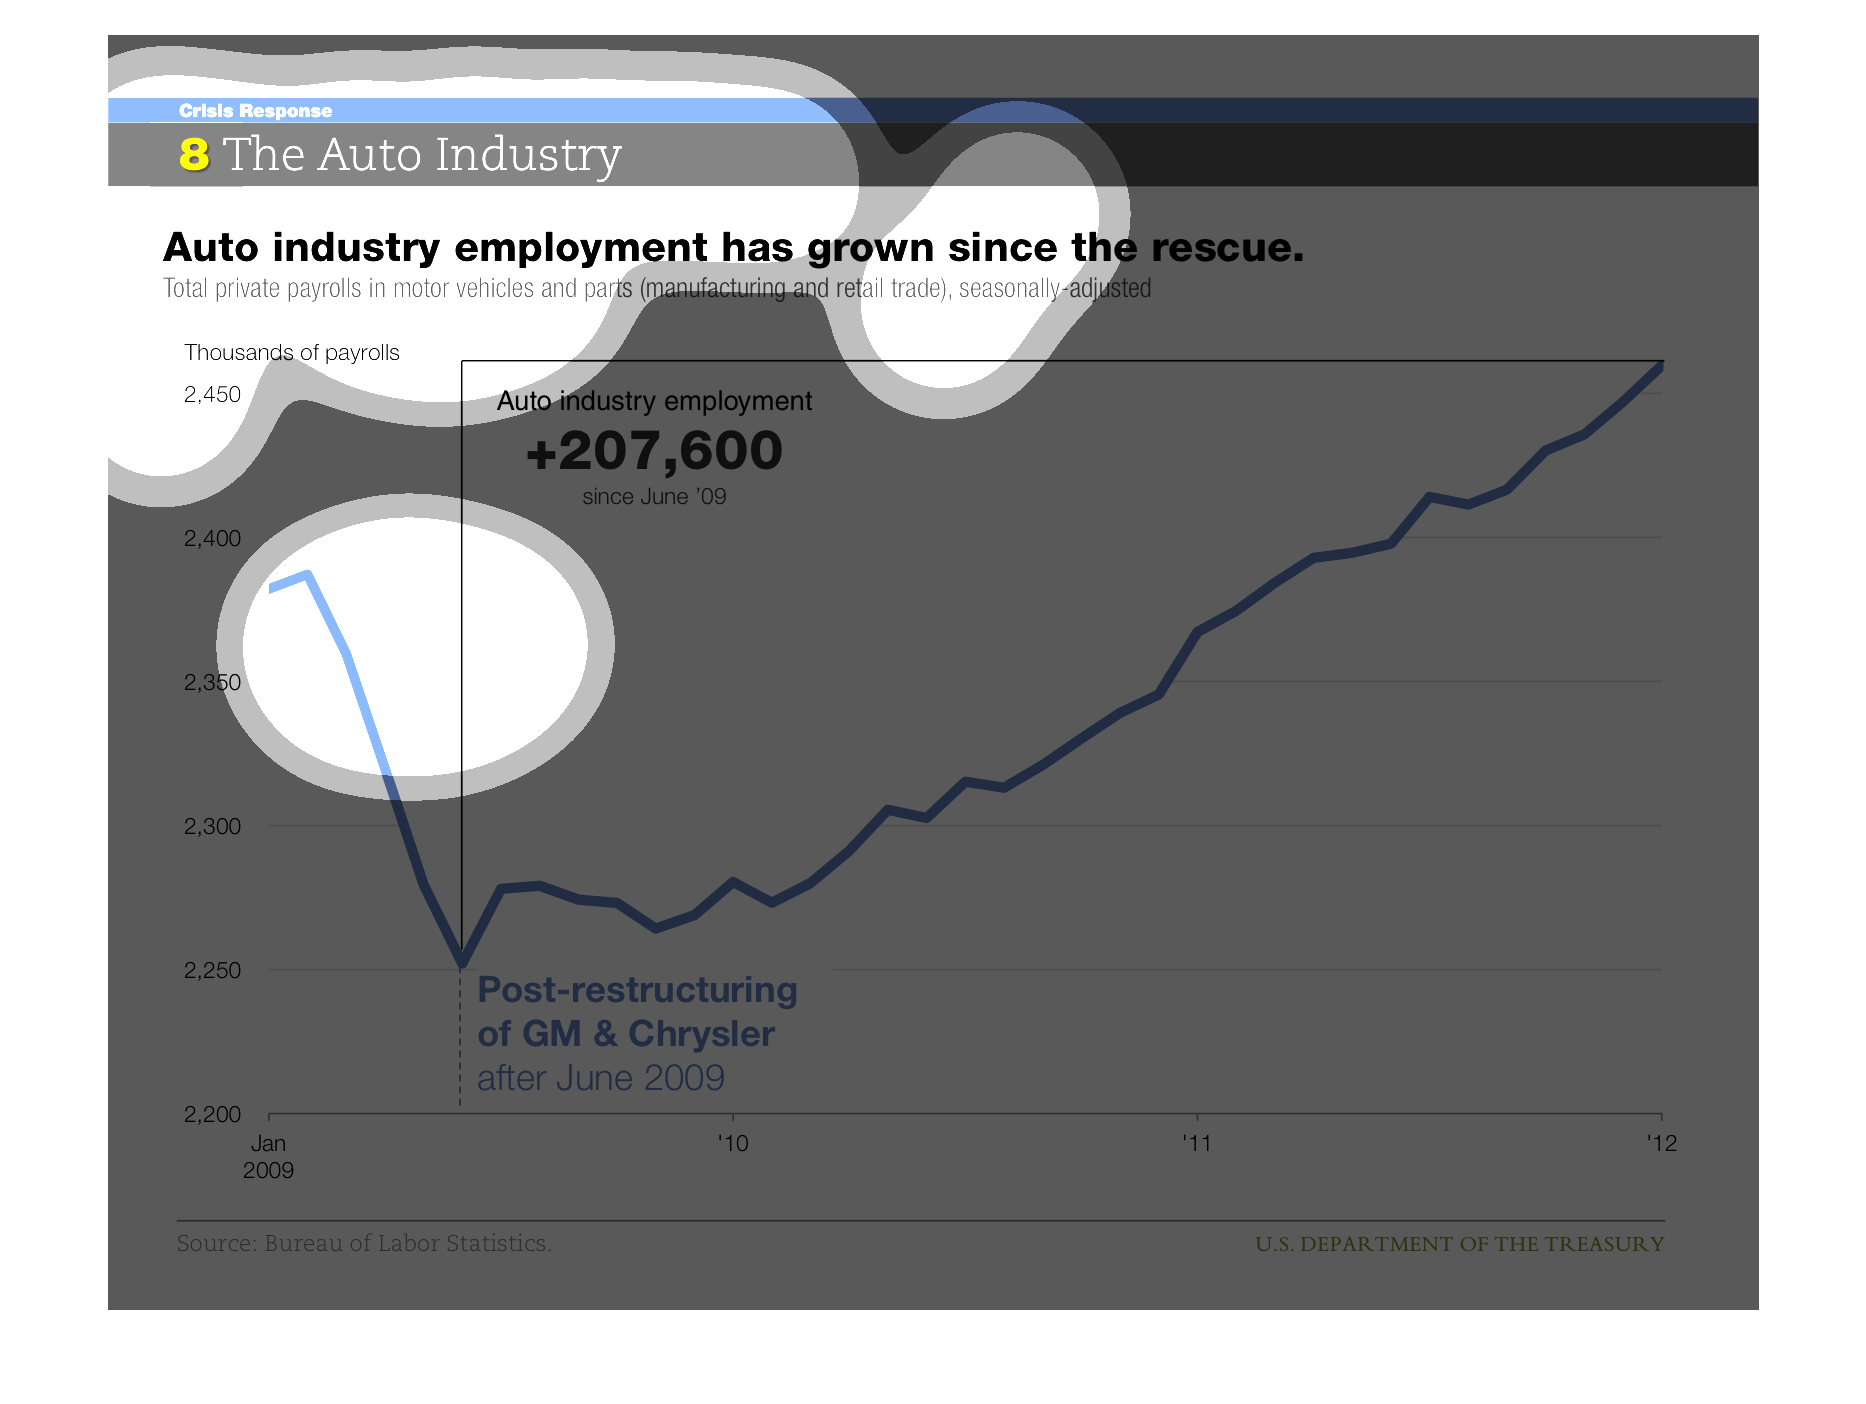
This graph illustrates how auto industry employment has grown since the rescue.  It displays
the time period from 2004 to 2012 with a dip in 2009 for the GM and Chrysler restructuring
then steady increase afterward.
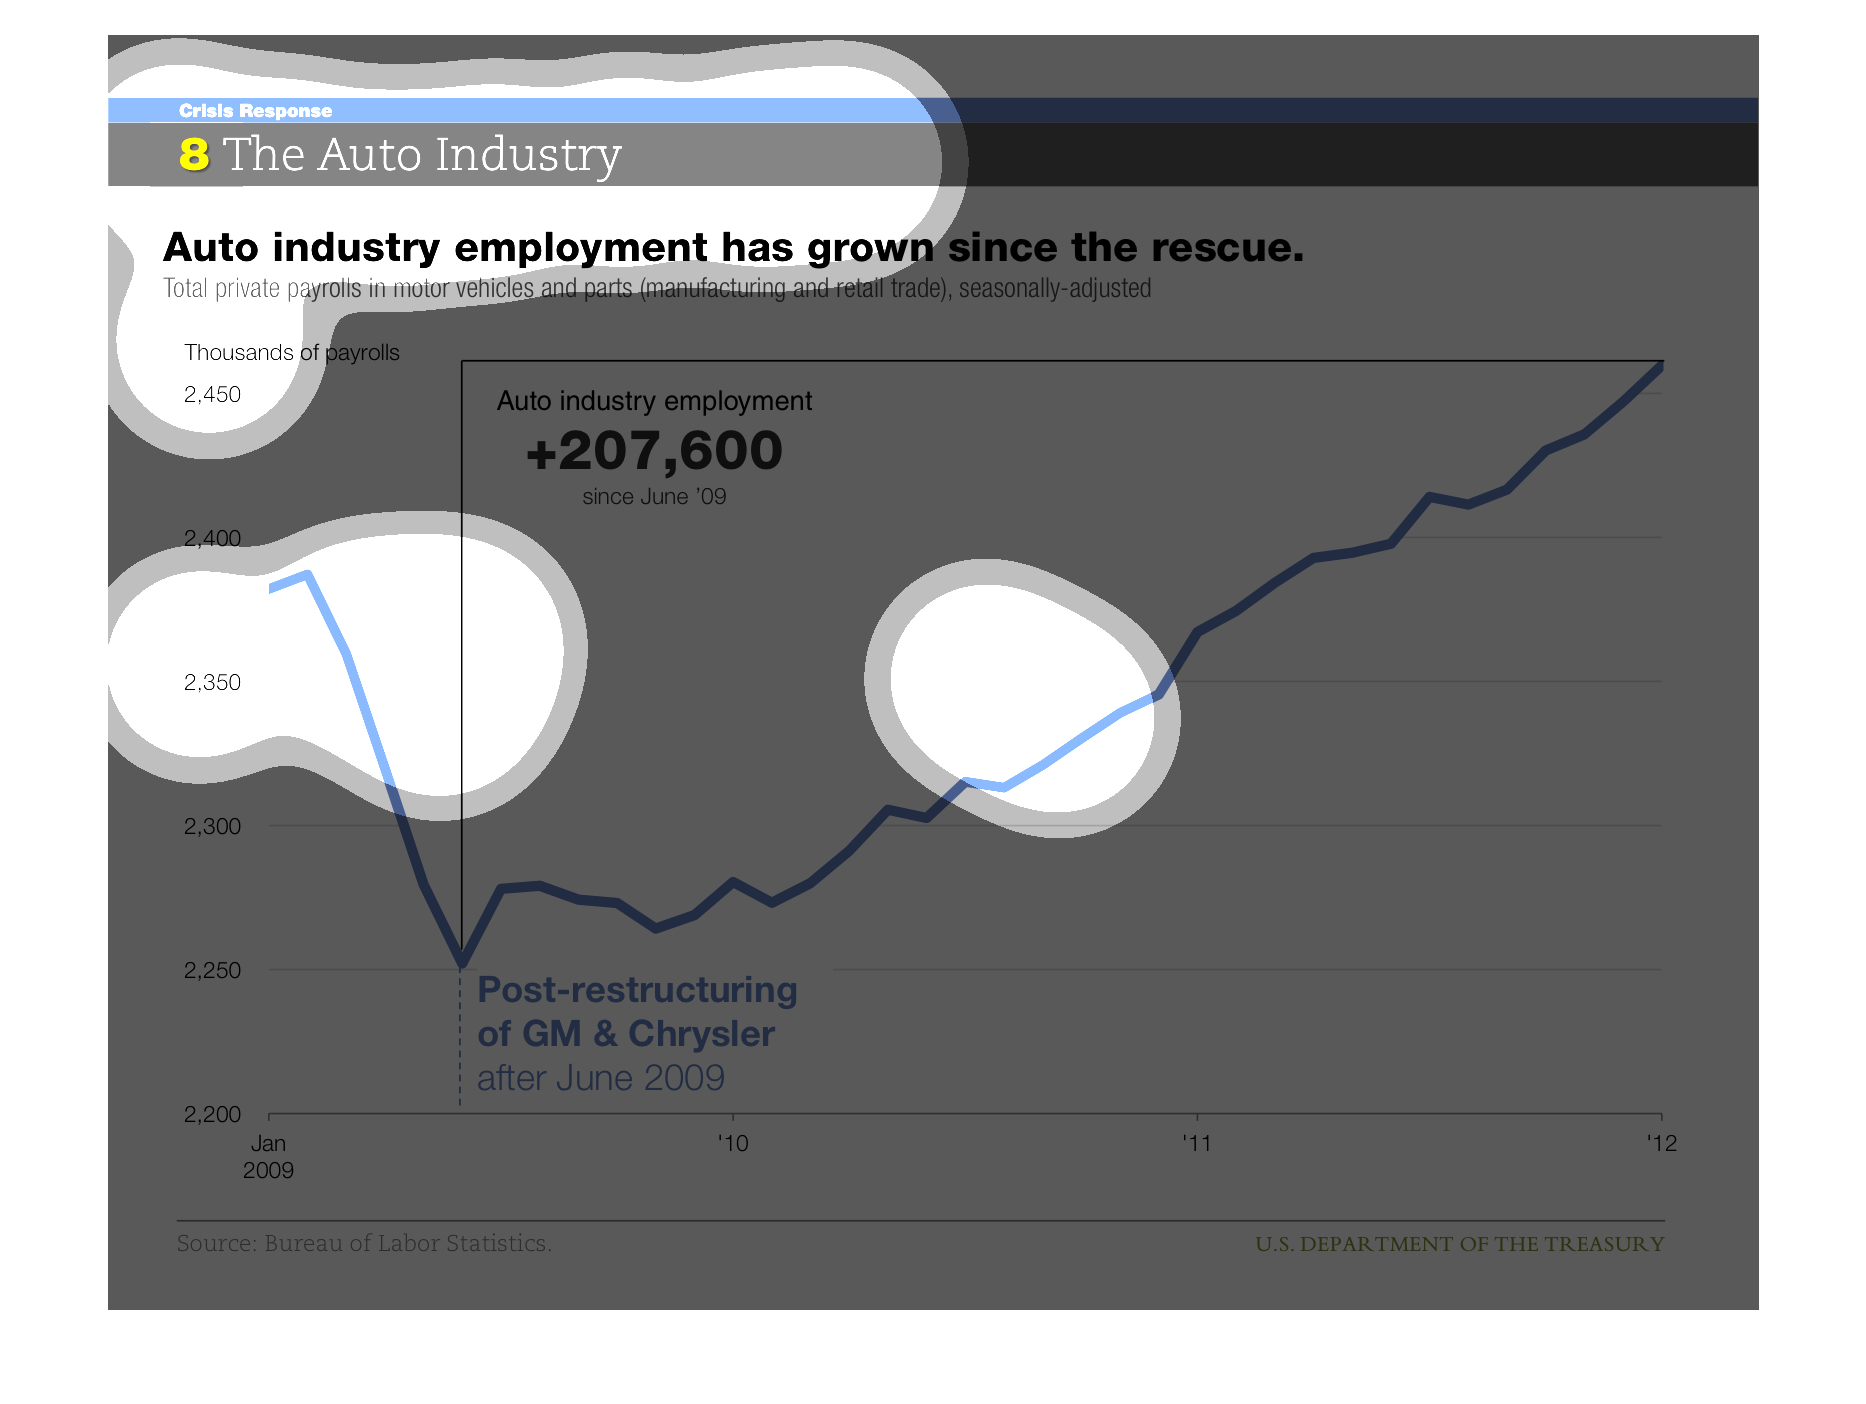
This graph shows employment growth in the automobile industry since the industry was rescued
during the recession. GM and Chrysler are specifically mentioned.
This is a chart depicting how the auto industry employment has grown since the rescue of the
economy following the financial crises in terms of total private payrolls.