Warning: Image is too big to fit on screen; displaying at 50%
This chart and article describes how government intervention in regard to the financial crisis
has helped keep housing prices low. Both charts show how foreclosure rates changed over time.
Warning: Image is too big to fit on screen; displaying at 50%
Warning: Image is too big to fit on screen; displaying at 50%
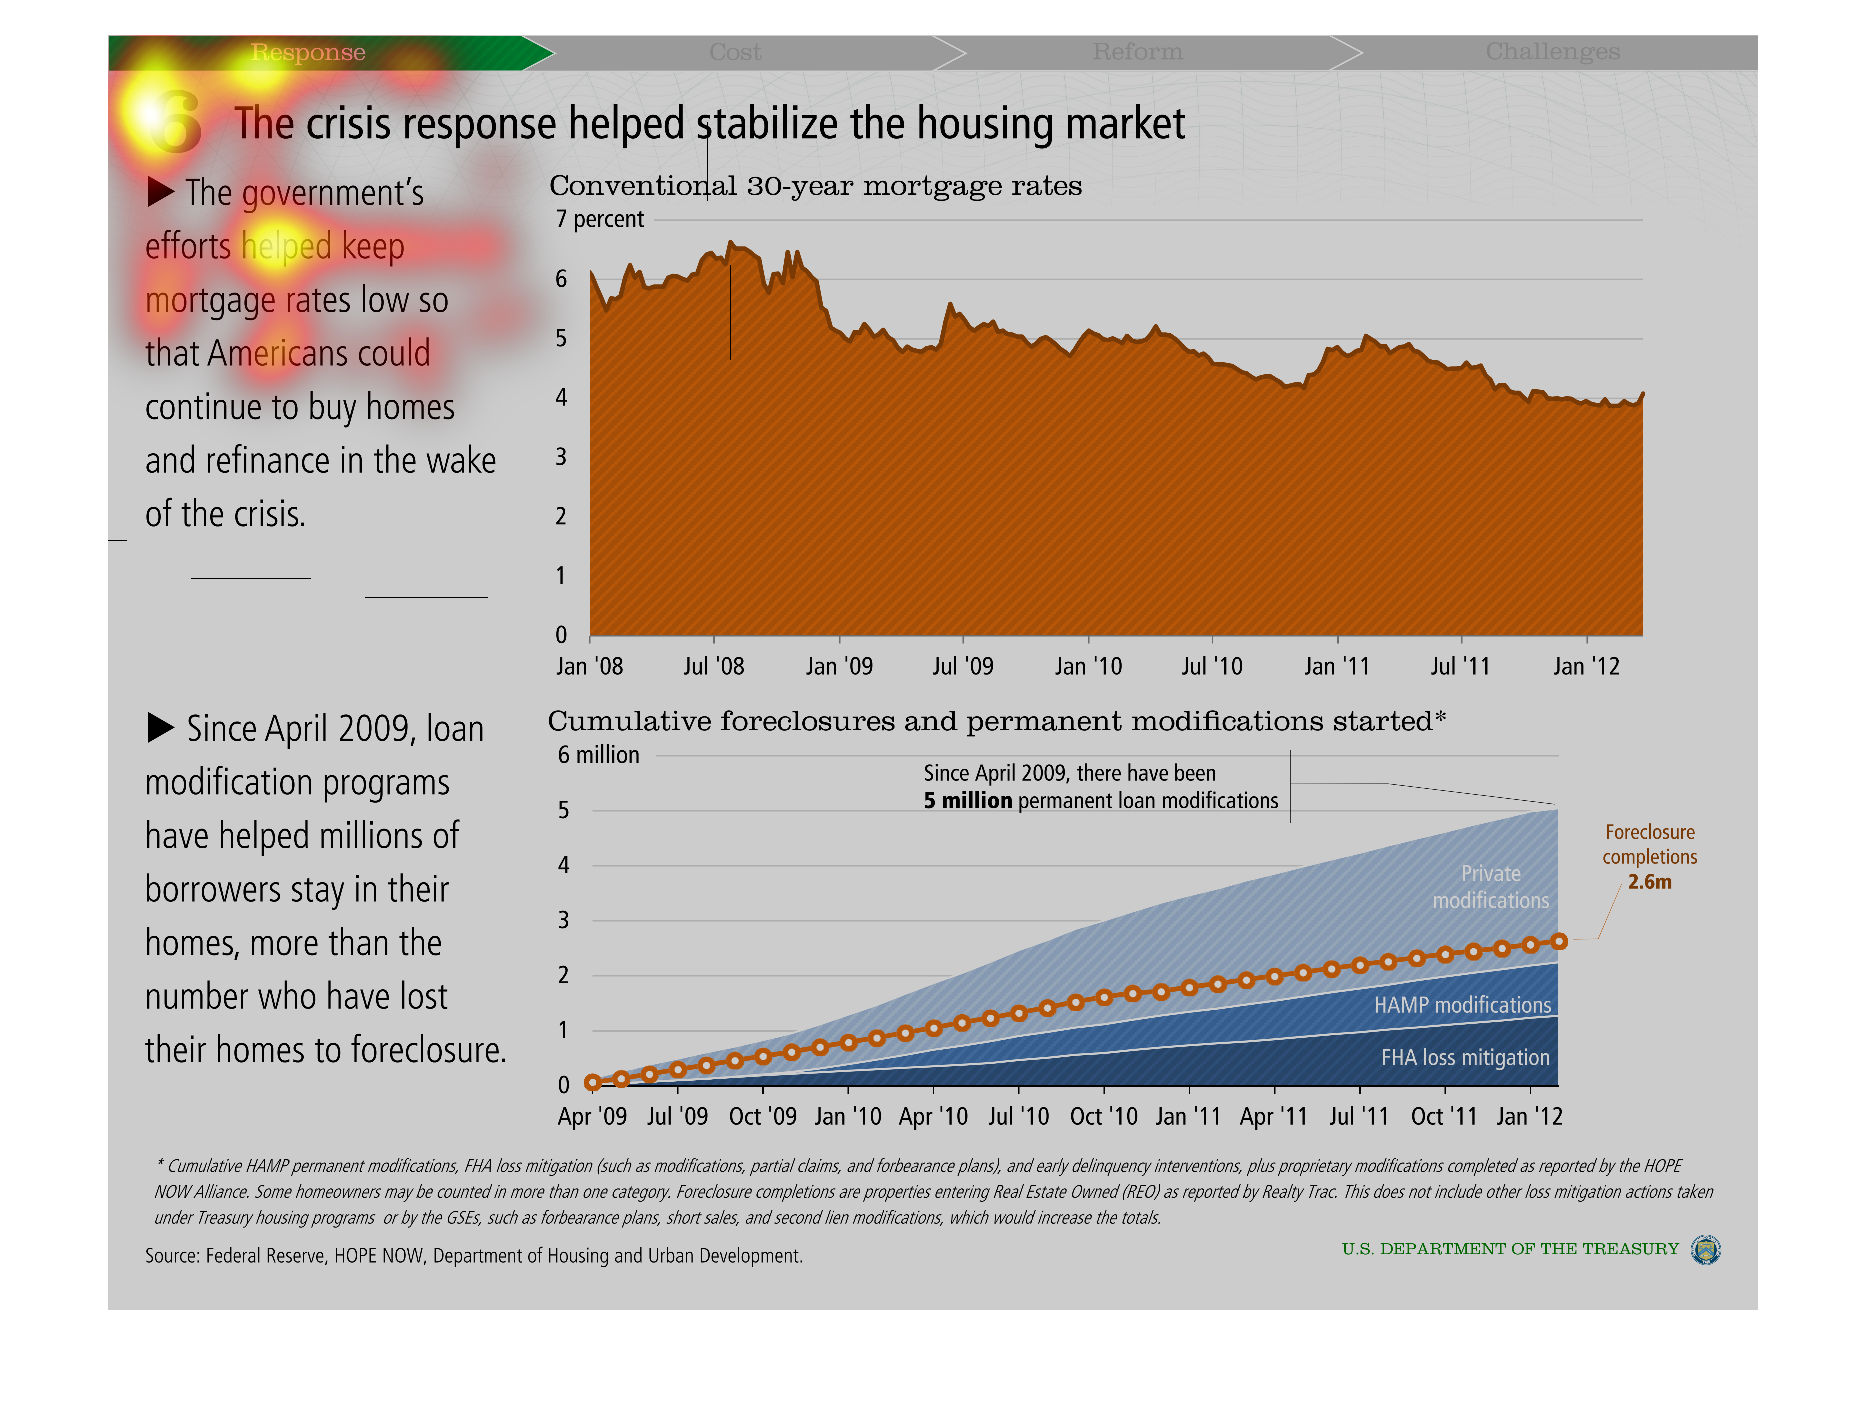
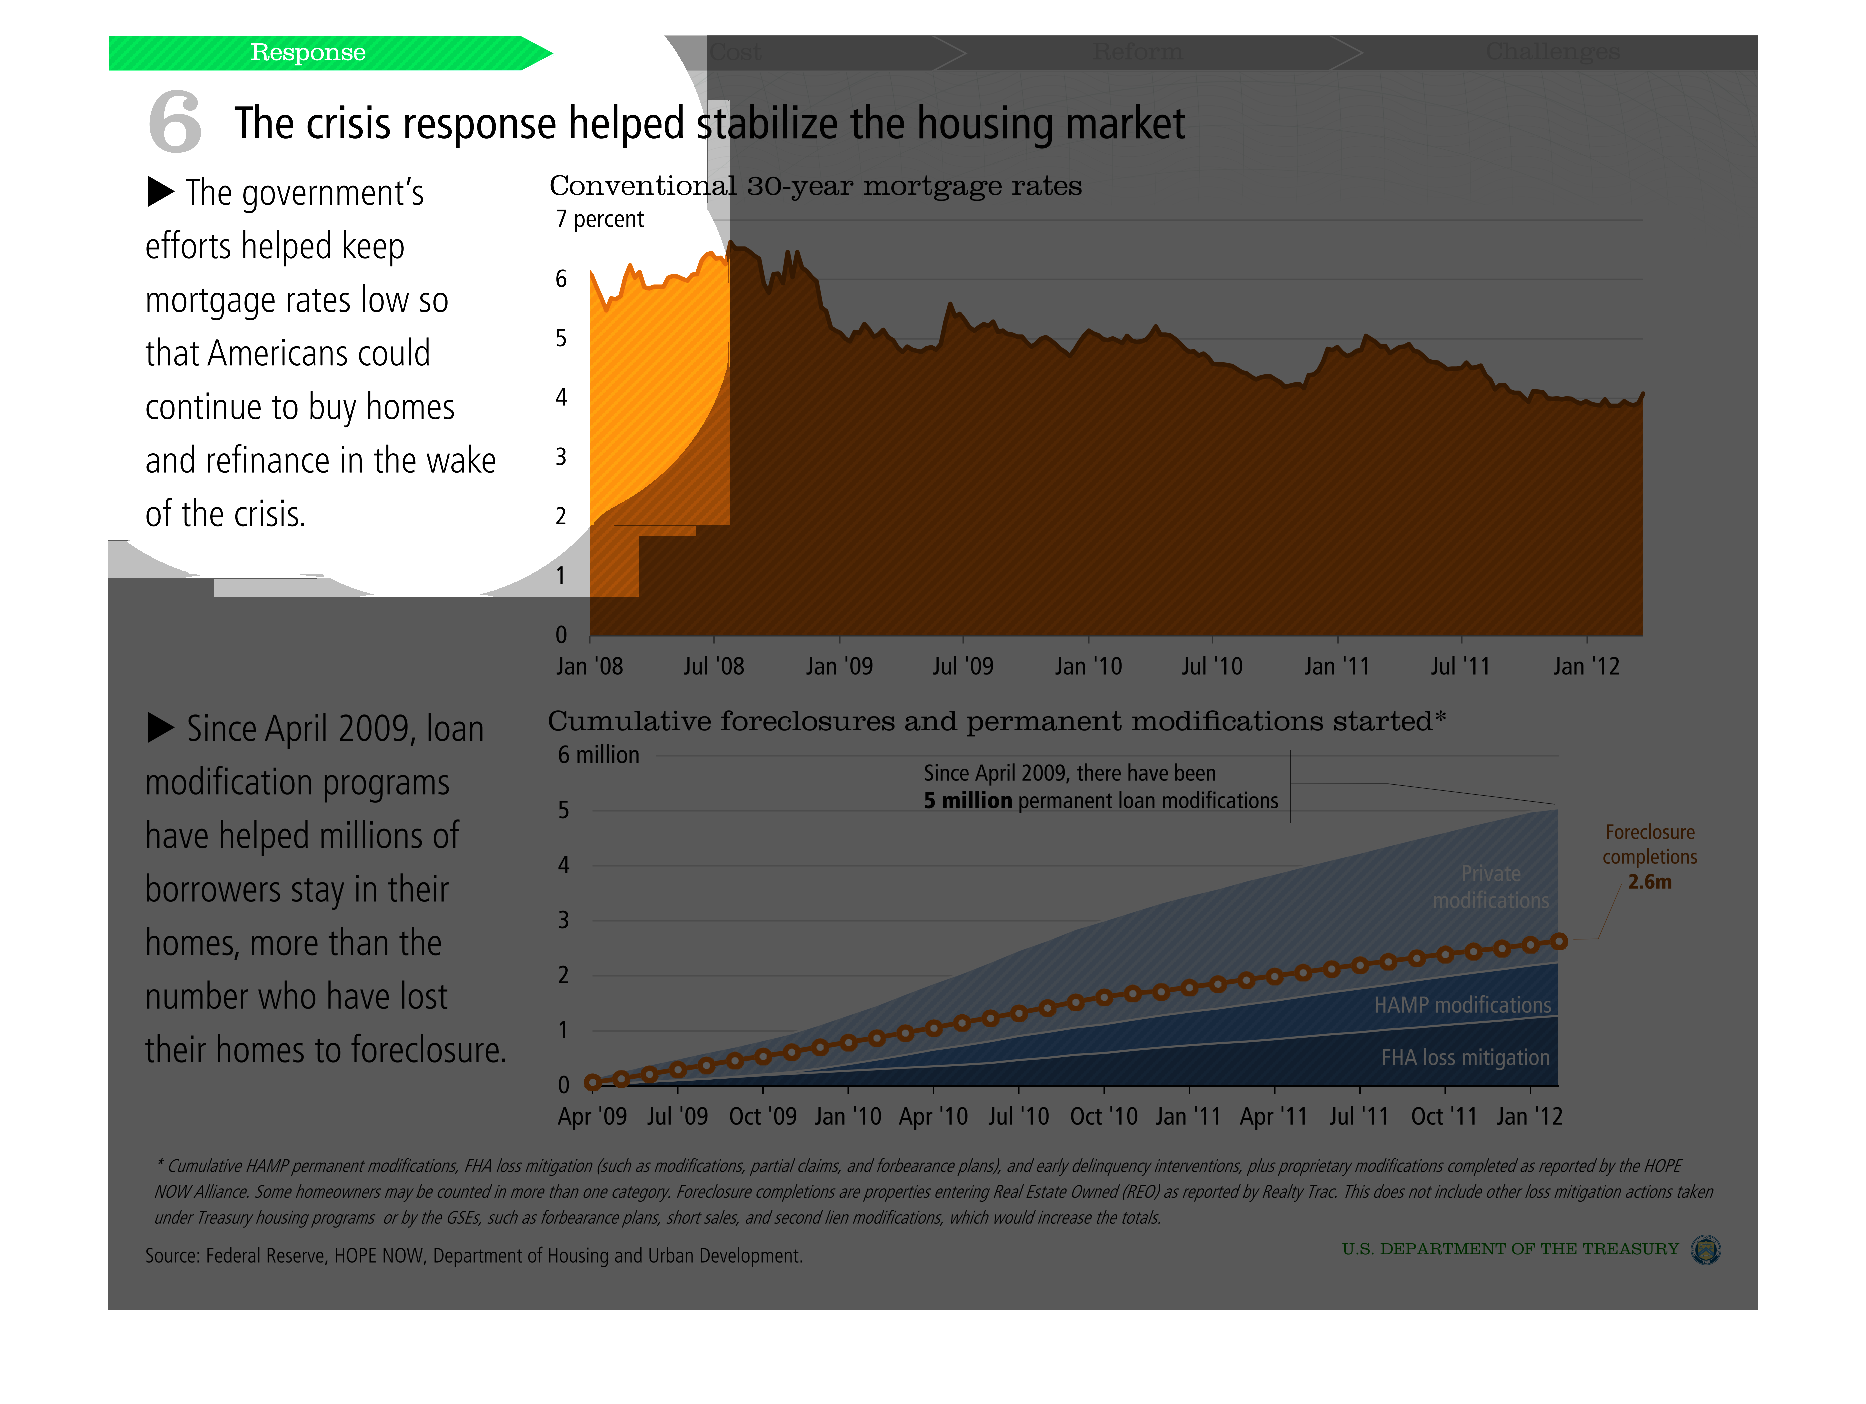
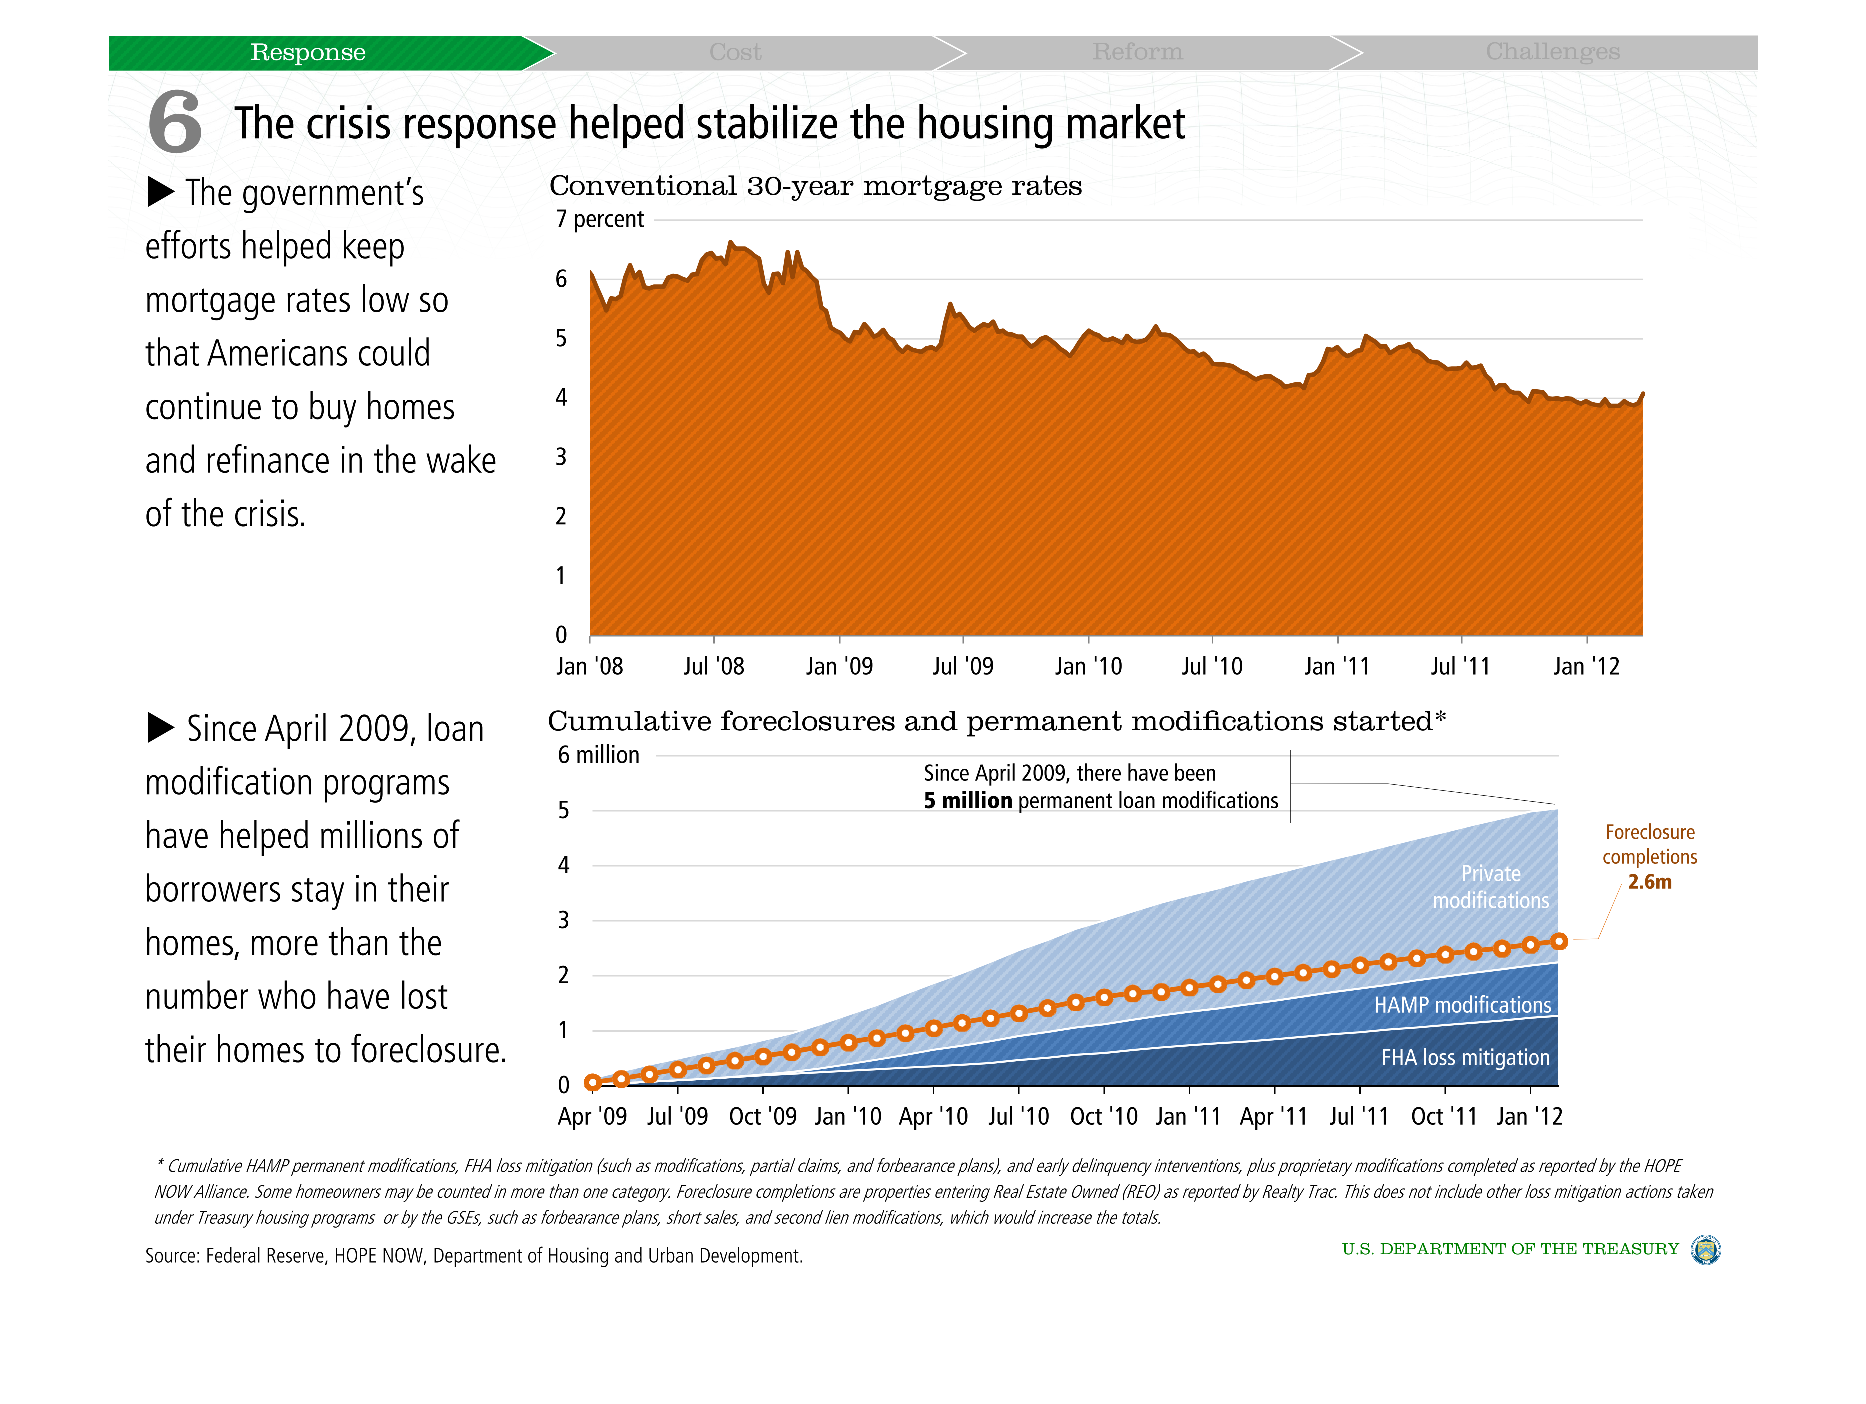
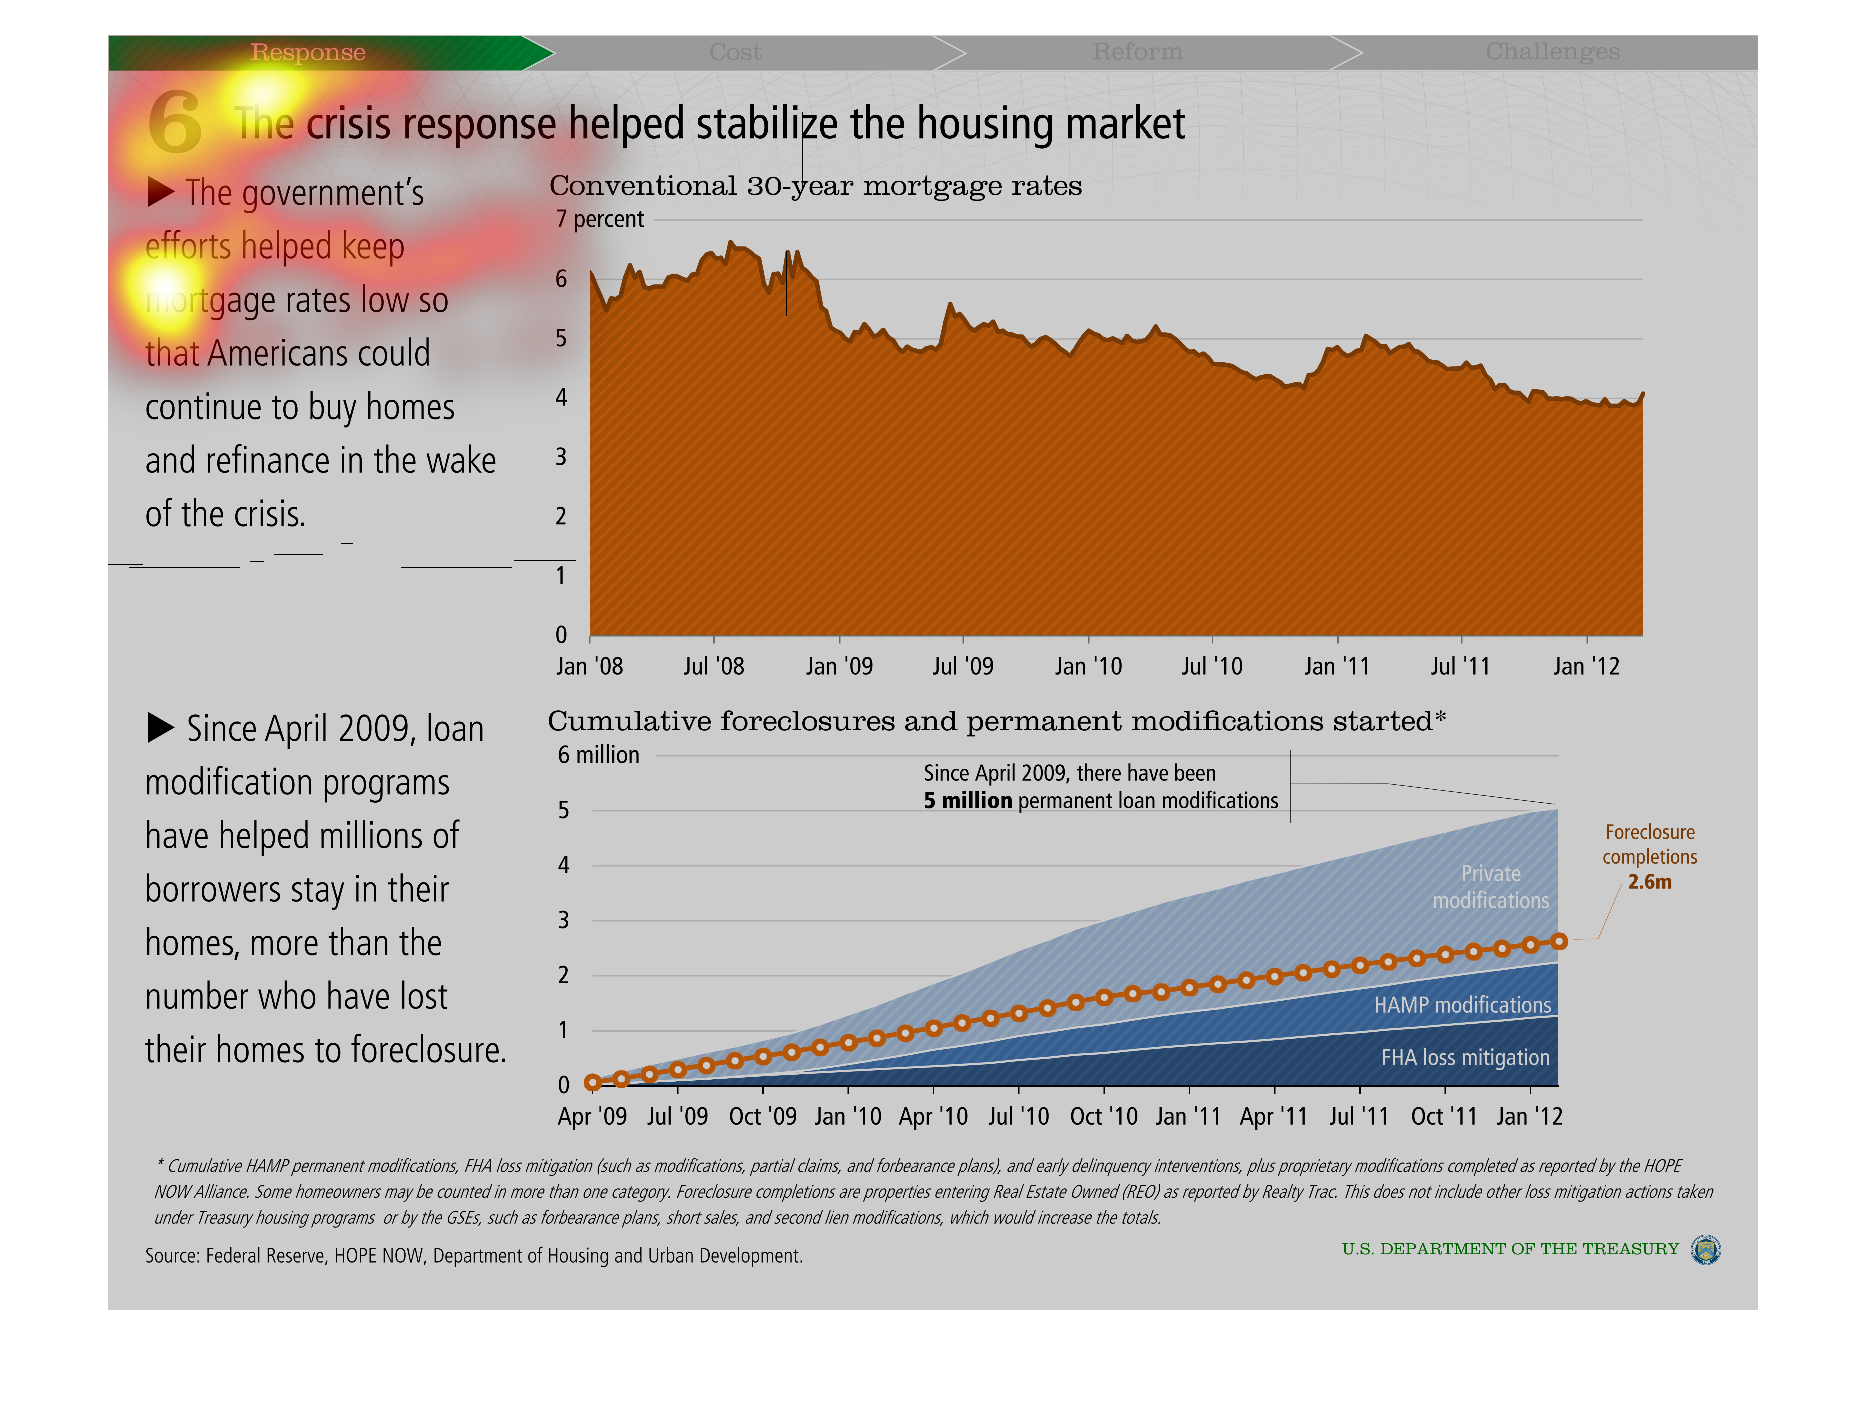
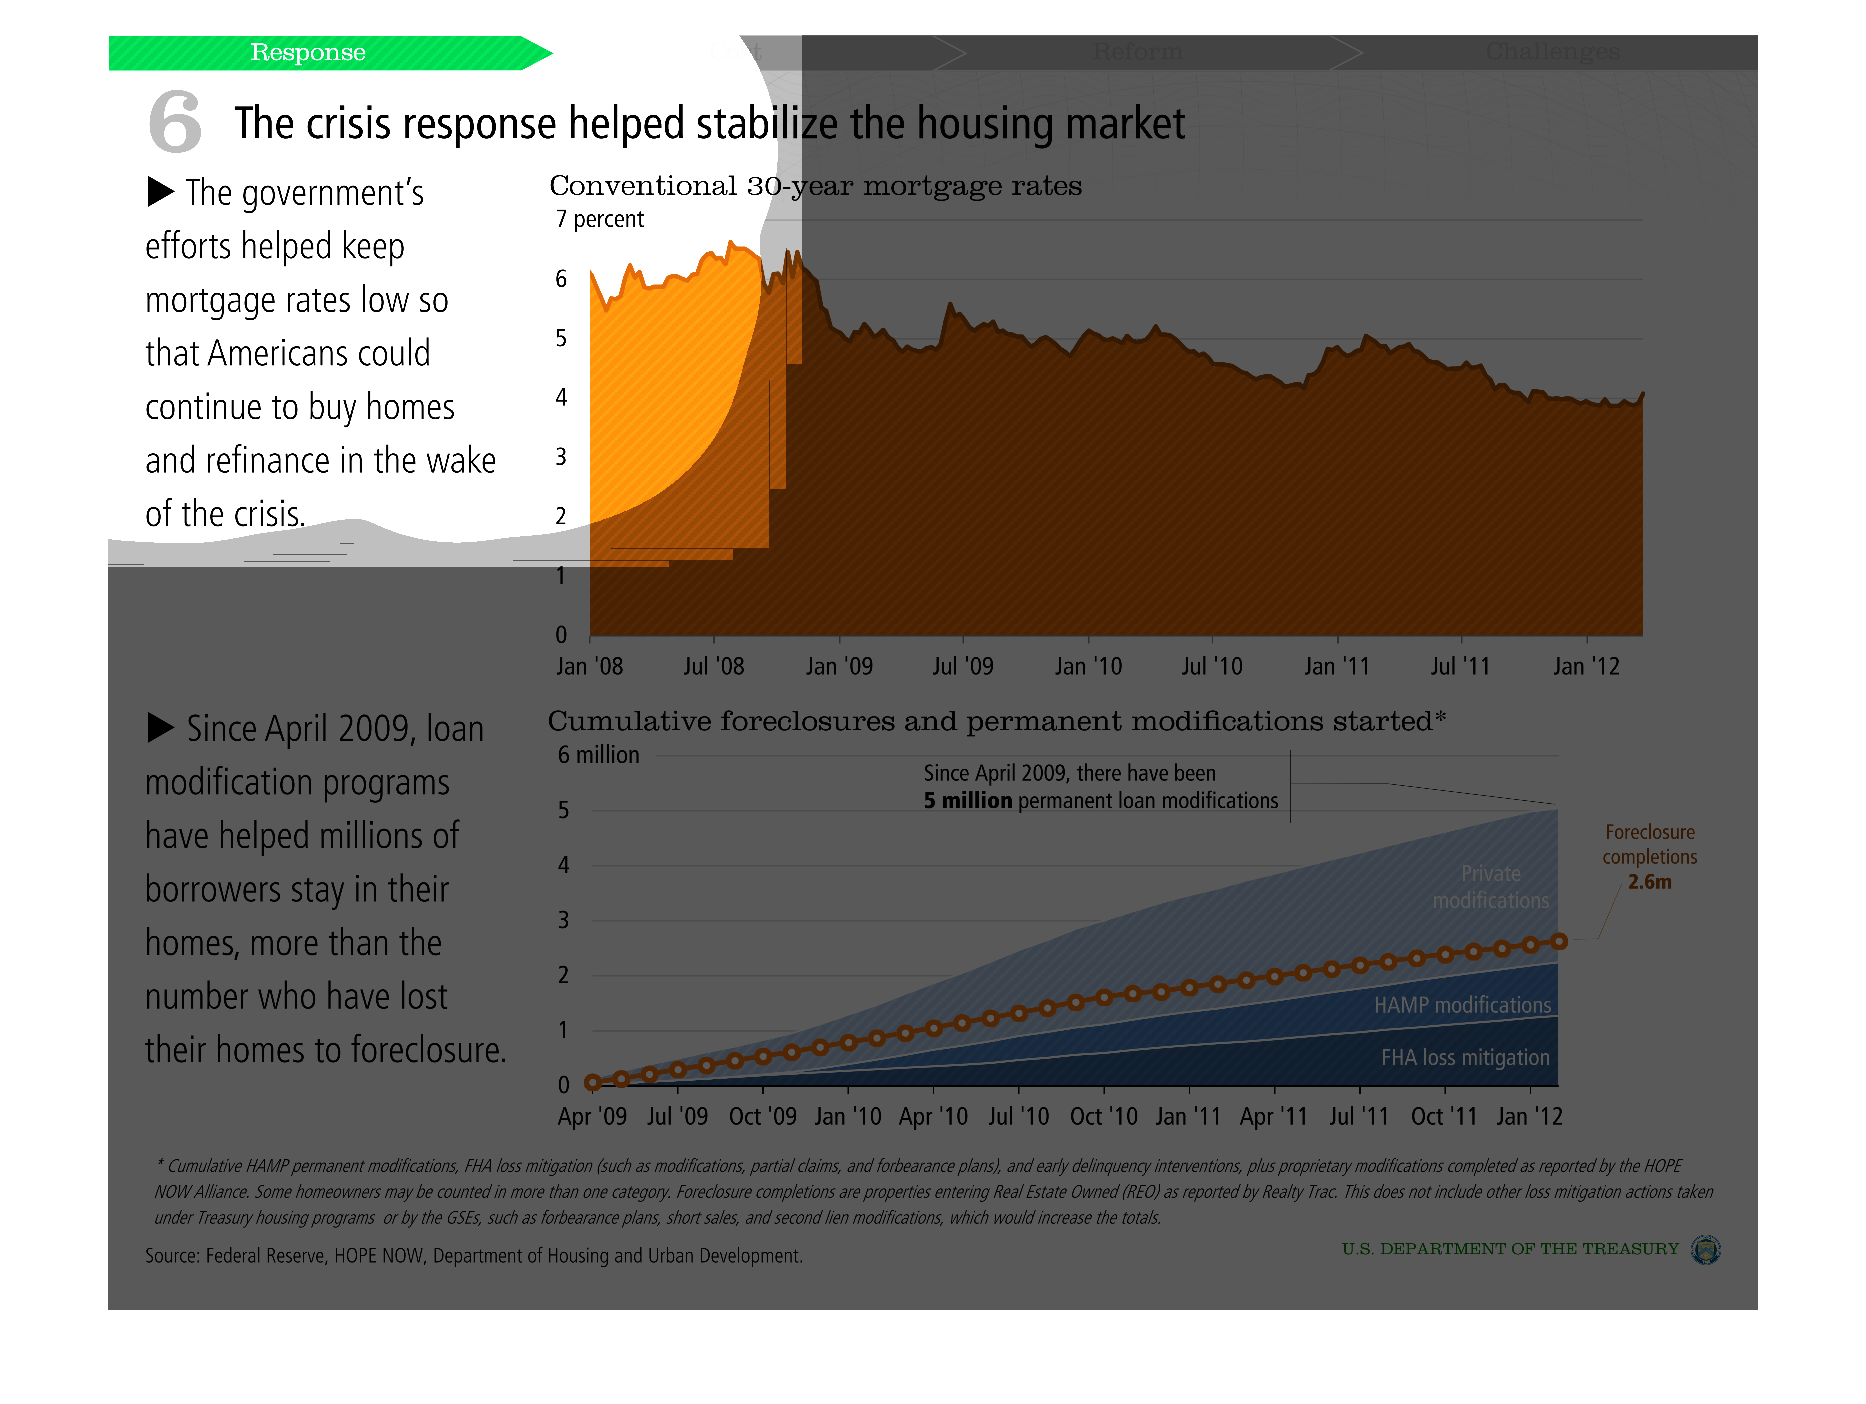
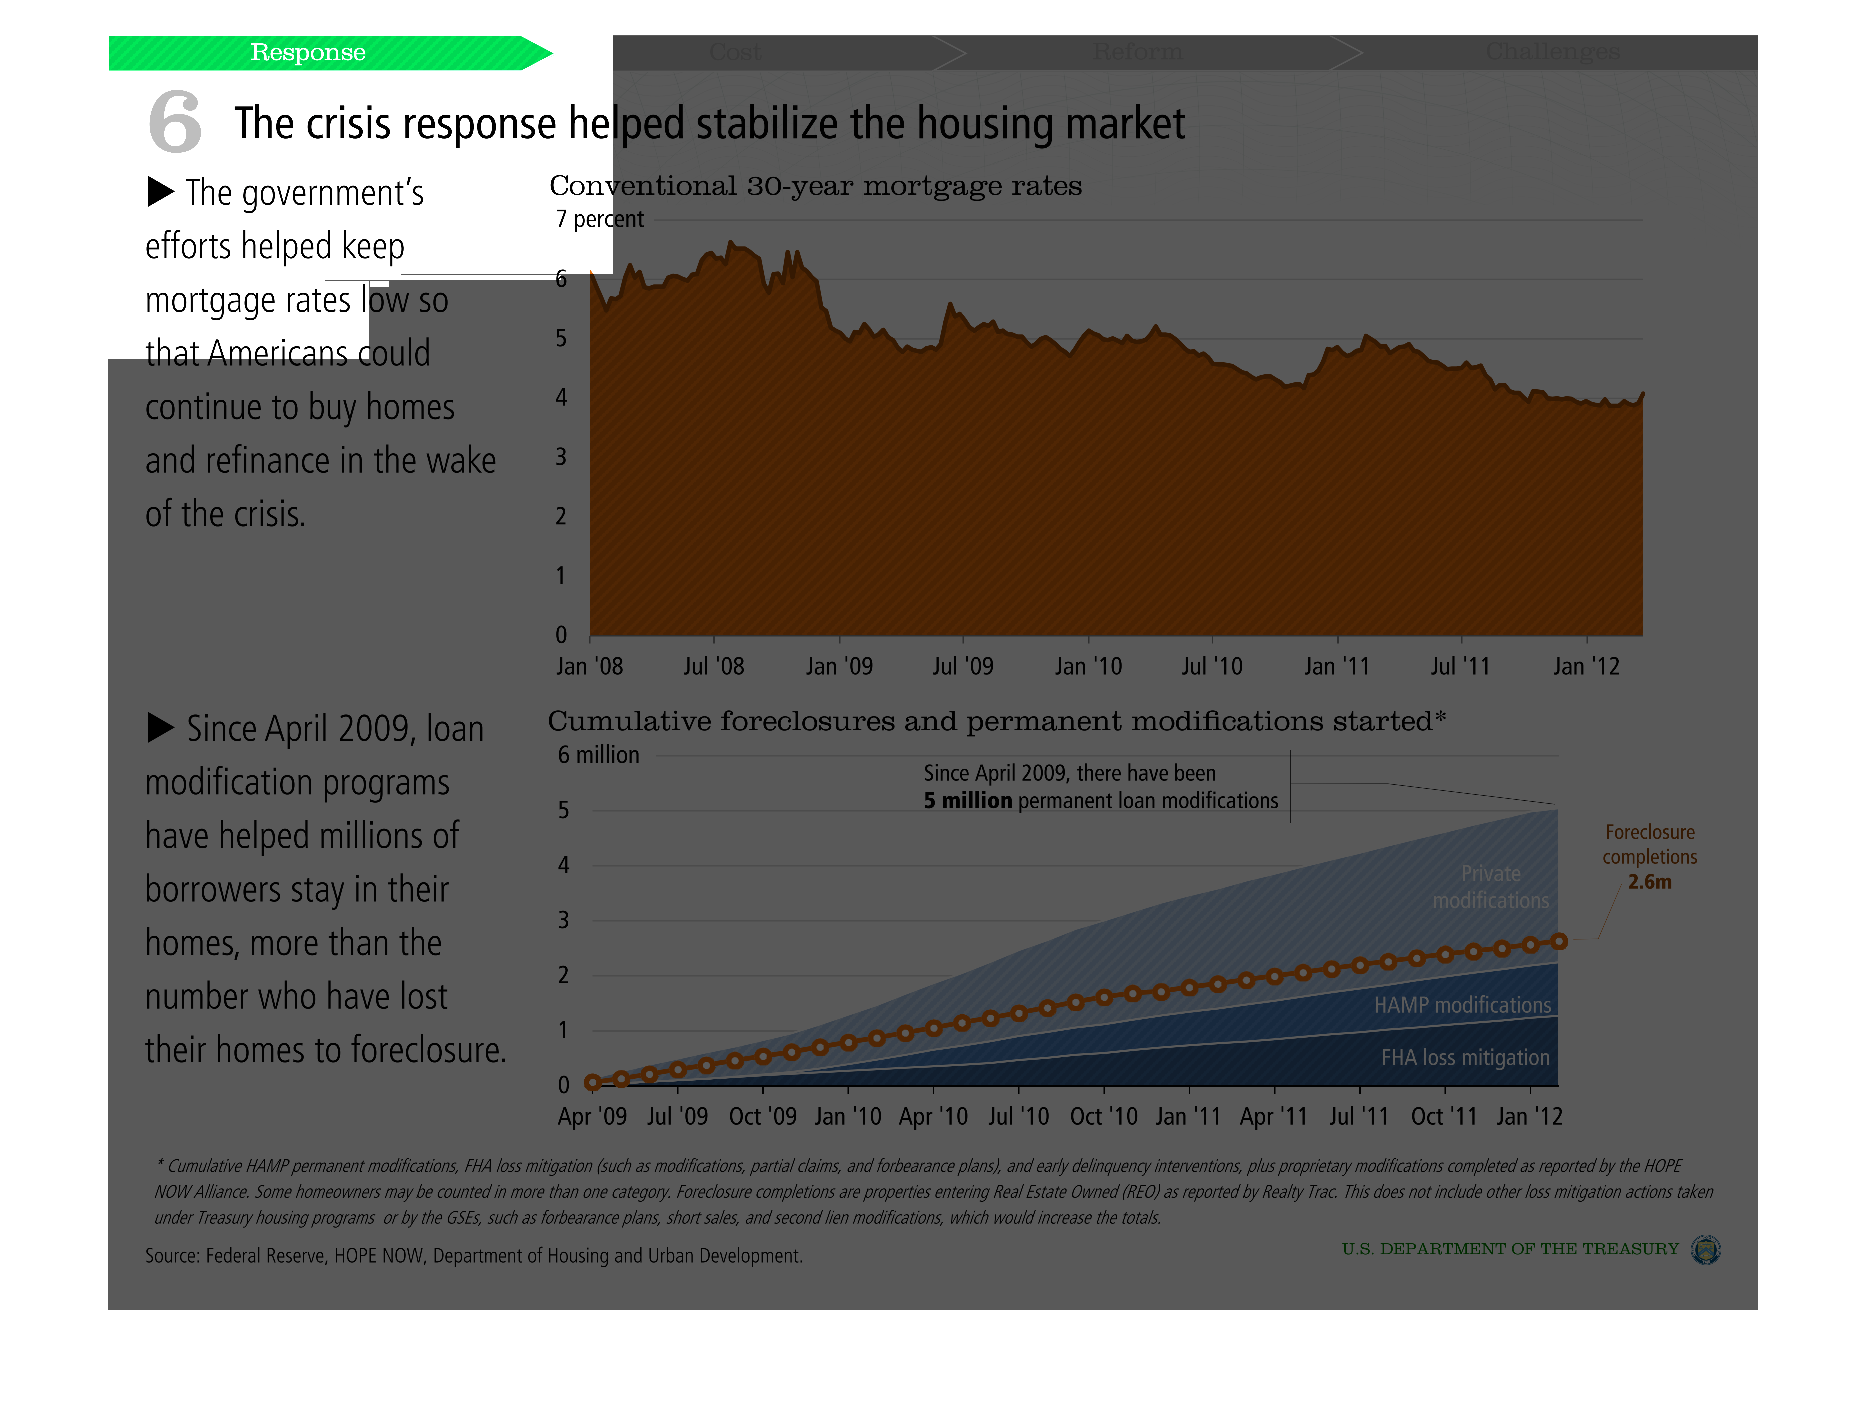
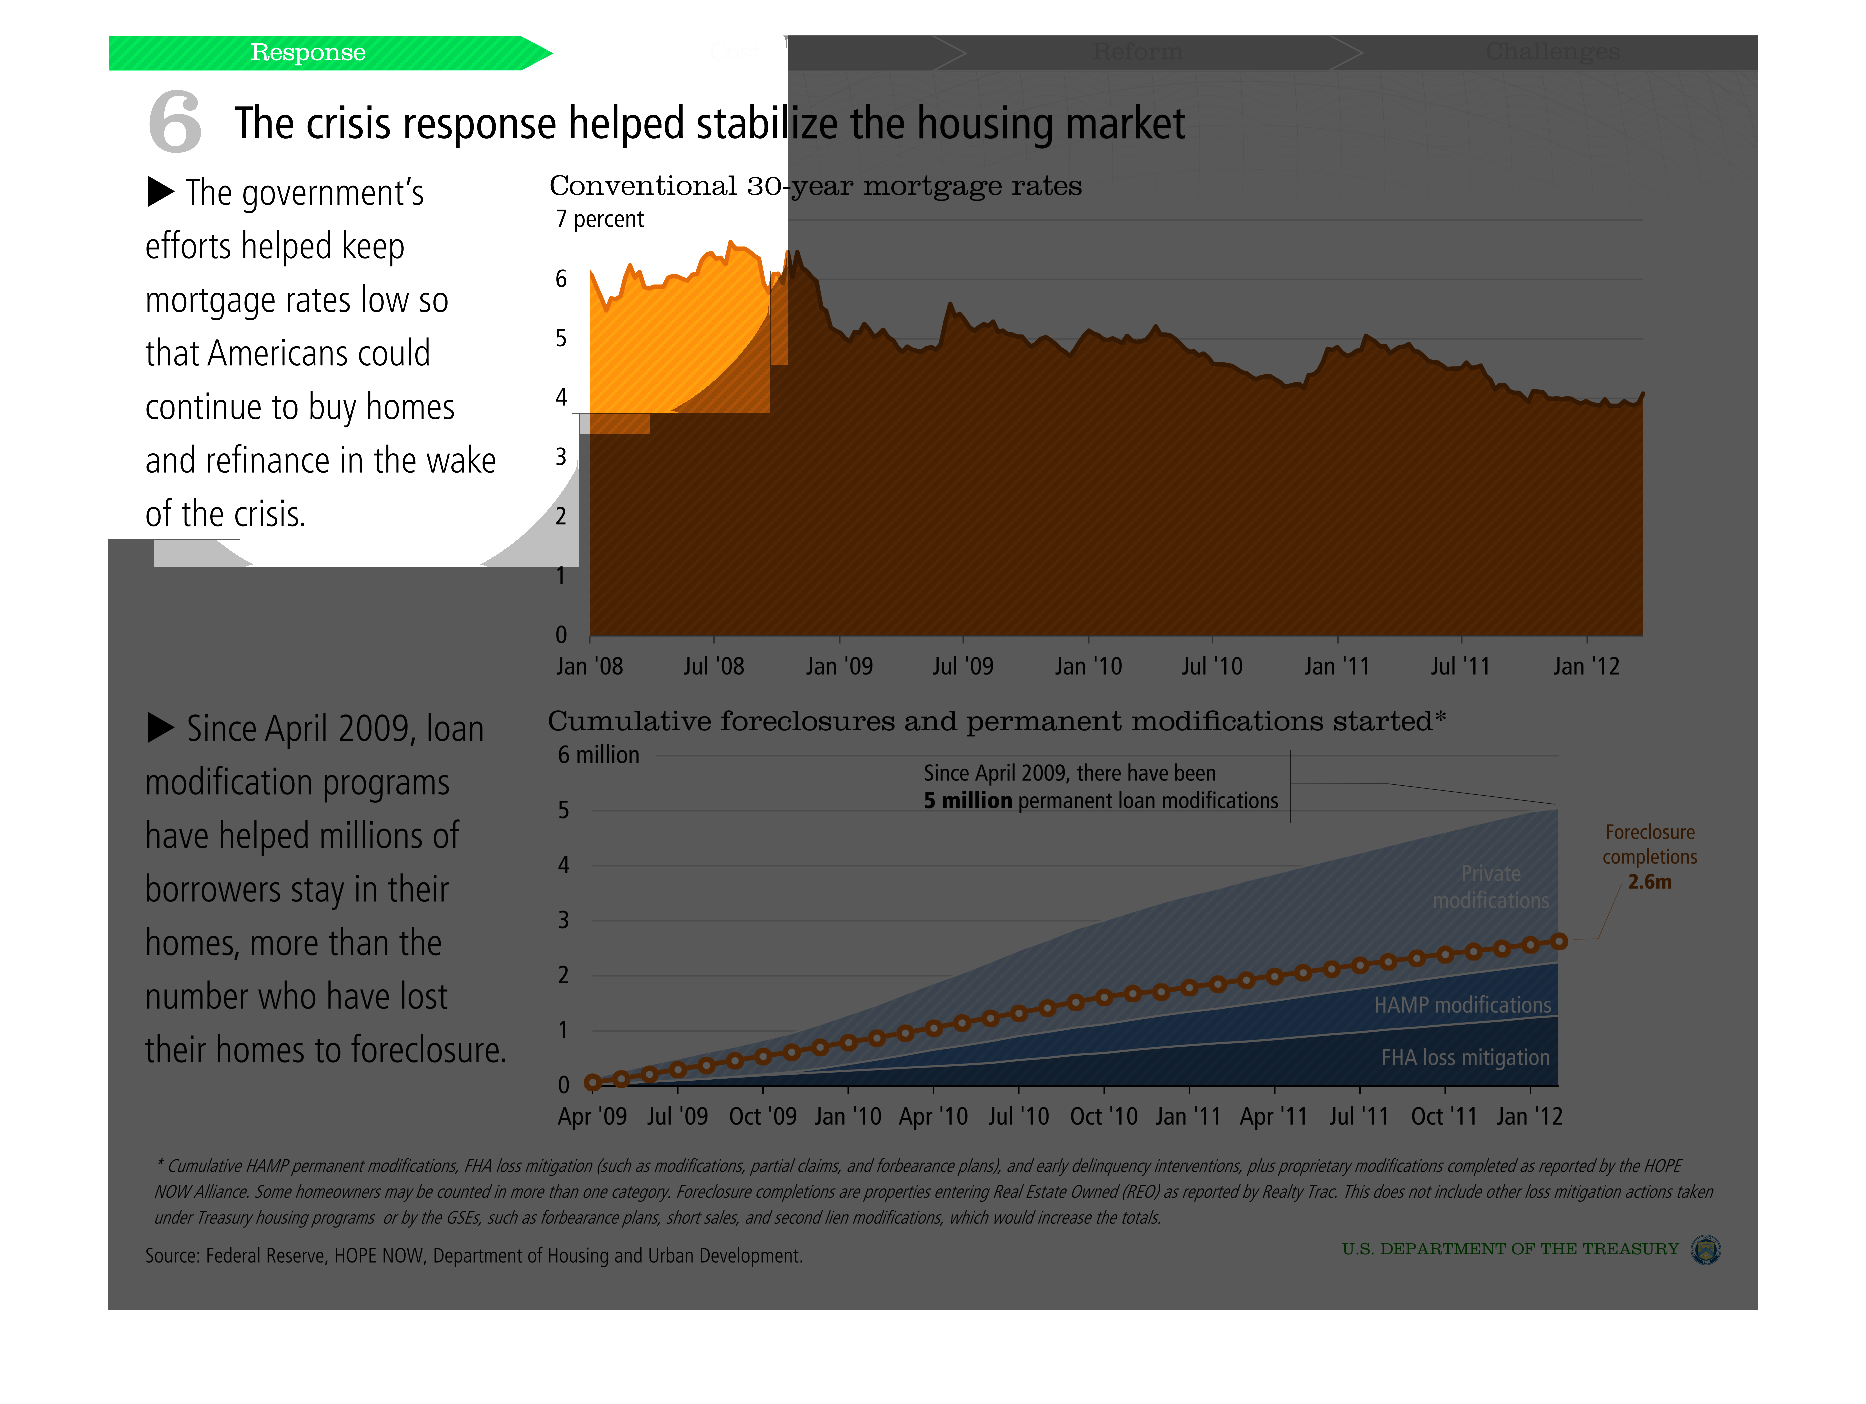
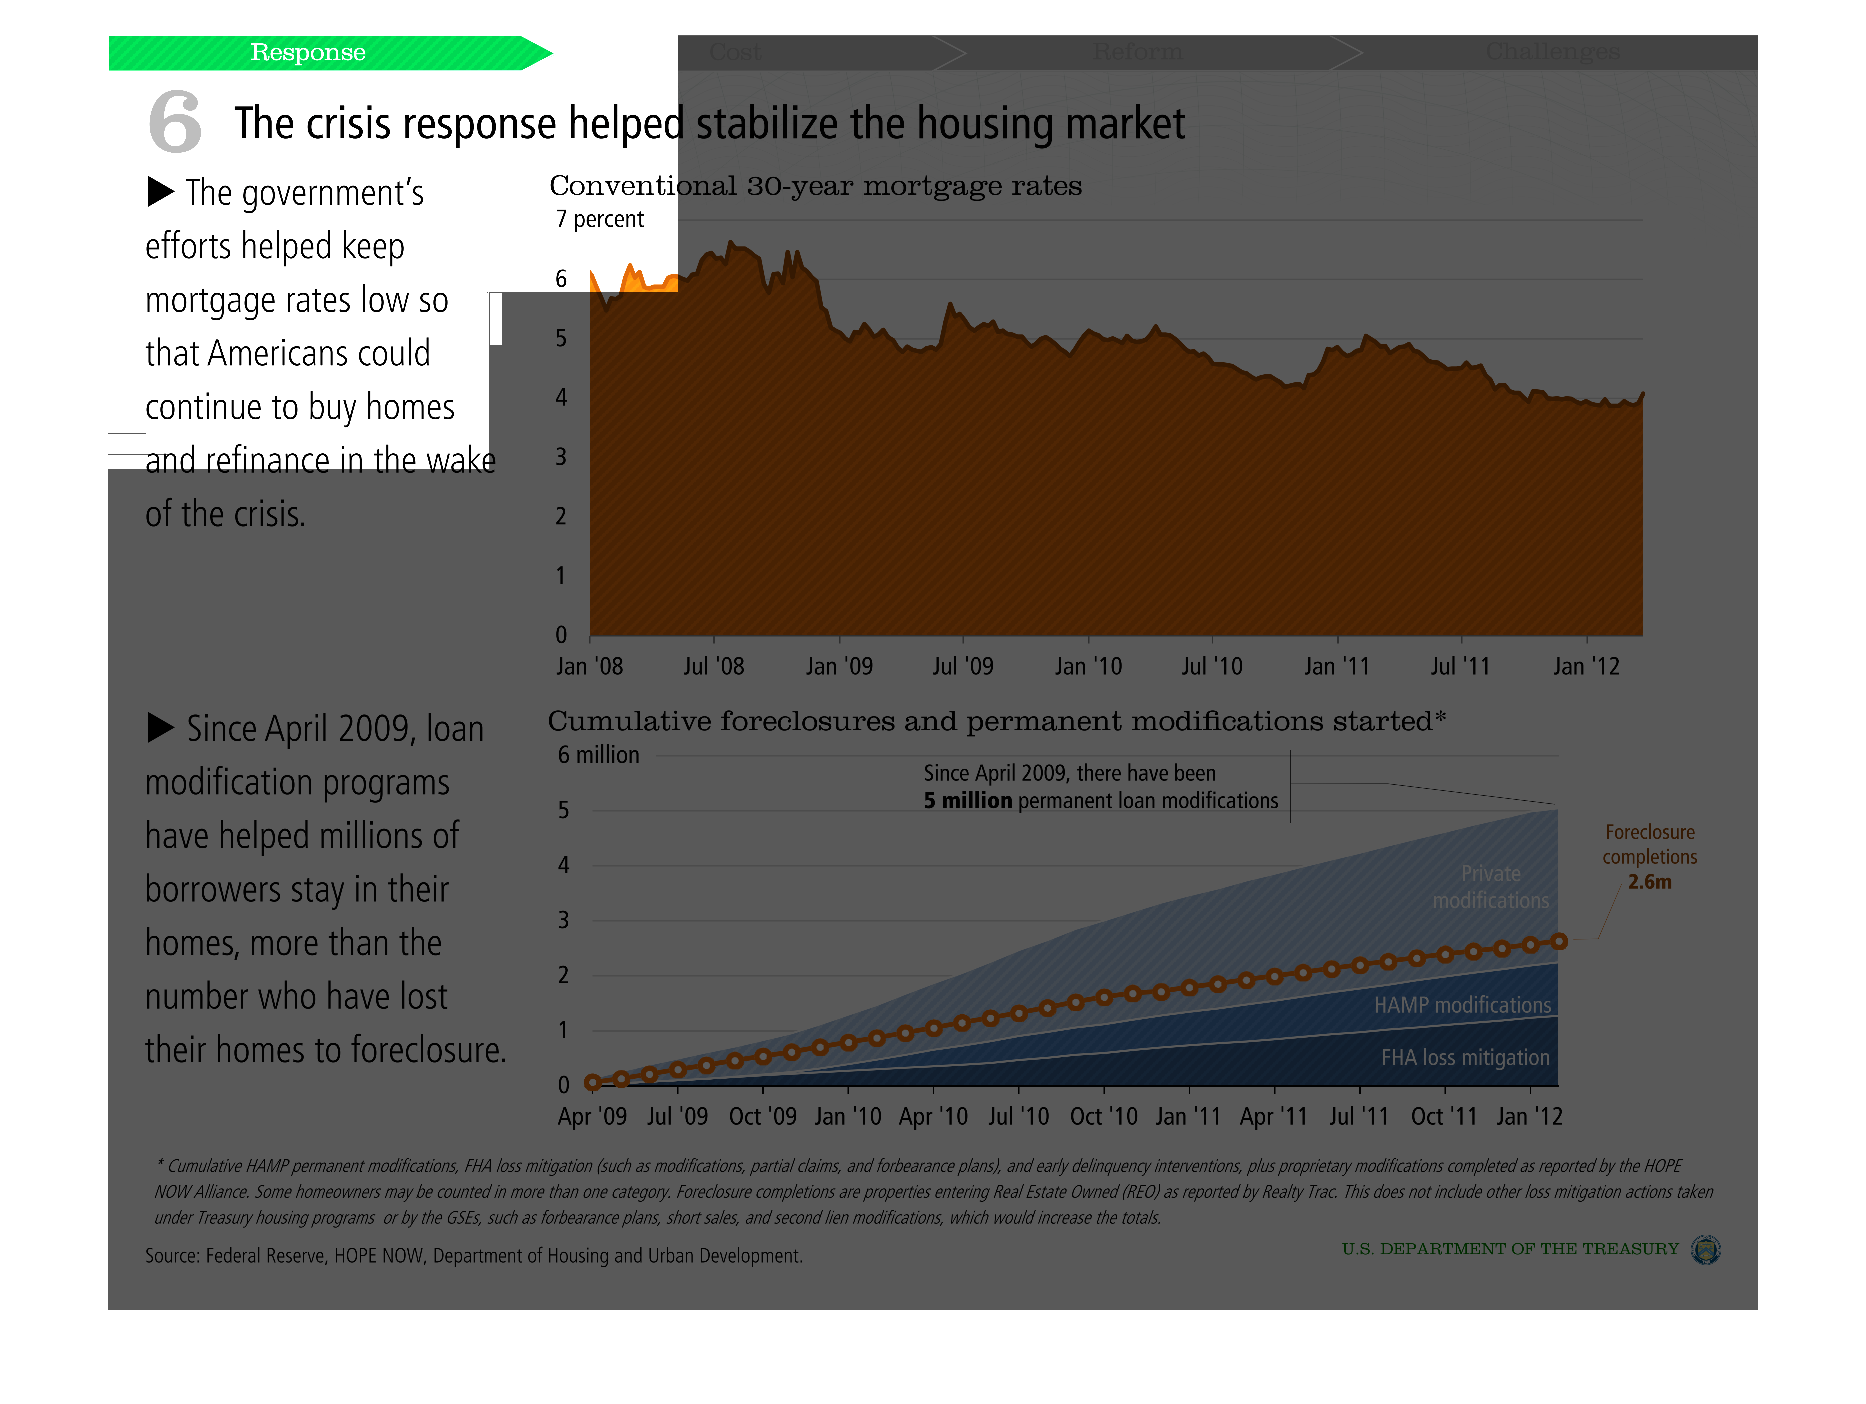
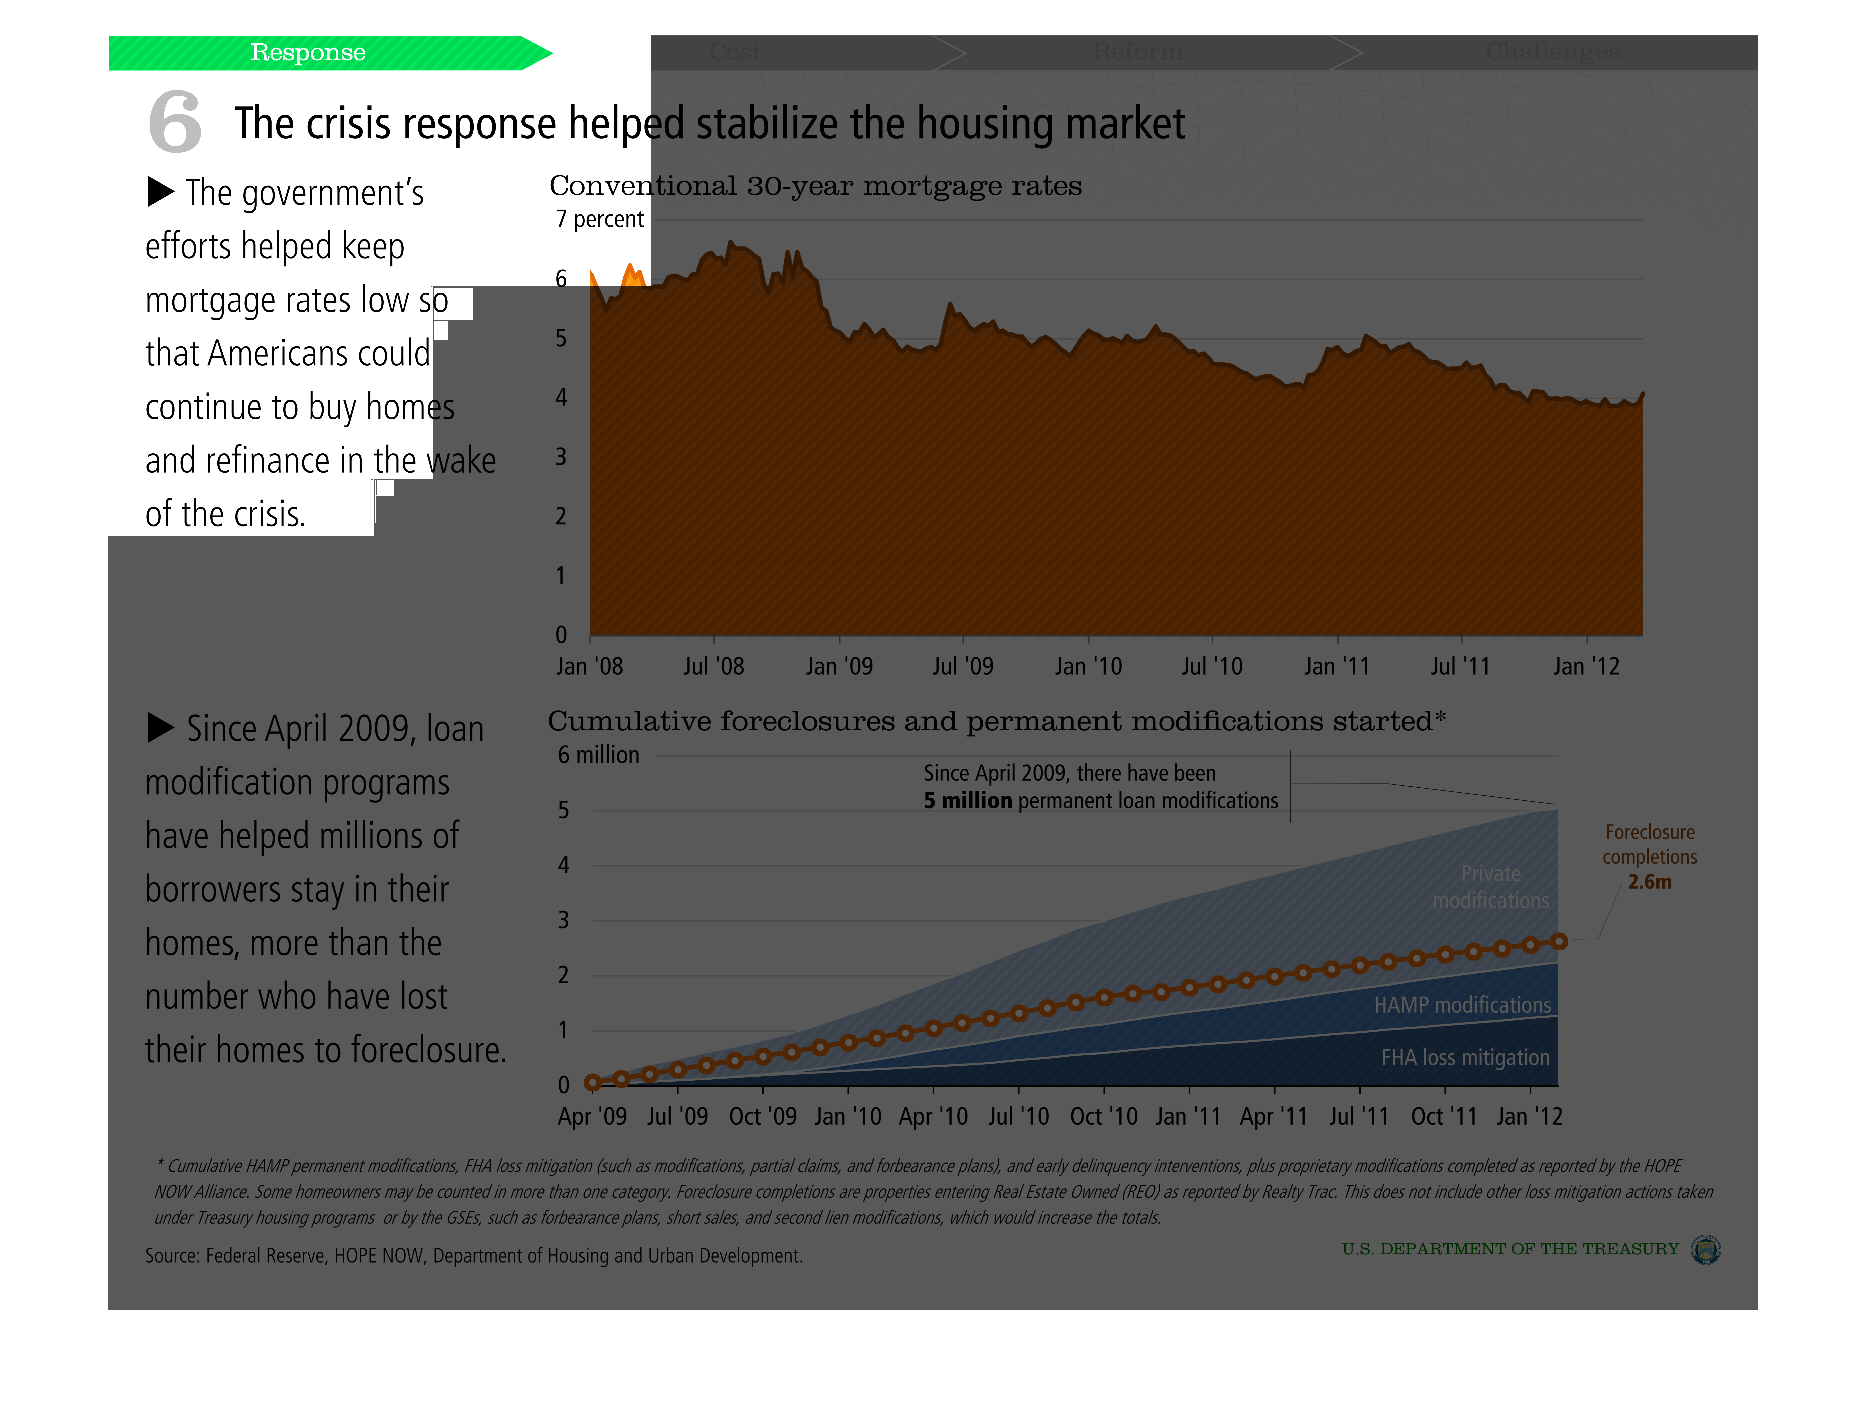
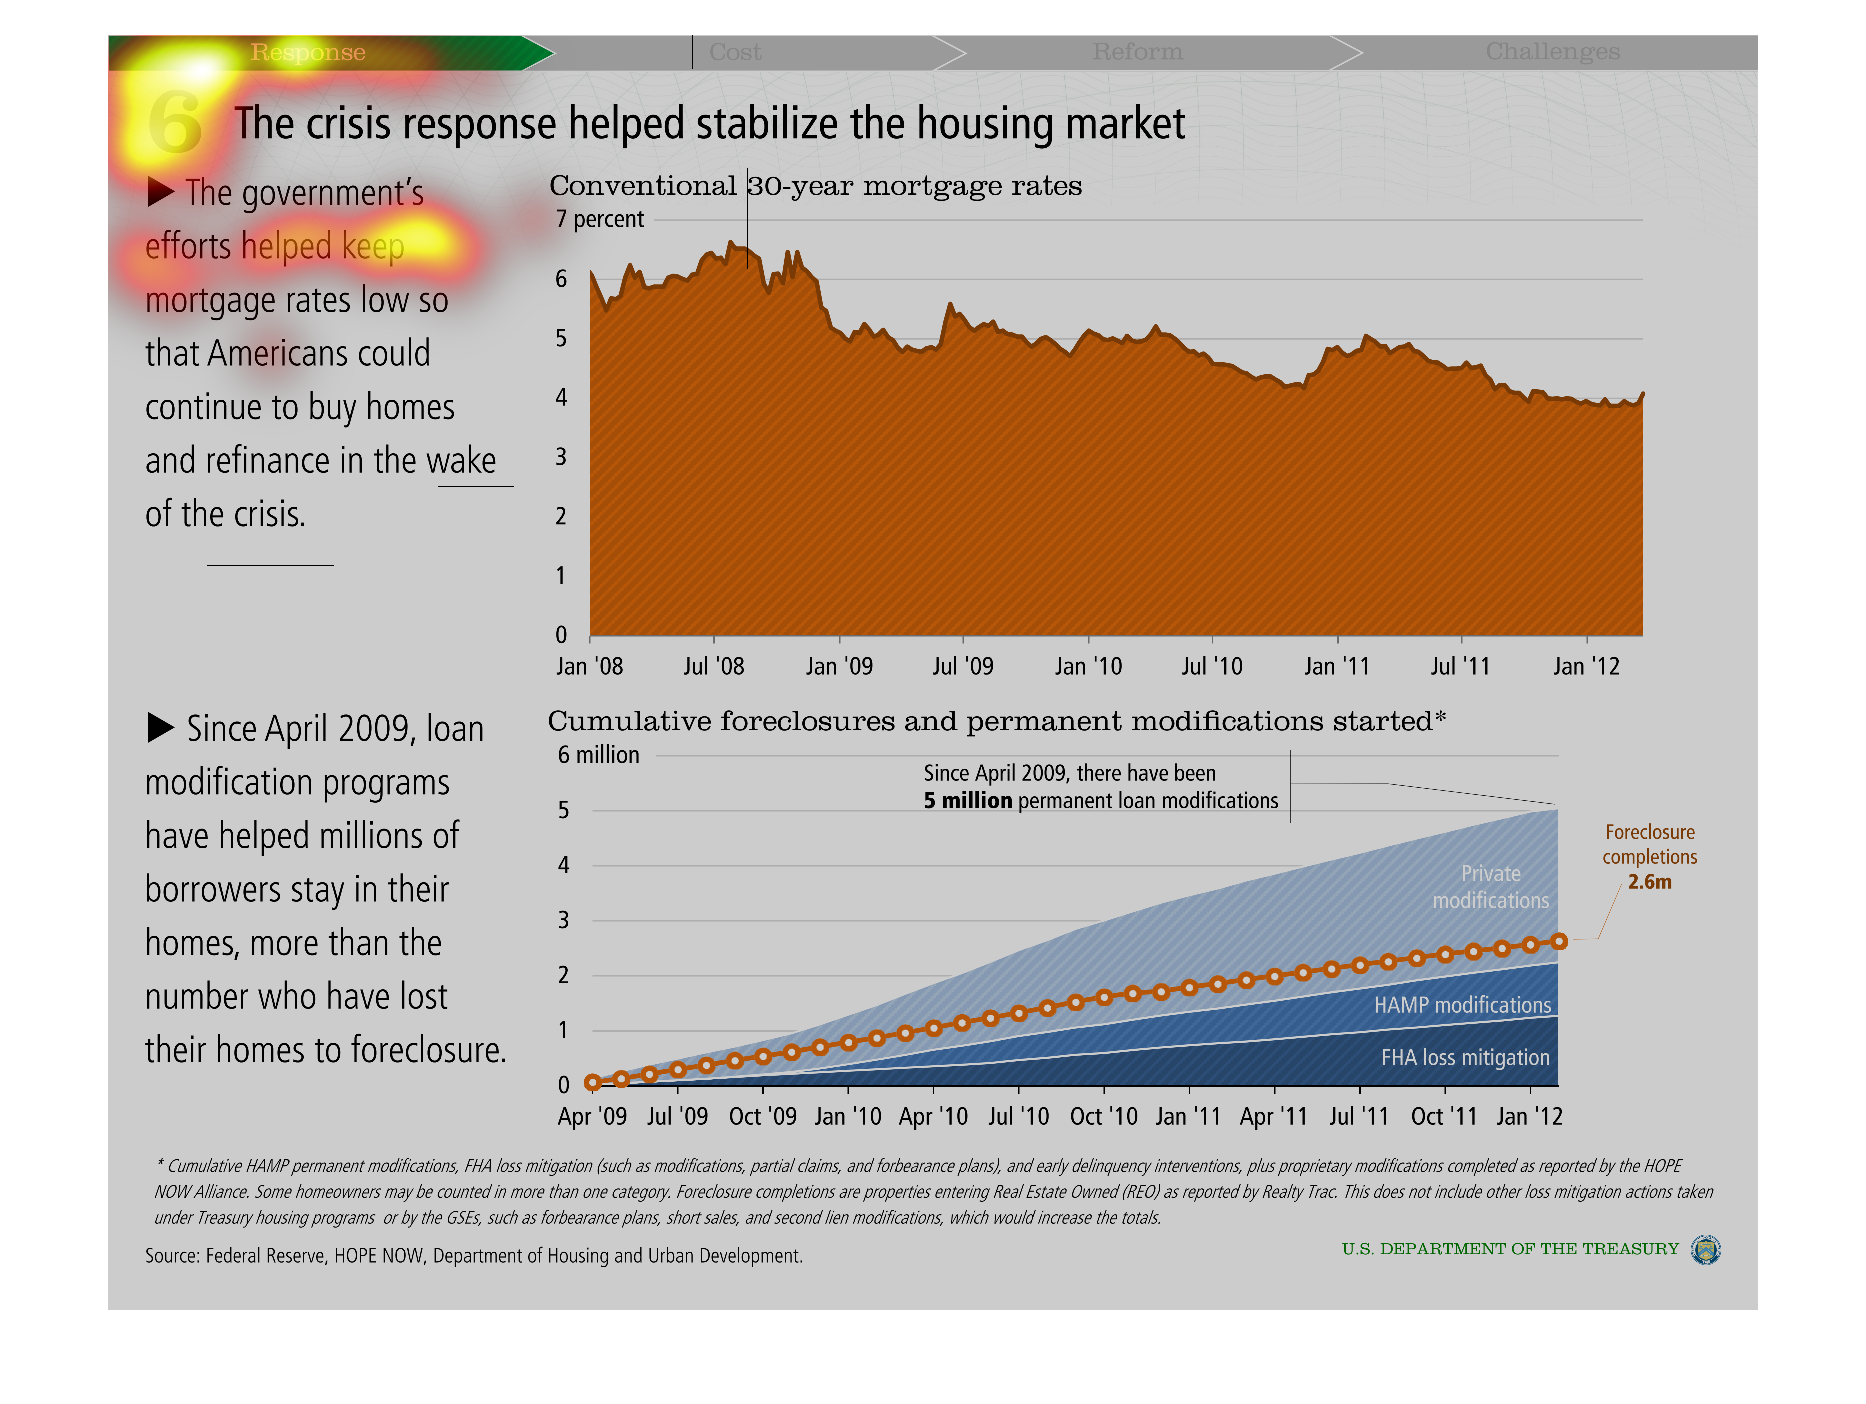
This image claims that the crisis response helped stabilize the housing market. The first
chart (on top in orange) claims that the government's efforts kept mortgage rates low so the
housing market could remain active. The graph shows that conventional 30-year mortgage rates
have decreased over time. The bottom graph claims that loan modification programs have helped
millions of borrowers stay in their homes rather than lose their homes to foreclosure.
Warning: Image is too big to fit on screen; displaying at 50%
Warning: Image is too big to fit on screen; displaying at 50%
THIS PLOT HAS TWO COMPONENTS. AT TOP, THE NUMBER OF 30 YEAR MORTGAGES IN THE UNITED STATES
IS GIVEN OVER TIME. IN THE BOTTOM, THE INCREASE IN LOAN MODIFICATION PROGRAMS IS SHOWN IN
THE SAME PERIOD.
Warning: Image is too big to fit on screen; displaying at 50%
Warning: Image is too big to fit on screen; displaying at 50%

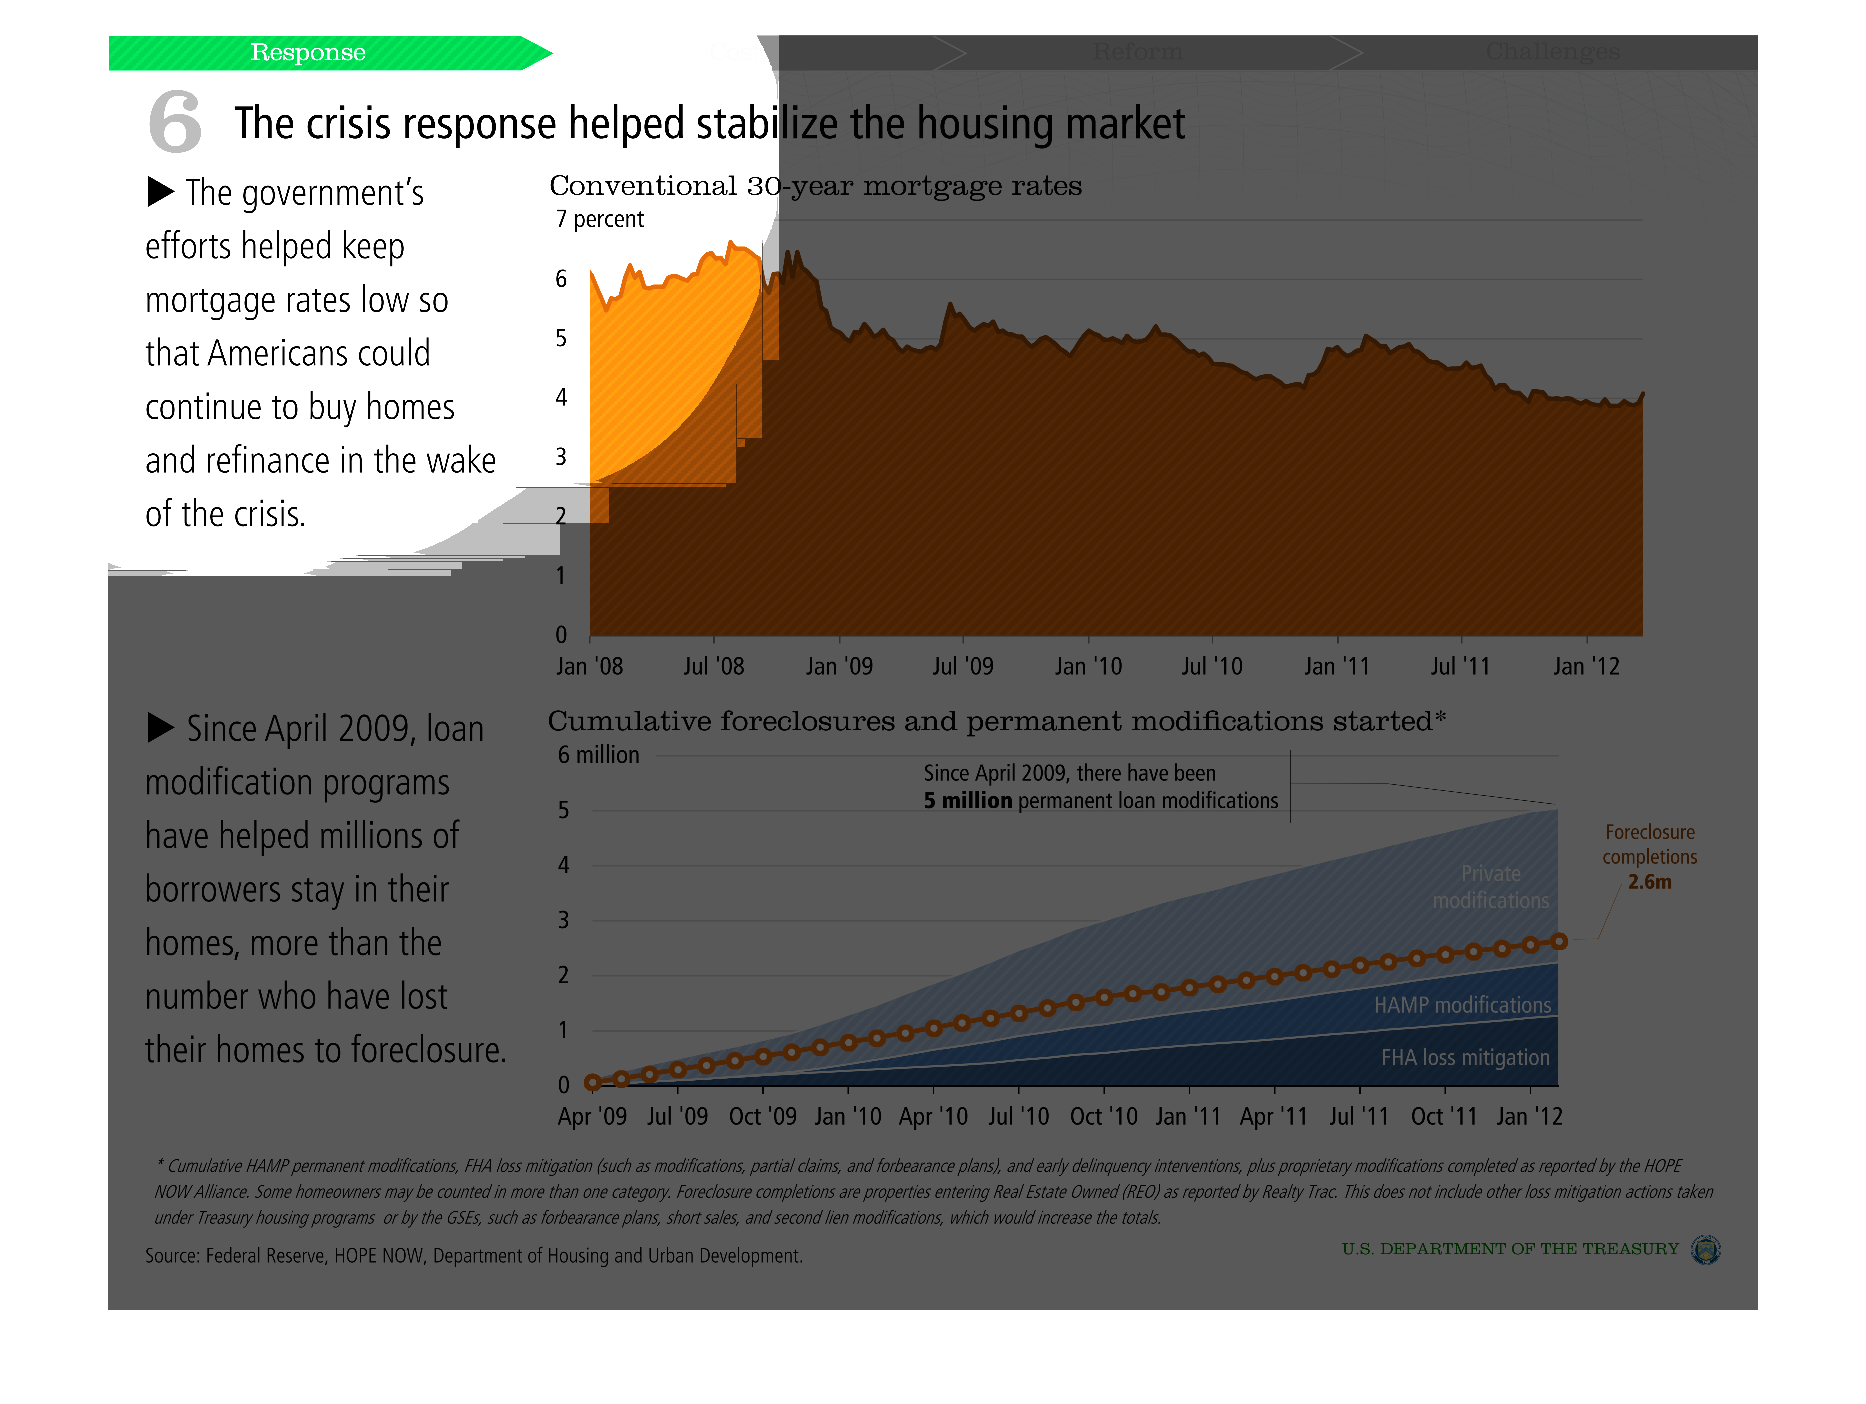
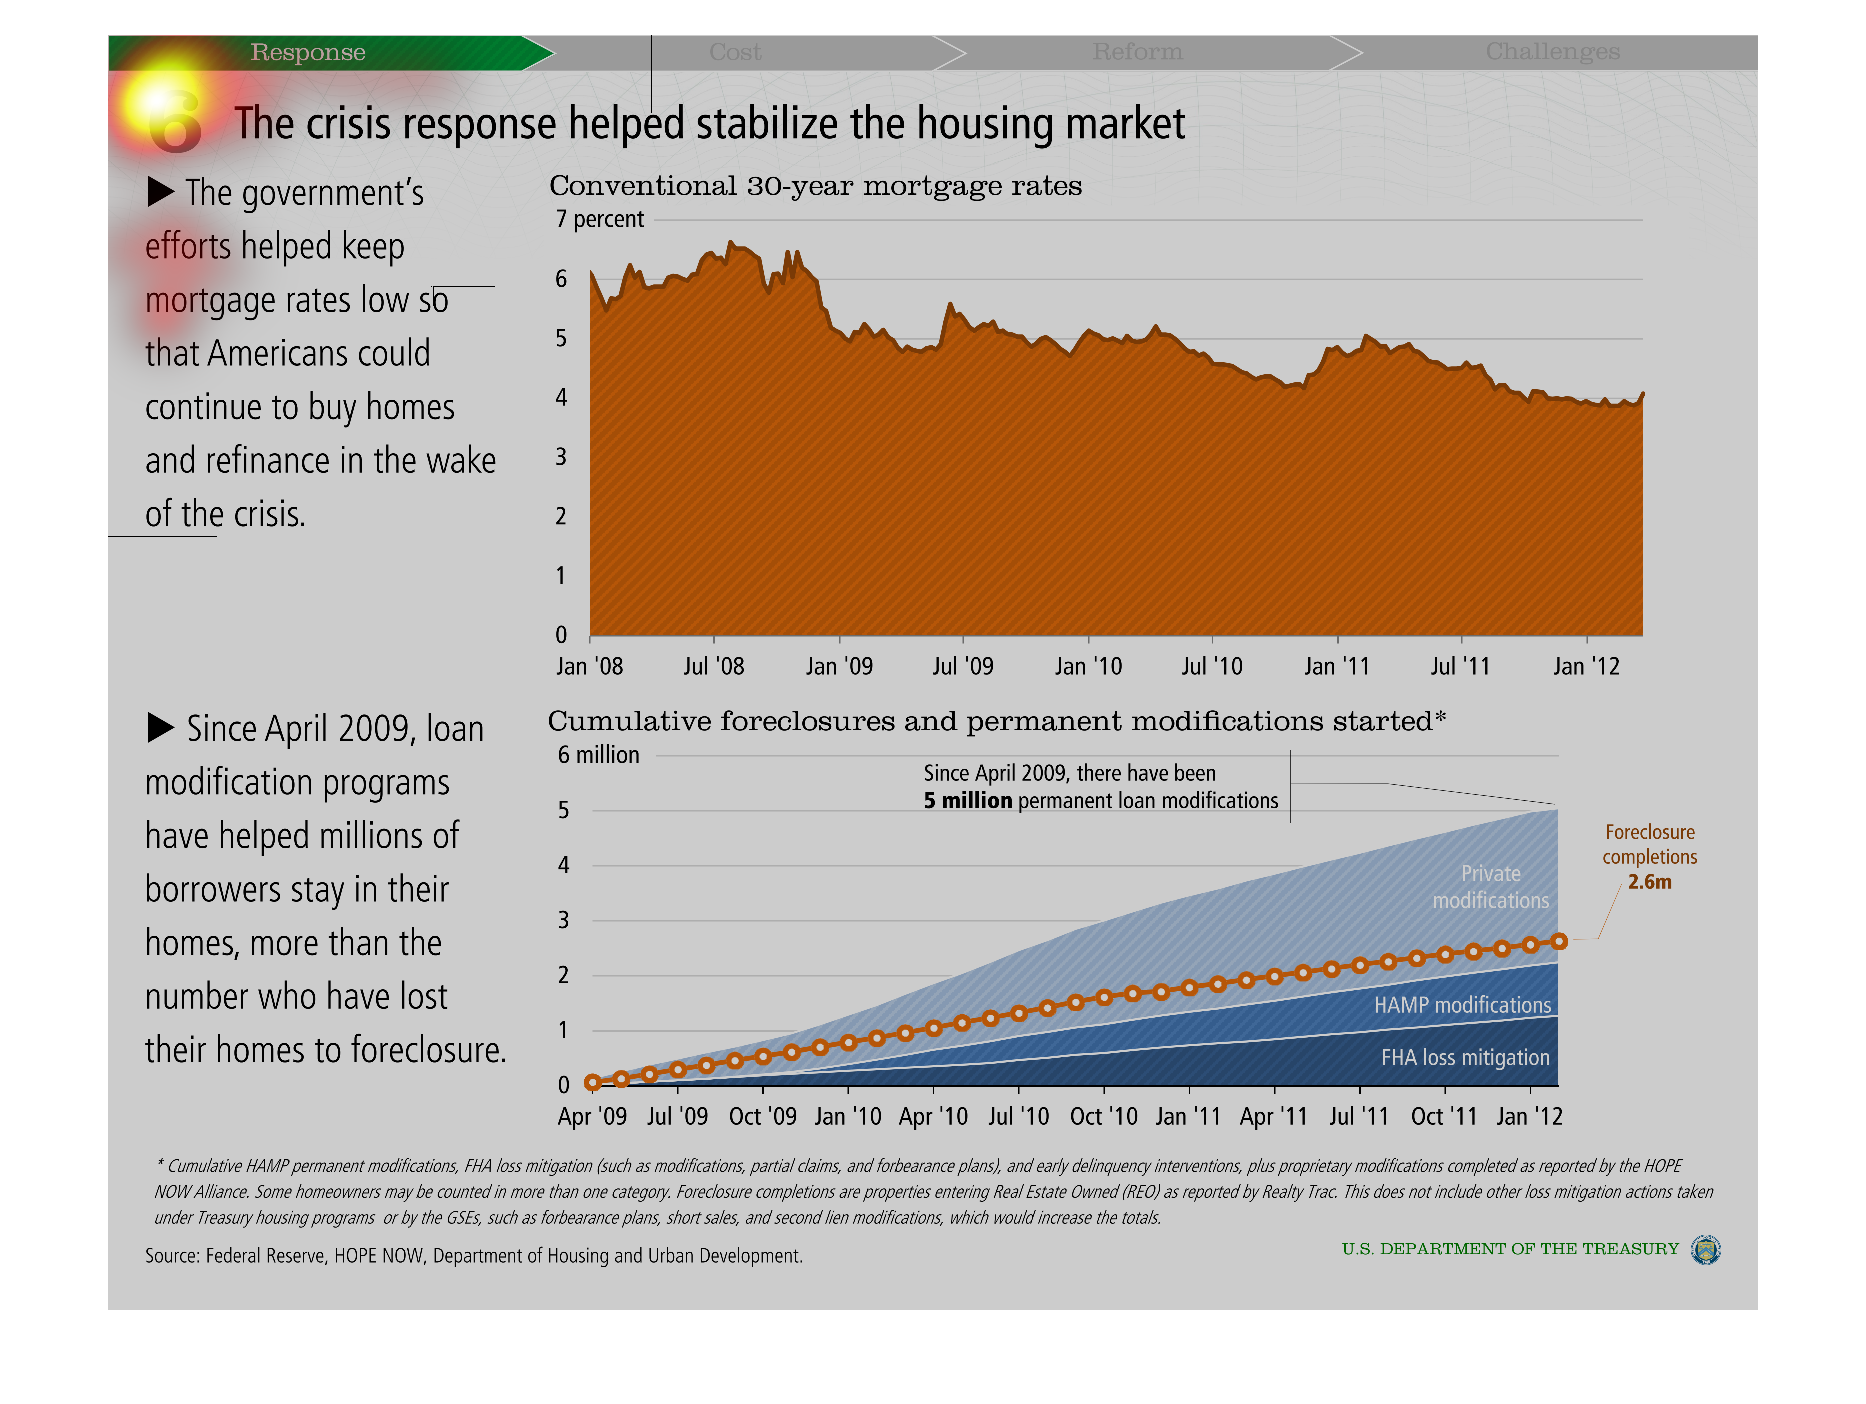
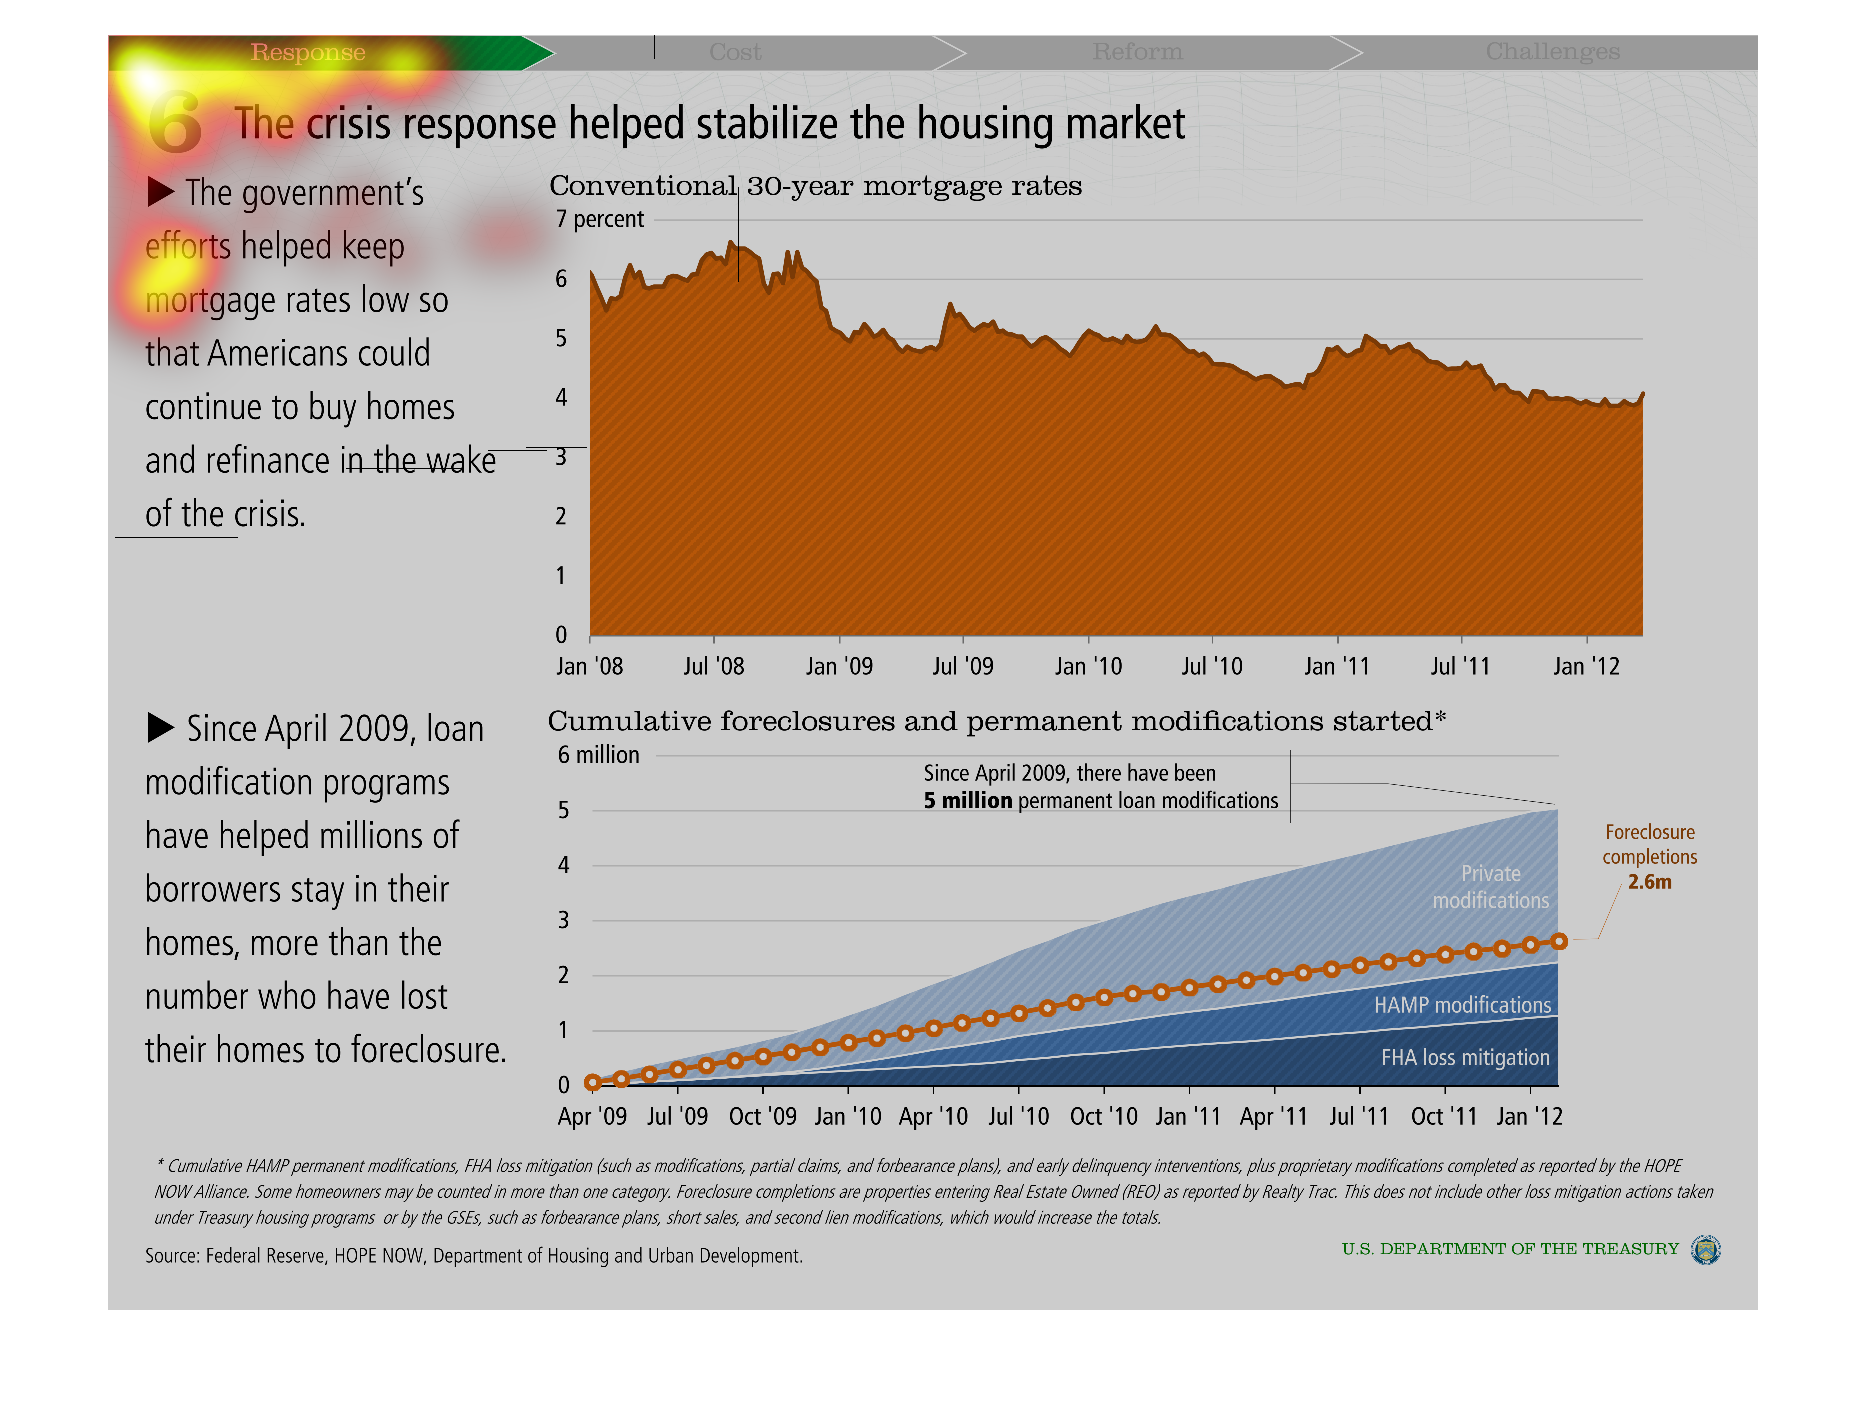
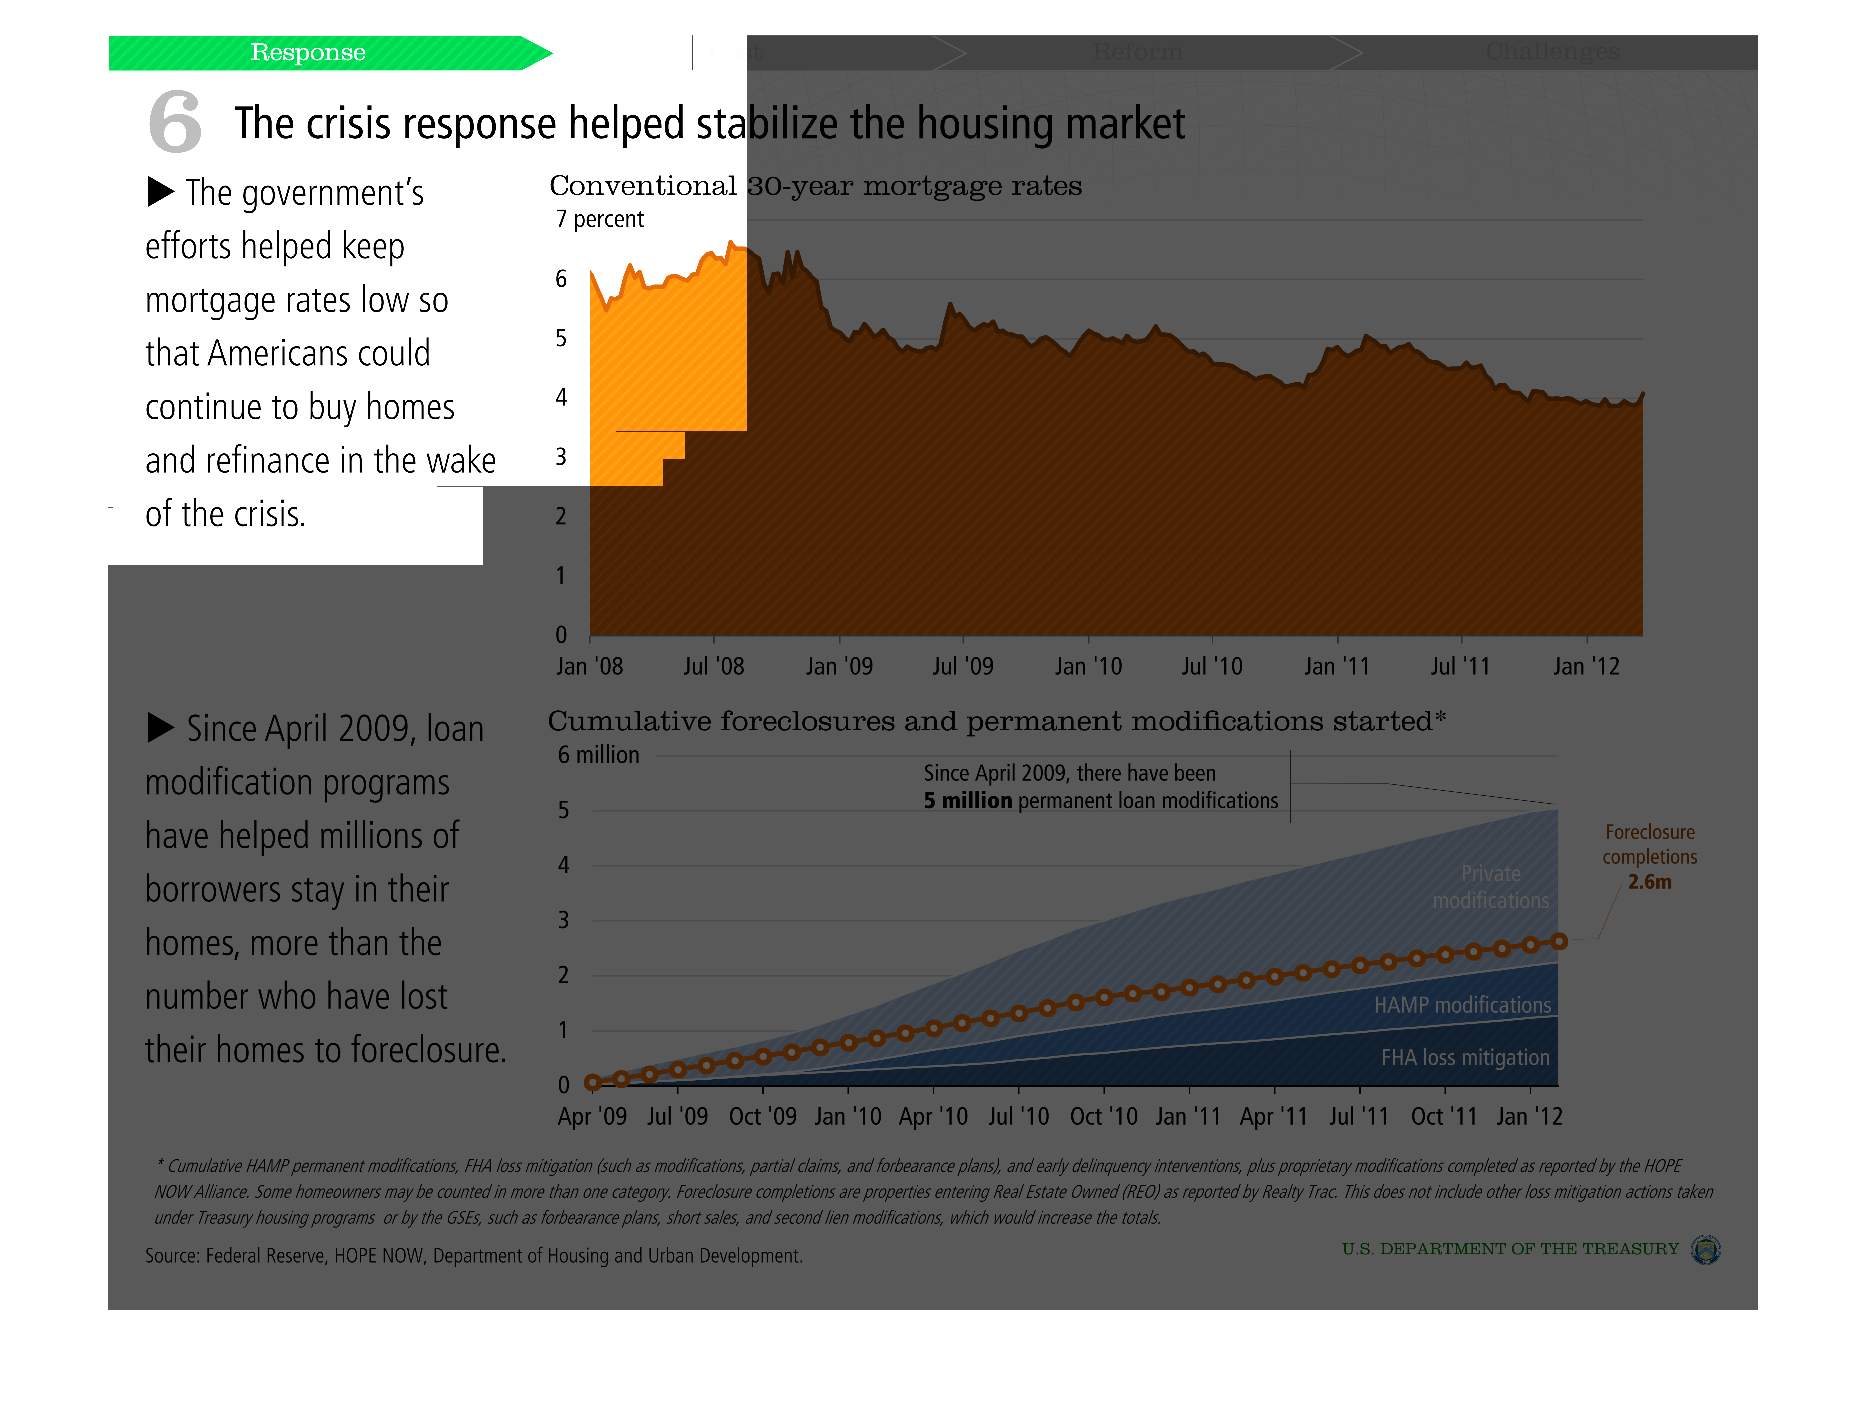
the crisis response helped stabilized the housing market. The government's effort helped keep
mortgage rates low so that americans could continue to buy homes and refinance in the wake
of the crisis. Since April 2009, loan modification programs have helped millions of borrowers
stay in their homes, more than the number who have lost their home to foreclosure.
Warning: Image is too big to fit on screen; displaying at 50%
Warning: Image is too big to fit on screen; displaying at 50%

This is a graph and a line chart that shows how the crisis response helped stabilize the us
housing market. On top we have a graph of mortgage rates going from 2008-2012, and below a
series of lines representing cumulative foreclosures since 2009.
Warning: Image is too big to fit on screen; displaying at 50%
Warning: Image is too big to fit on screen; displaying at 50%

This graph shows the crisis response helped stabilize the housing market. There a paragraph
below the title at the top it explains in further detail the purpose of the chart.
Warning: Image is too big to fit on screen; displaying at 50%
Warning: Image is too big to fit on screen; displaying at 50%

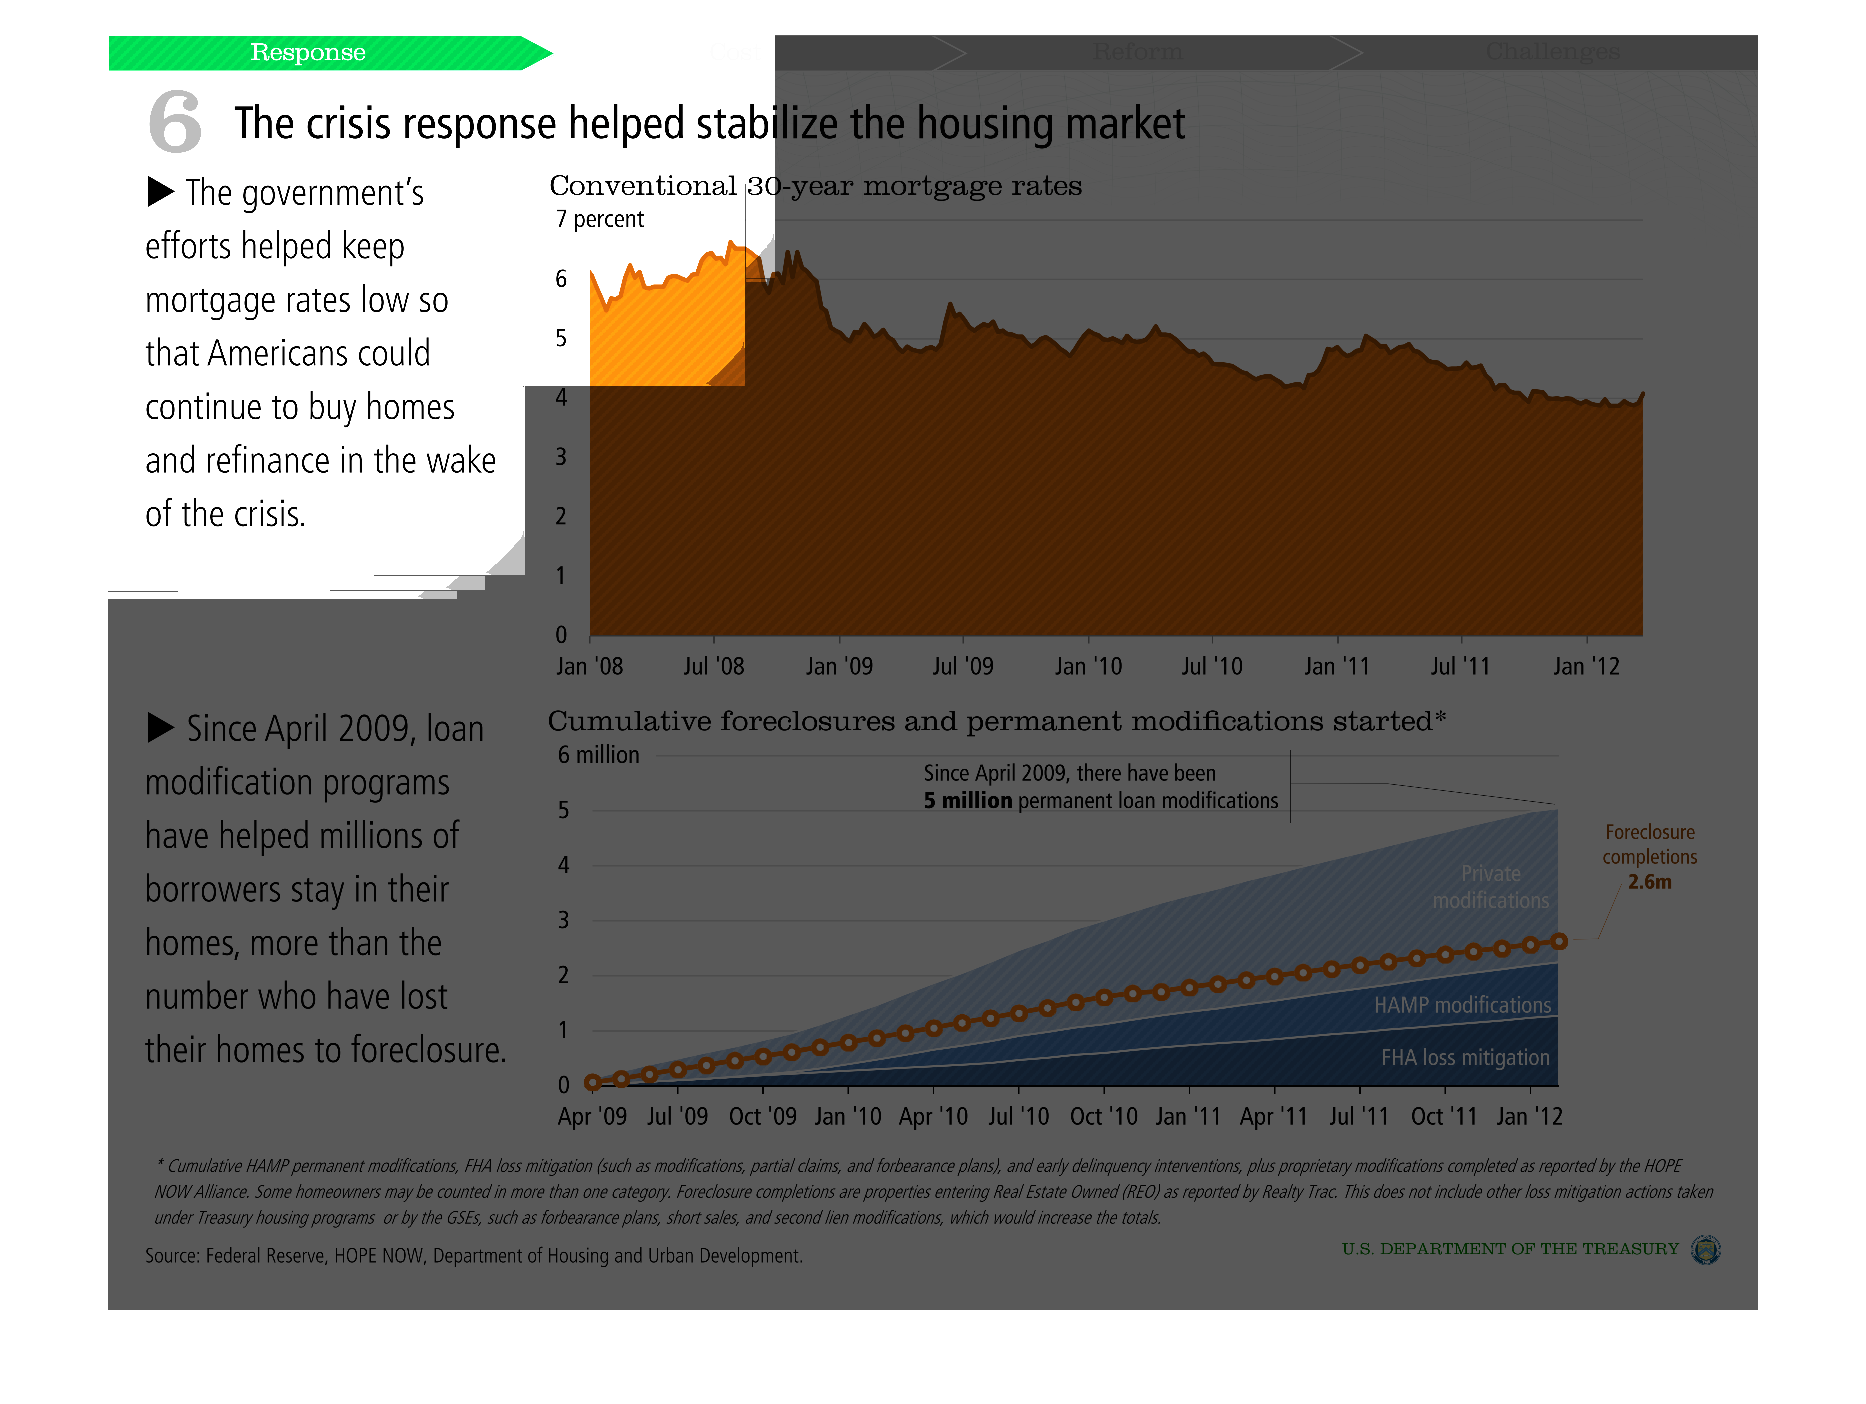
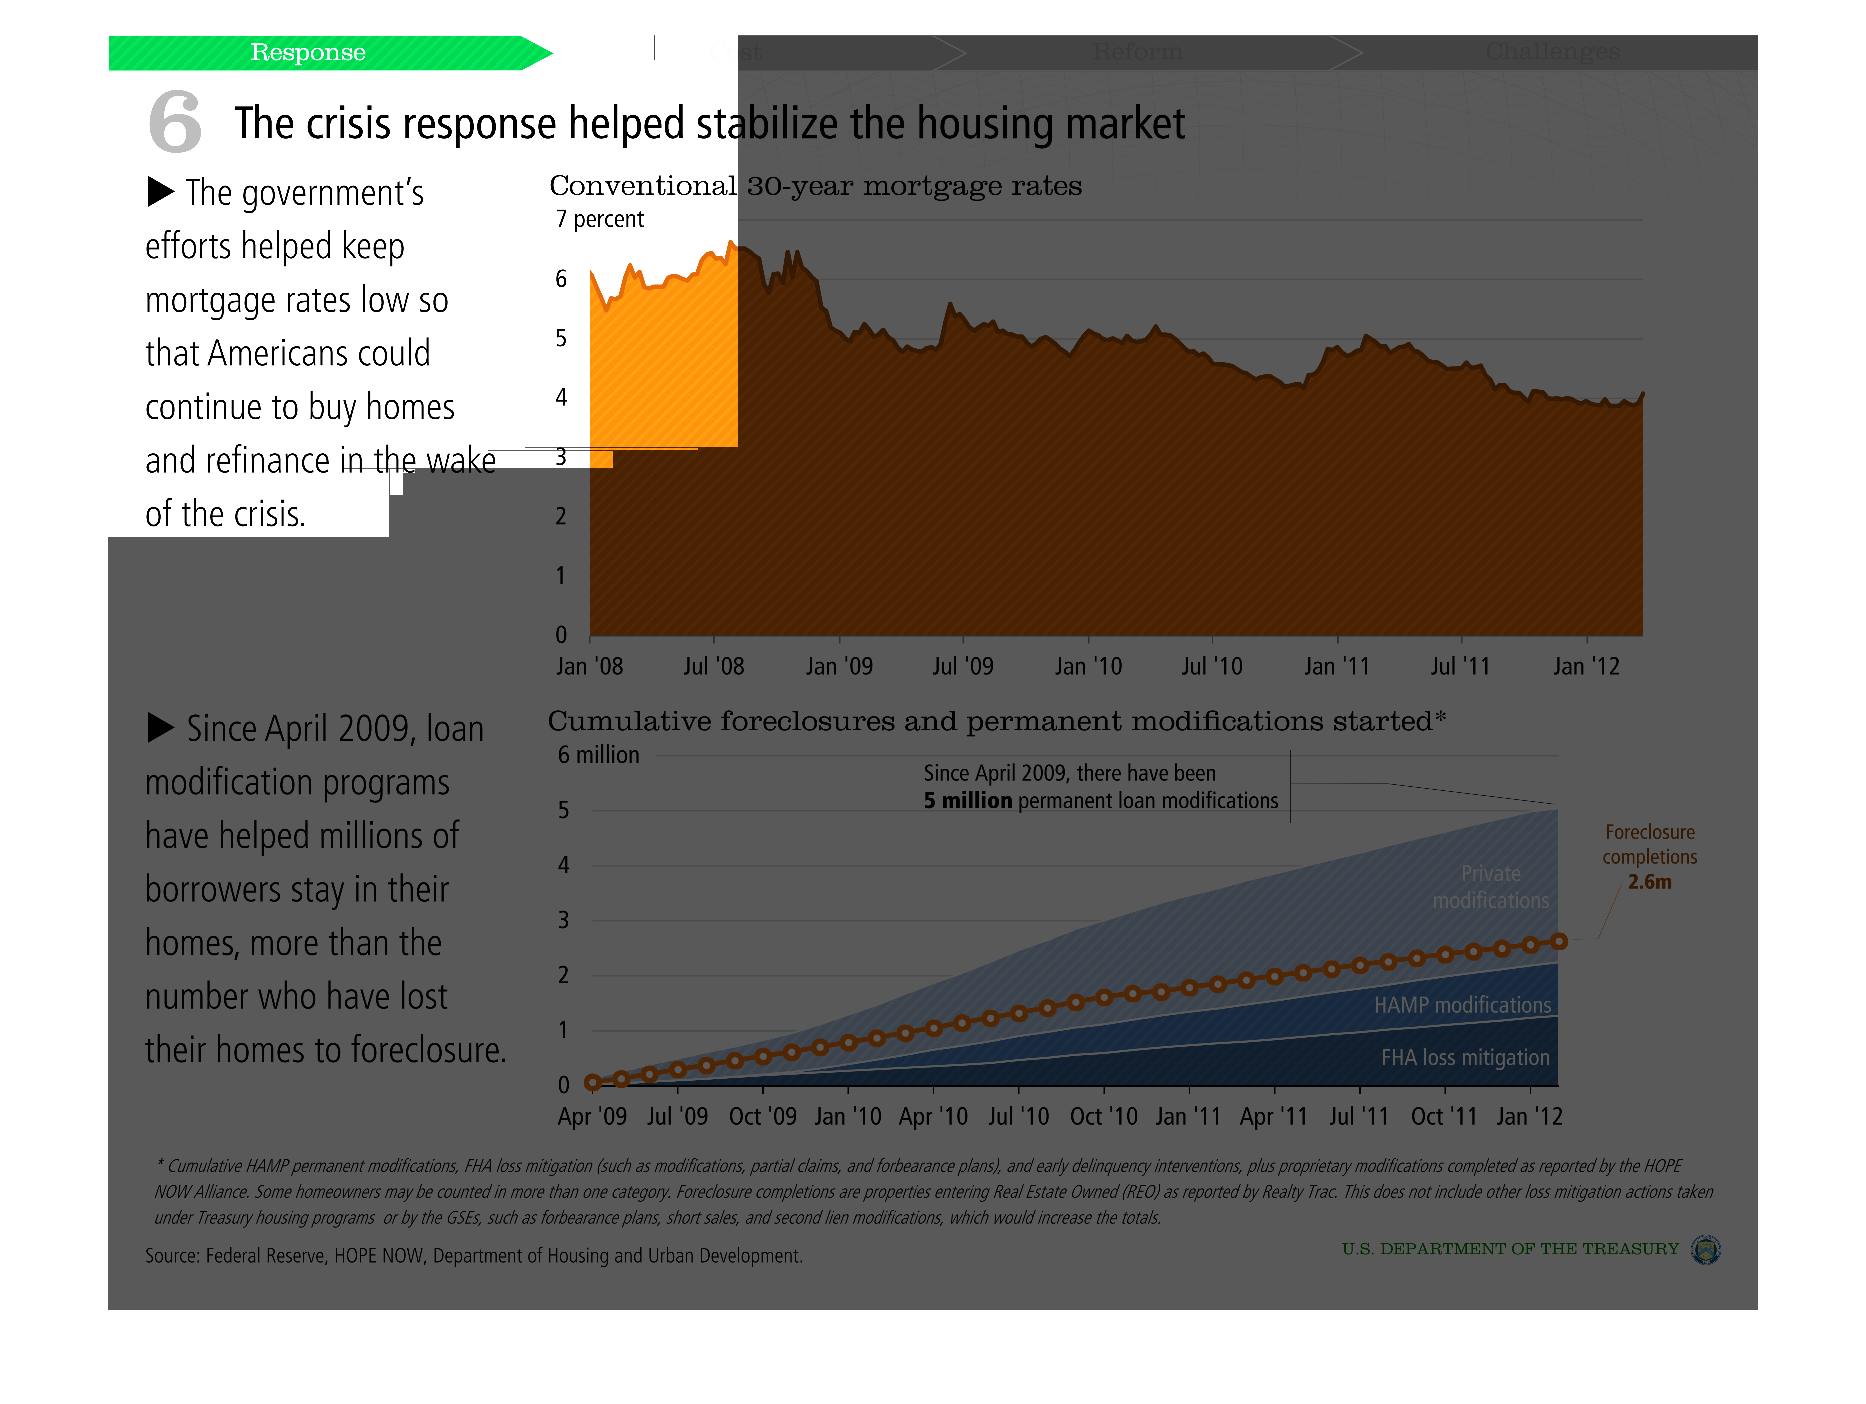
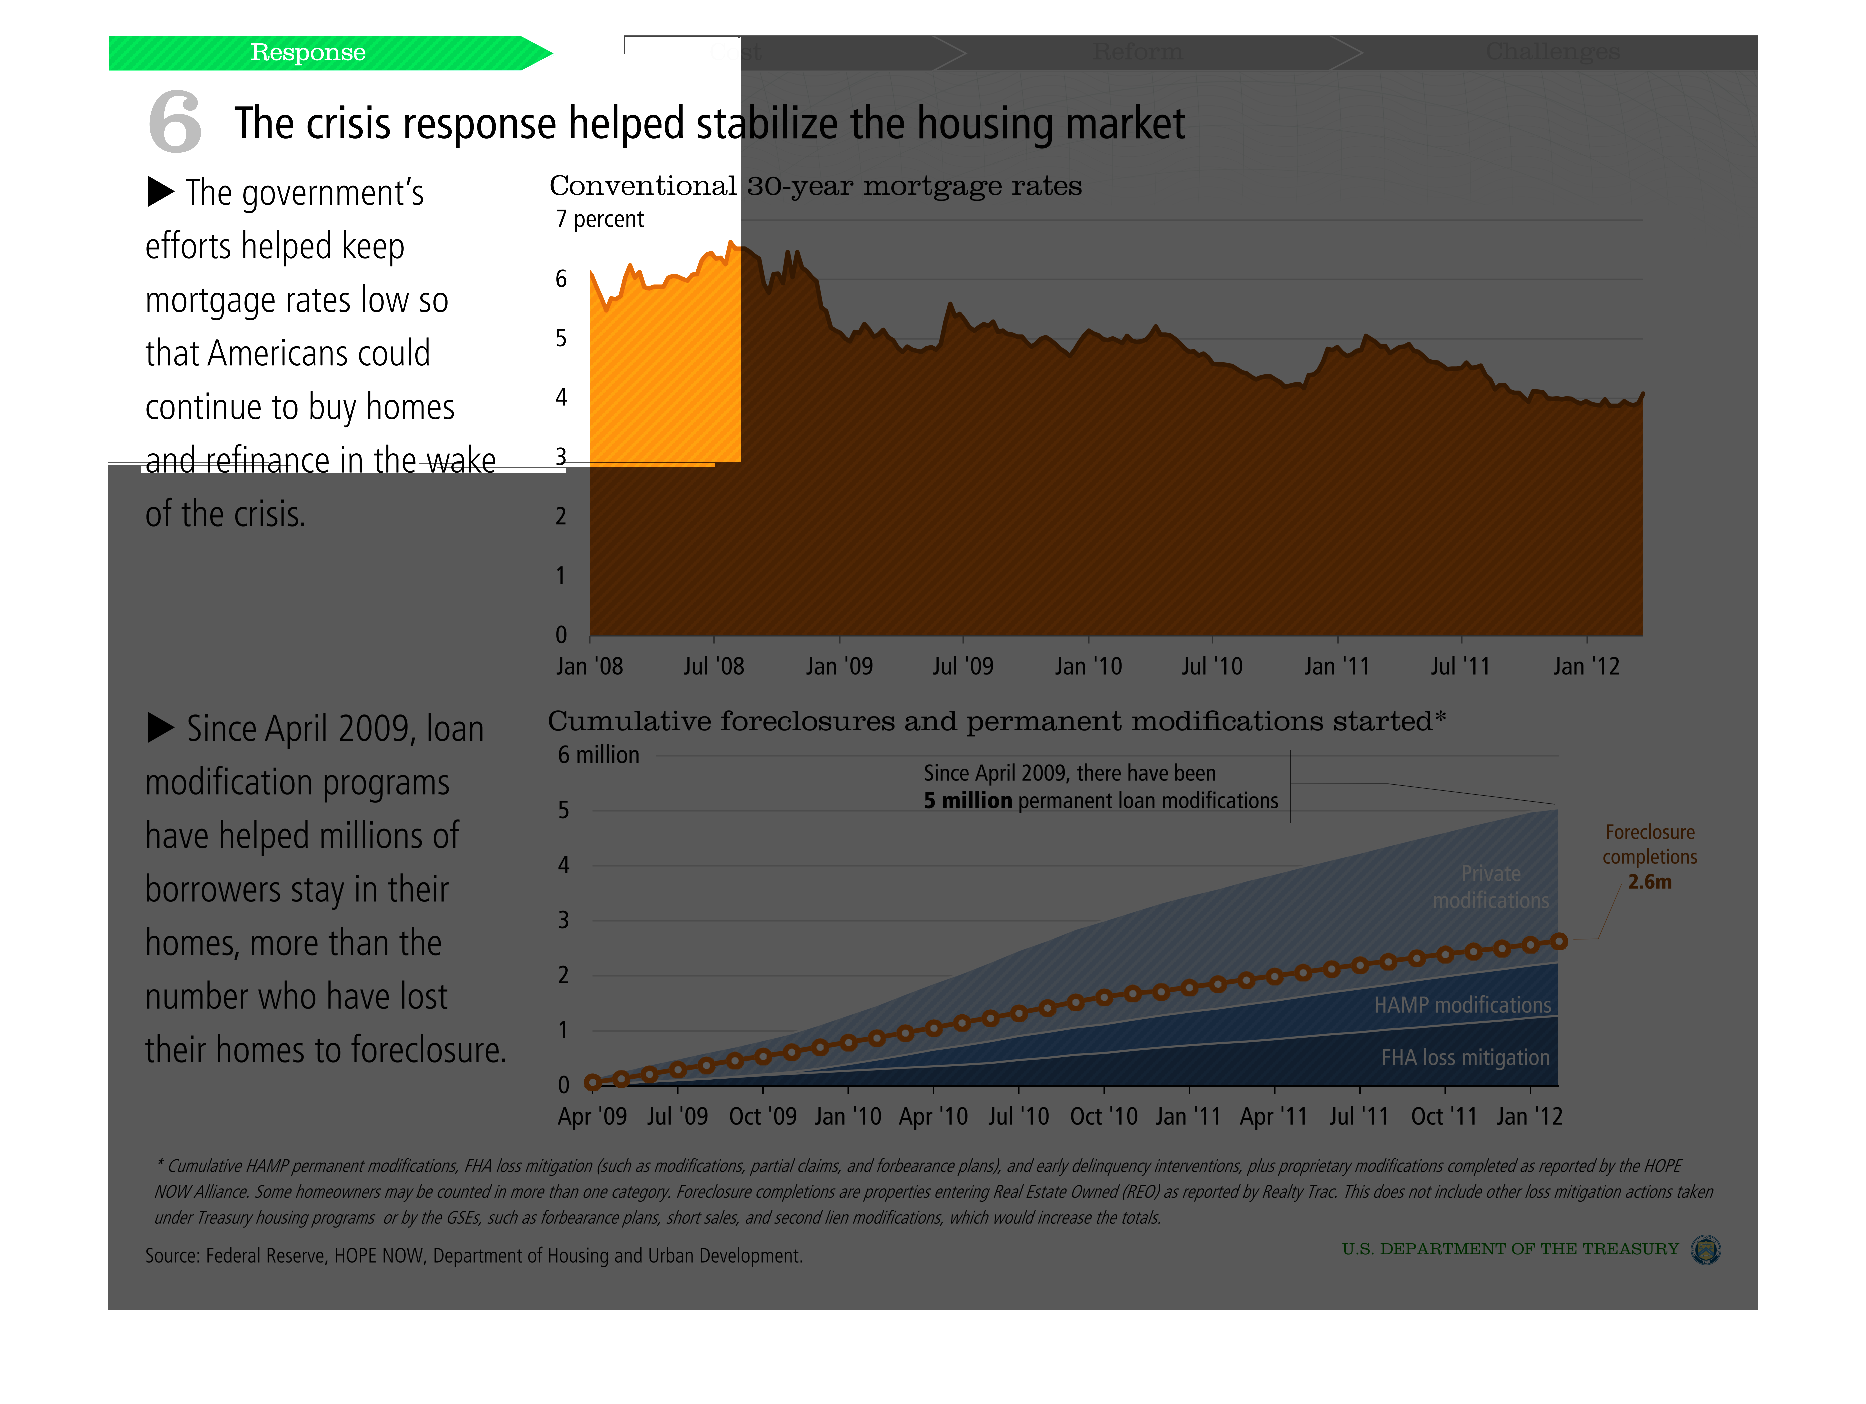
This chart shows how the financial crisis helped stabilize housing markets y keeping mortgage
rates low so American's could buy homes. The chart shows them dropping from 6% in Jan 08 to
around 4% in Jan 12. It also states modification programs helped people keep their homes.
Warning: Image is too big to fit on screen; displaying at 50%
Warning: Image is too big to fit on screen; displaying at 50%

This chart shows the crisis report that helped stabilize the housing market. It claims the
governments efforts had help keep mortgage rates low so American's can pay.
Warning: Image is too big to fit on screen; displaying at 50%
Warning: Image is too big to fit on screen; displaying at 50%

This image contains two charts showing the crisis helped stabilize the housing market. It
talks about how the government's efforts keep the mortgage rates low.
Warning: Image is too big to fit on screen; displaying at 50%
Warning: Image is too big to fit on screen; displaying at 50%
This is a statistical case study with visual graphs that is titled "The crisis response helped
stabilize the housing market".  There are two presentation charts.  One chart is orange and
the other is blue.
Warning: Image is too big to fit on screen; displaying at 50%
Warning: Image is too big to fit on screen; displaying at 50%
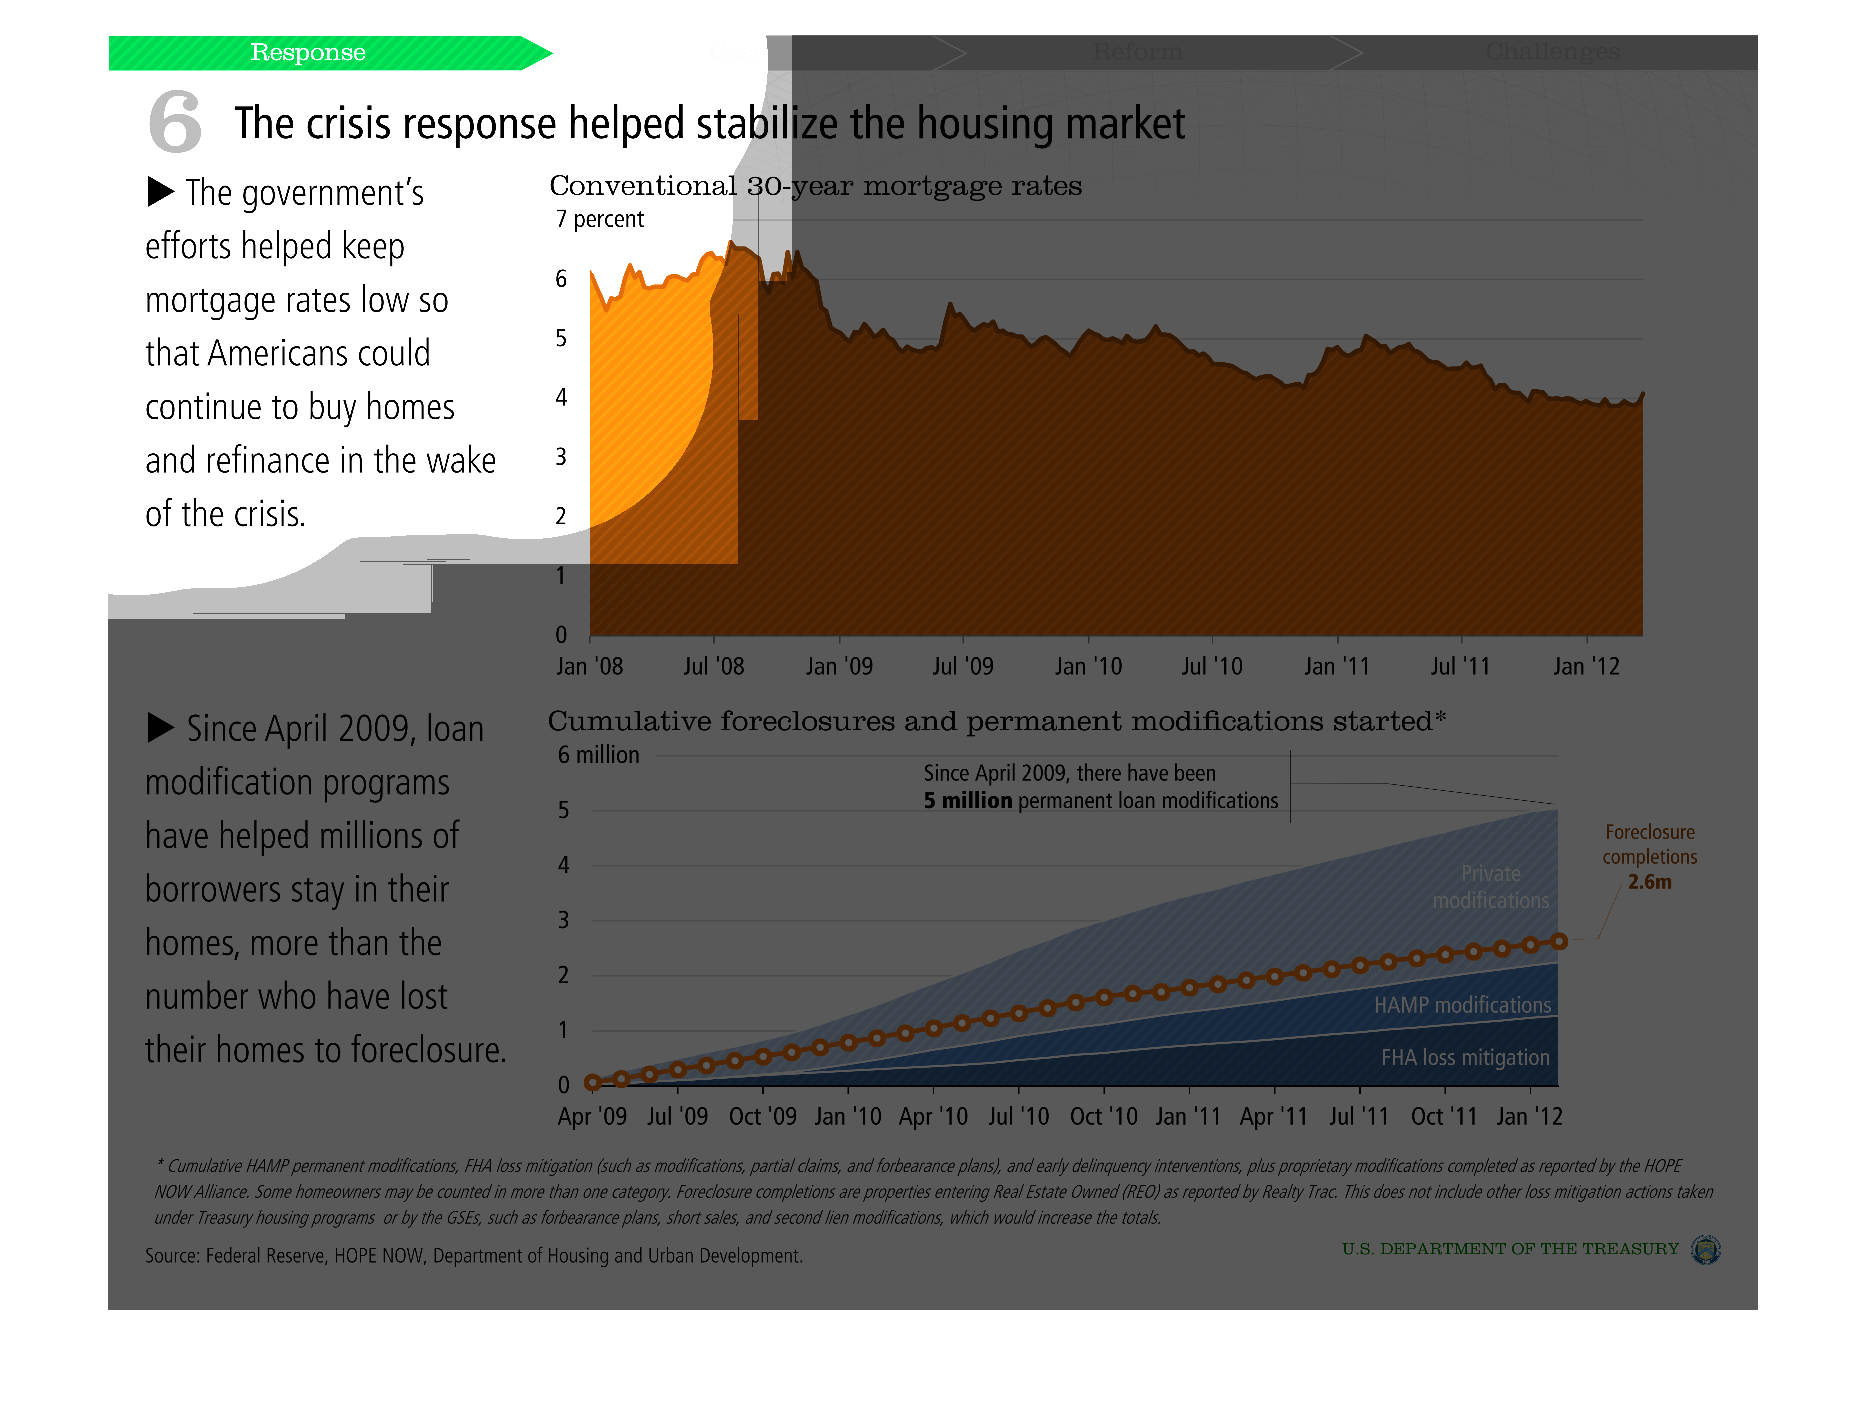
The graph shows how the Government's actions during the recession, the measures they took
to stop the collapse, in the end helped people refinance and stay in their homes.
Warning: Image is too big to fit on screen; displaying at 50%
Warning: Image is too big to fit on screen; displaying at 50%

This graph shows how the government helped keep housing rates low for Americans. It shows
statistics for cumulative foreclosures and permanent modifications, as well as looks at some
statistics from a program in 2009.
Warning: Image is too big to fit on screen; displaying at 50%
Warning: Image is too big to fit on screen; displaying at 50%
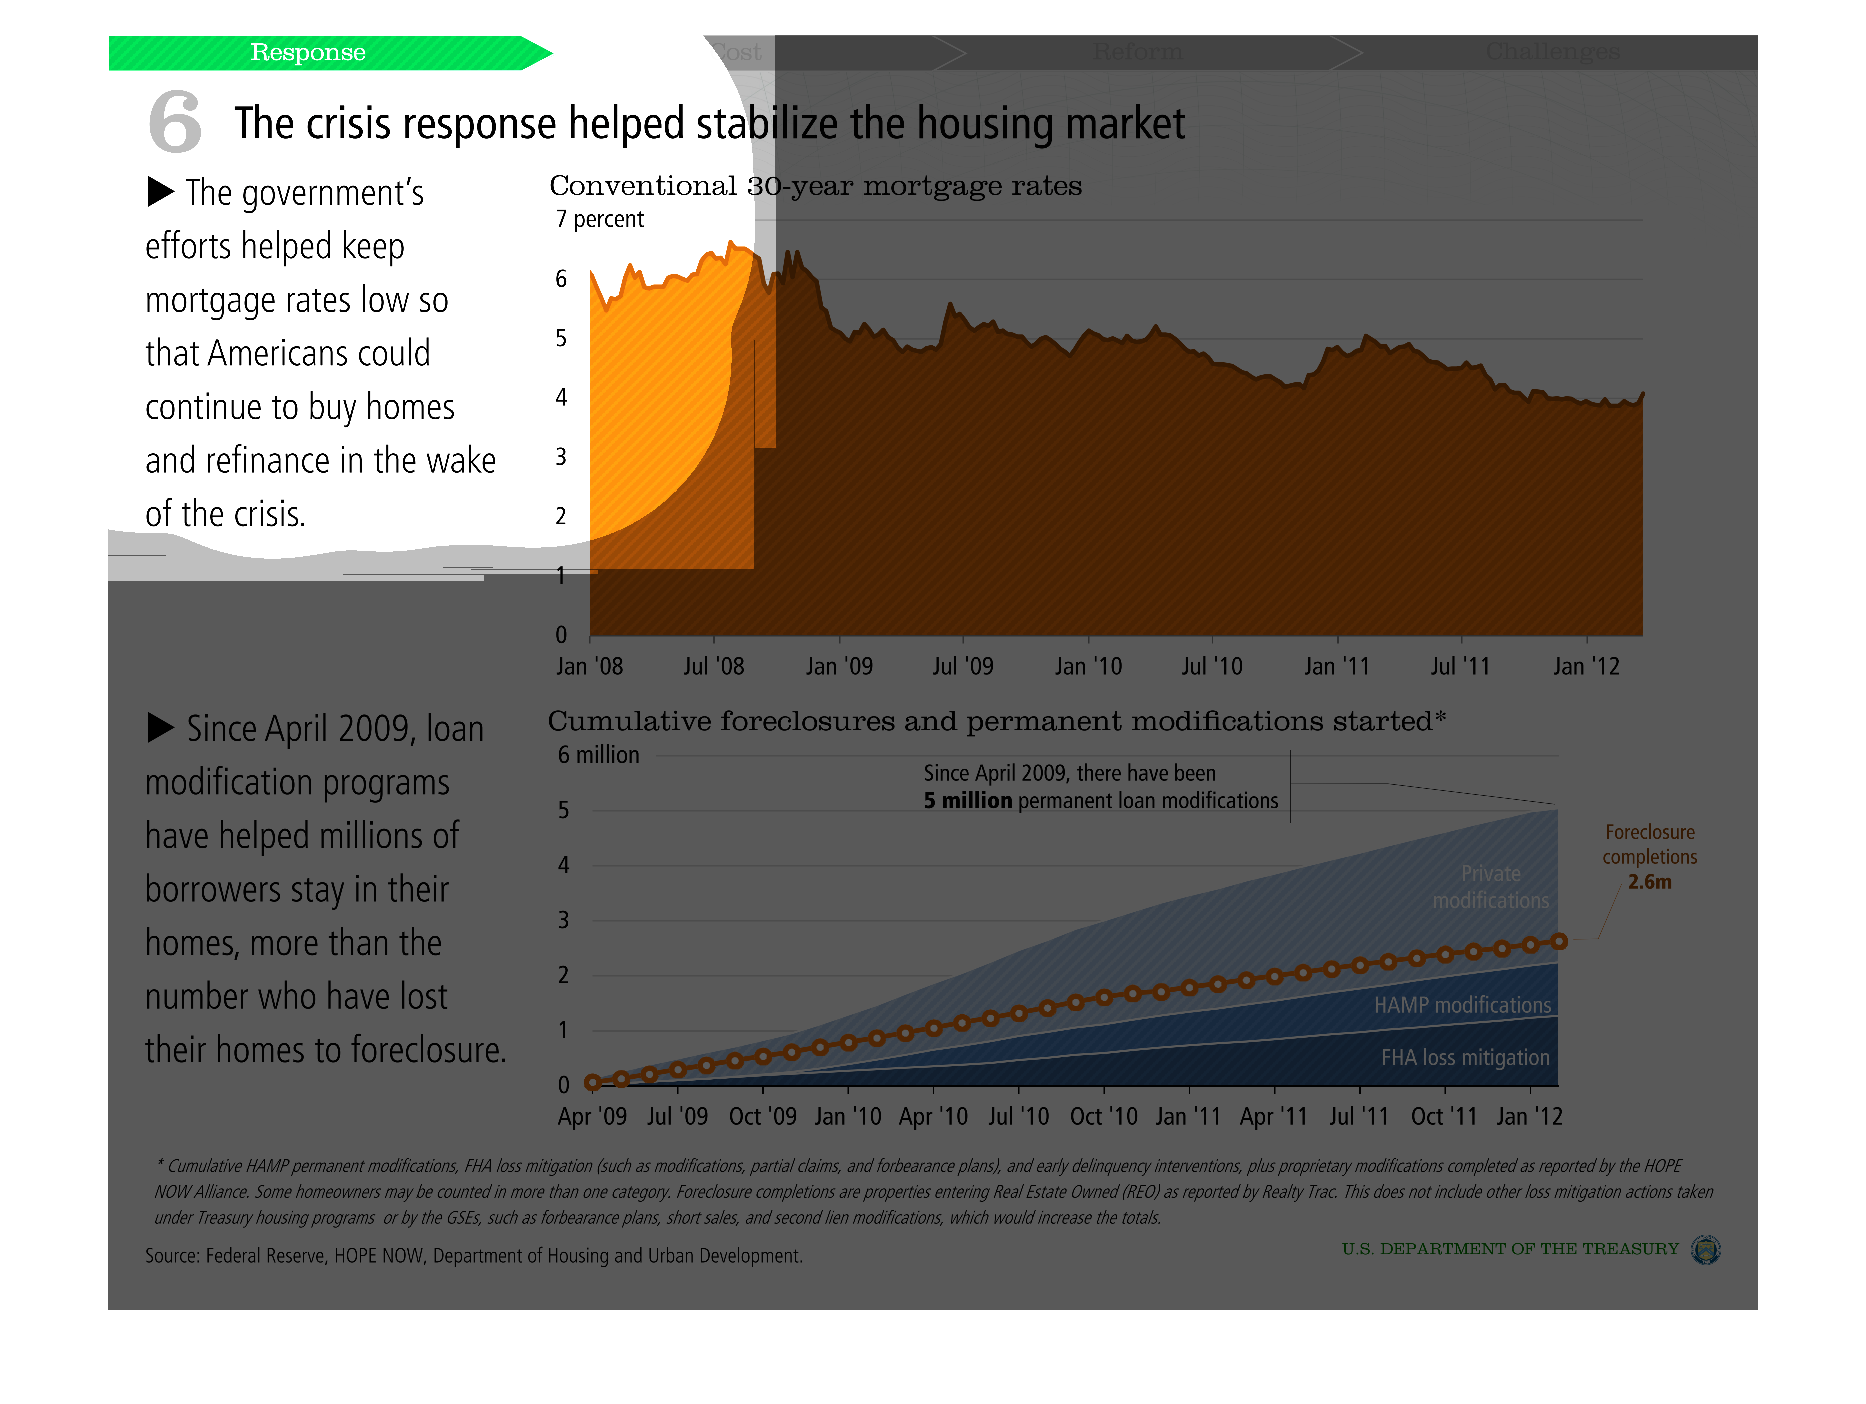
This graph illustrates how the crisis response helped save the housing market.  It contains
figures on 30 year conventional home mortgage rates and foreclosures and permanent modifications
started.
Warning: Image is too big to fit on screen; displaying at 50%
Warning: Image is too big to fit on screen; displaying at 50%

this is an info-graphic of how the crisis response helped save the housing market.  This piece
details the different methods that the federal government went through to help the housing
crisis and shows what effects those methods had.
Warning: Image is too big to fit on screen; displaying at 50%
Warning: Image is too big to fit on screen; displaying at 50%

