Warning: Image is too big to fit on screen; displaying at 50%
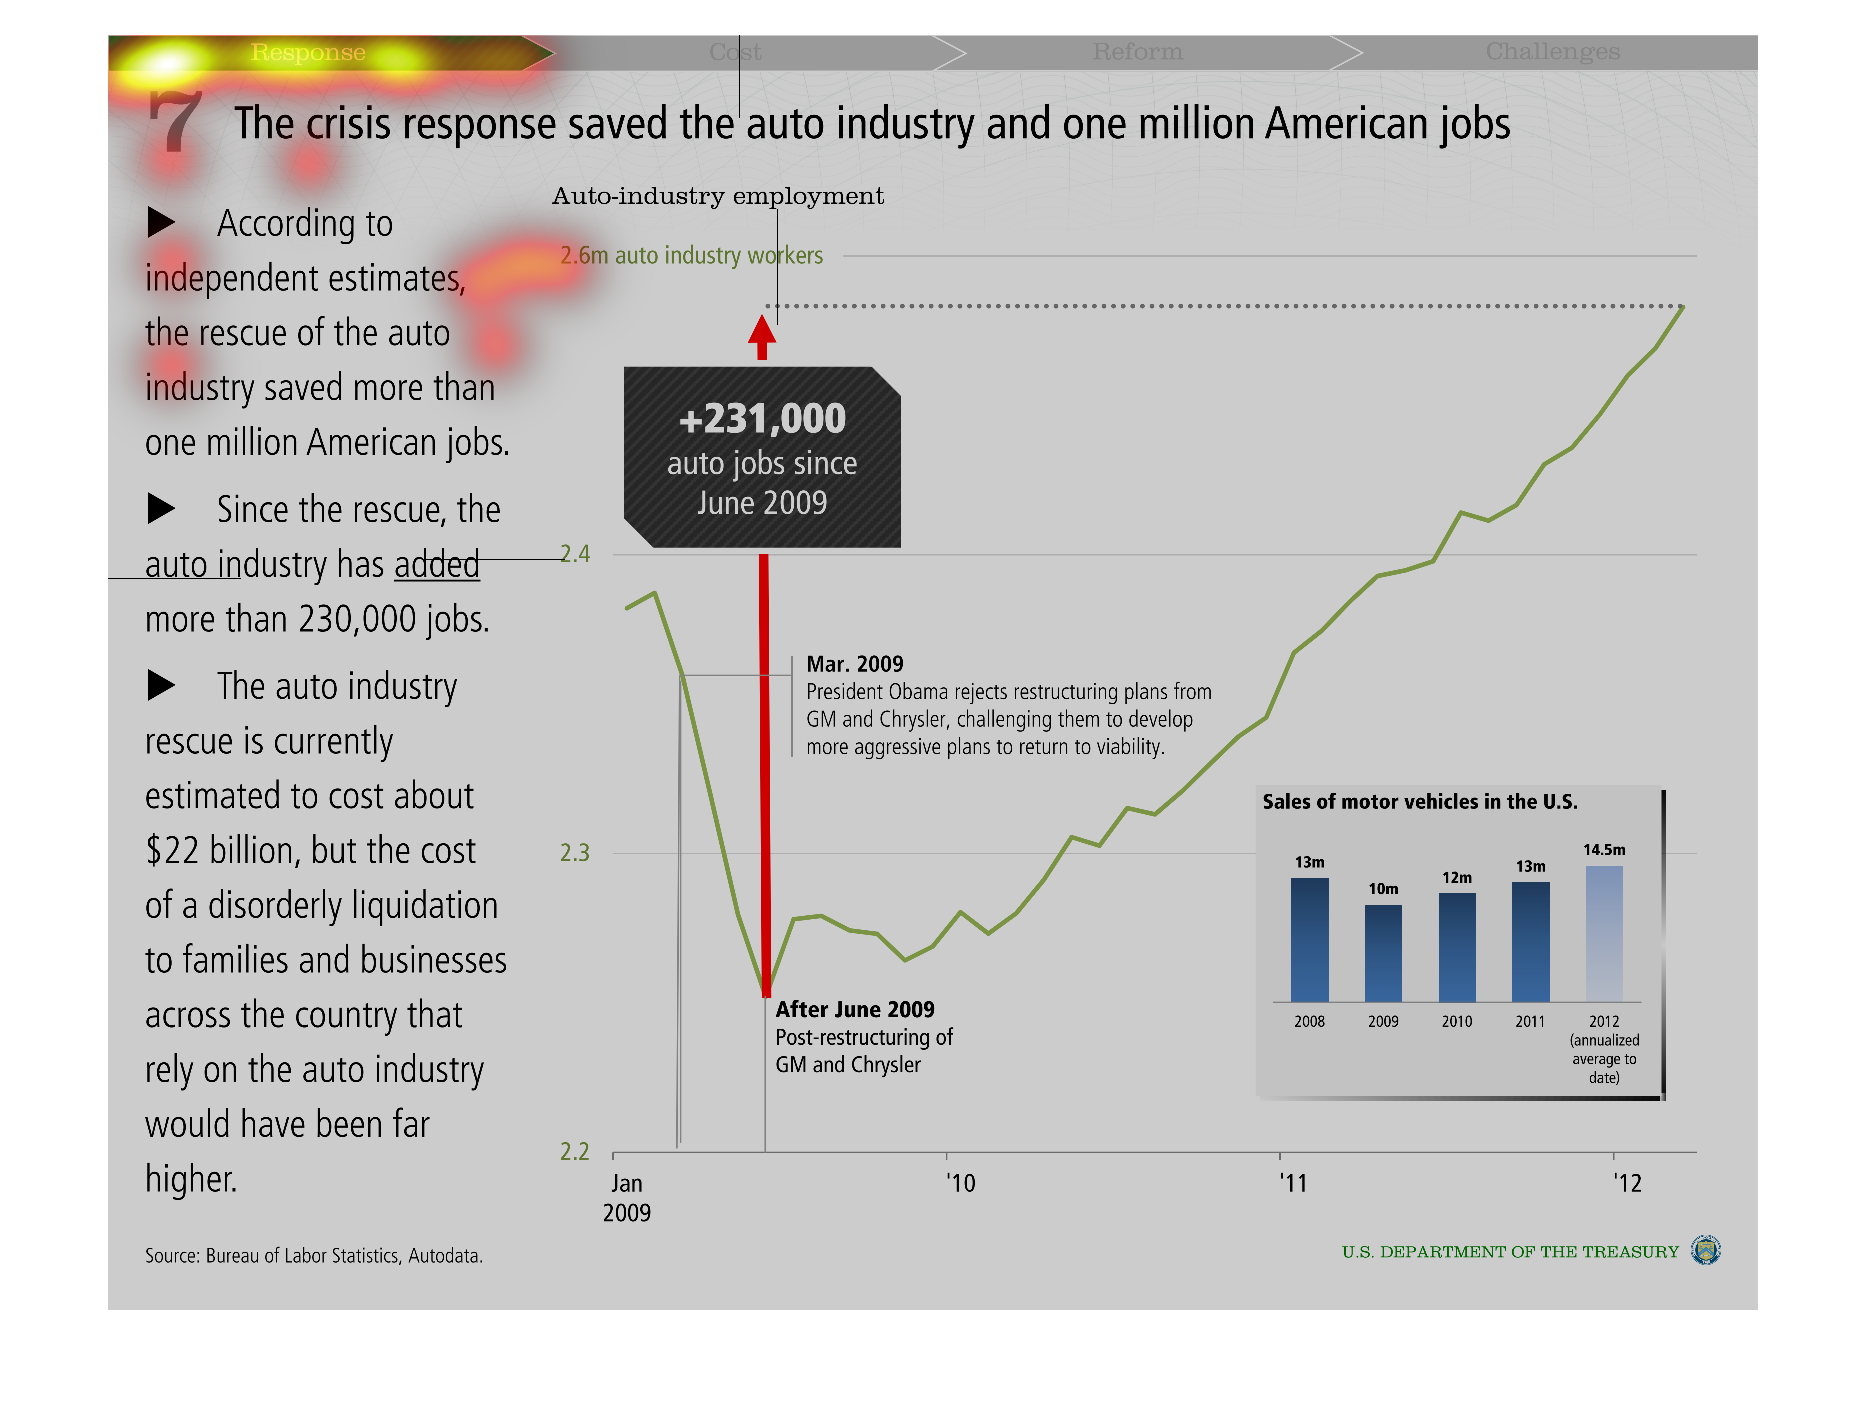
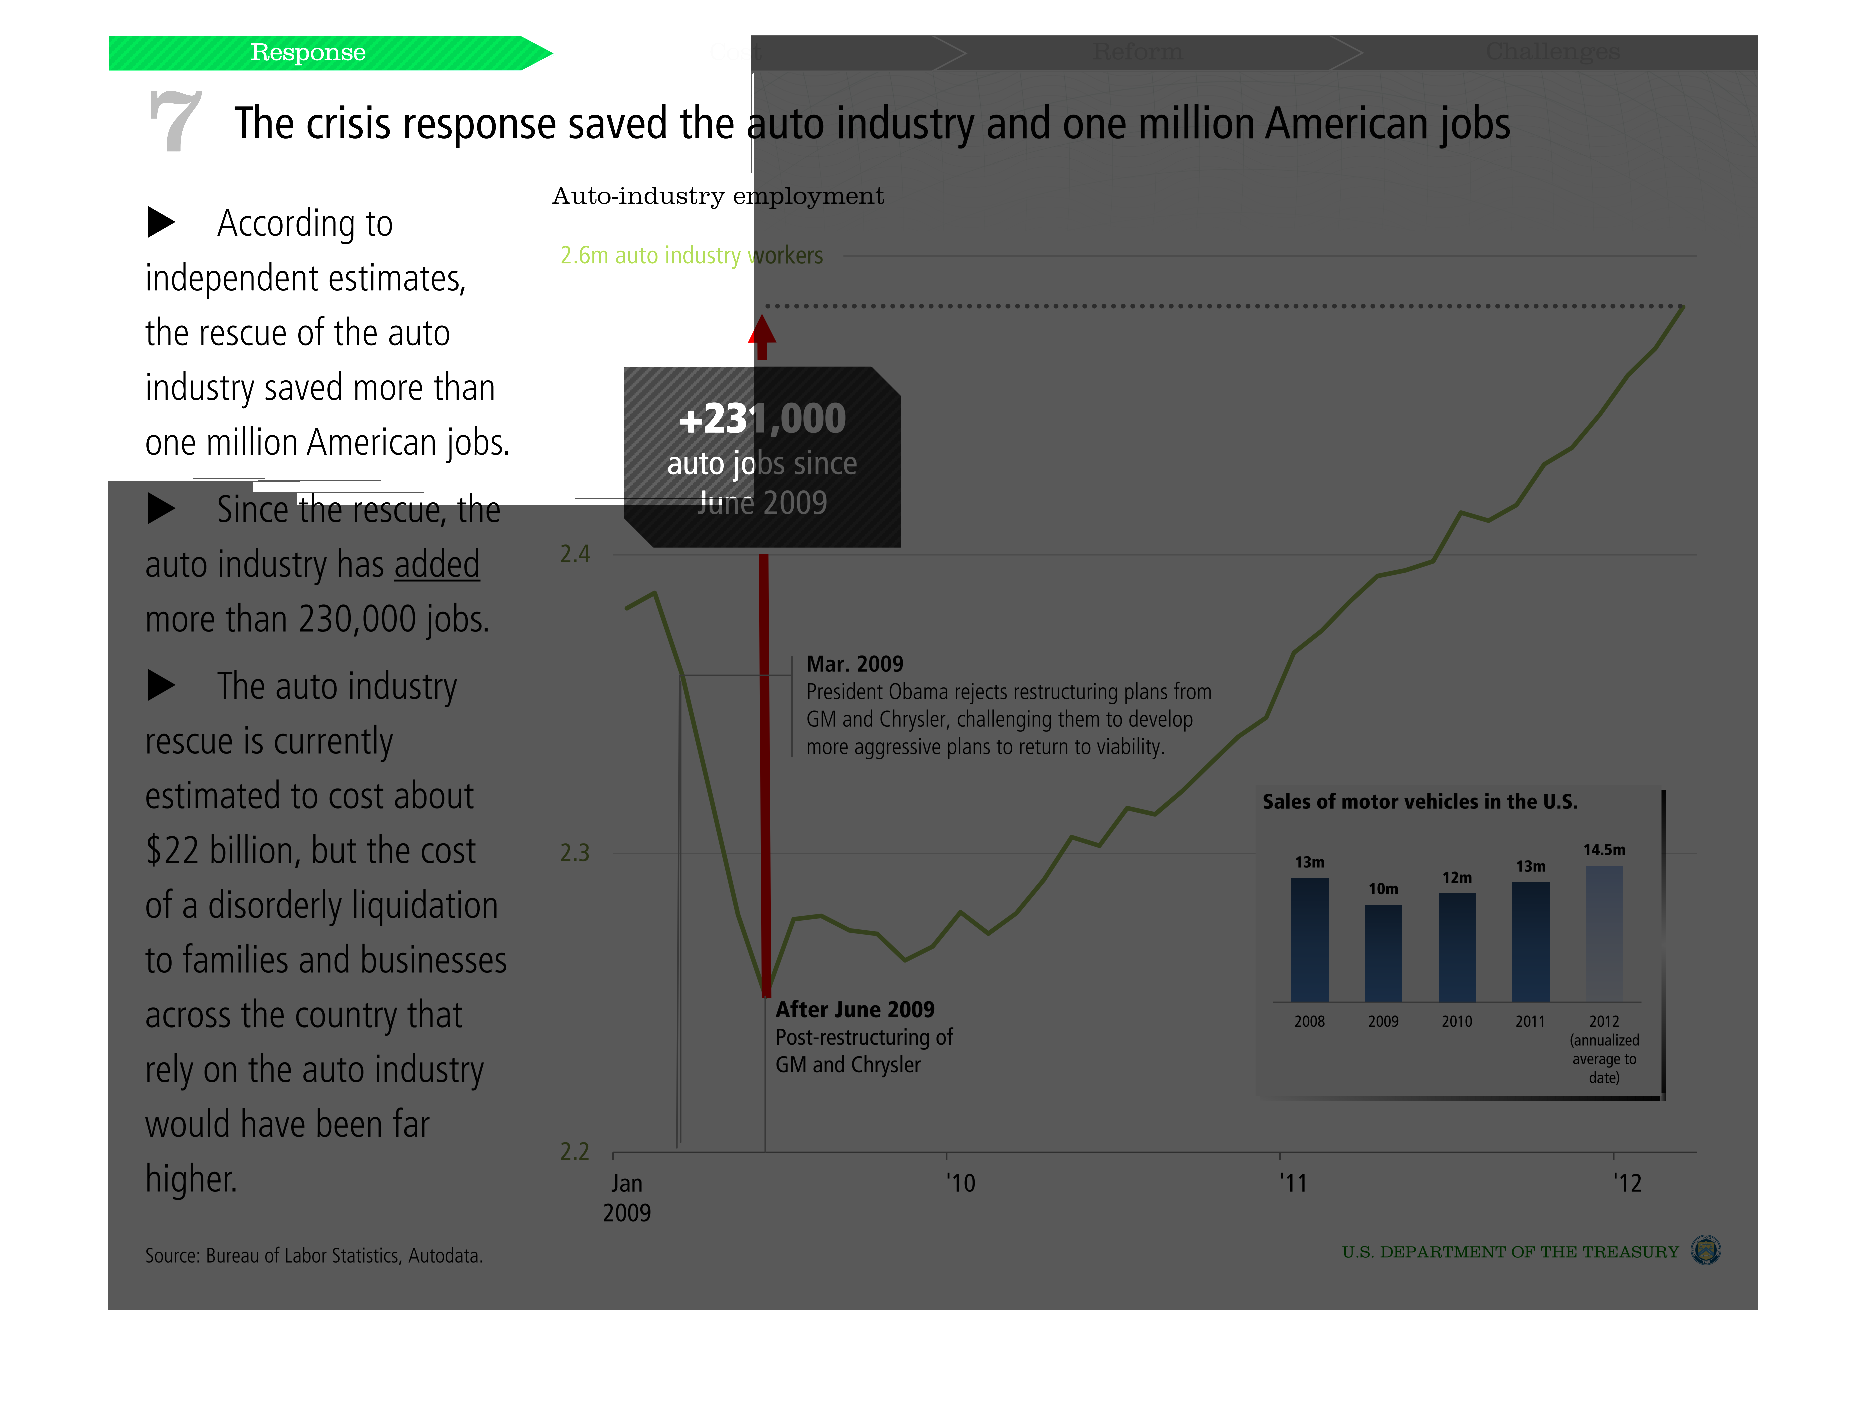
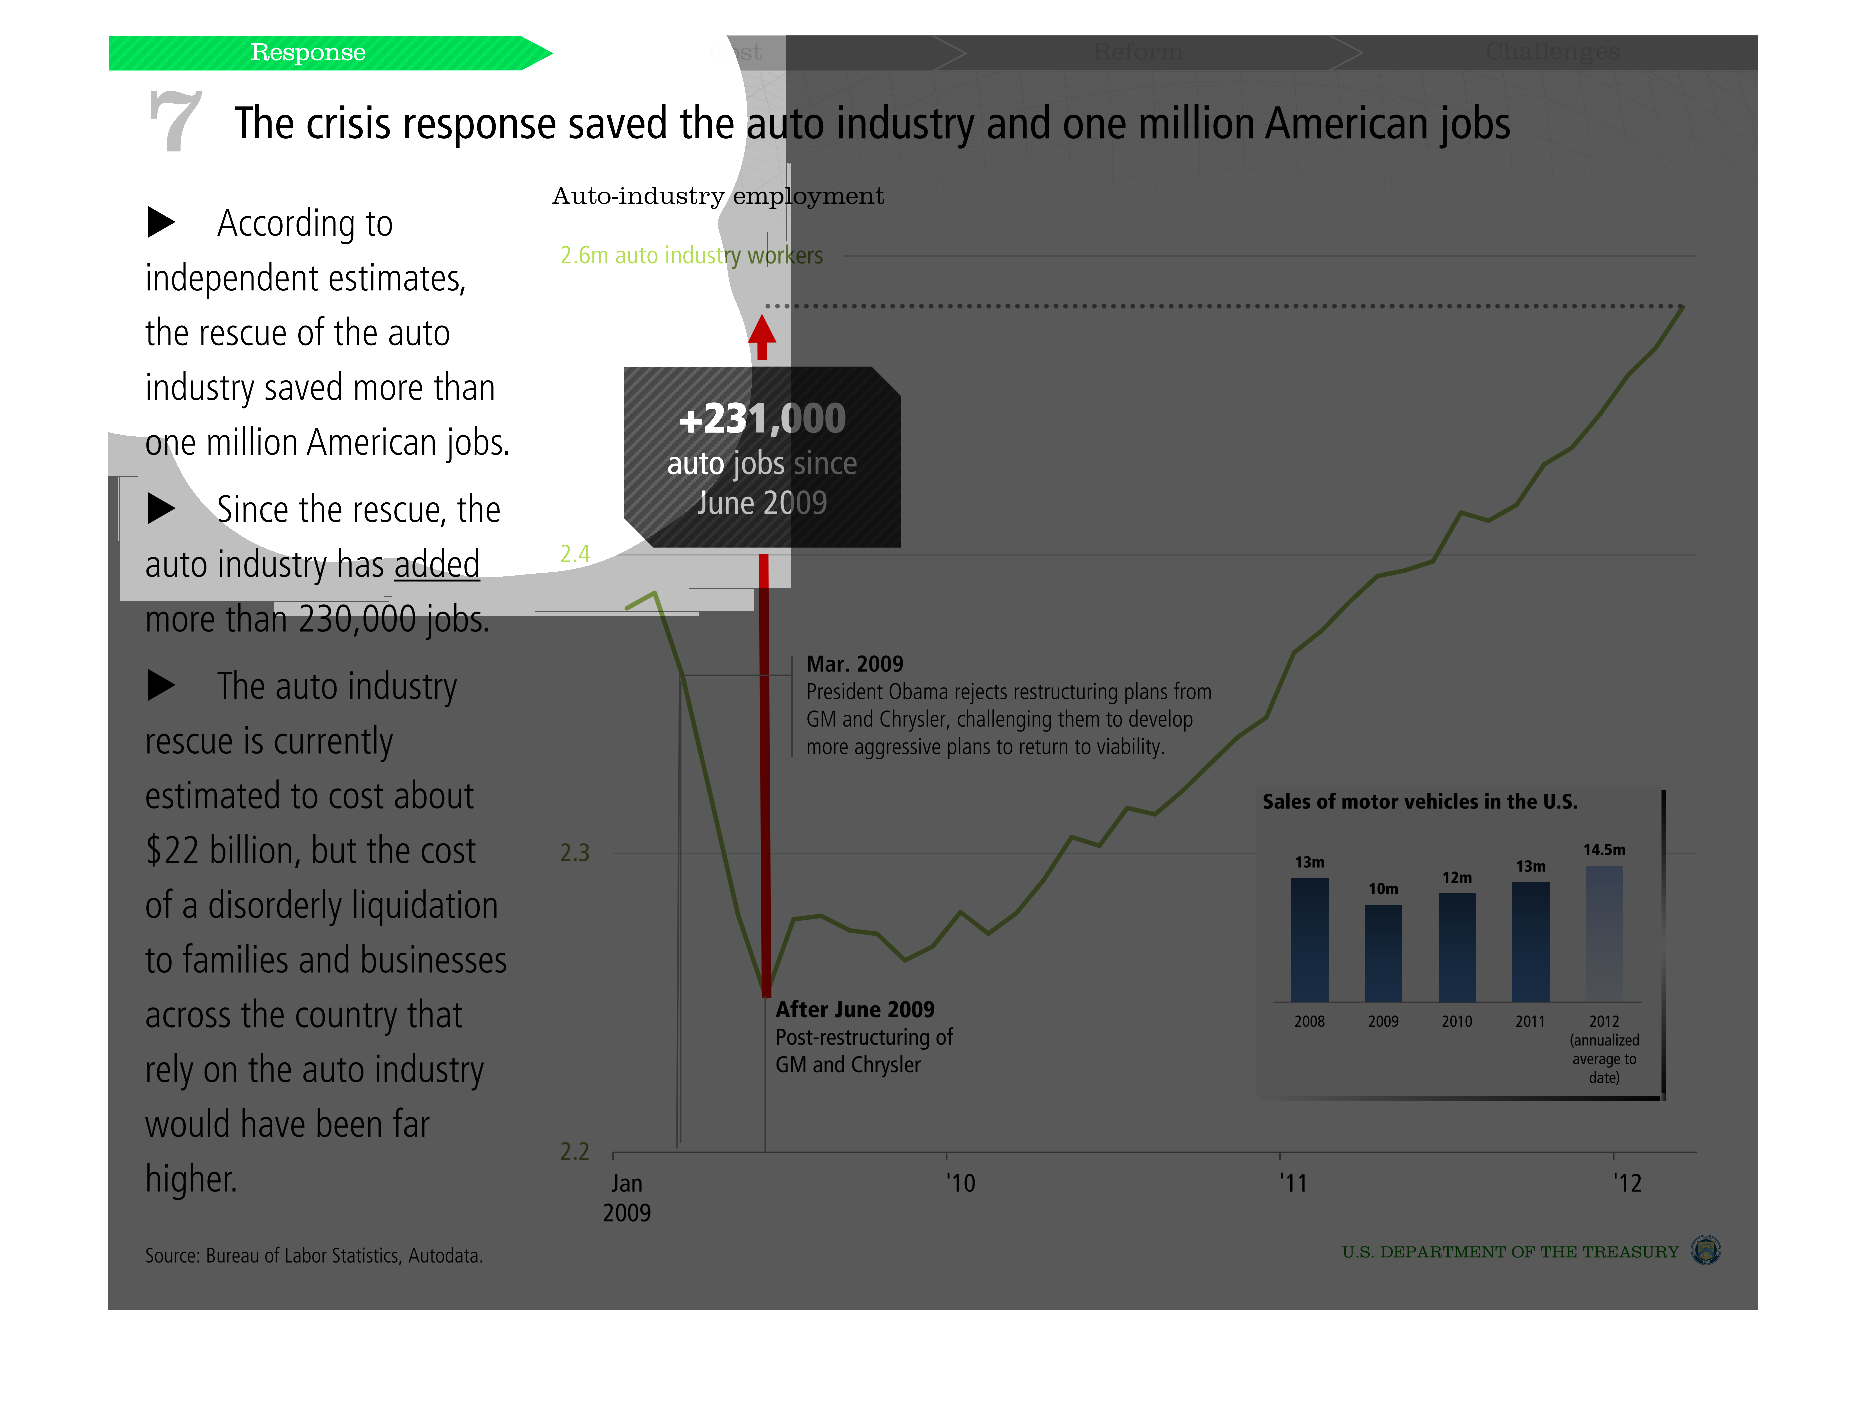
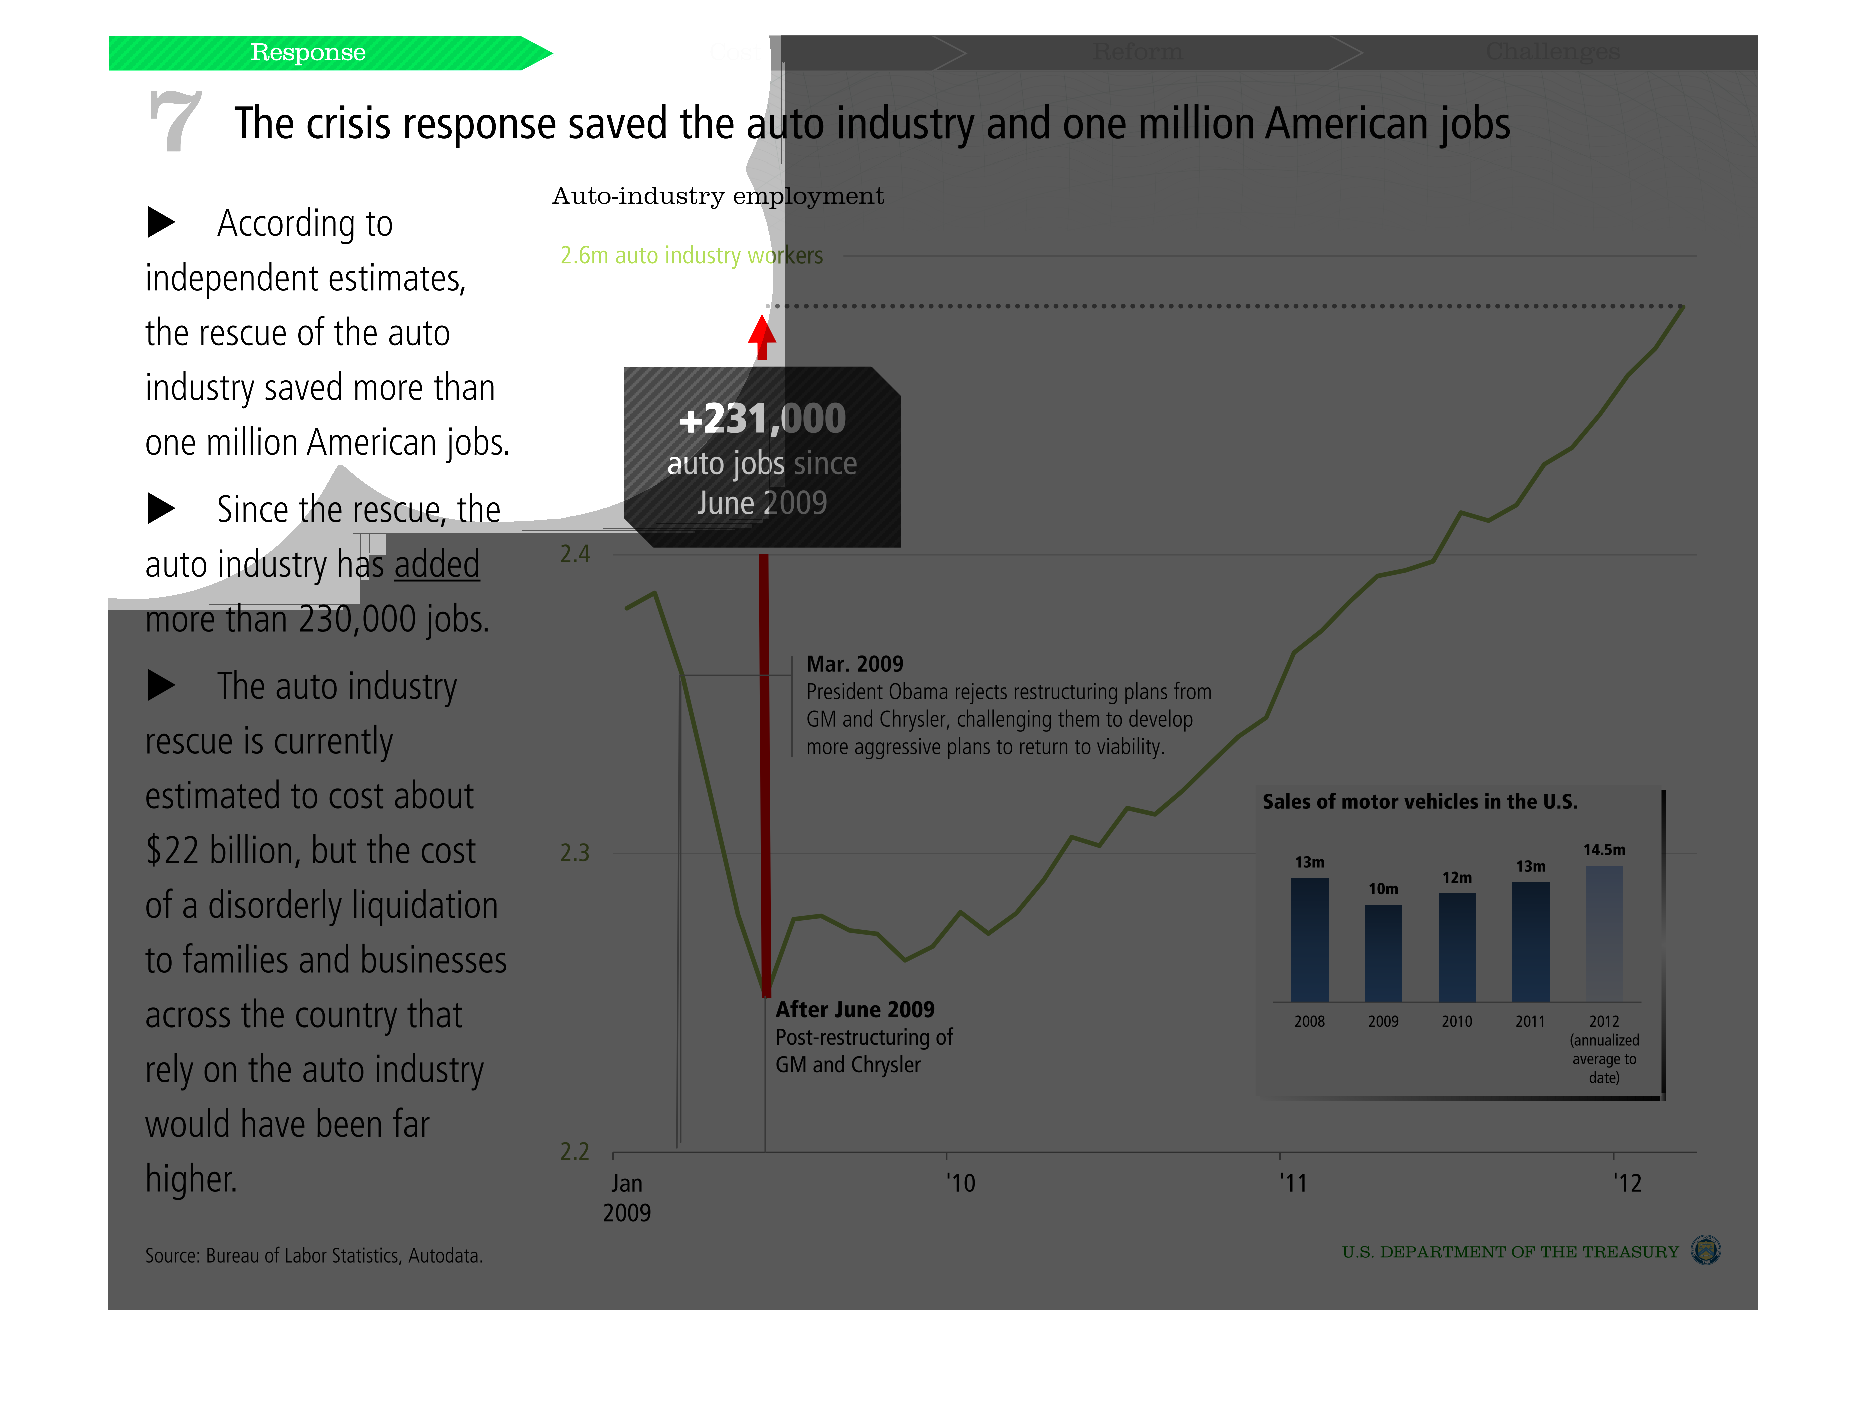
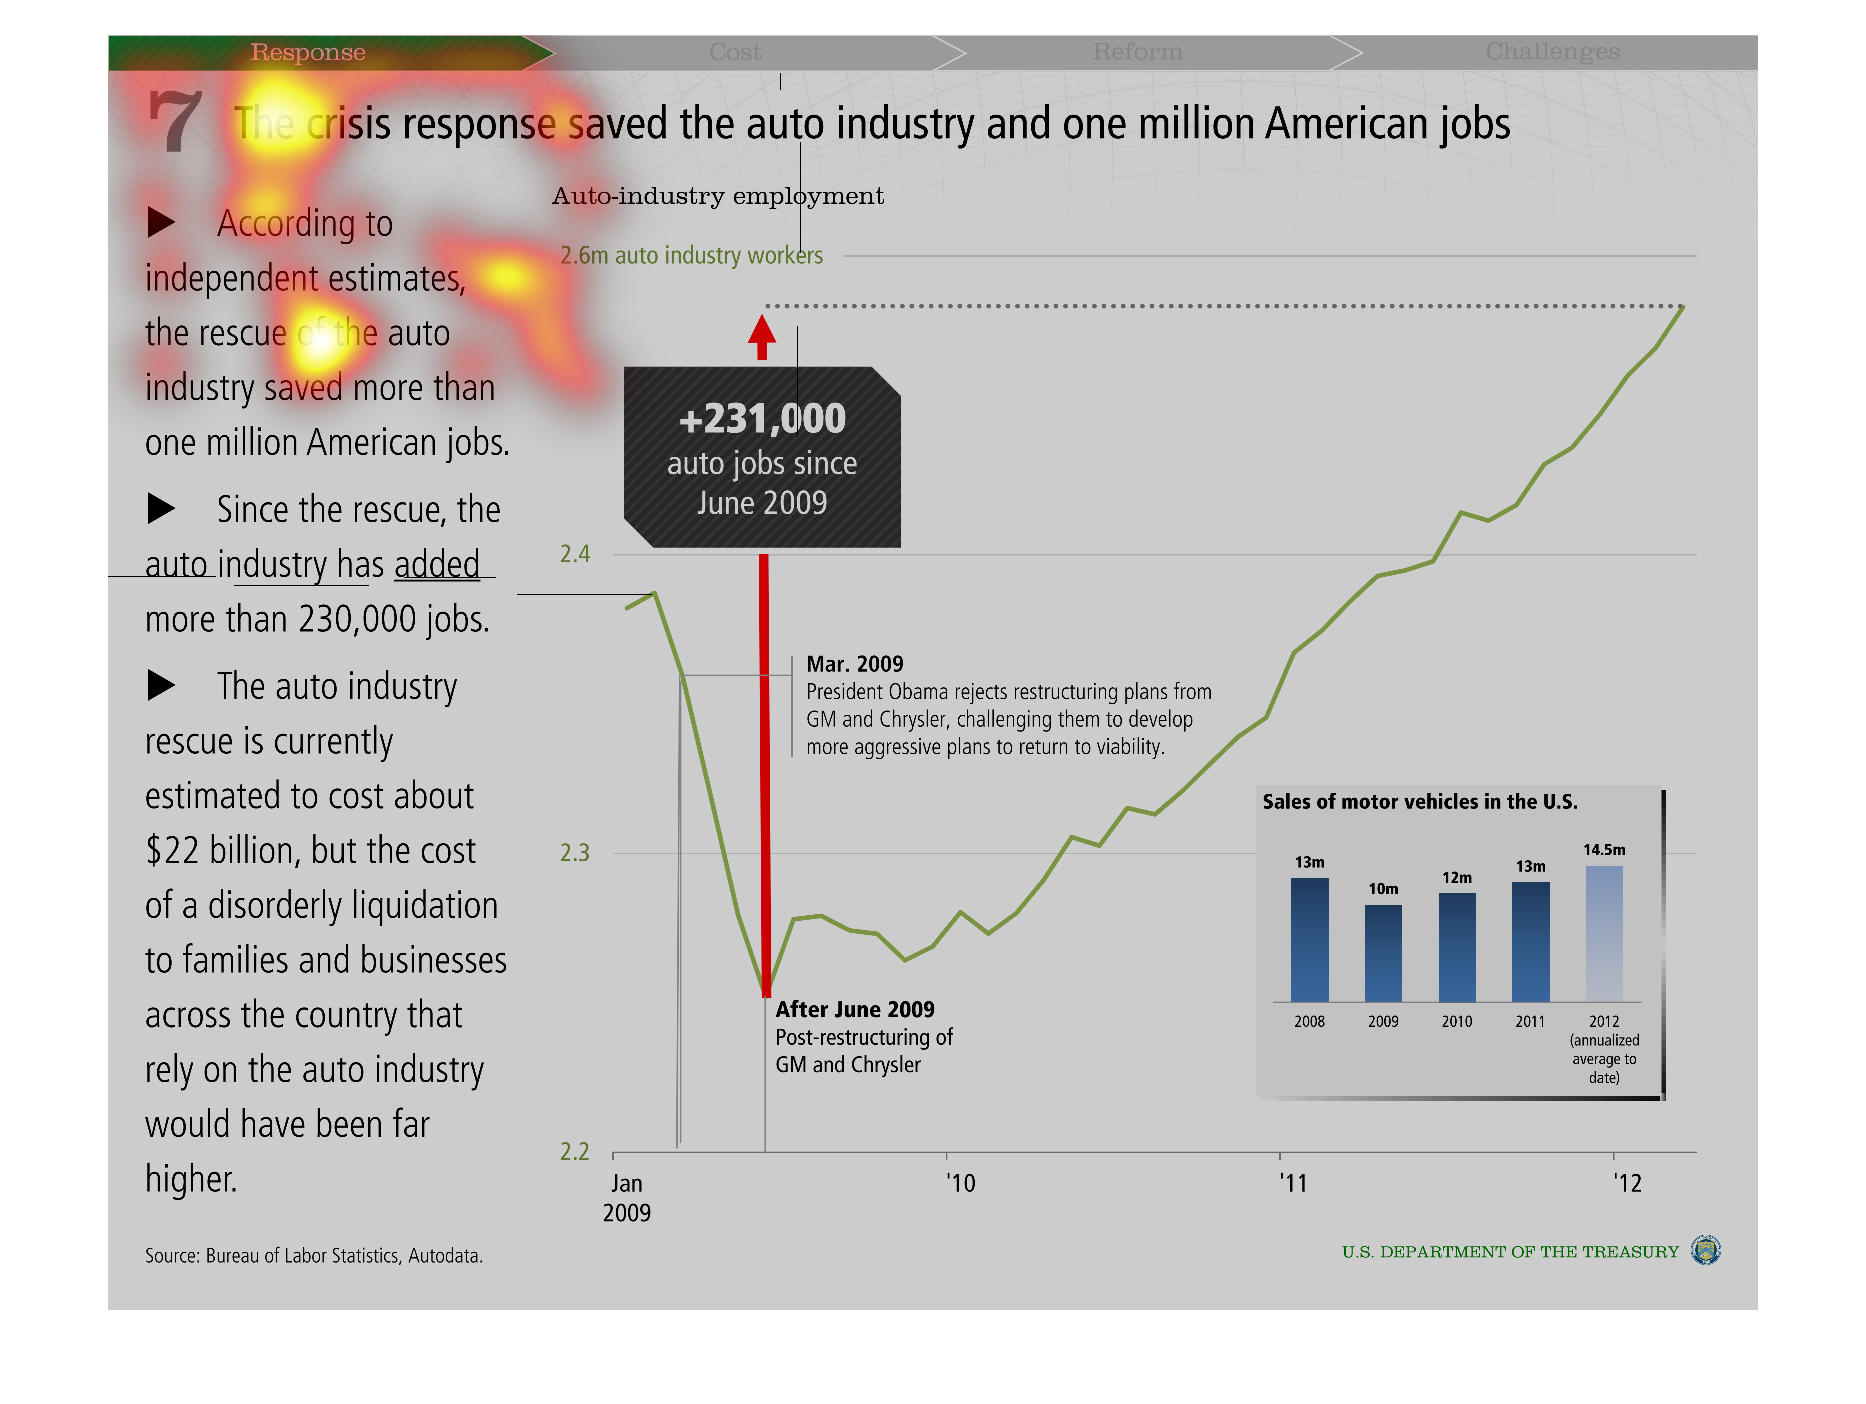
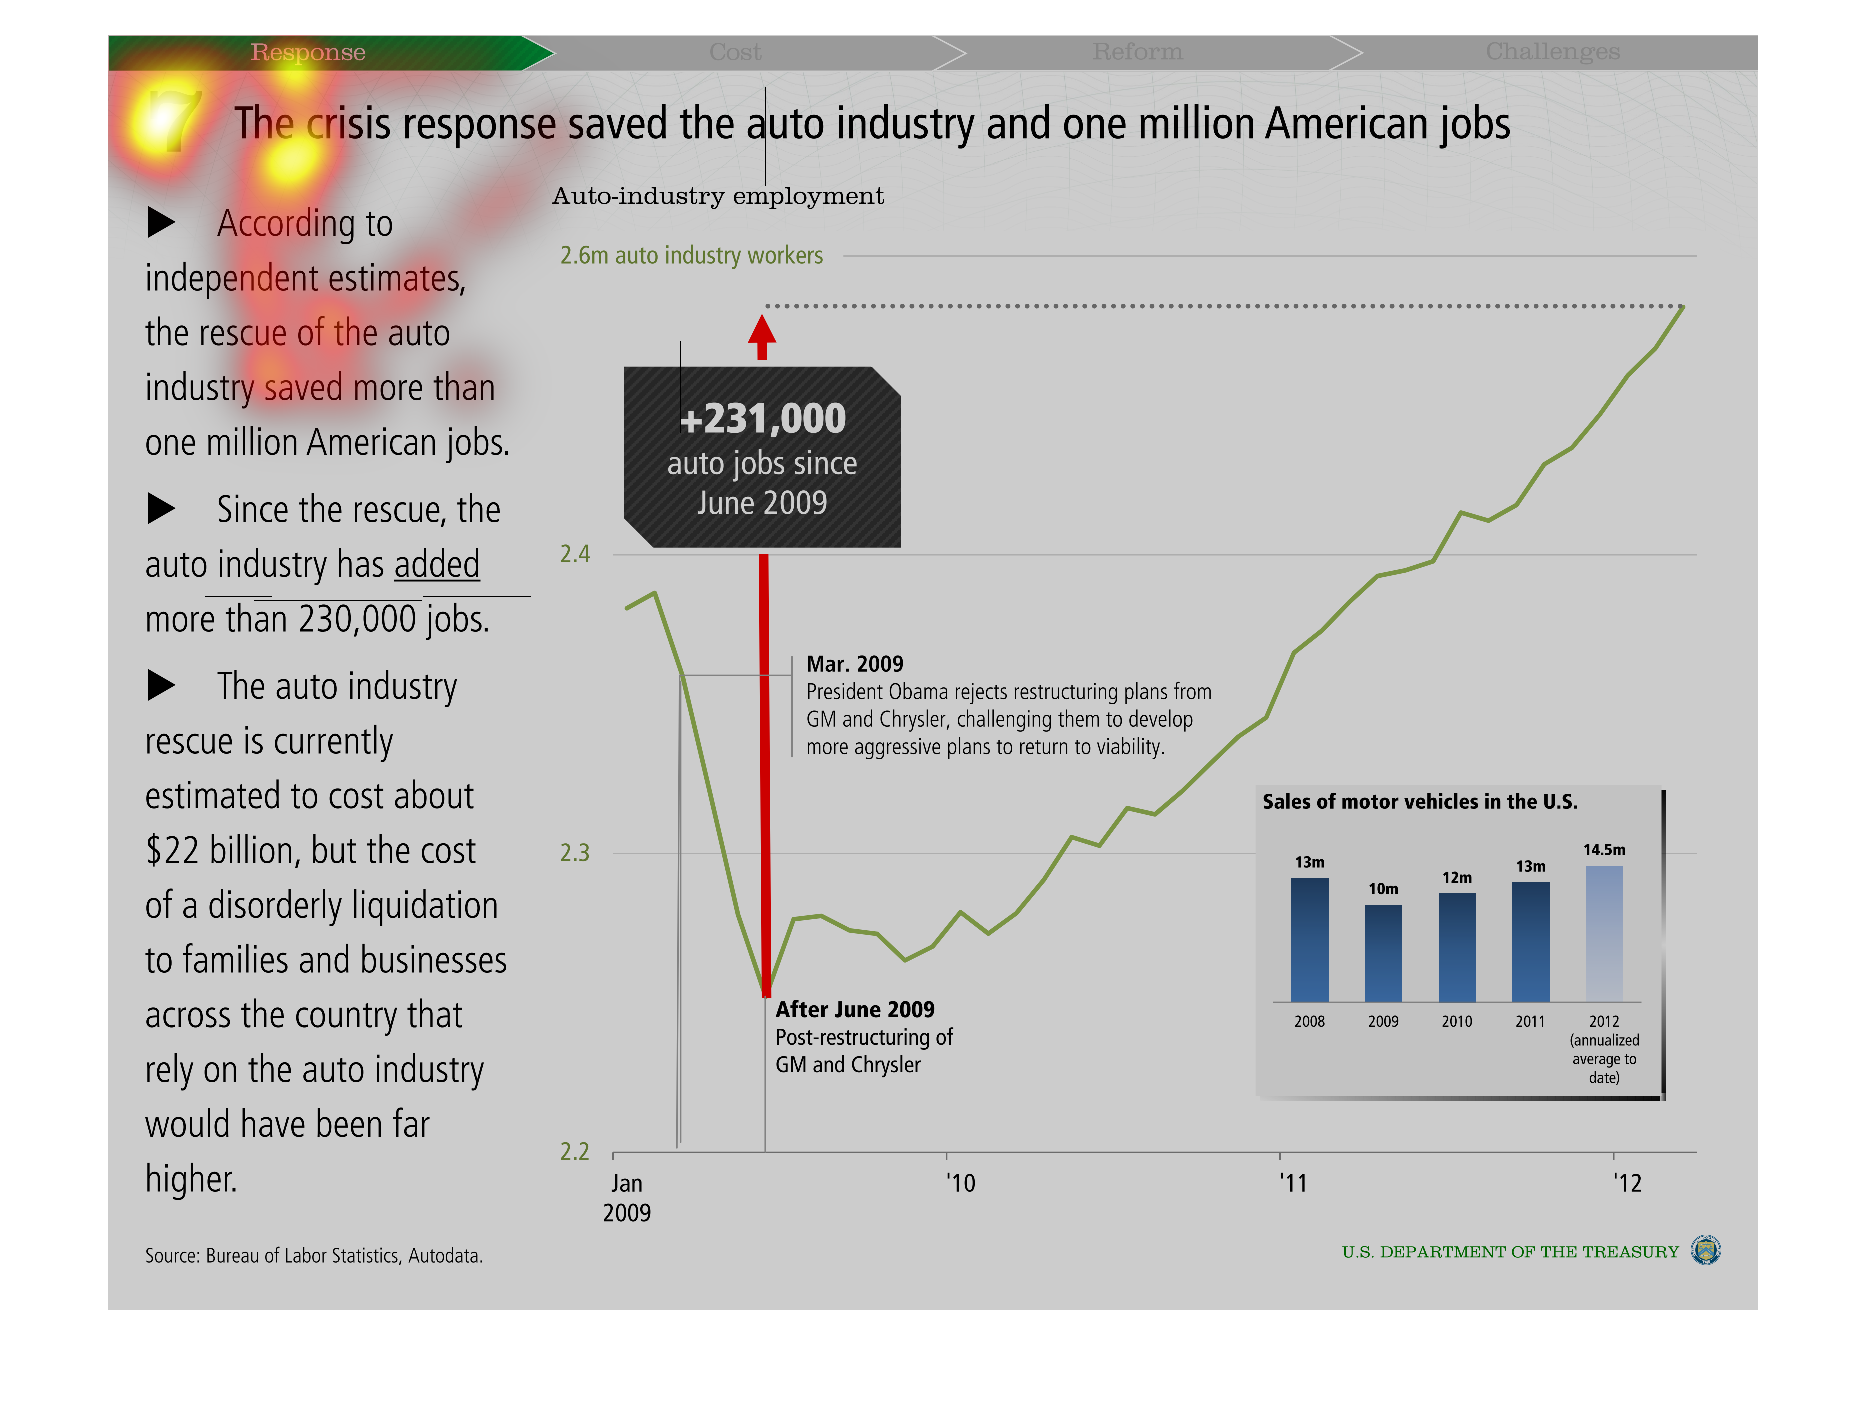
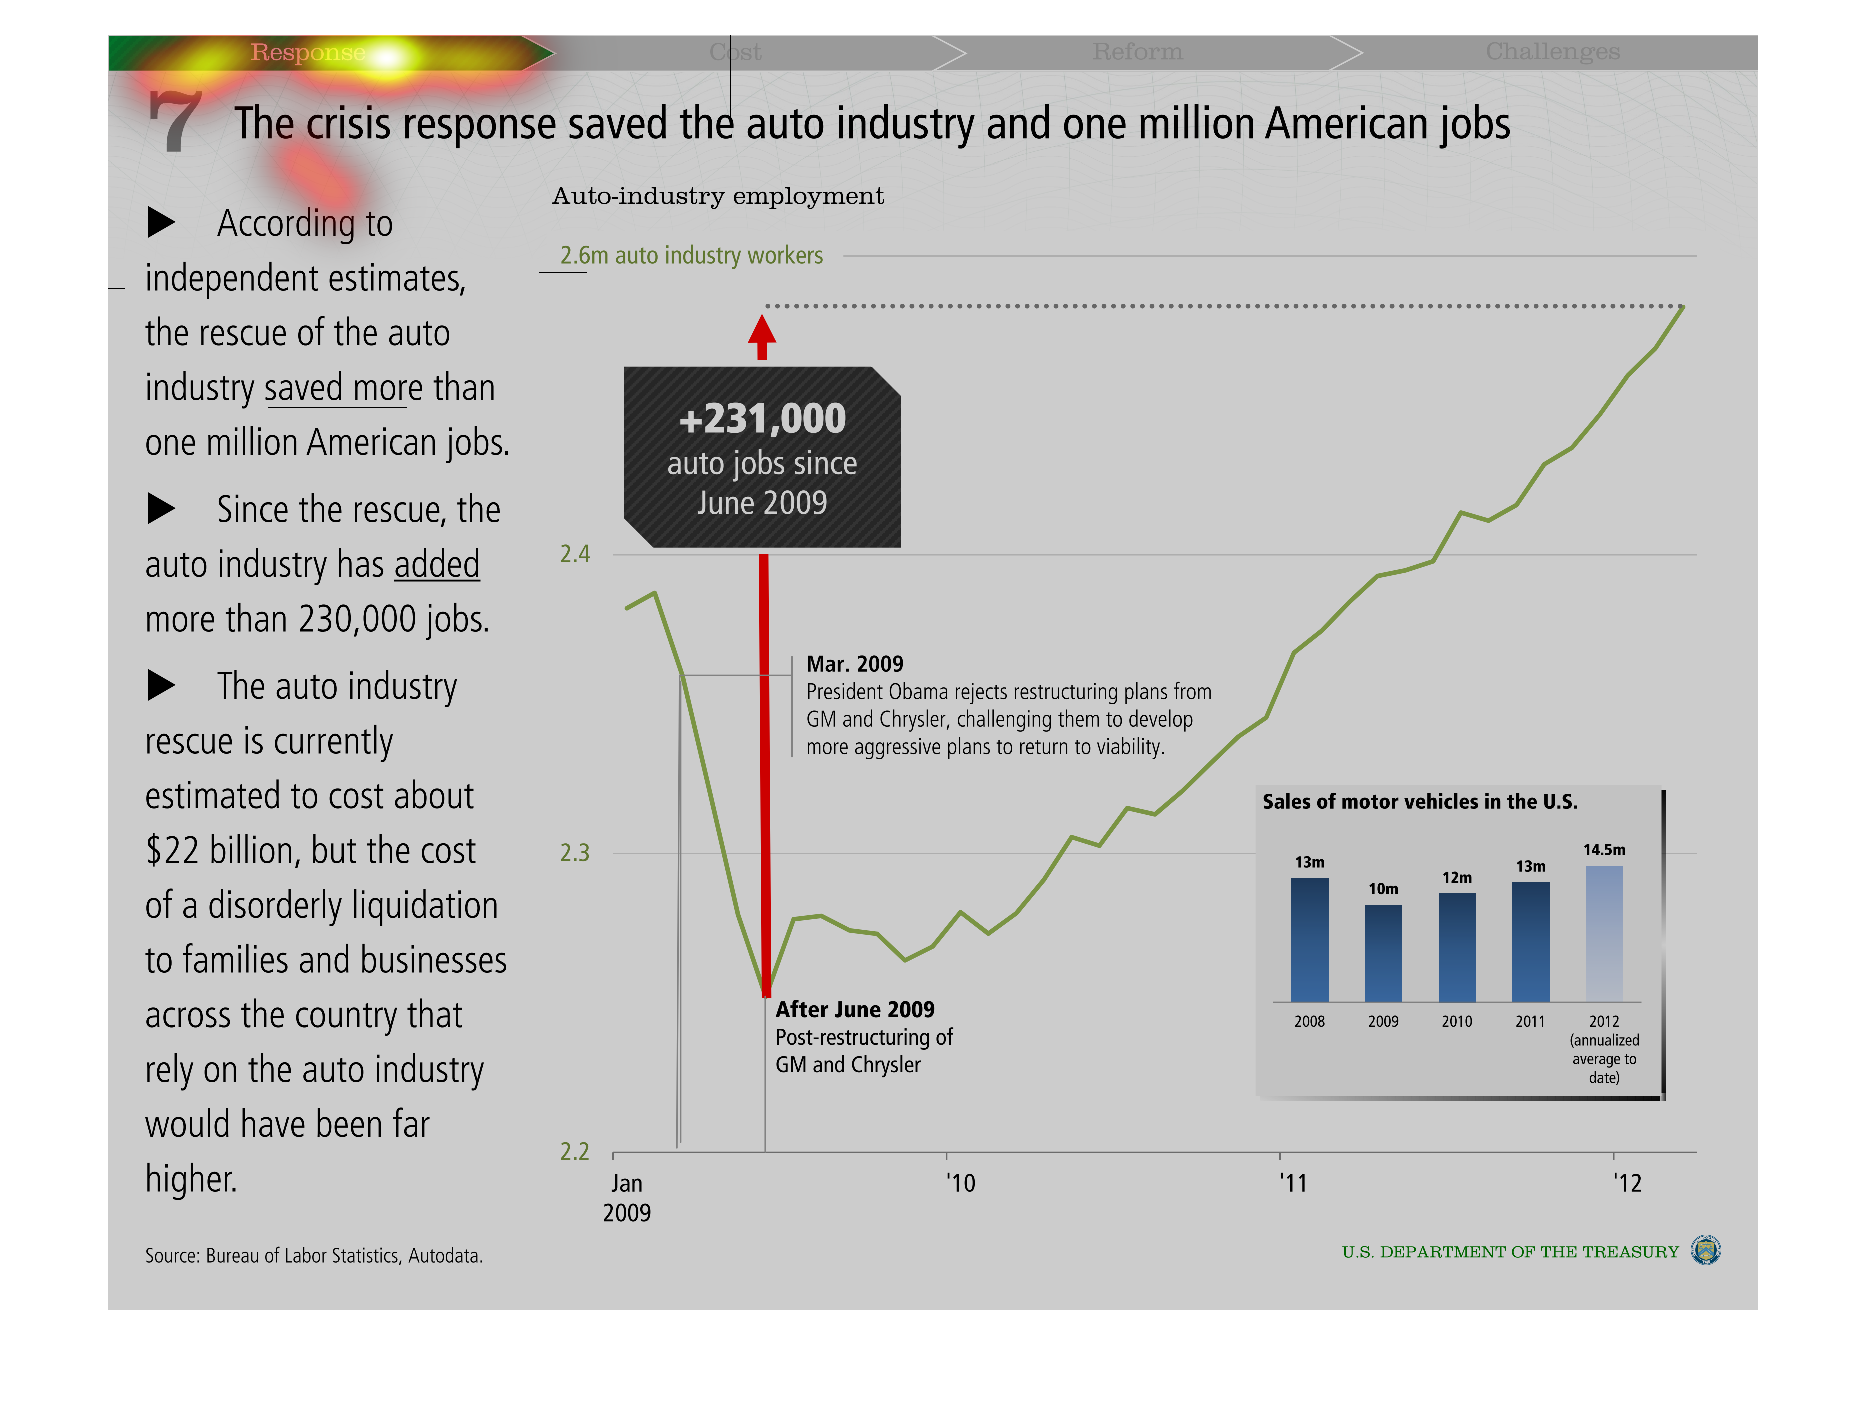
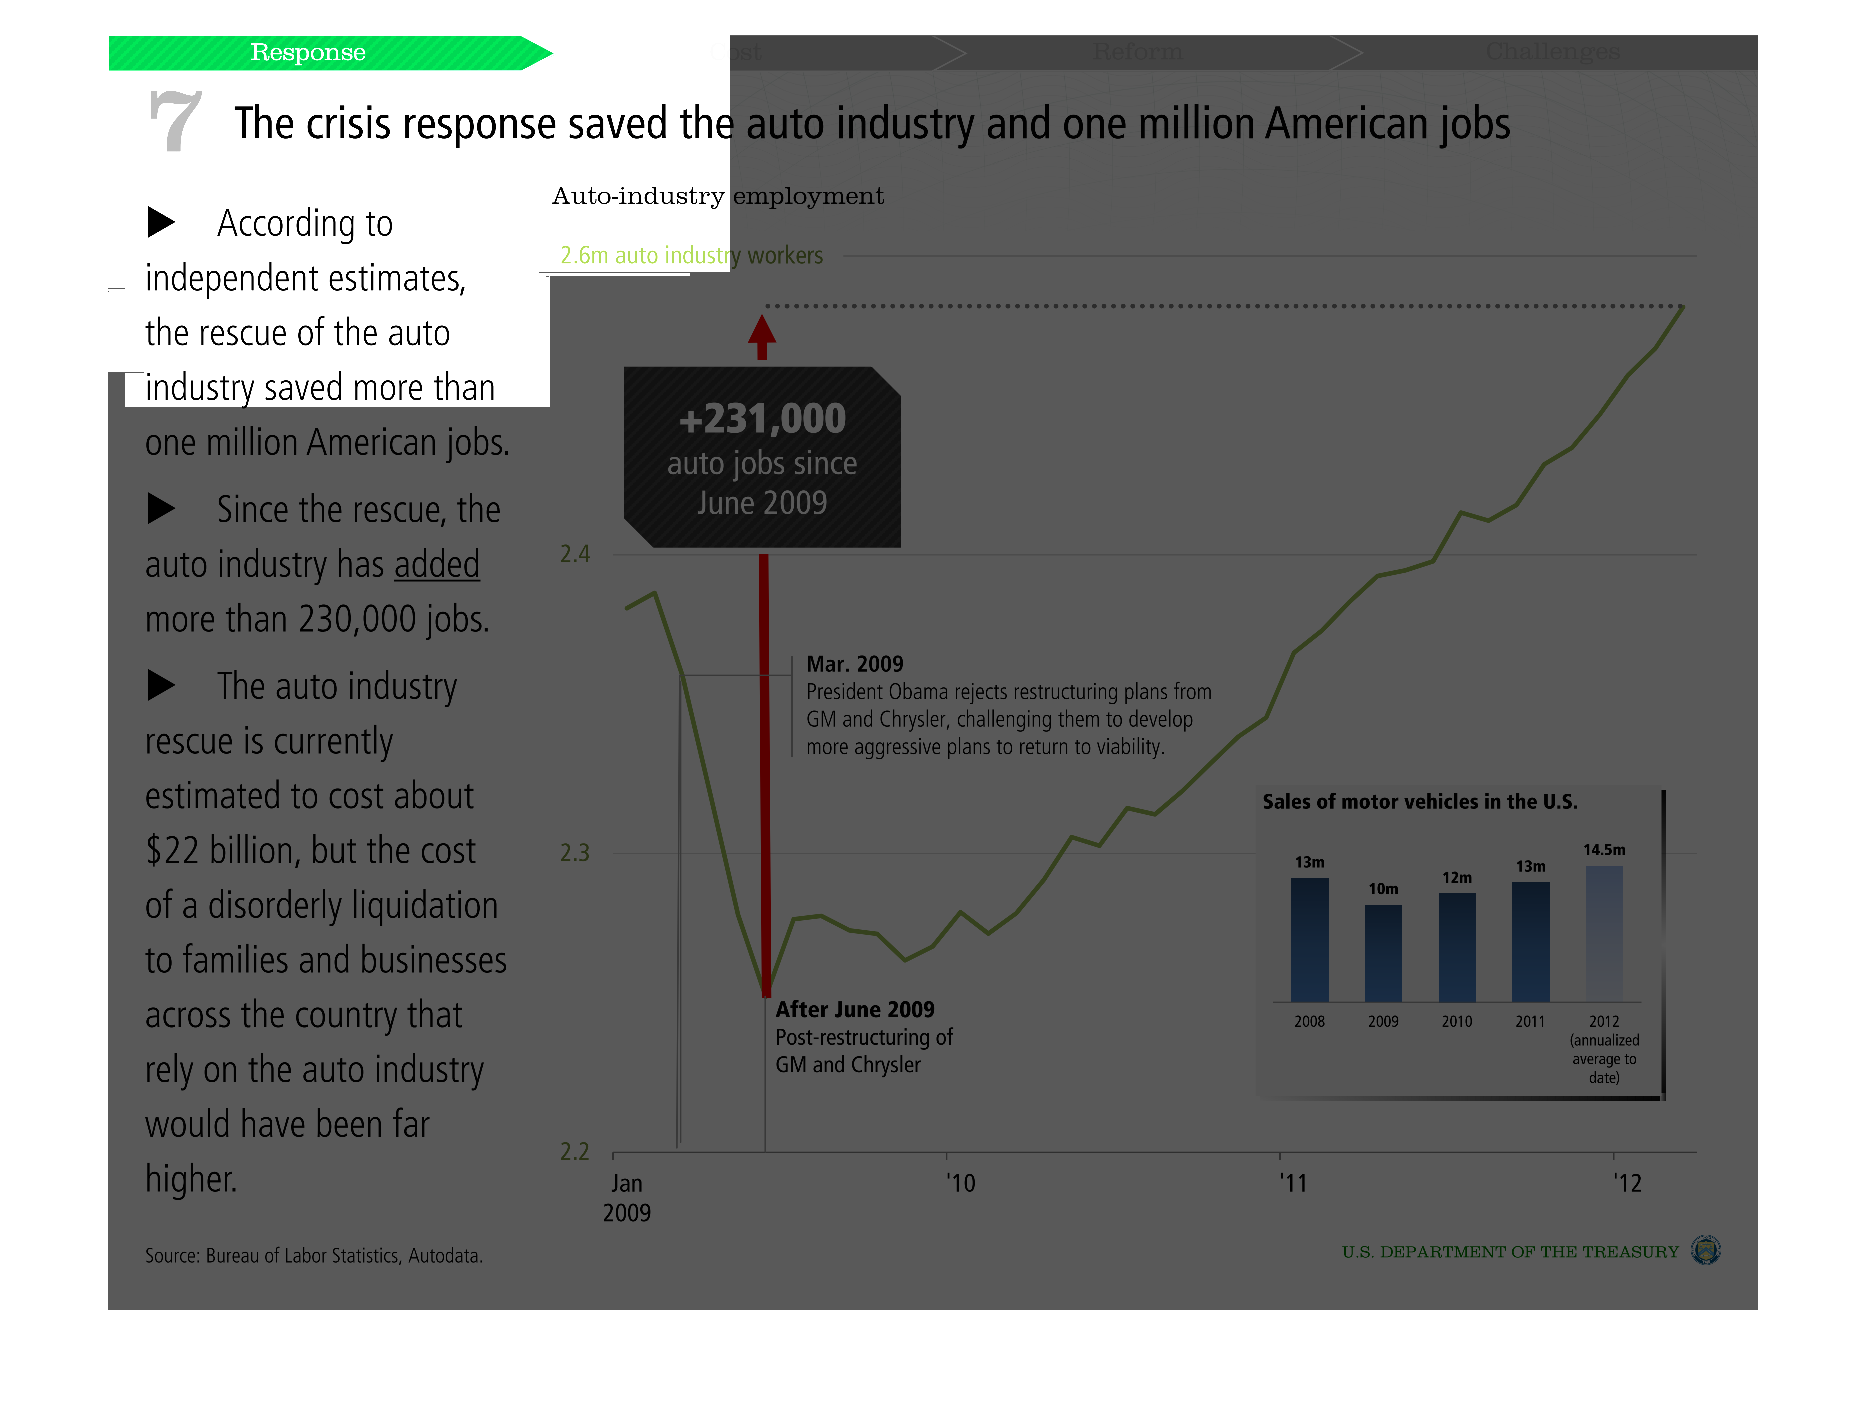
This image is an article that describes the response to the 2009 automobile industry and how
that response has saved the industry and has opened more jobs in that industry. Two graphs
are shown, one of them is a line graph that shows the growth of the jobs in the industry.
The other one is a bar graph that shows sales of motor vehicles in the US by year.
Warning: Image is too big to fit on screen; displaying at 50%
Warning: Image is too big to fit on screen; displaying at 50%
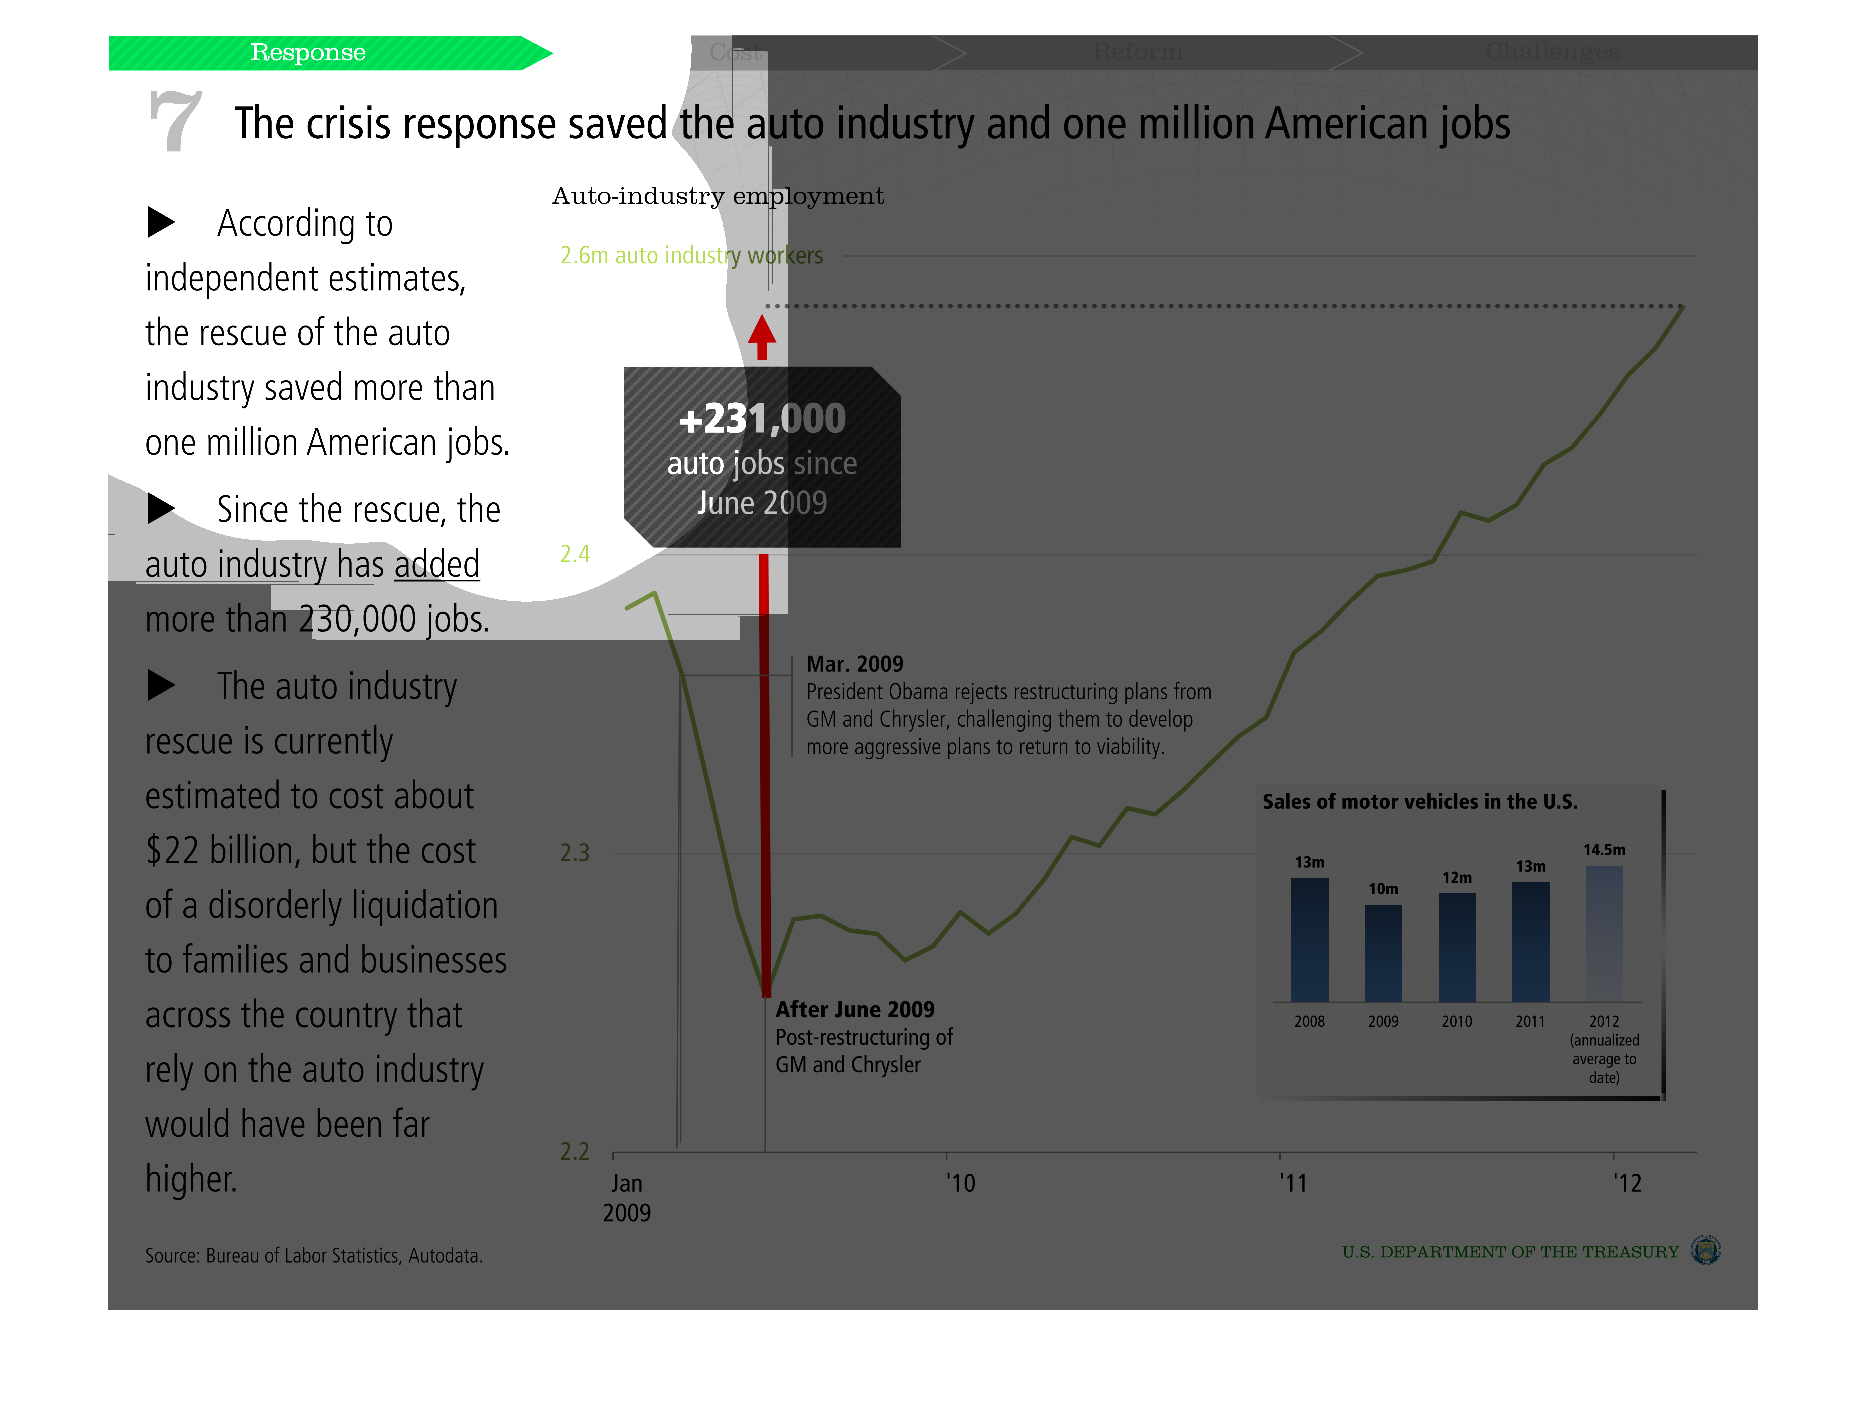
the crisis response saved the auto industry and one million American jobs. this is according
to independent estimates. Bailing out the auto industry in essence saved the economy
Warning: Image is too big to fit on screen; displaying at 50%
Warning: Image is too big to fit on screen; displaying at 50%
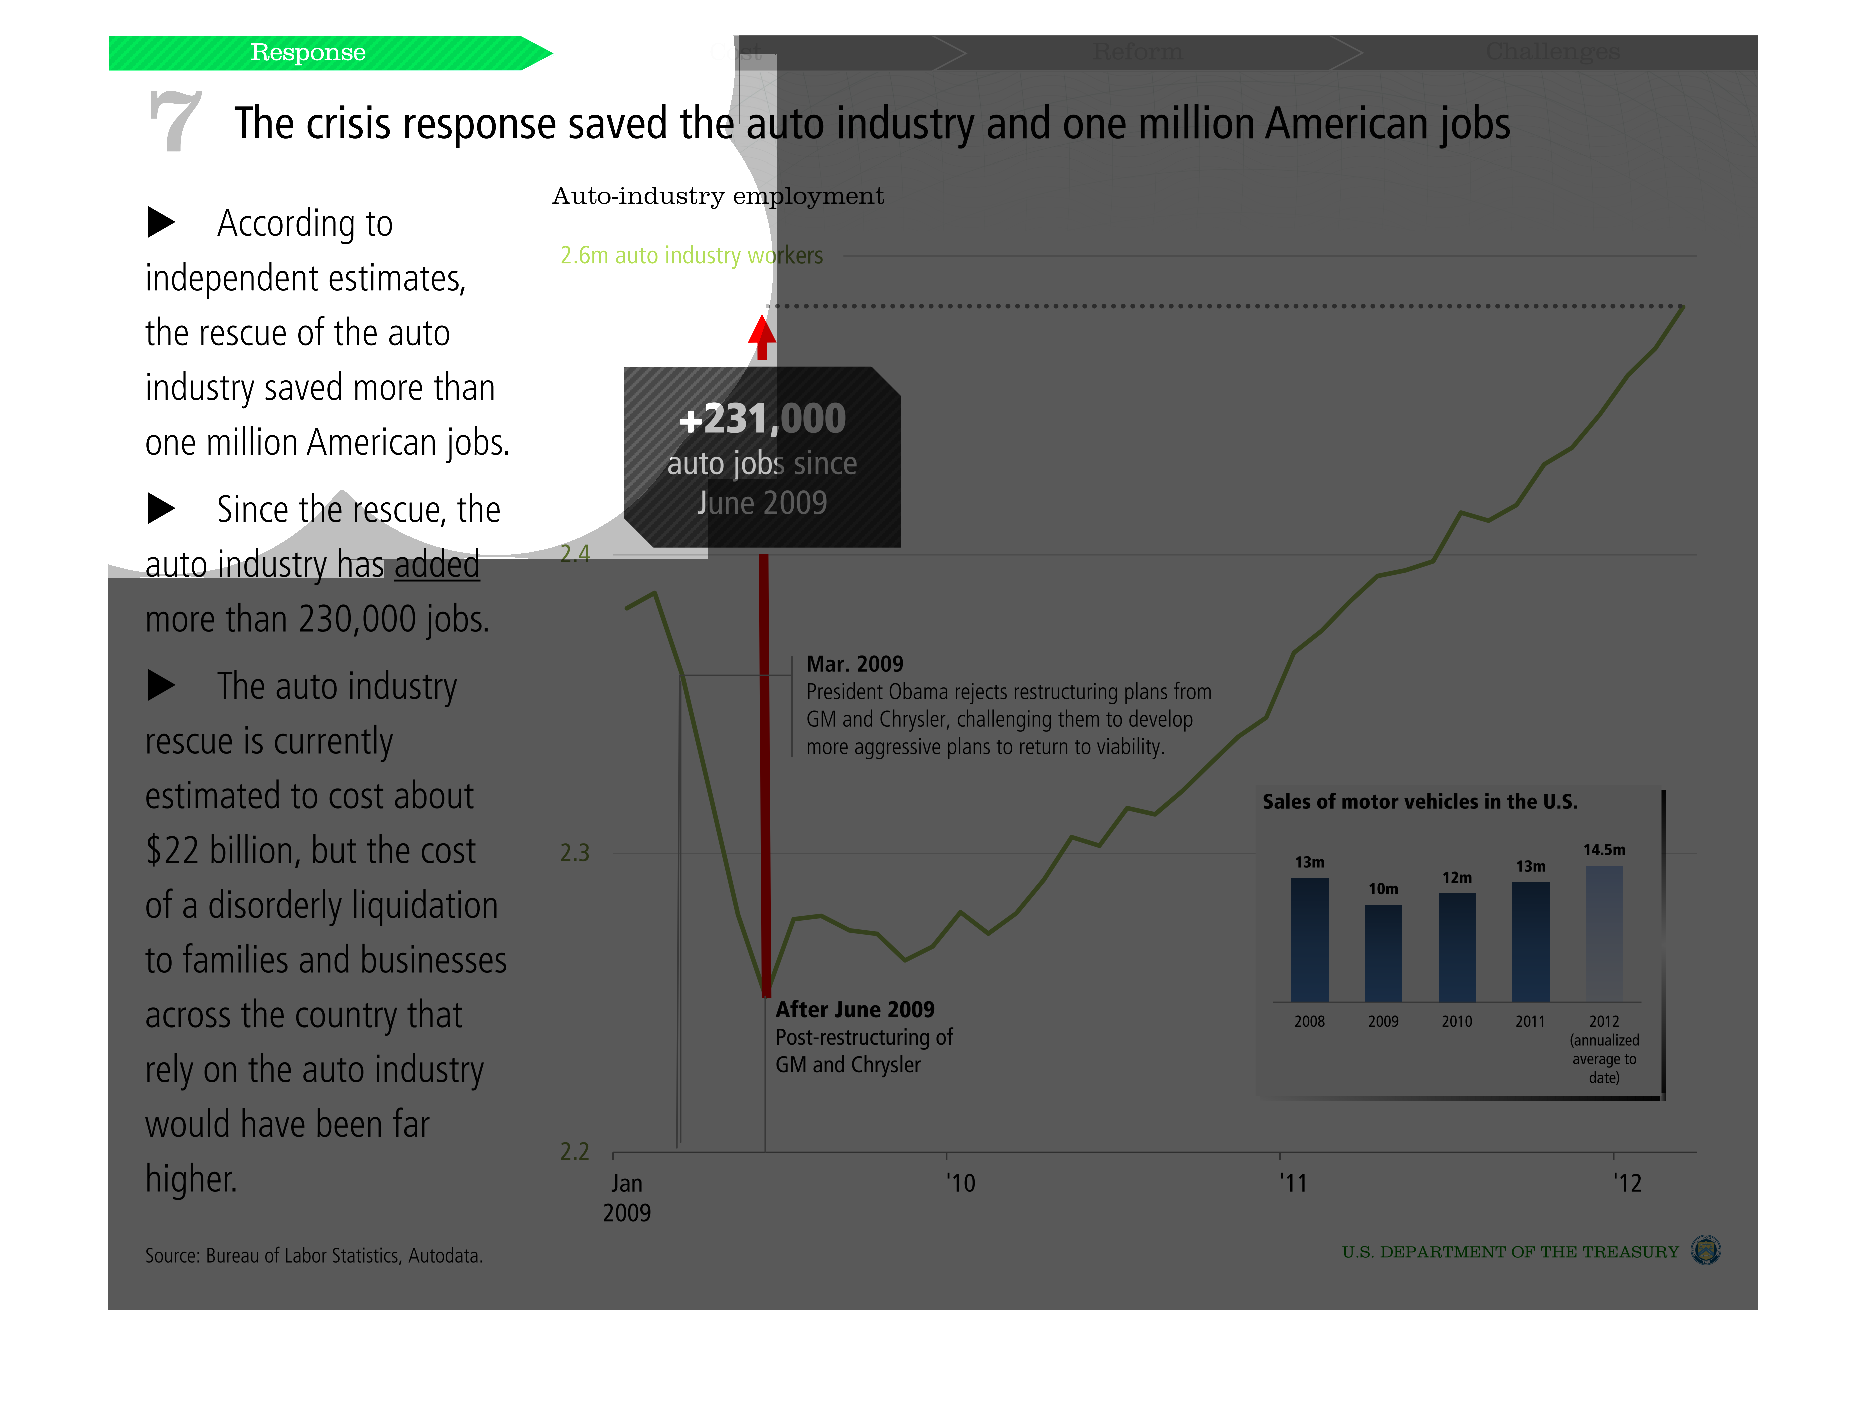
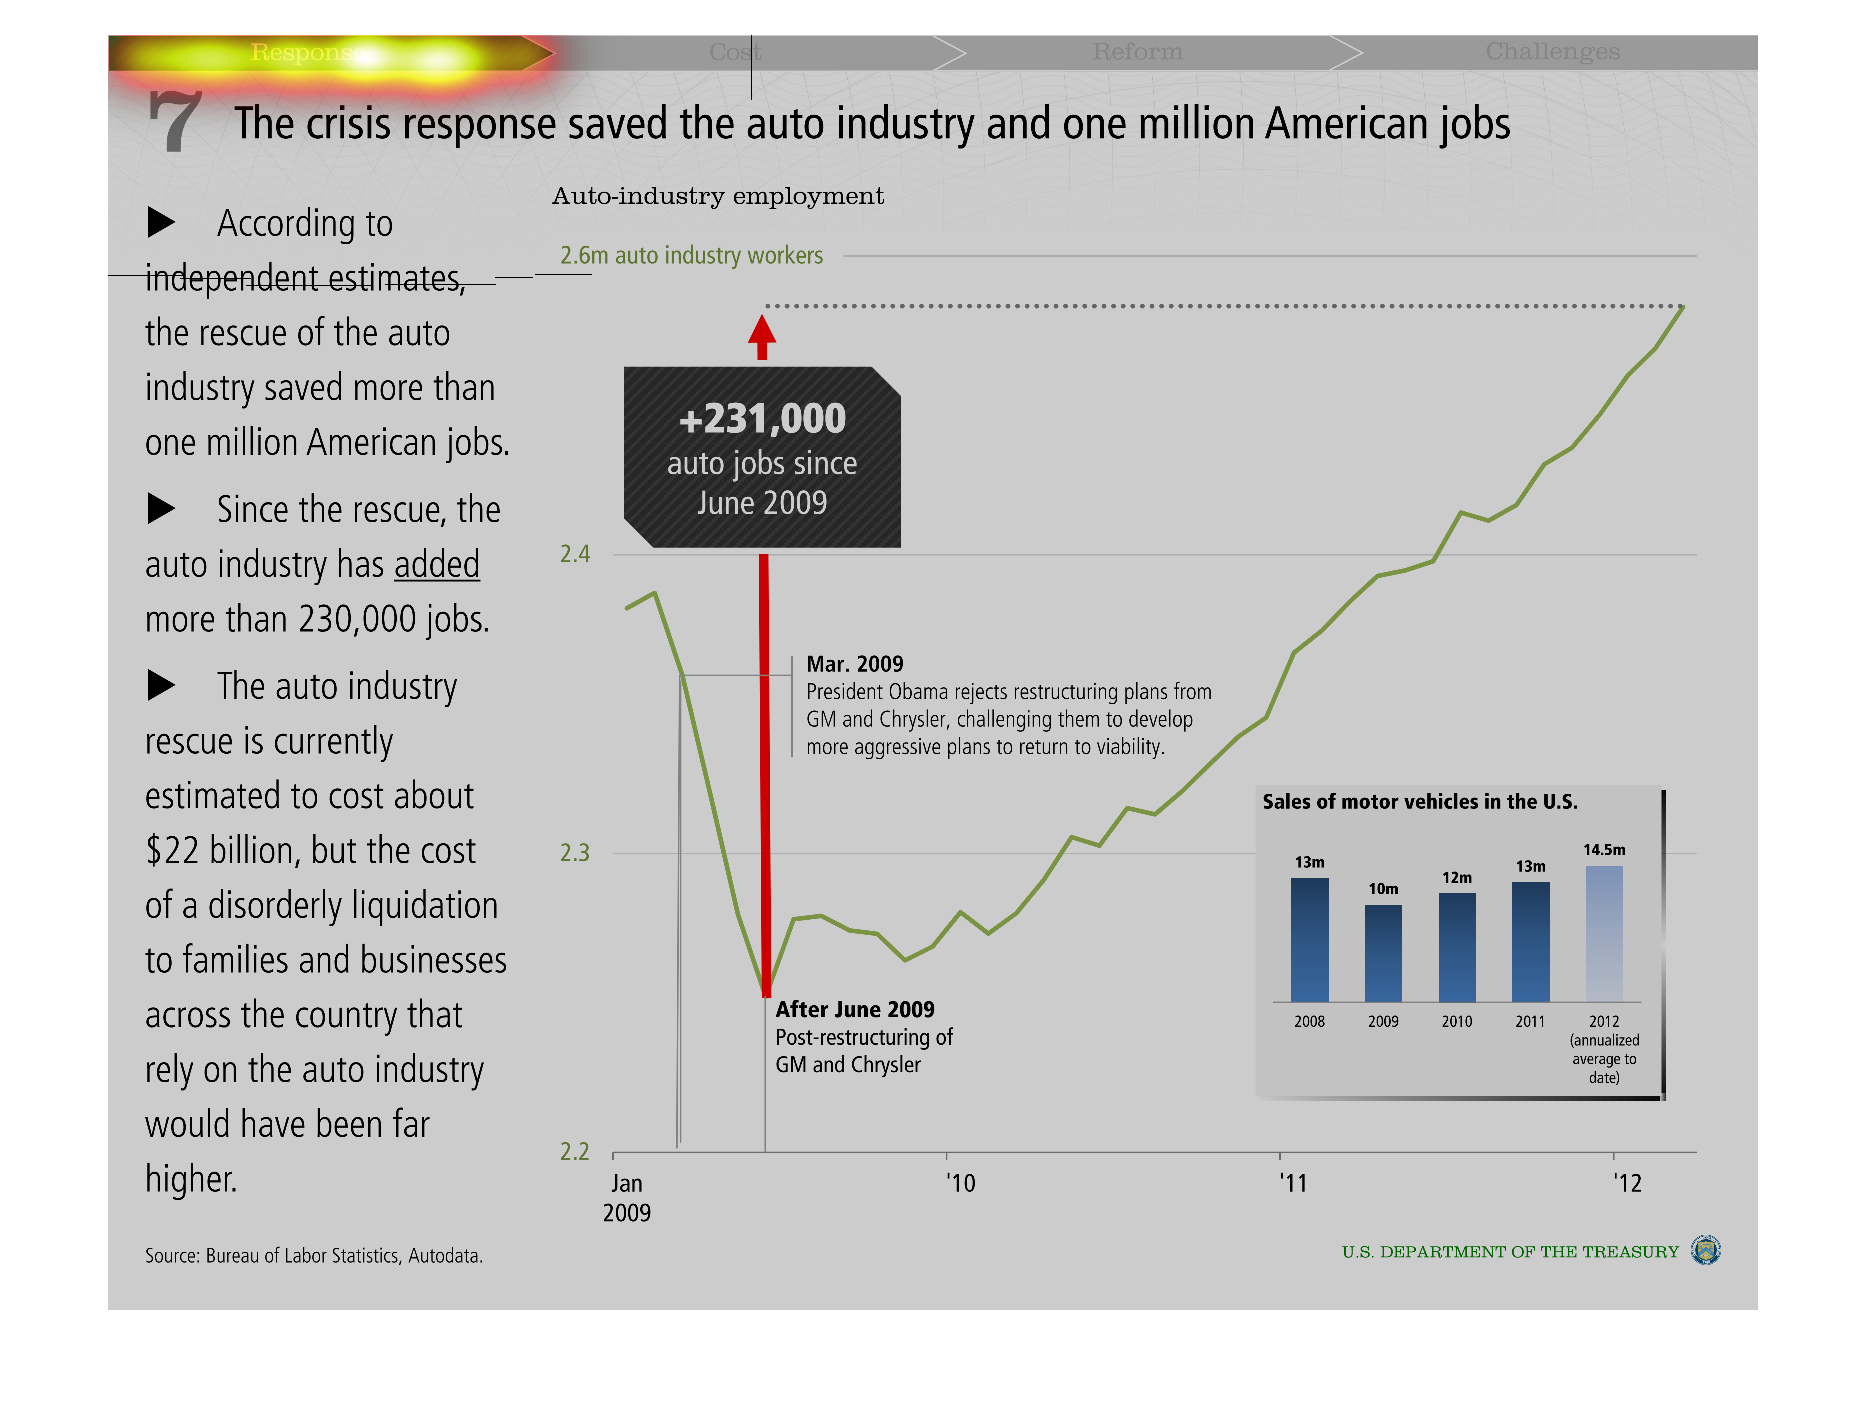
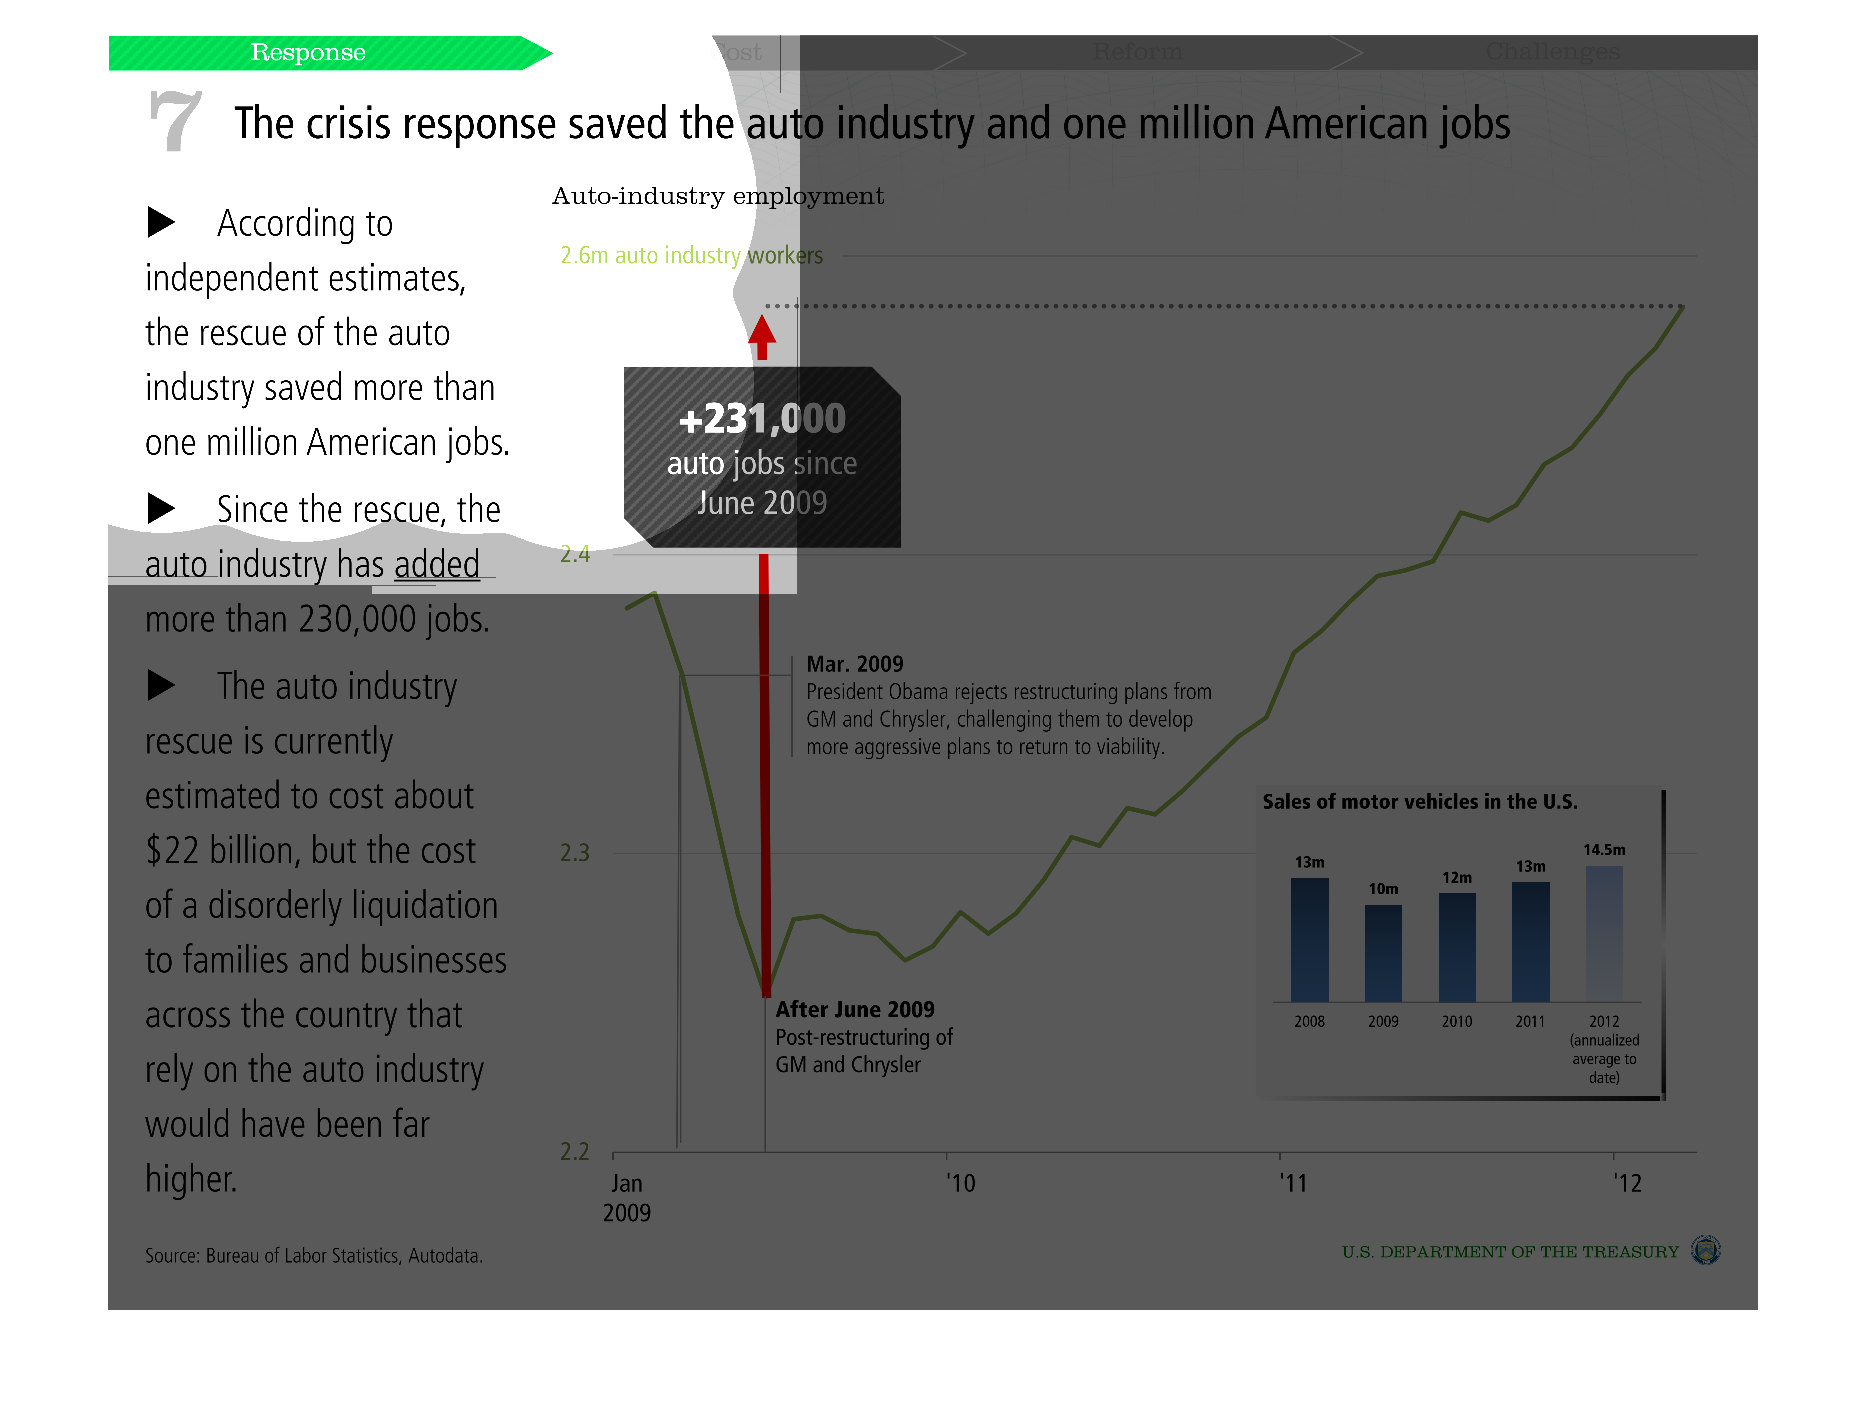
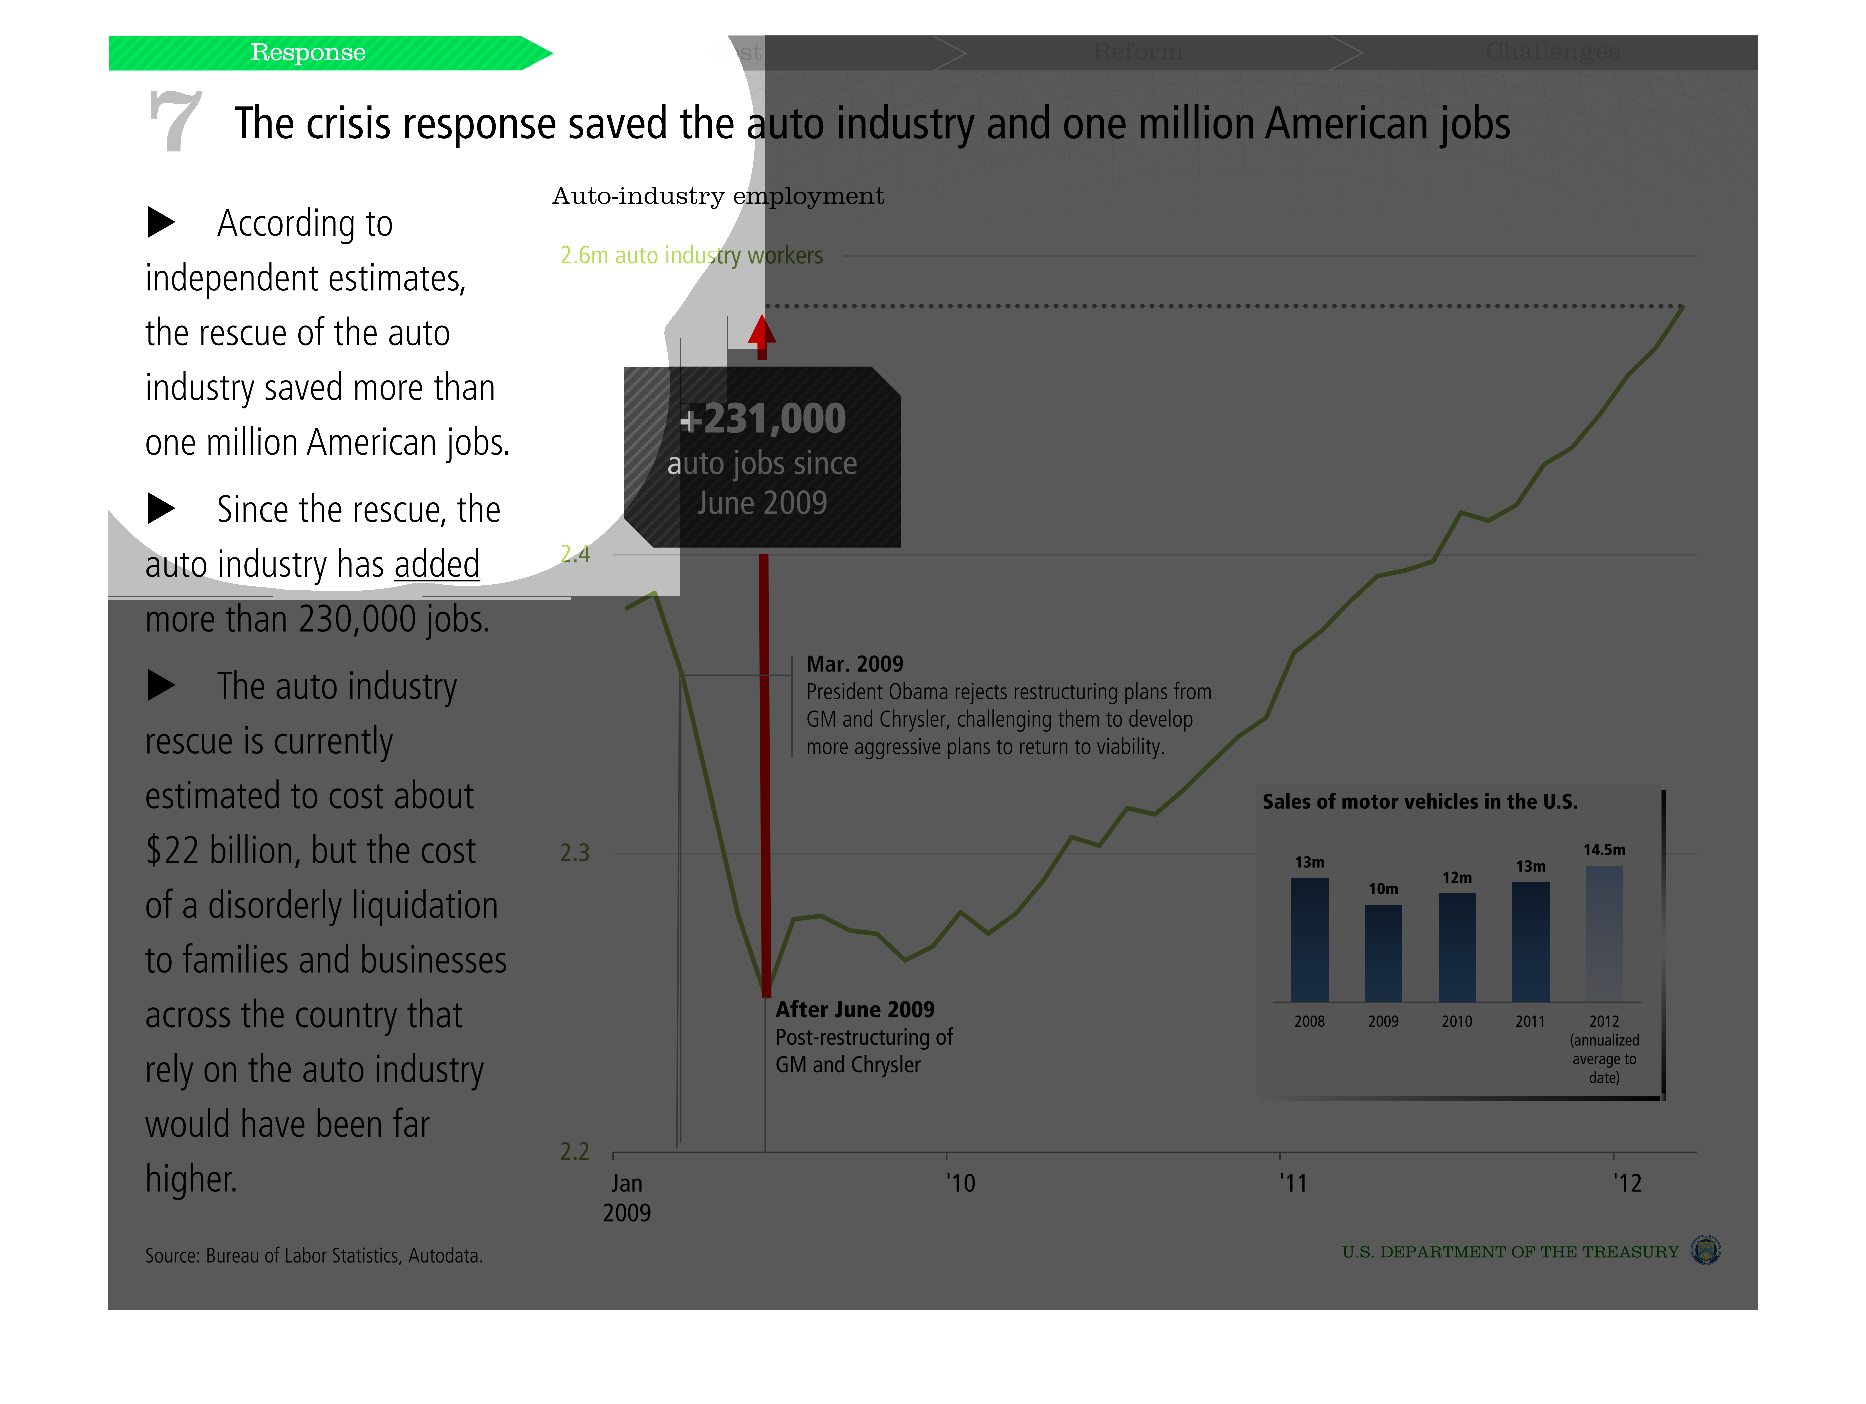
An infographic showing the crisis response to the Auto Industry financial trouble saved the
industry itself and over one million jobs directly and indirectly
Warning: Image is too big to fit on screen; displaying at 50%
Warning: Image is too big to fit on screen; displaying at 50%
This is a graph that shows how the crisis rapid response saved the auto industry from collapse
and also saved one million American jobs from being  lost.
Warning: Image is too big to fit on screen; displaying at 50%
Warning: Image is too big to fit on screen; displaying at 50%
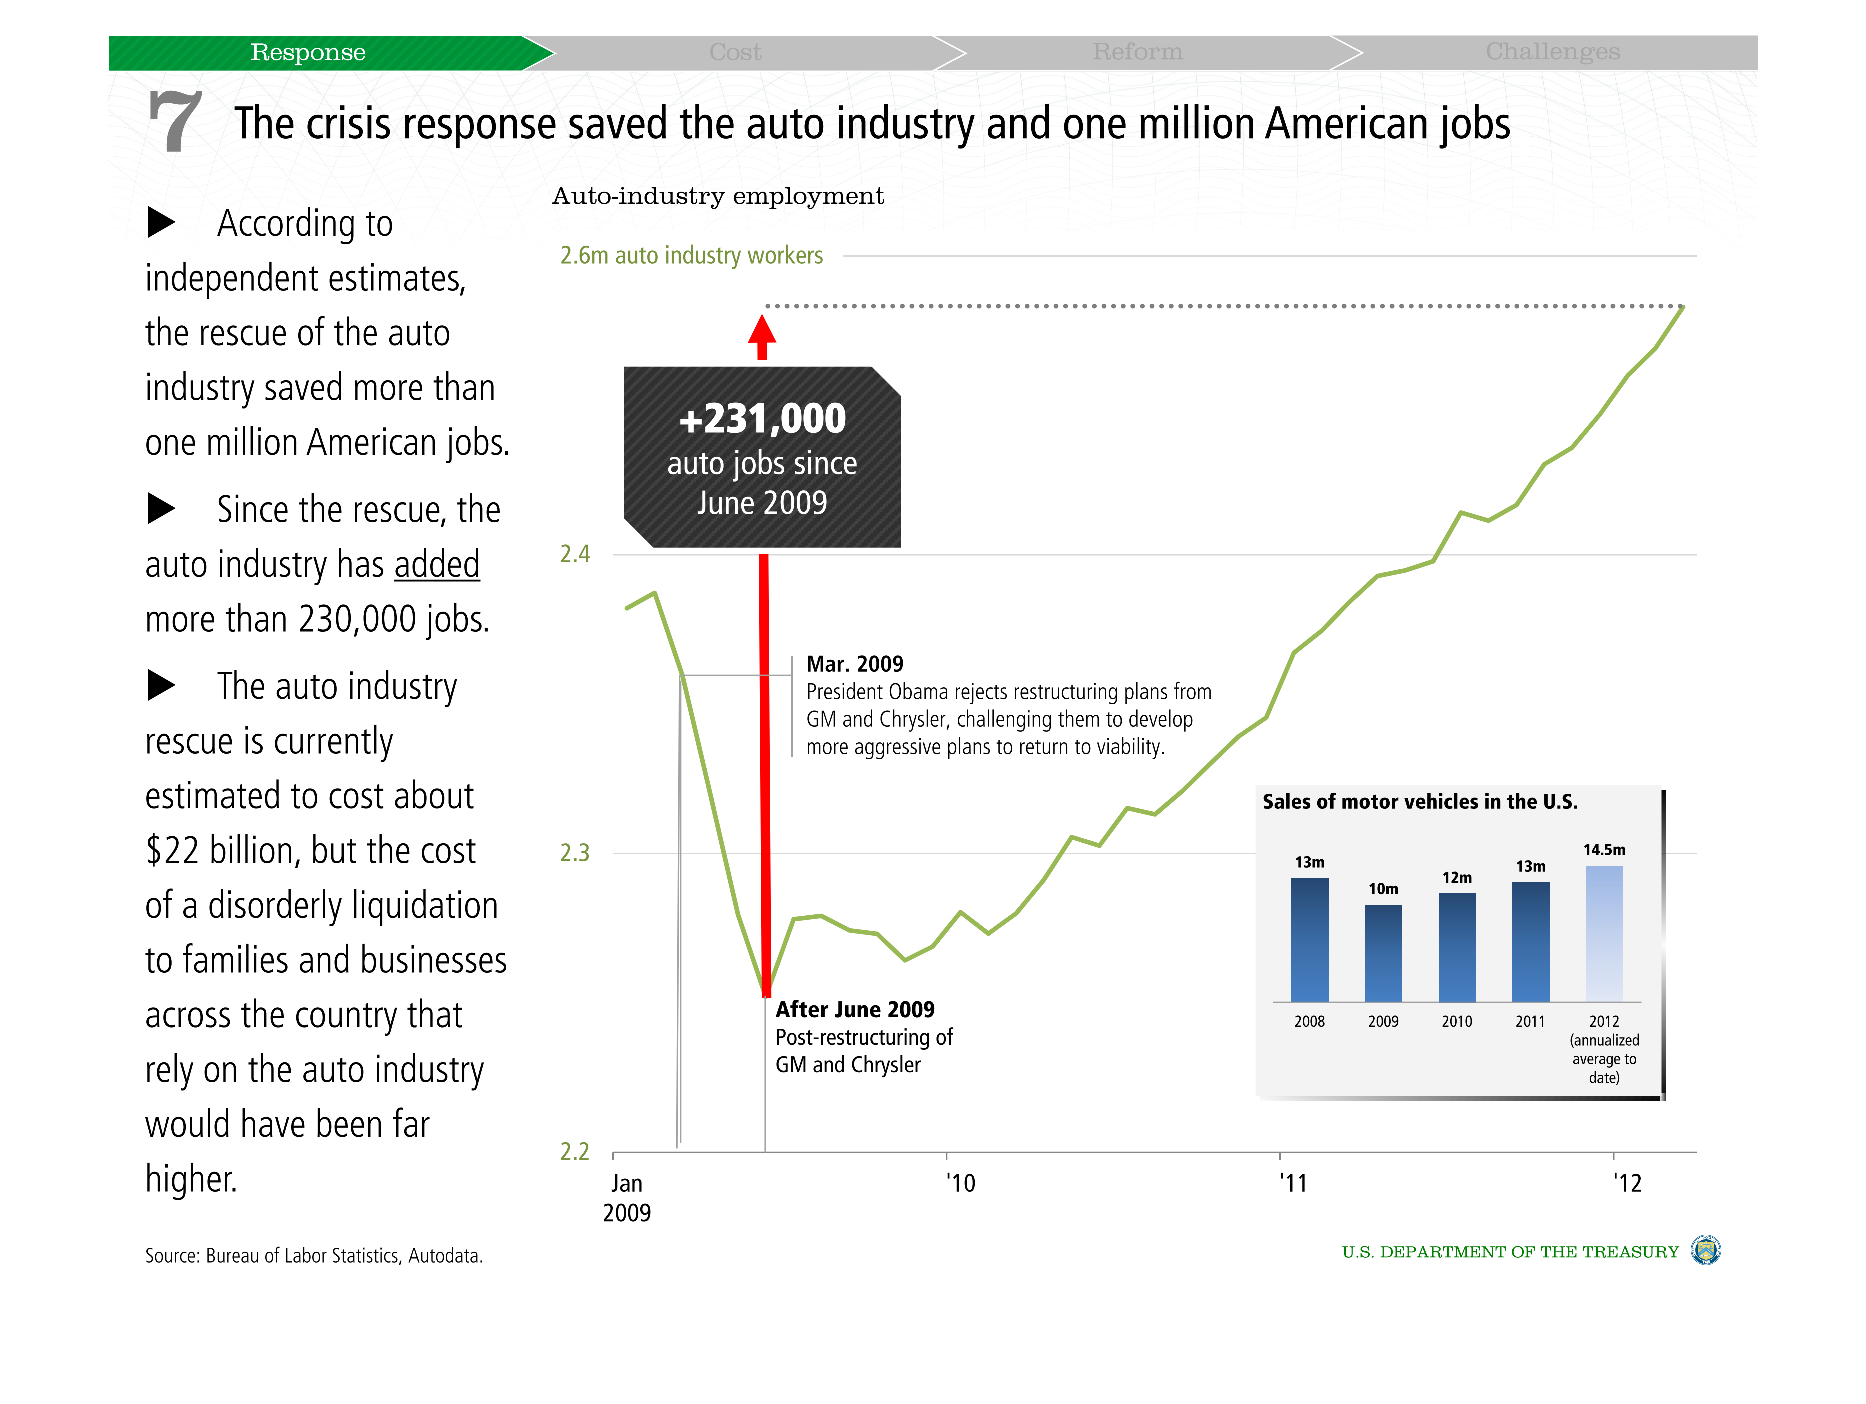
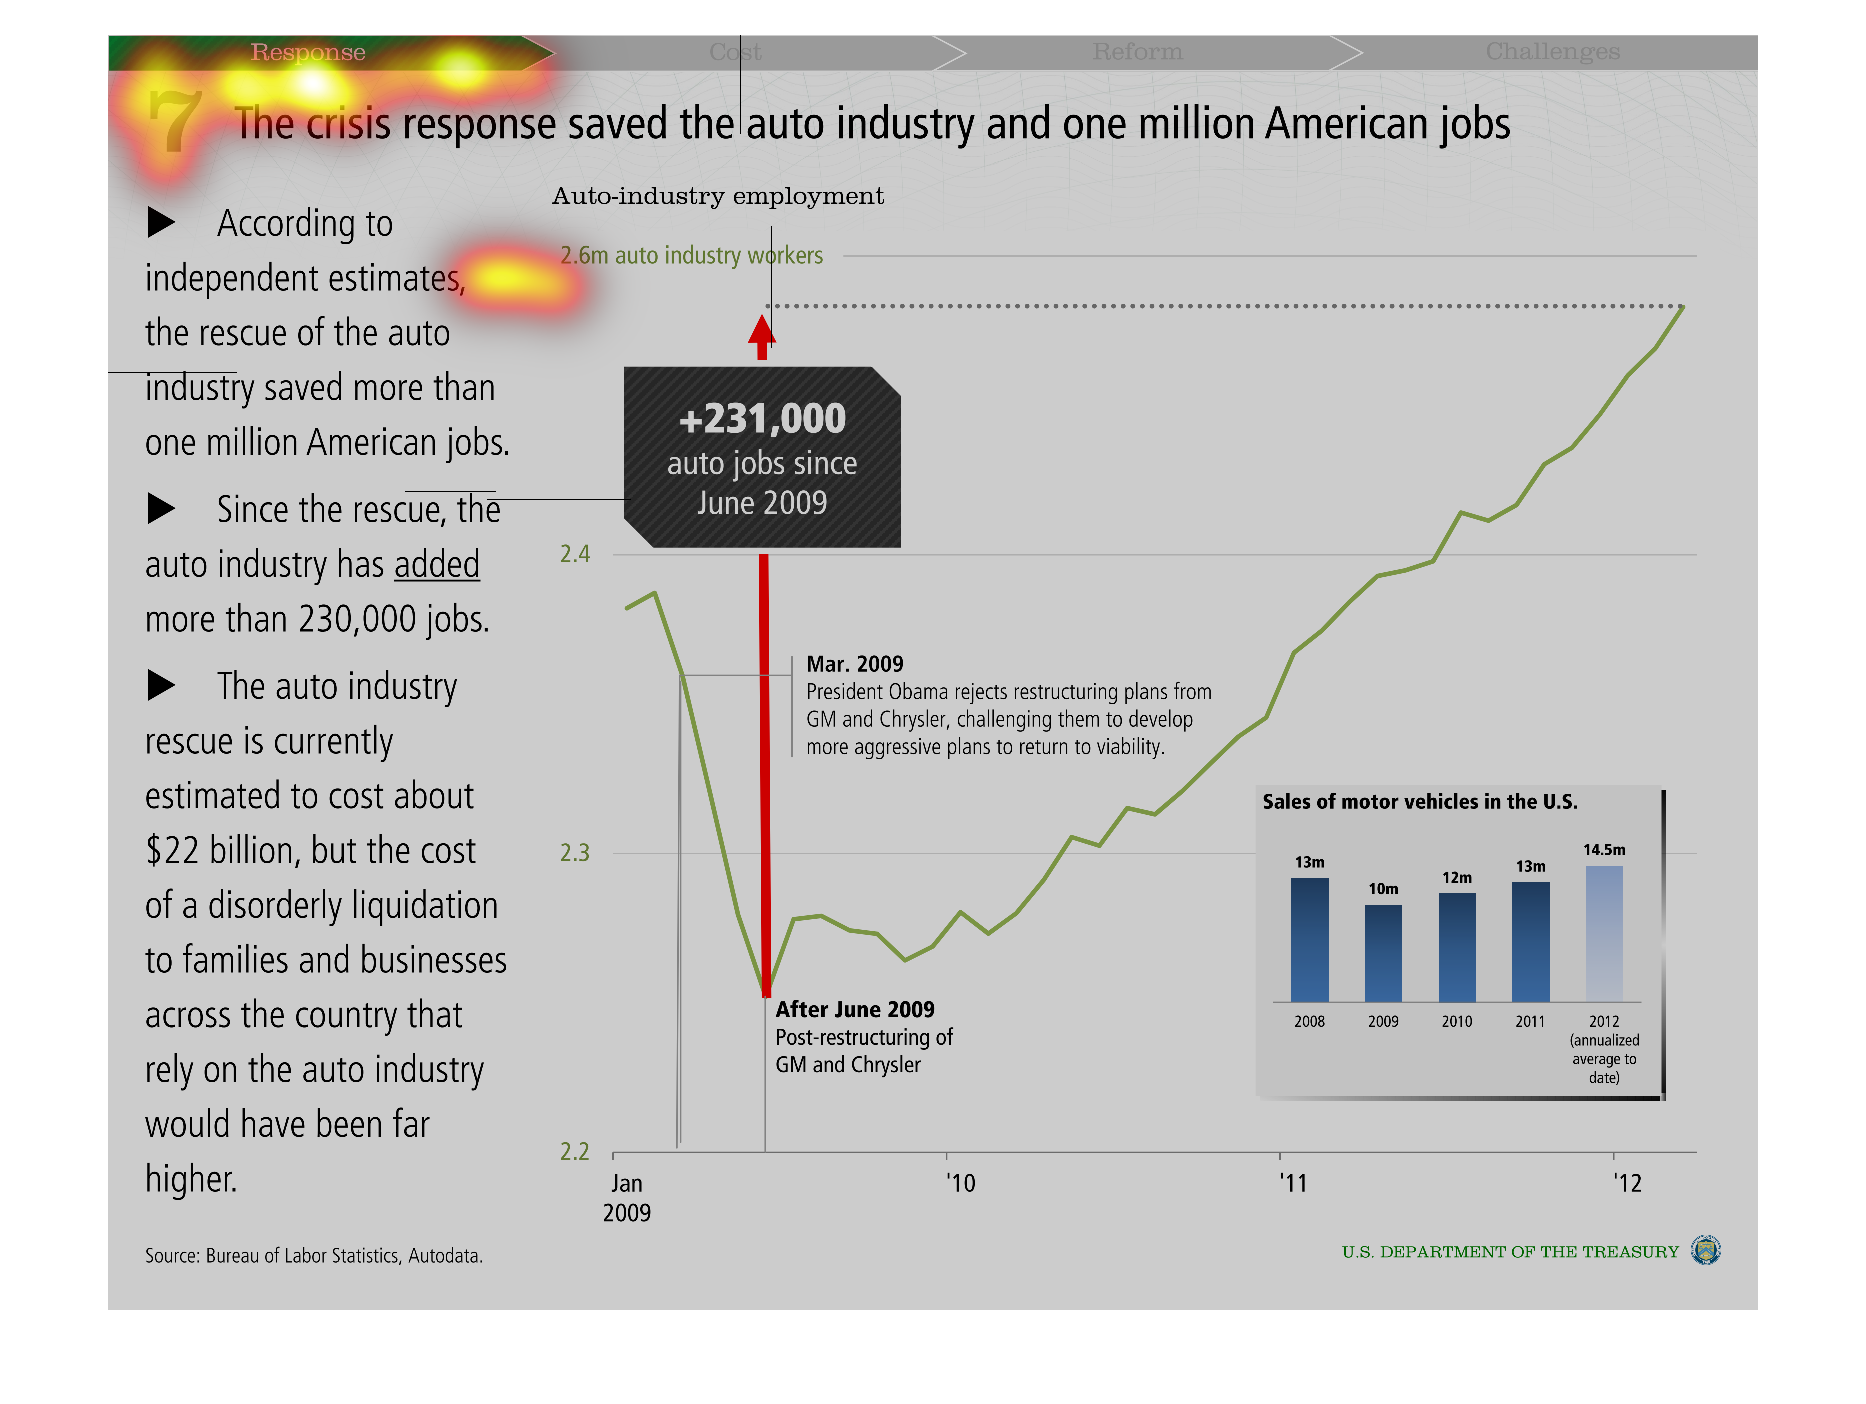
This image is talking about the rise in auto industry jobs after a crisis in 2009. They've
added a million jobs in three years to the American auto industry, and there is an upward
trend.
Warning: Image is too big to fit on screen; displaying at 50%
Warning: Image is too big to fit on screen; displaying at 50%
This chart describes how the crisis response saved the auto industry and one million American
jobs. It states that according to independent estimates, the rescue saved a million jobs.
Warning: Image is too big to fit on screen; displaying at 50%
Warning: Image is too big to fit on screen; displaying at 50%
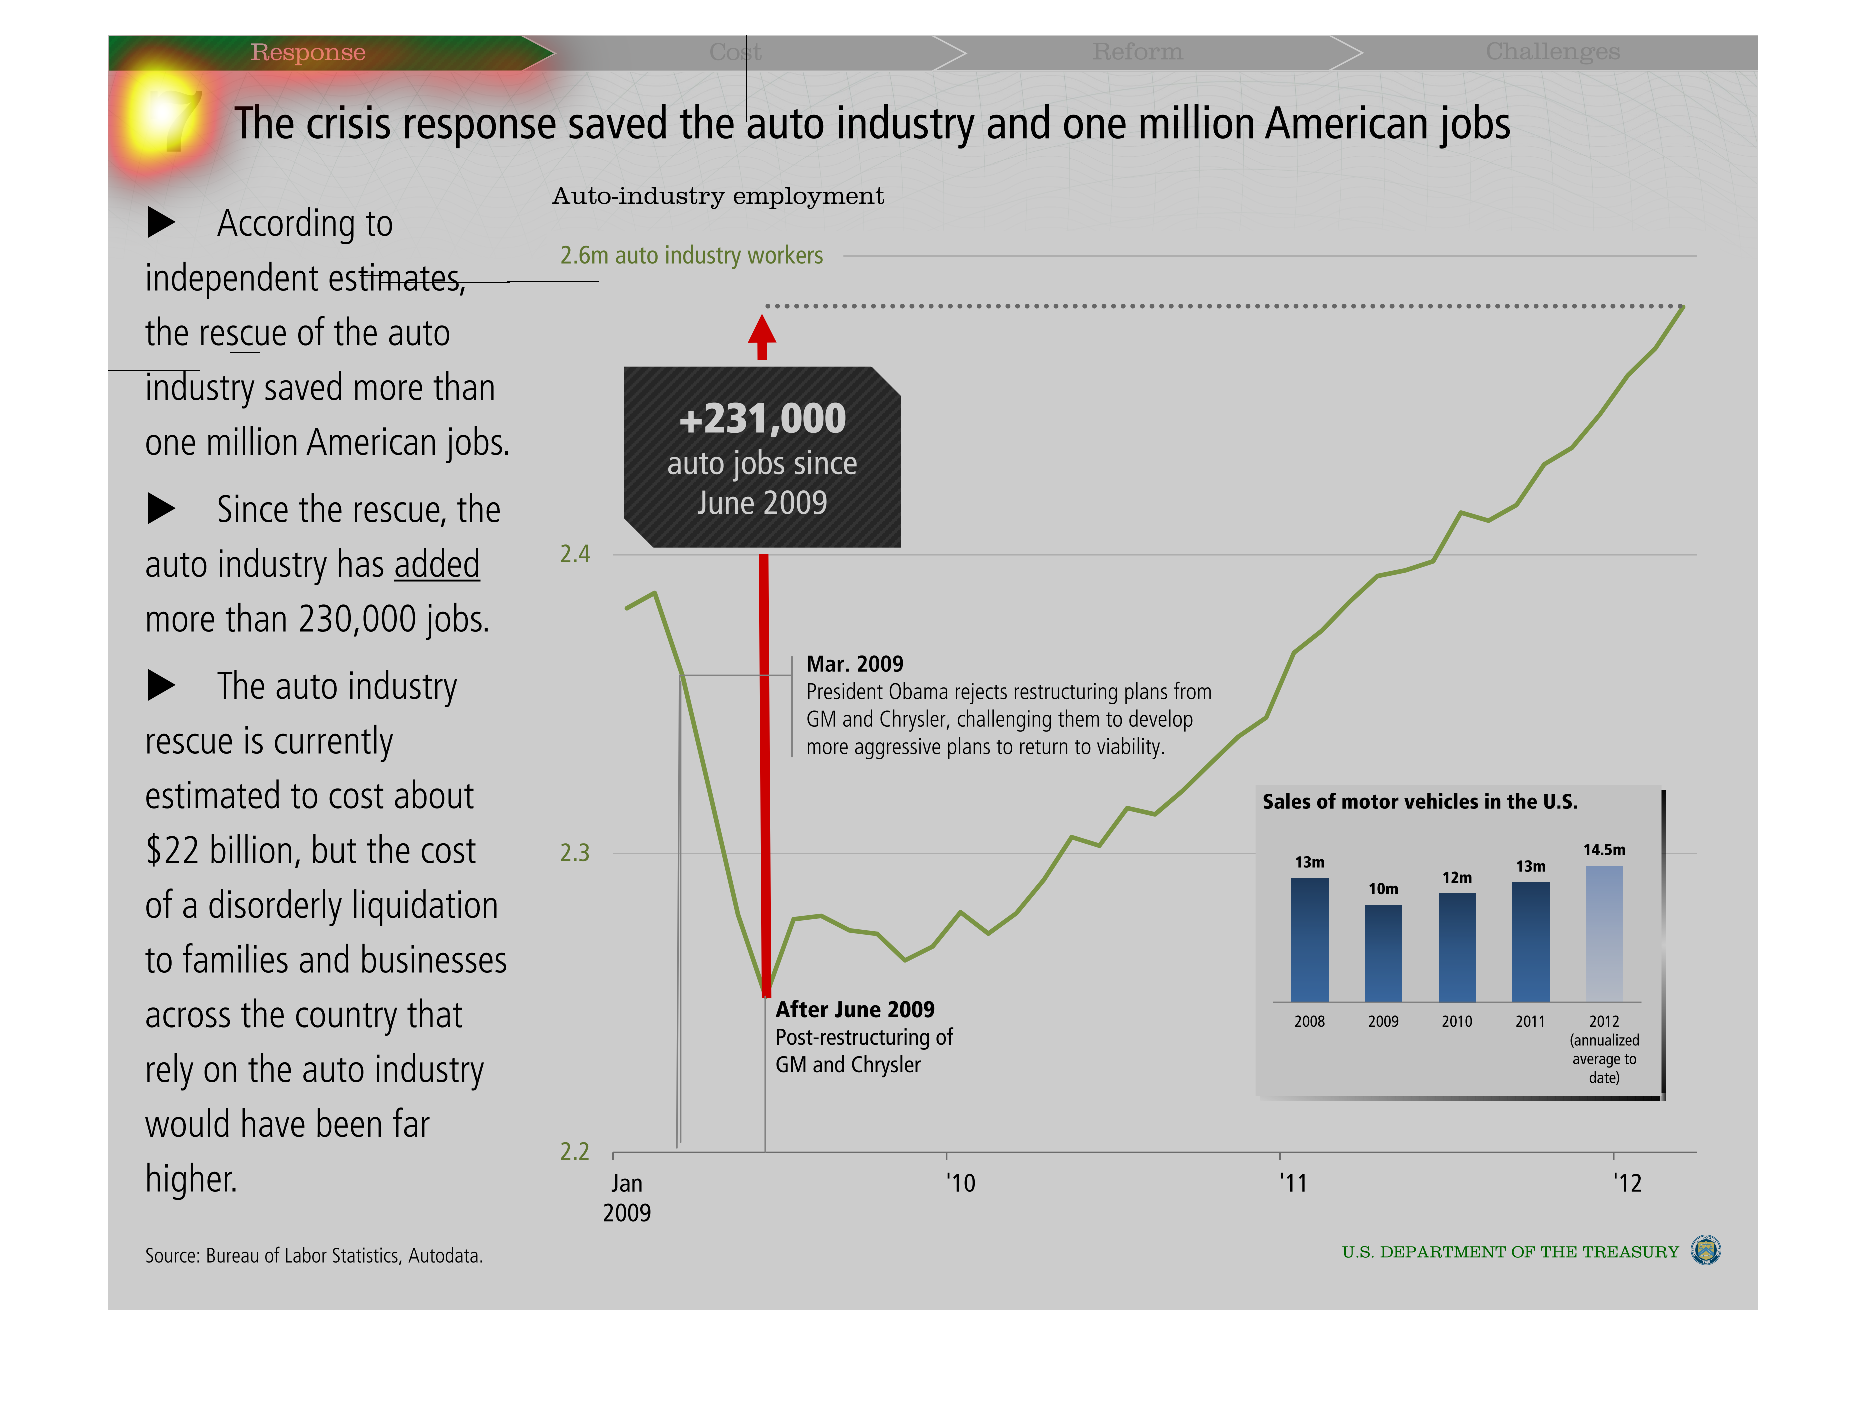
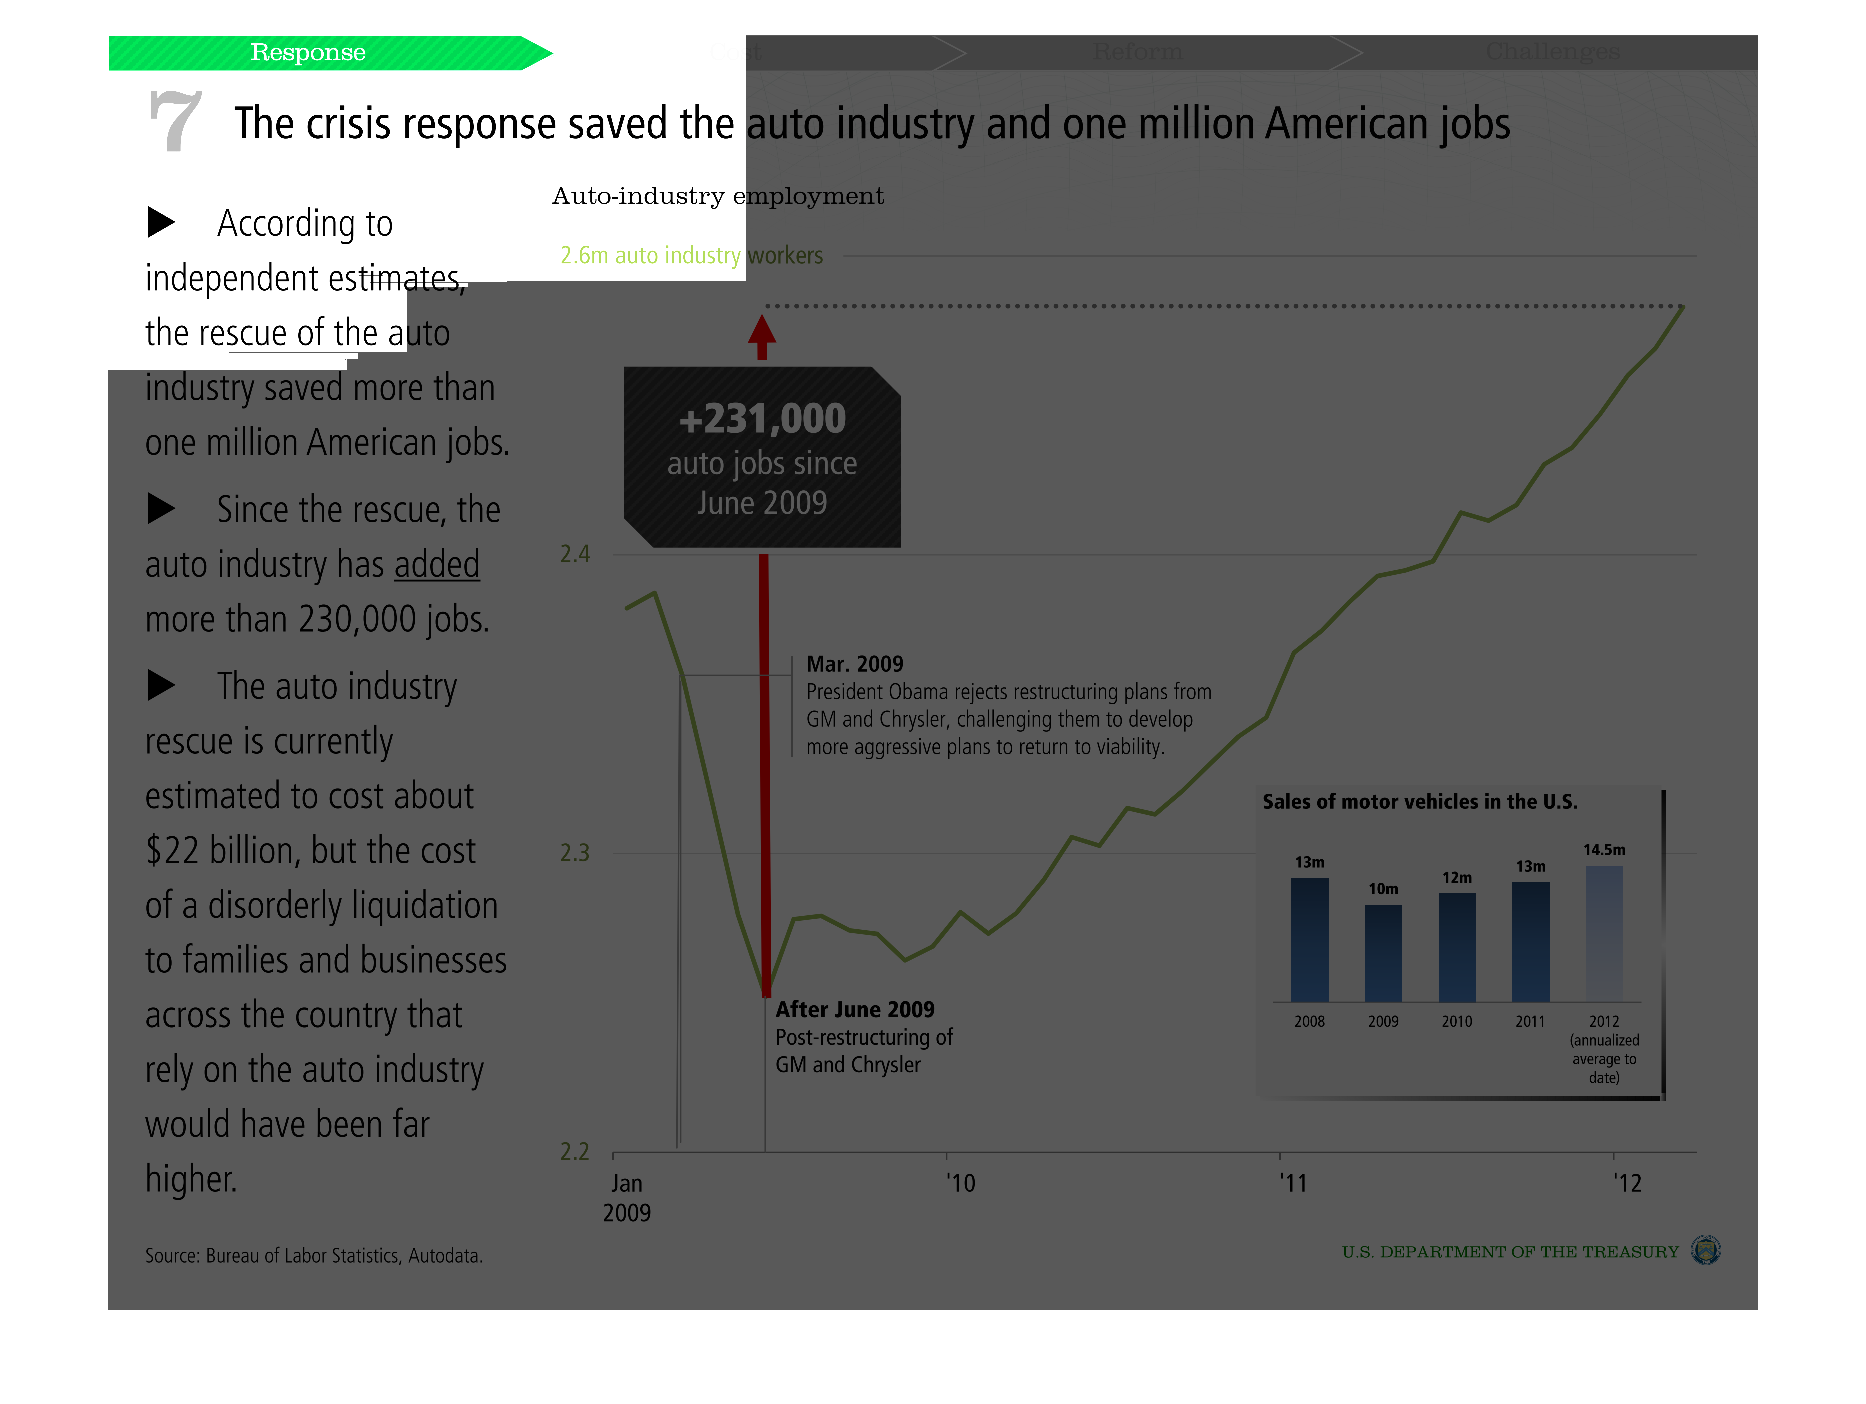
Chart showing the crisis response that saved one million jobs in the auto industry. The chart
shows how the federal bailout of the auto industry and it also shows auto sales.
Warning: Image is too big to fit on screen; displaying at 50%
Warning: Image is too big to fit on screen; displaying at 50%
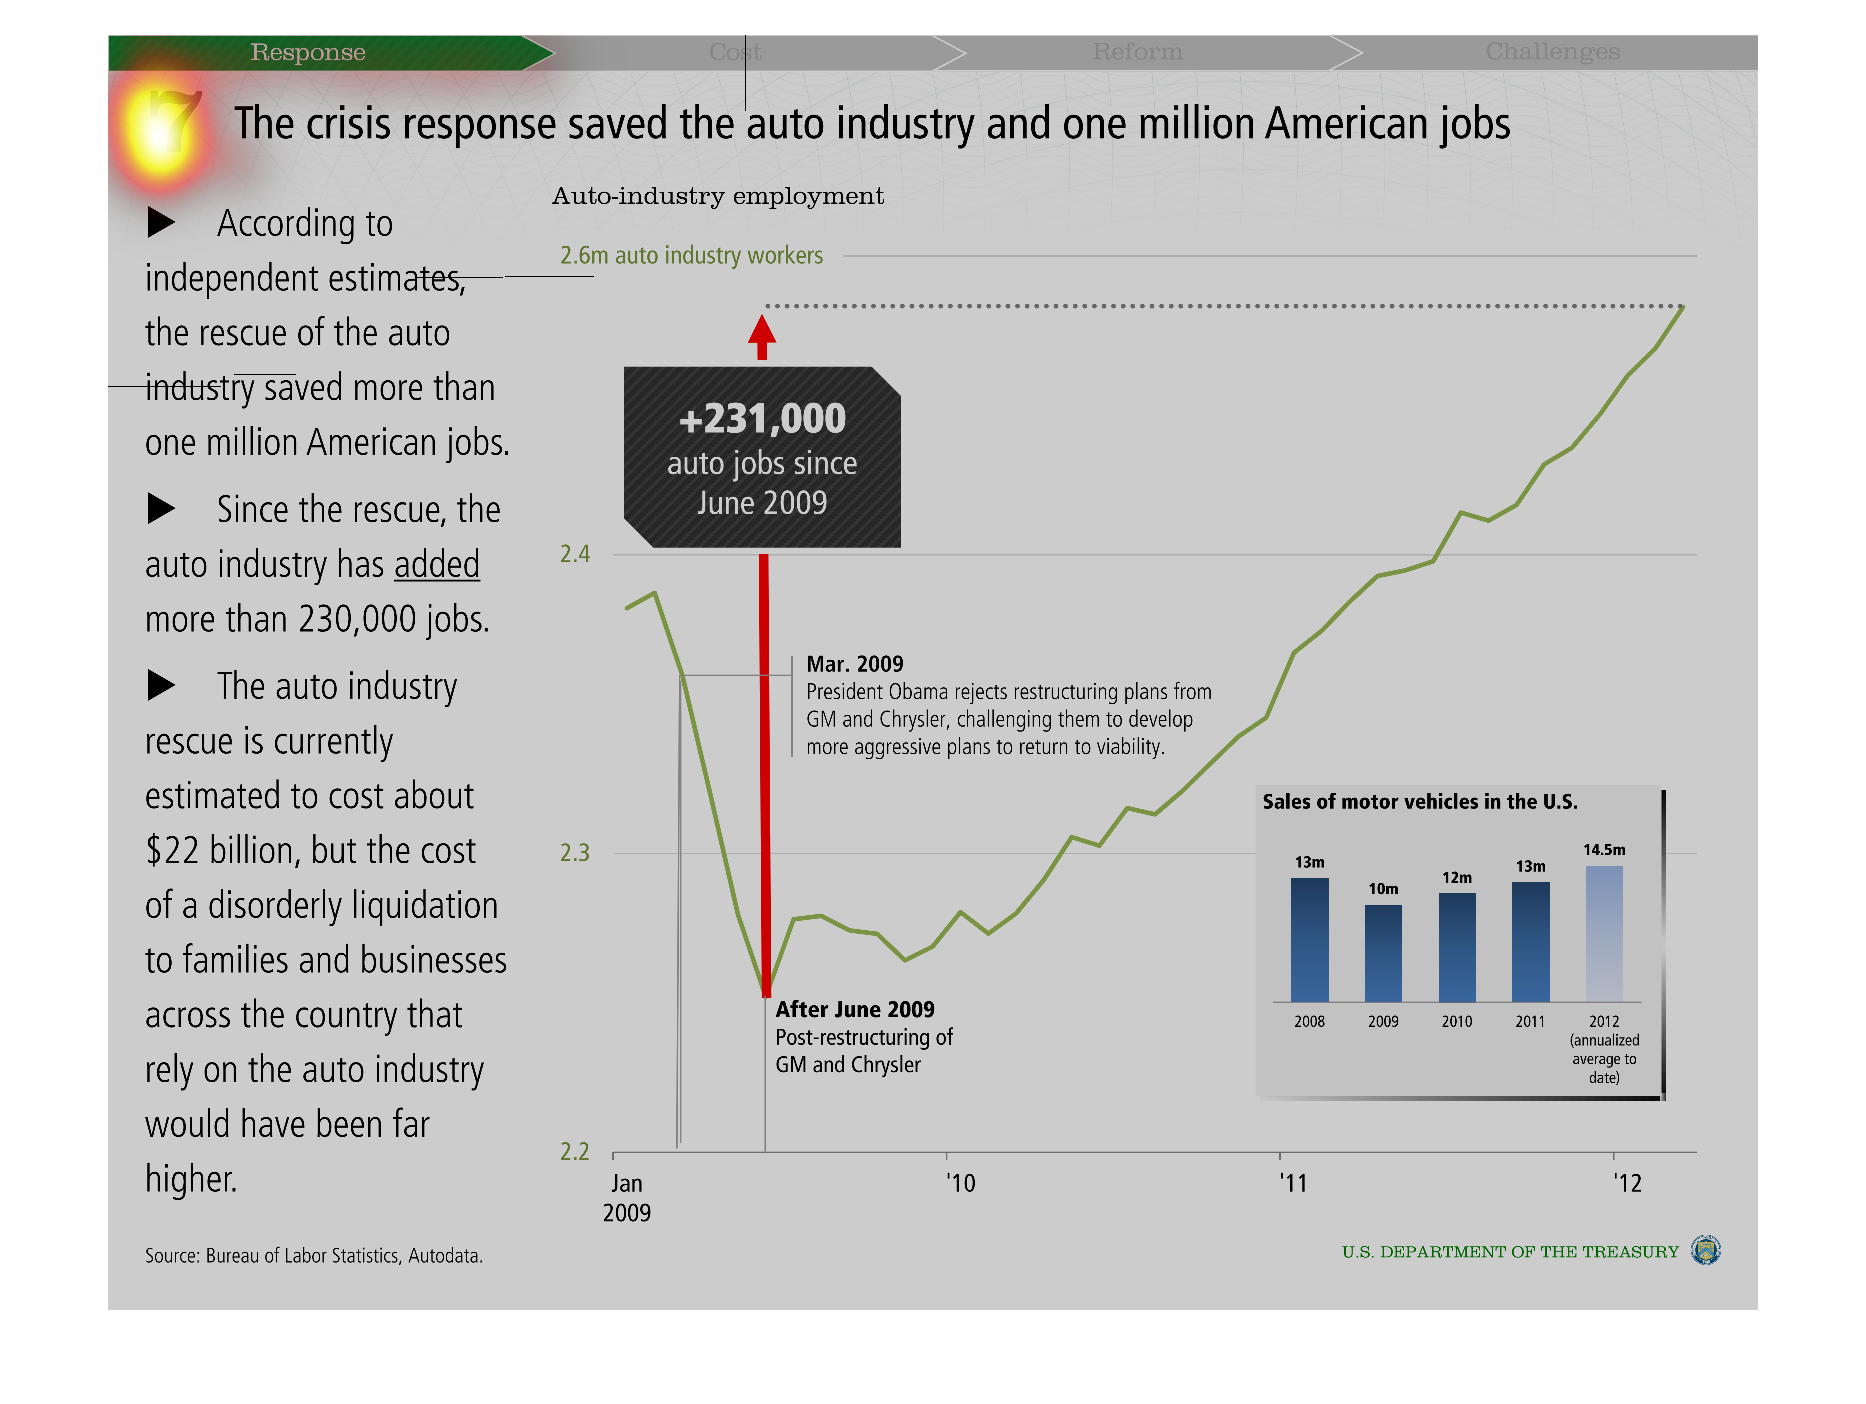
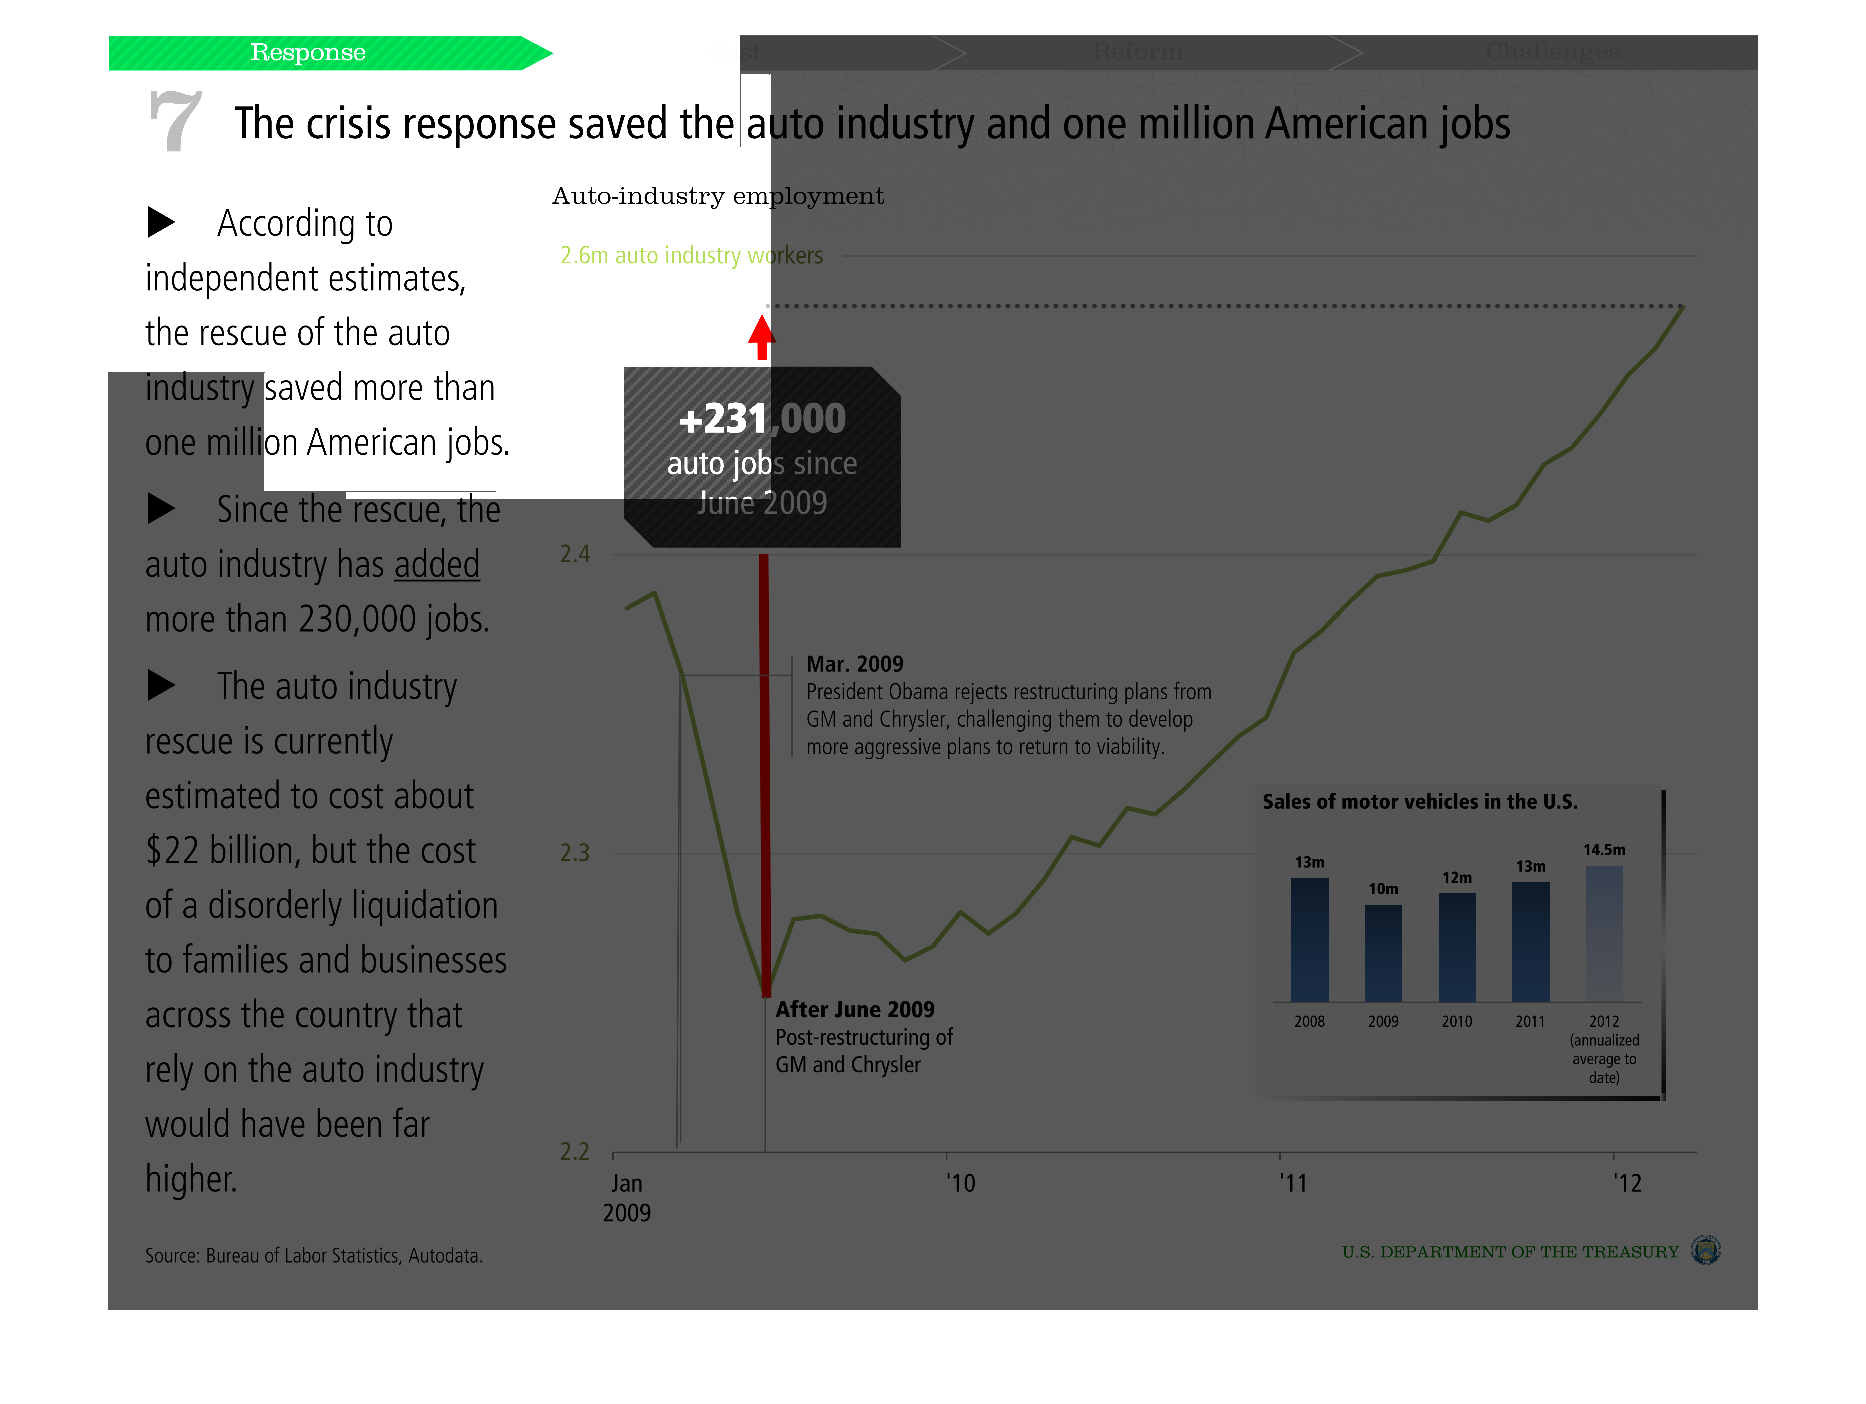
This chart clearly displays how the crisis response saved the auto industry and one million
American jobs. The chart shows that 231,000 auto jobs have been created since June 2009
Warning: Image is too big to fit on screen; displaying at 50%
Warning: Image is too big to fit on screen; displaying at 50%
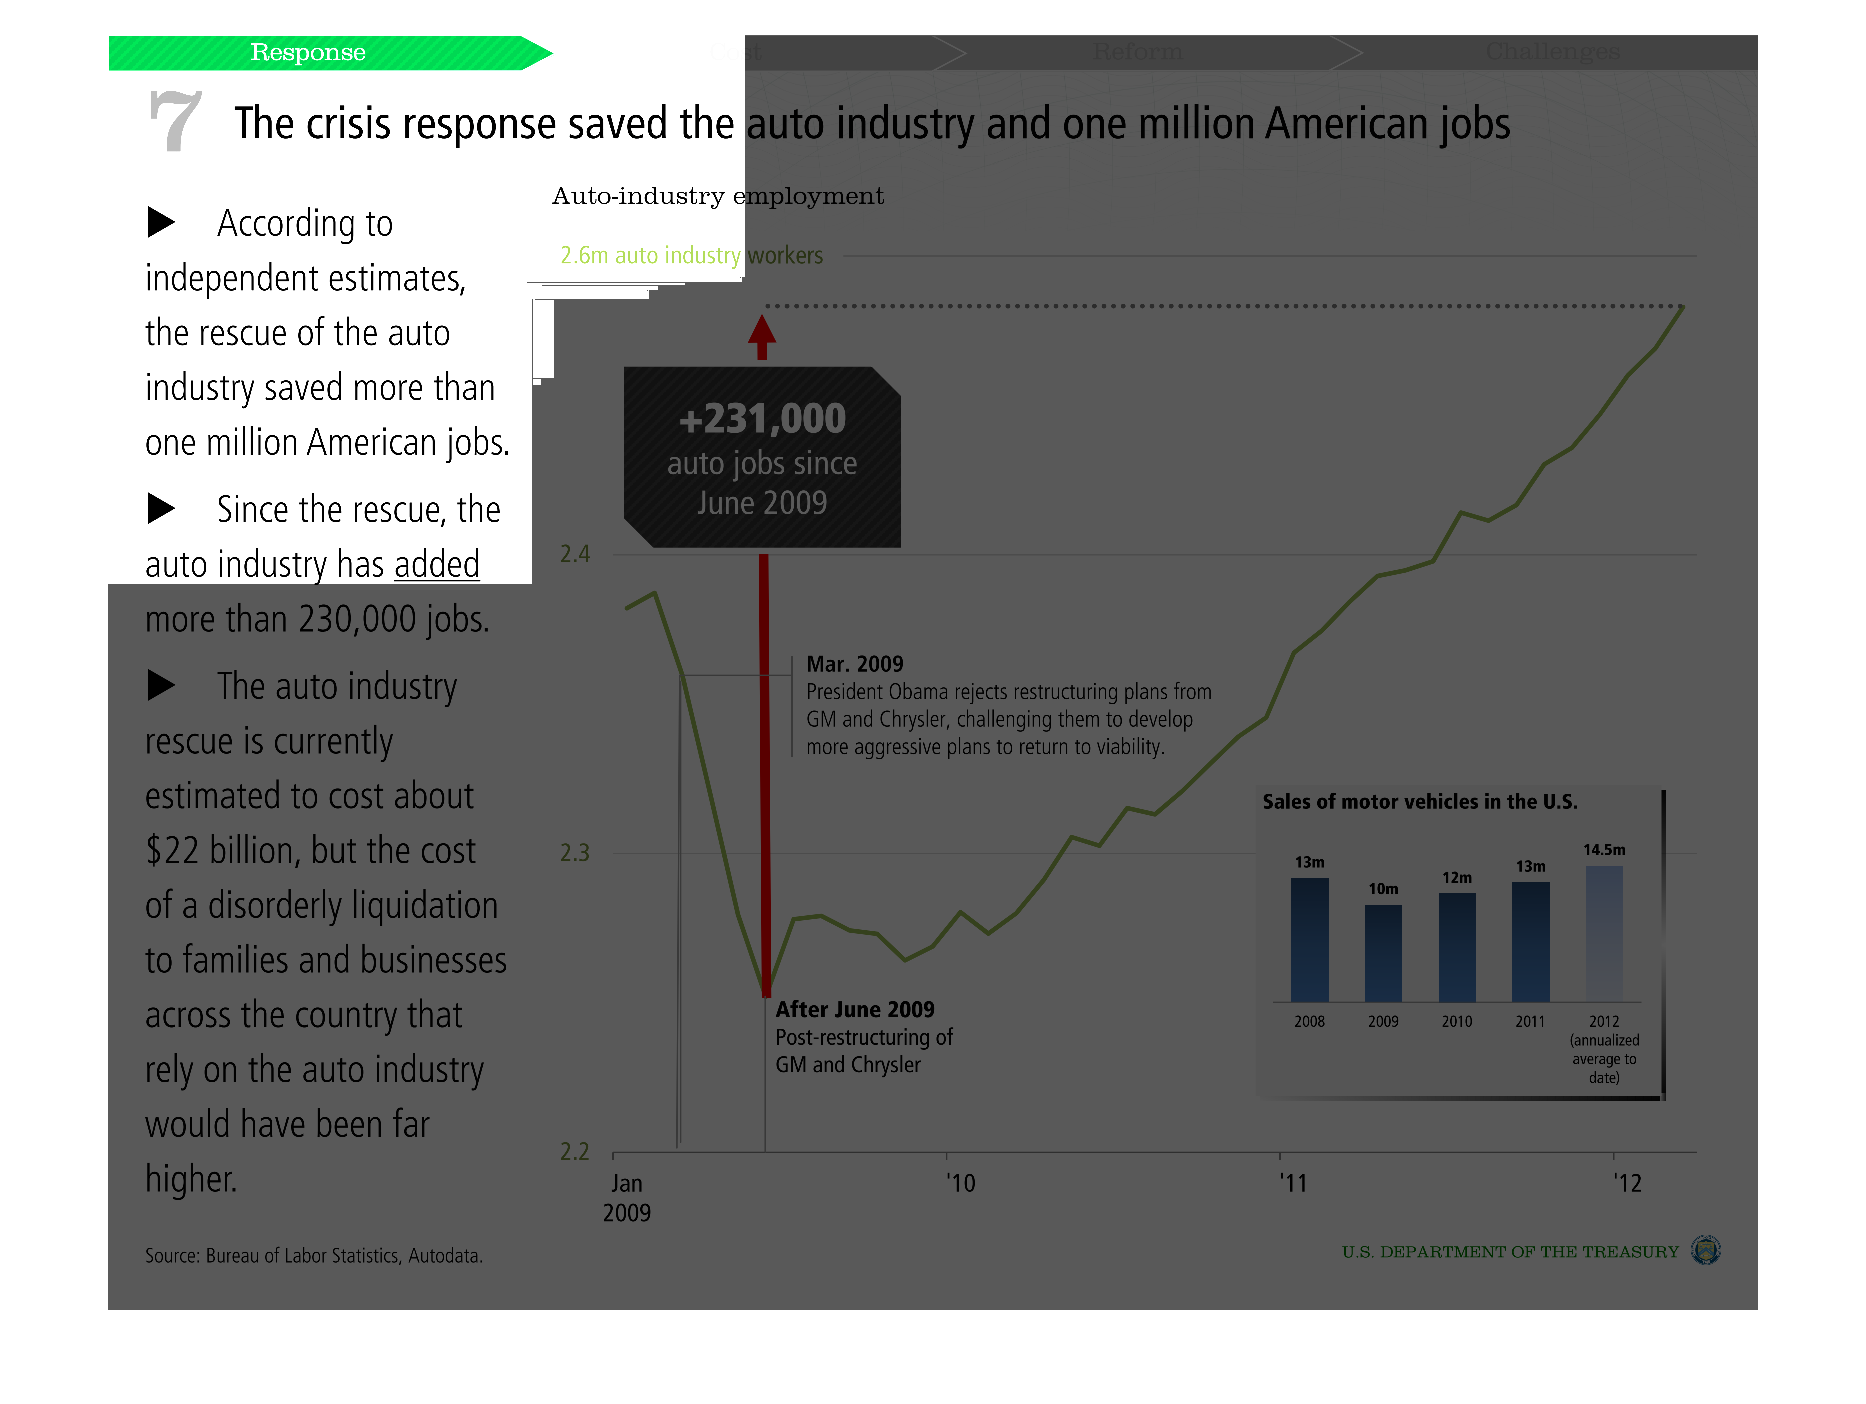
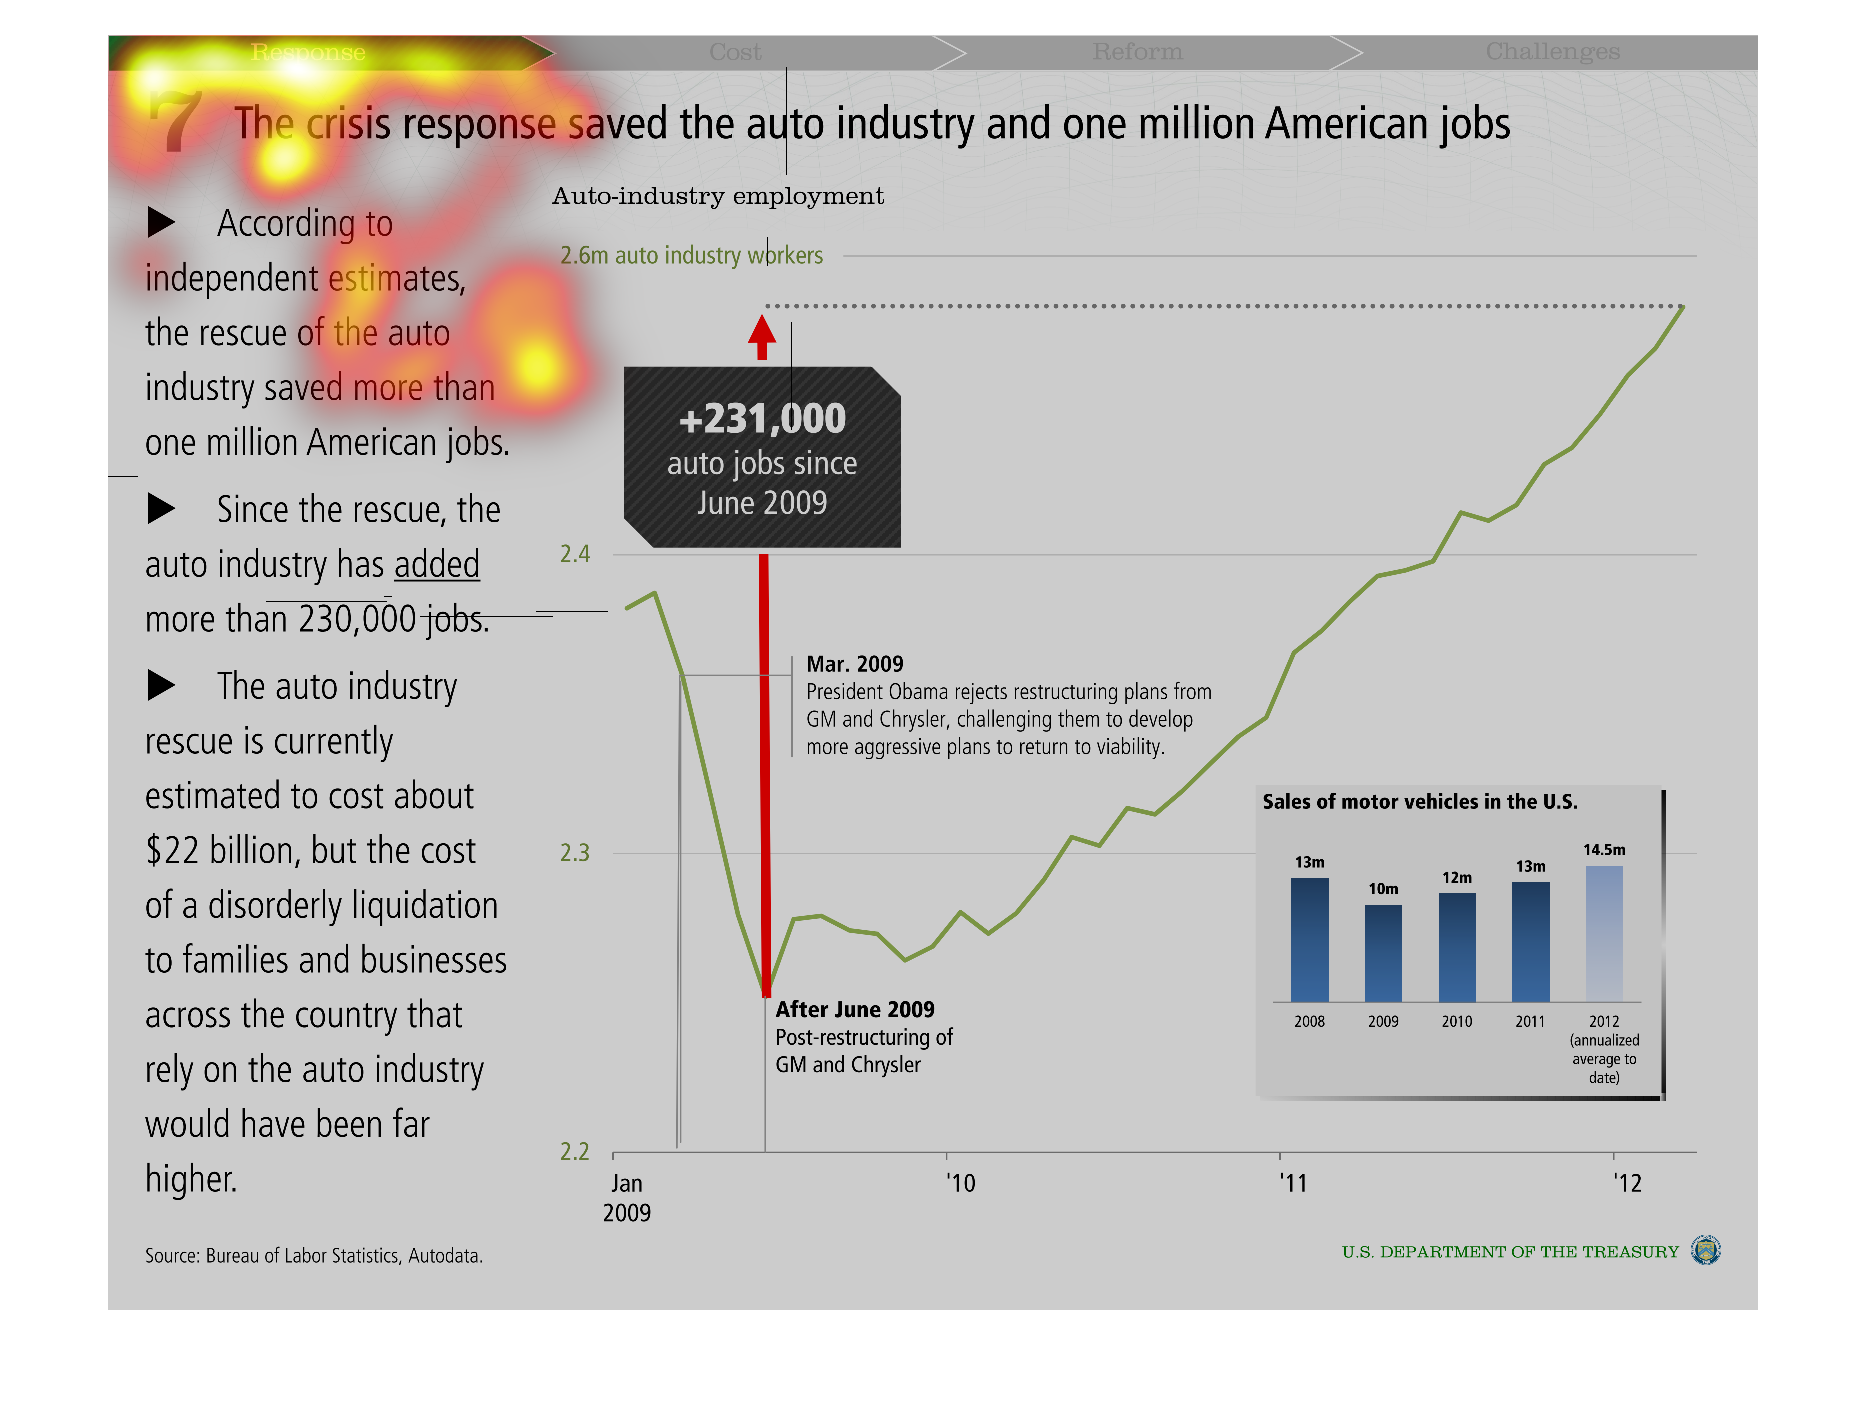
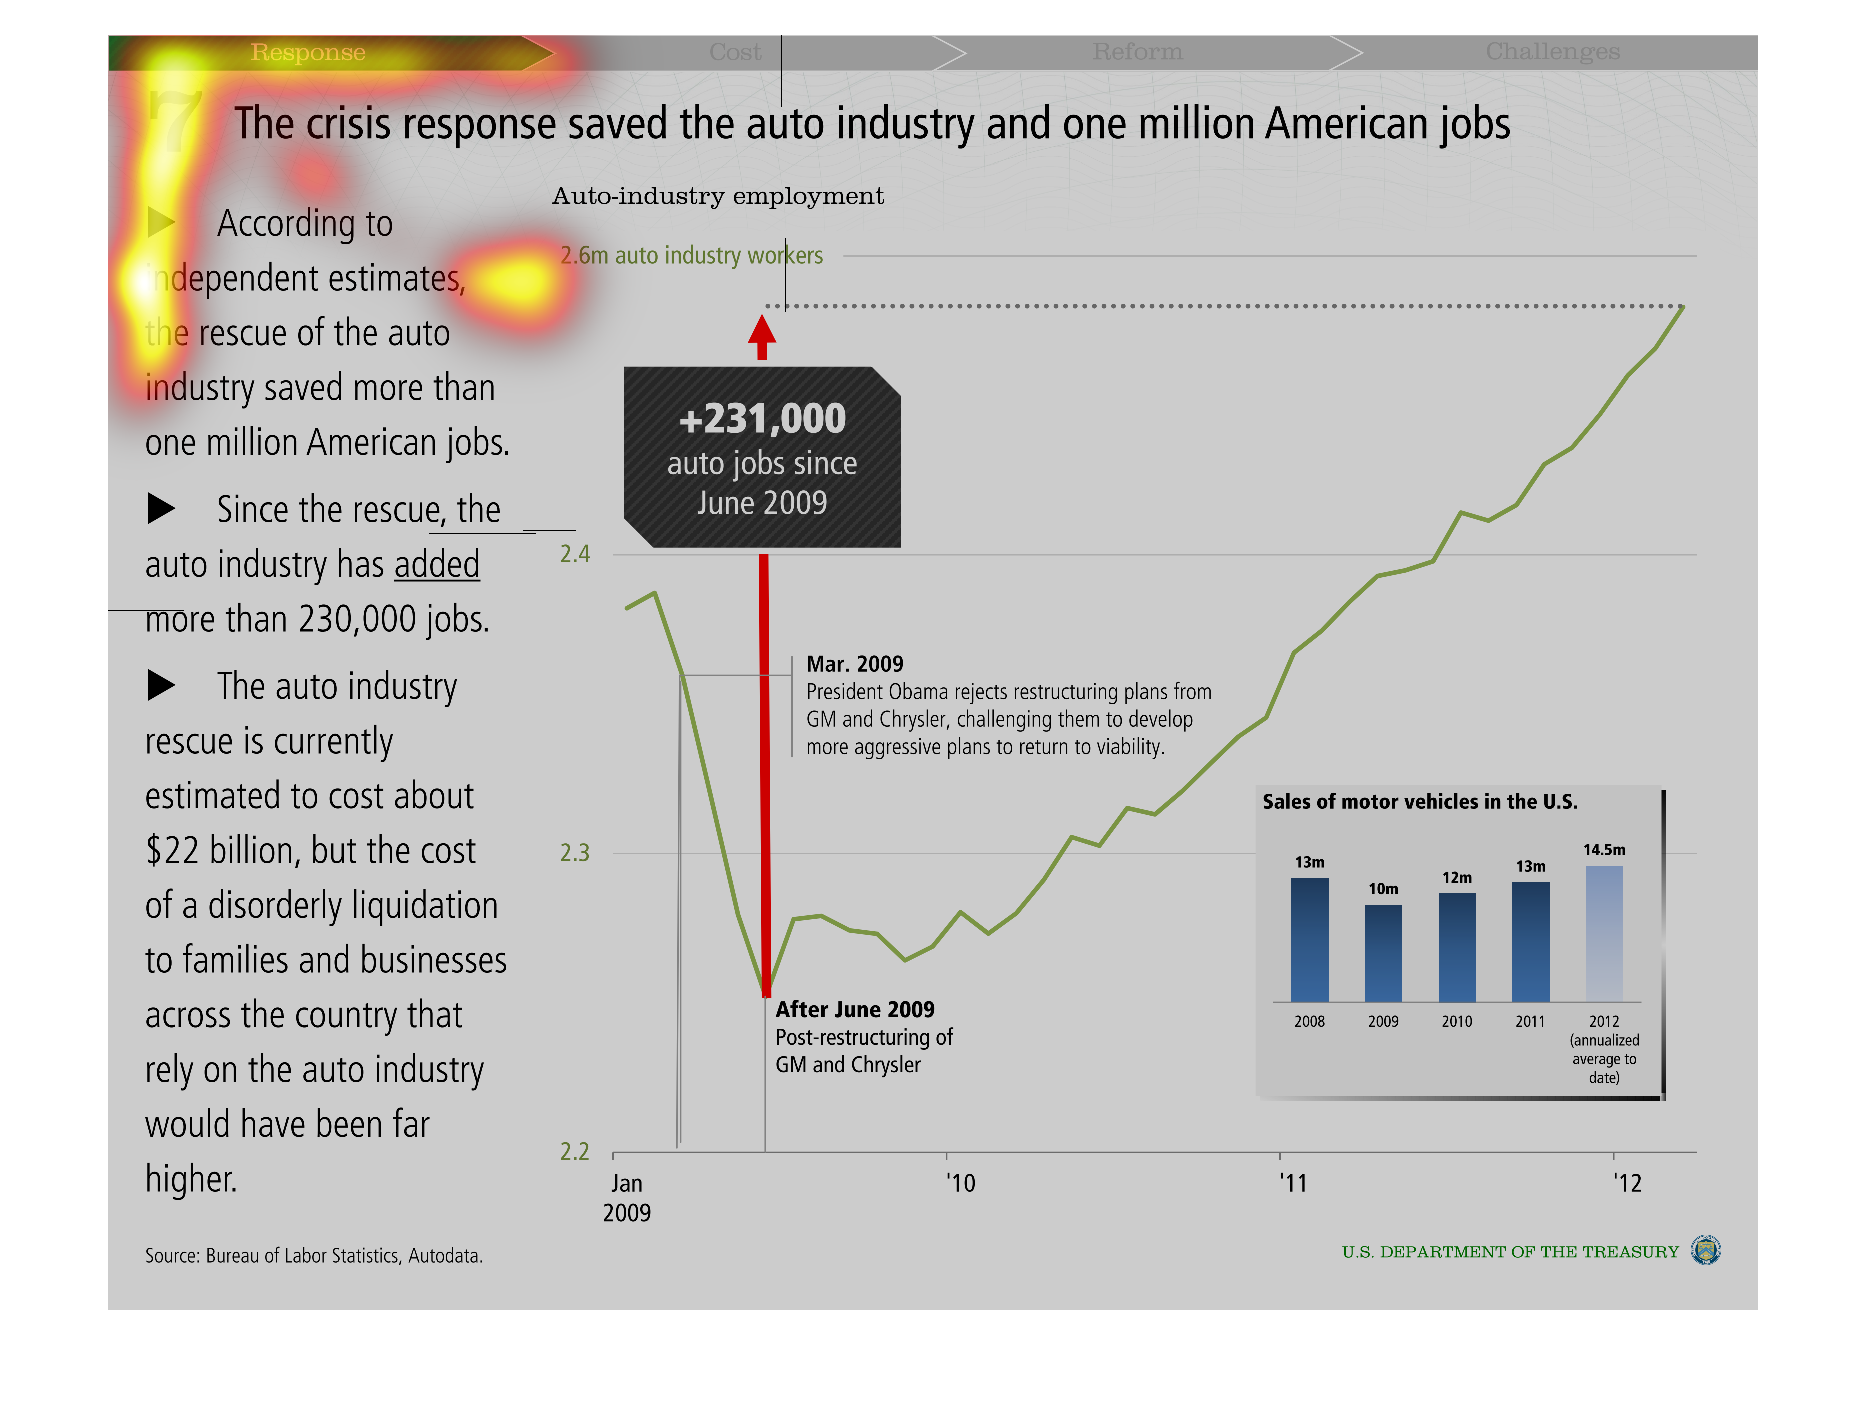
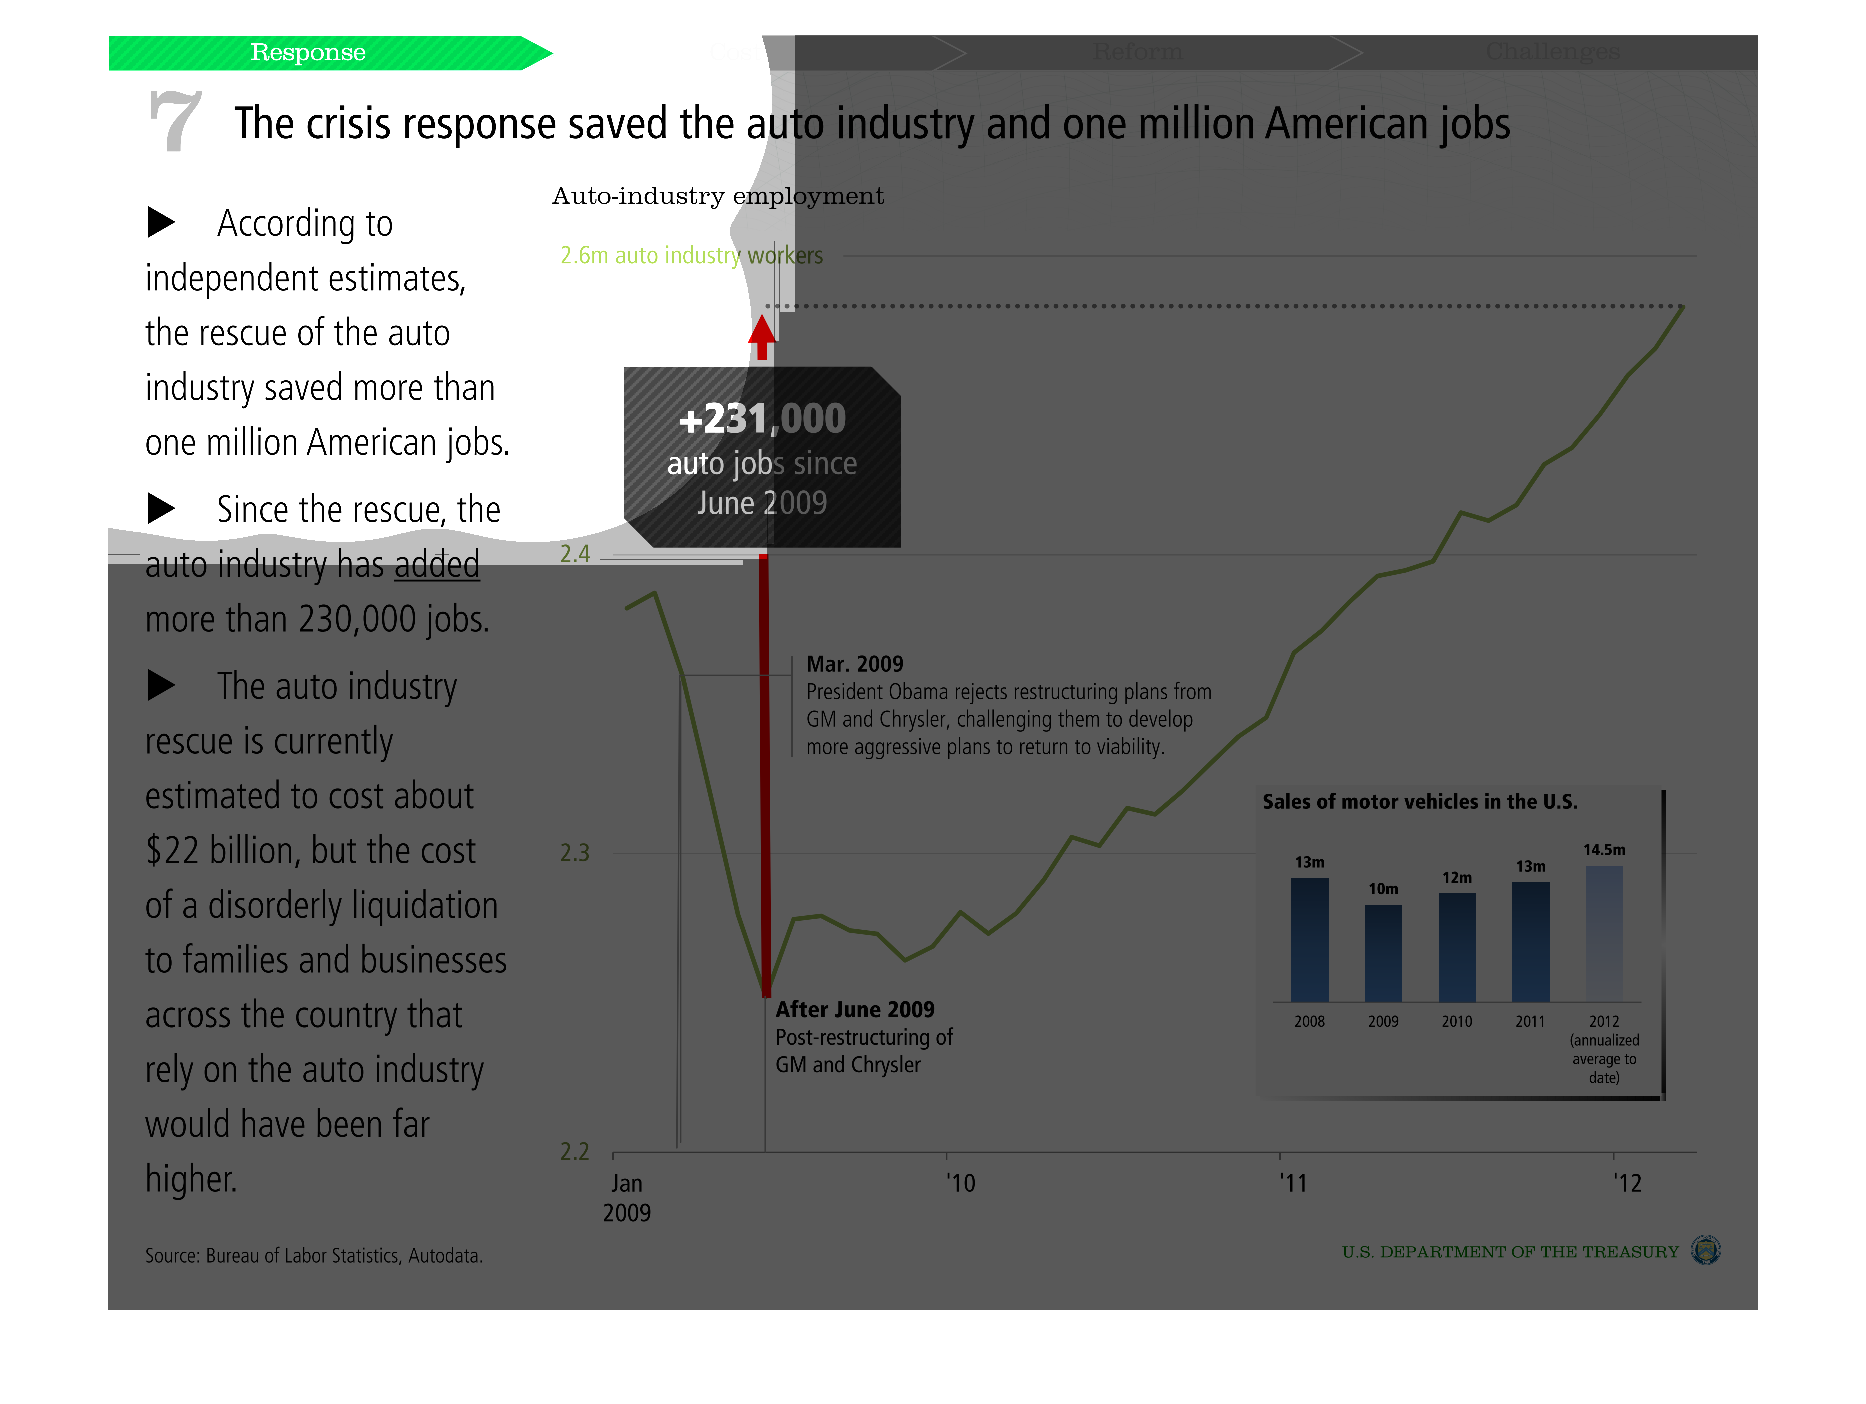
The chart is showing how crisis response saved the automobile industry and more than a million
American jobs. Since the crisis rescue, even more jobs have been created. The timeline shows
the different events that impacted the automobile industry and what effect they had.
Warning: Image is too big to fit on screen; displaying at 50%
Warning: Image is too big to fit on screen; displaying at 50%

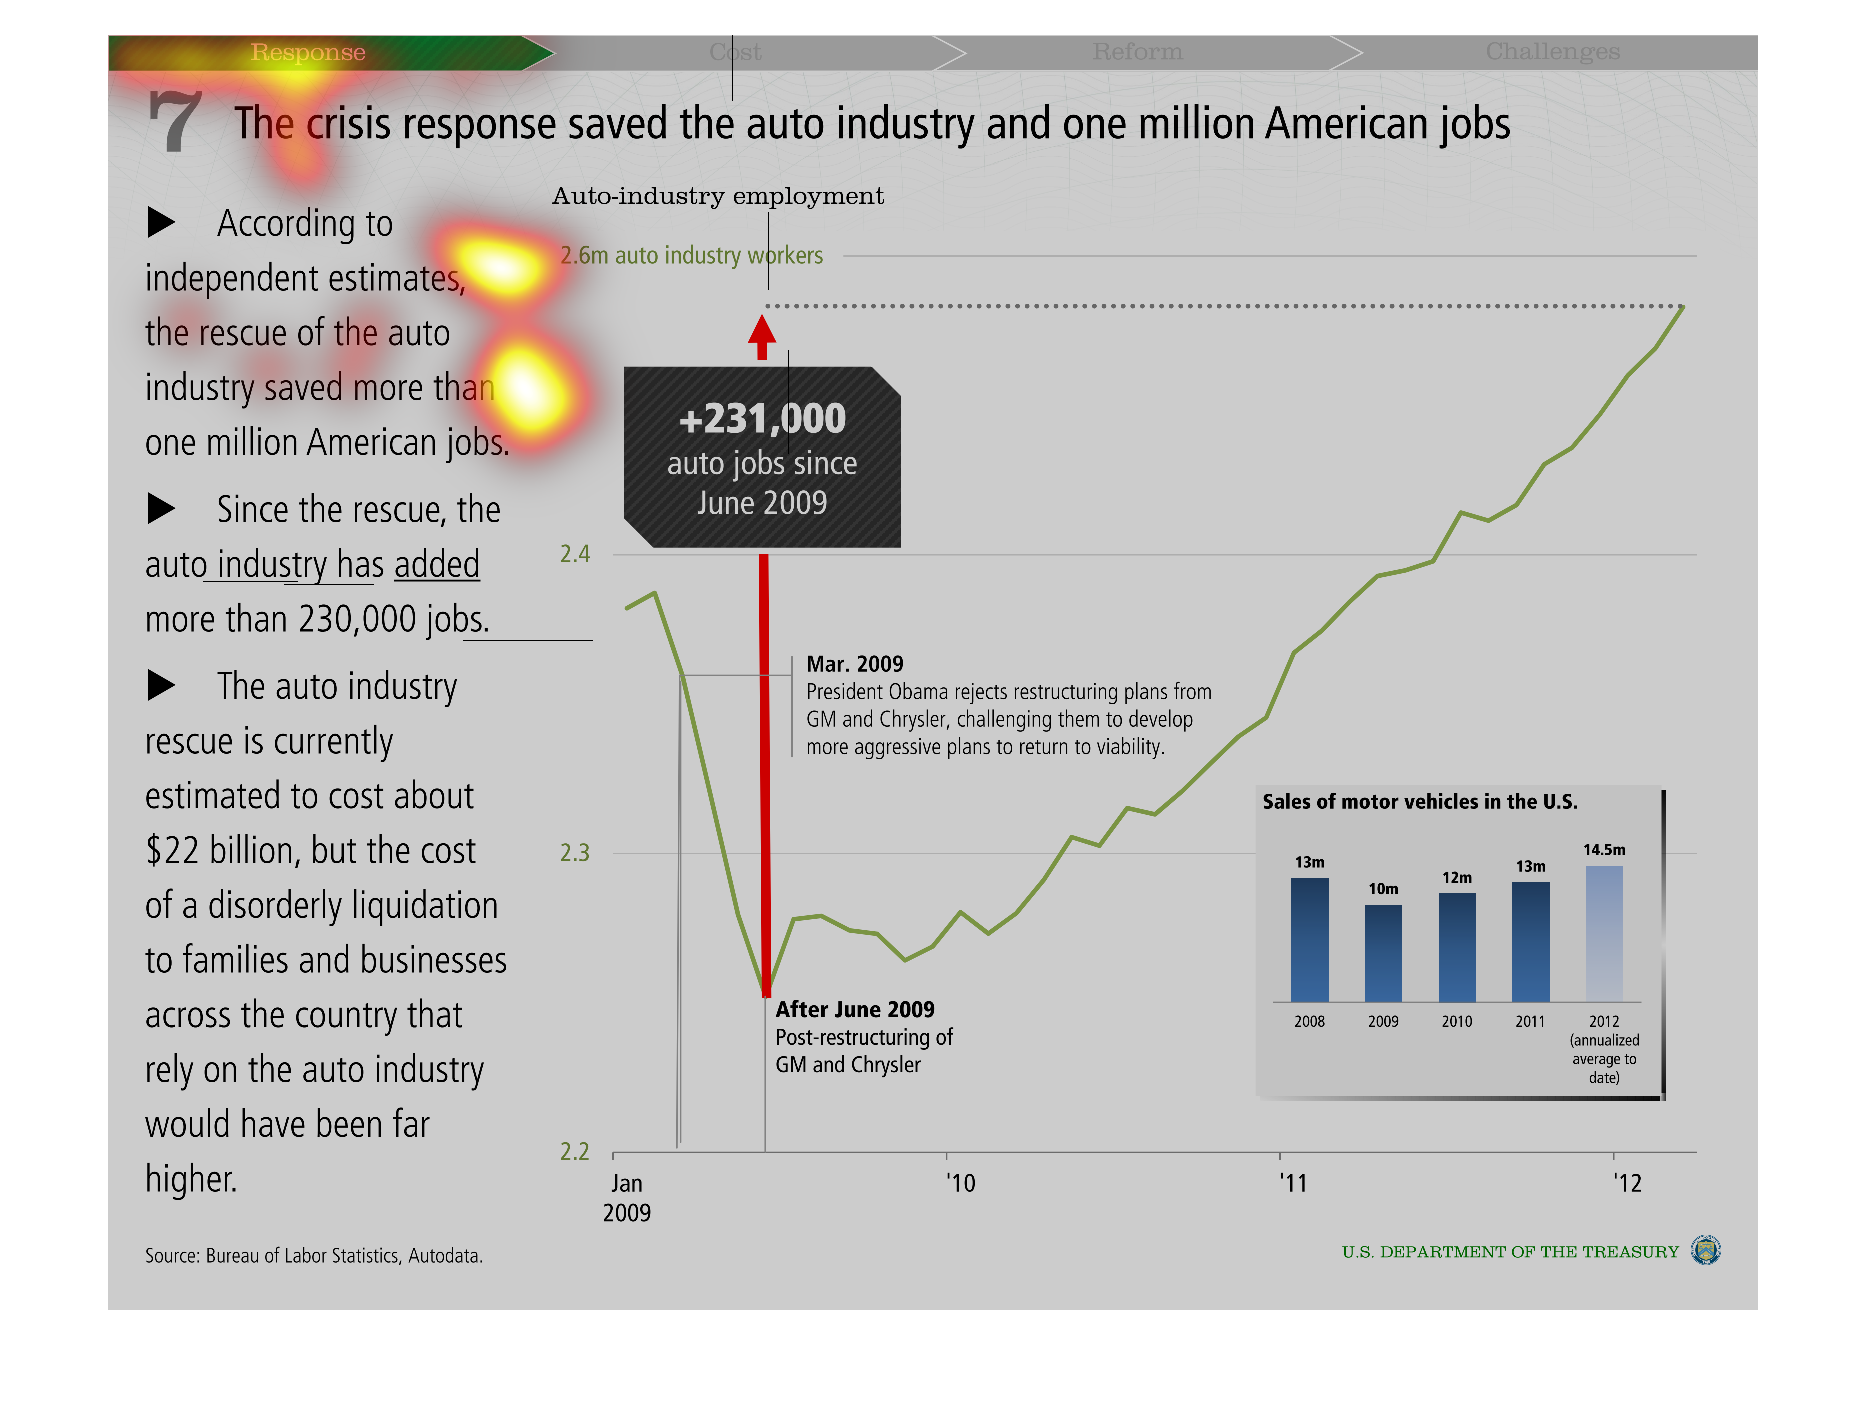
The image describes how the steps the government took recovered the automobile industry and
improved both the number of jobs and the sales of cars. Over time, the number of jobs increased
from 2009 to 2012
Warning: Image is too big to fit on screen; displaying at 50%
Warning: Image is too big to fit on screen; displaying at 50%
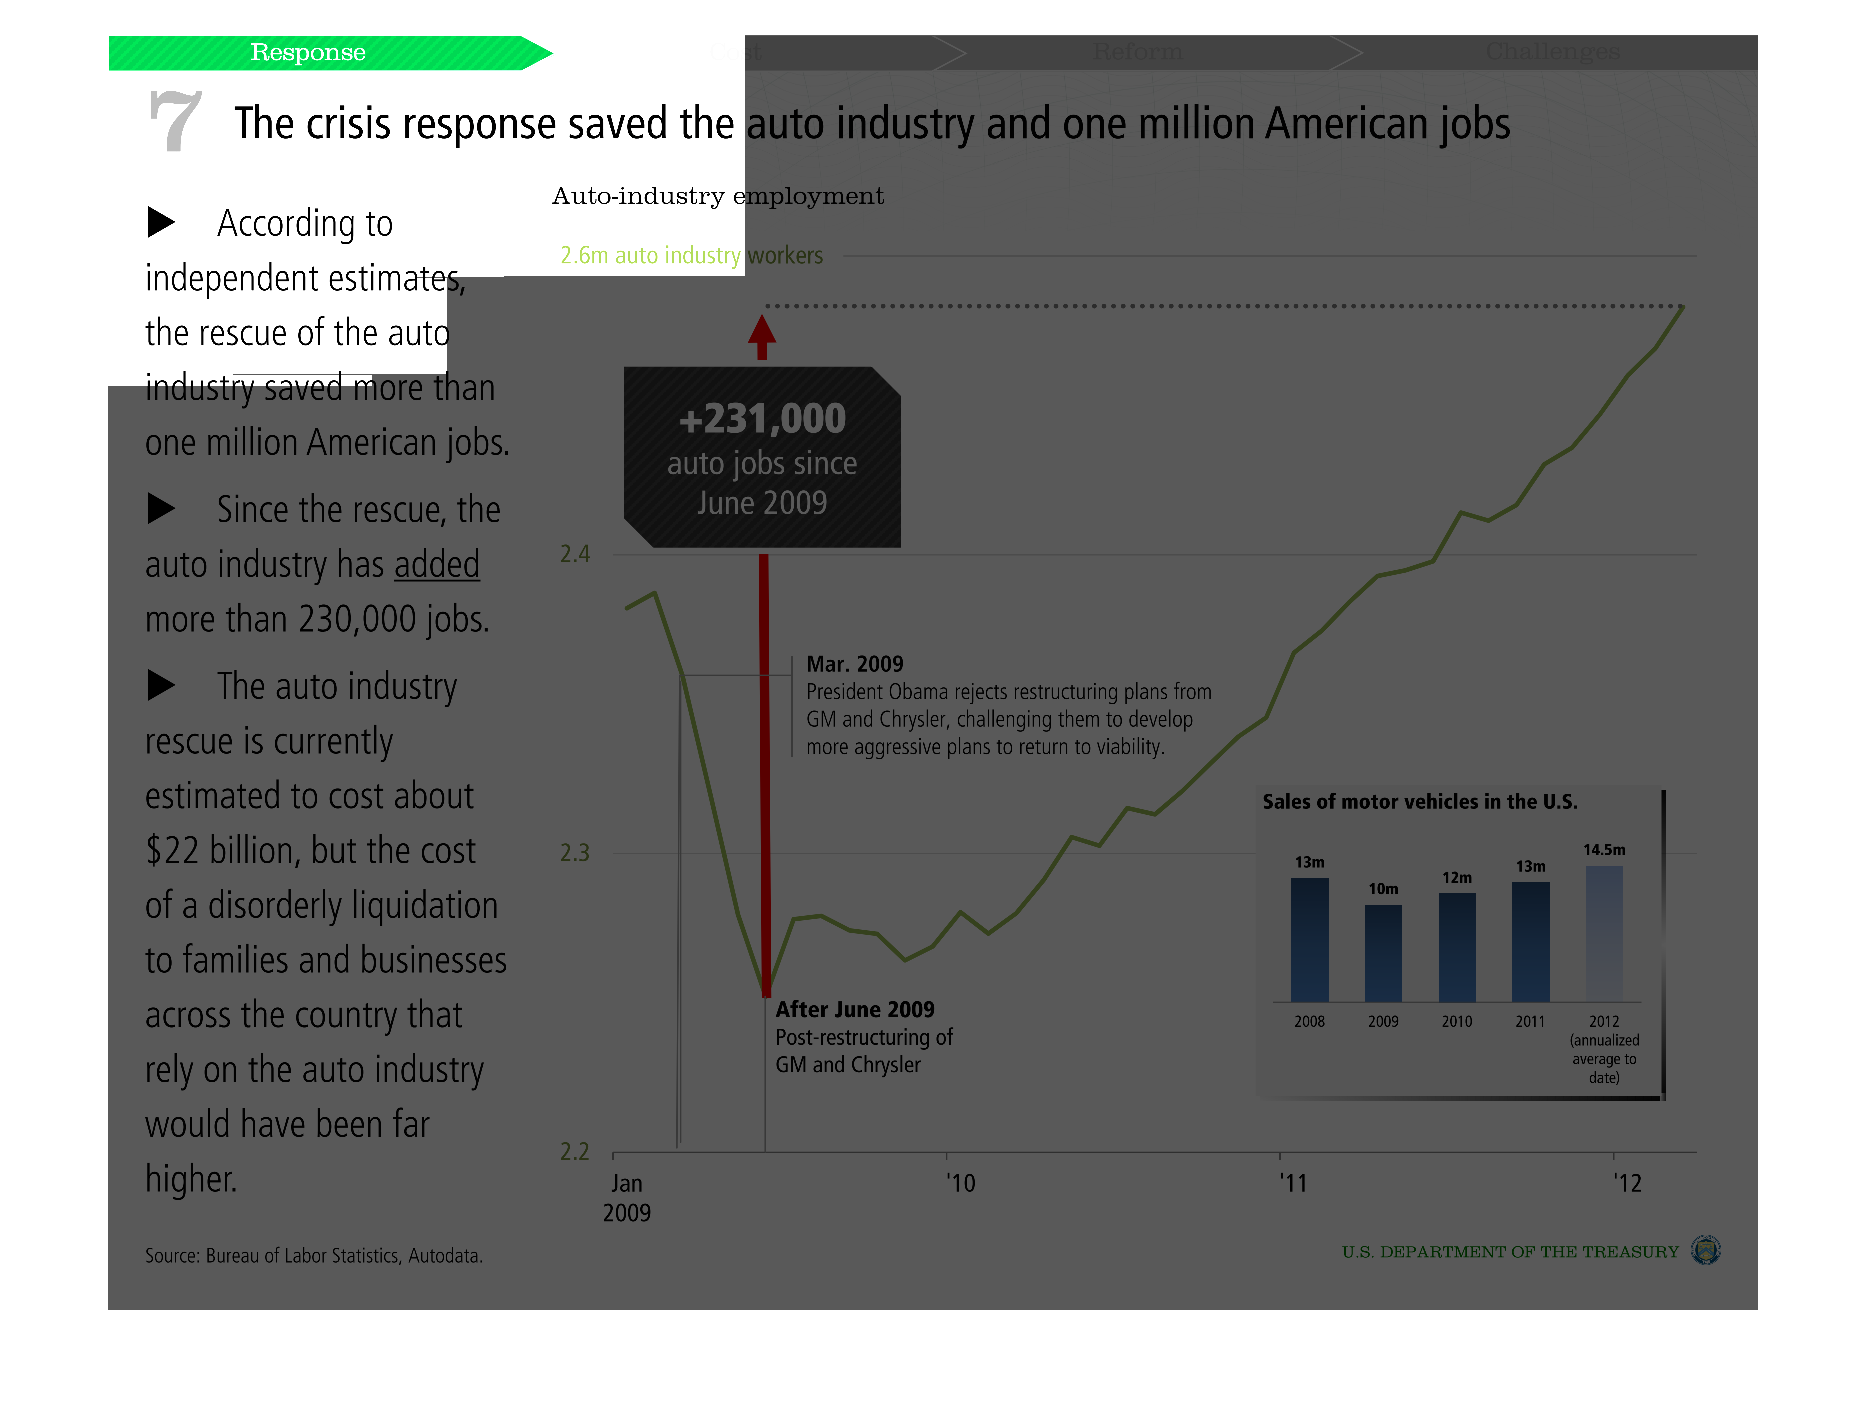
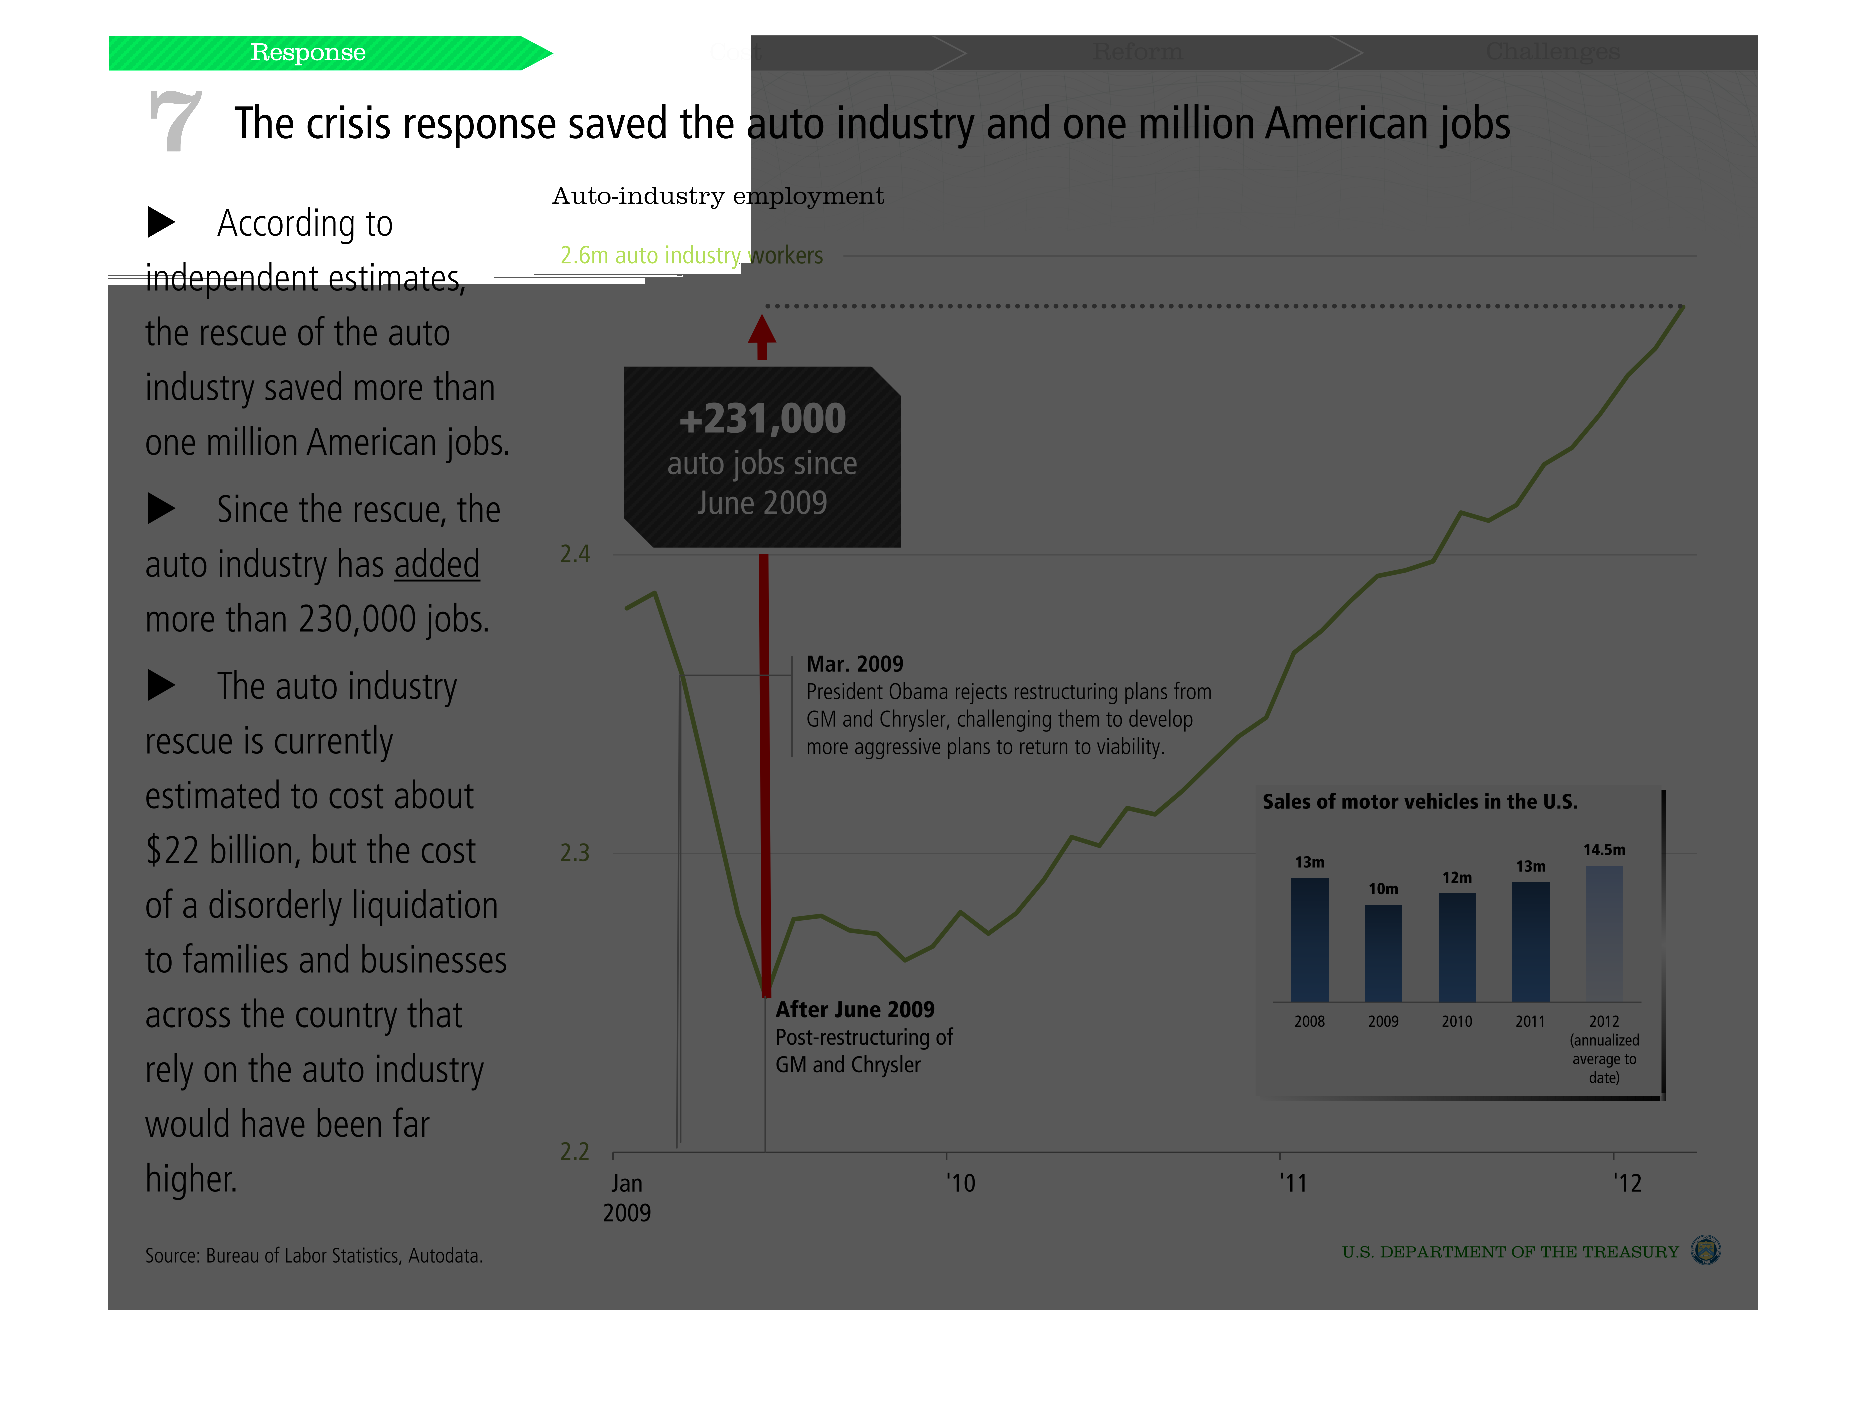
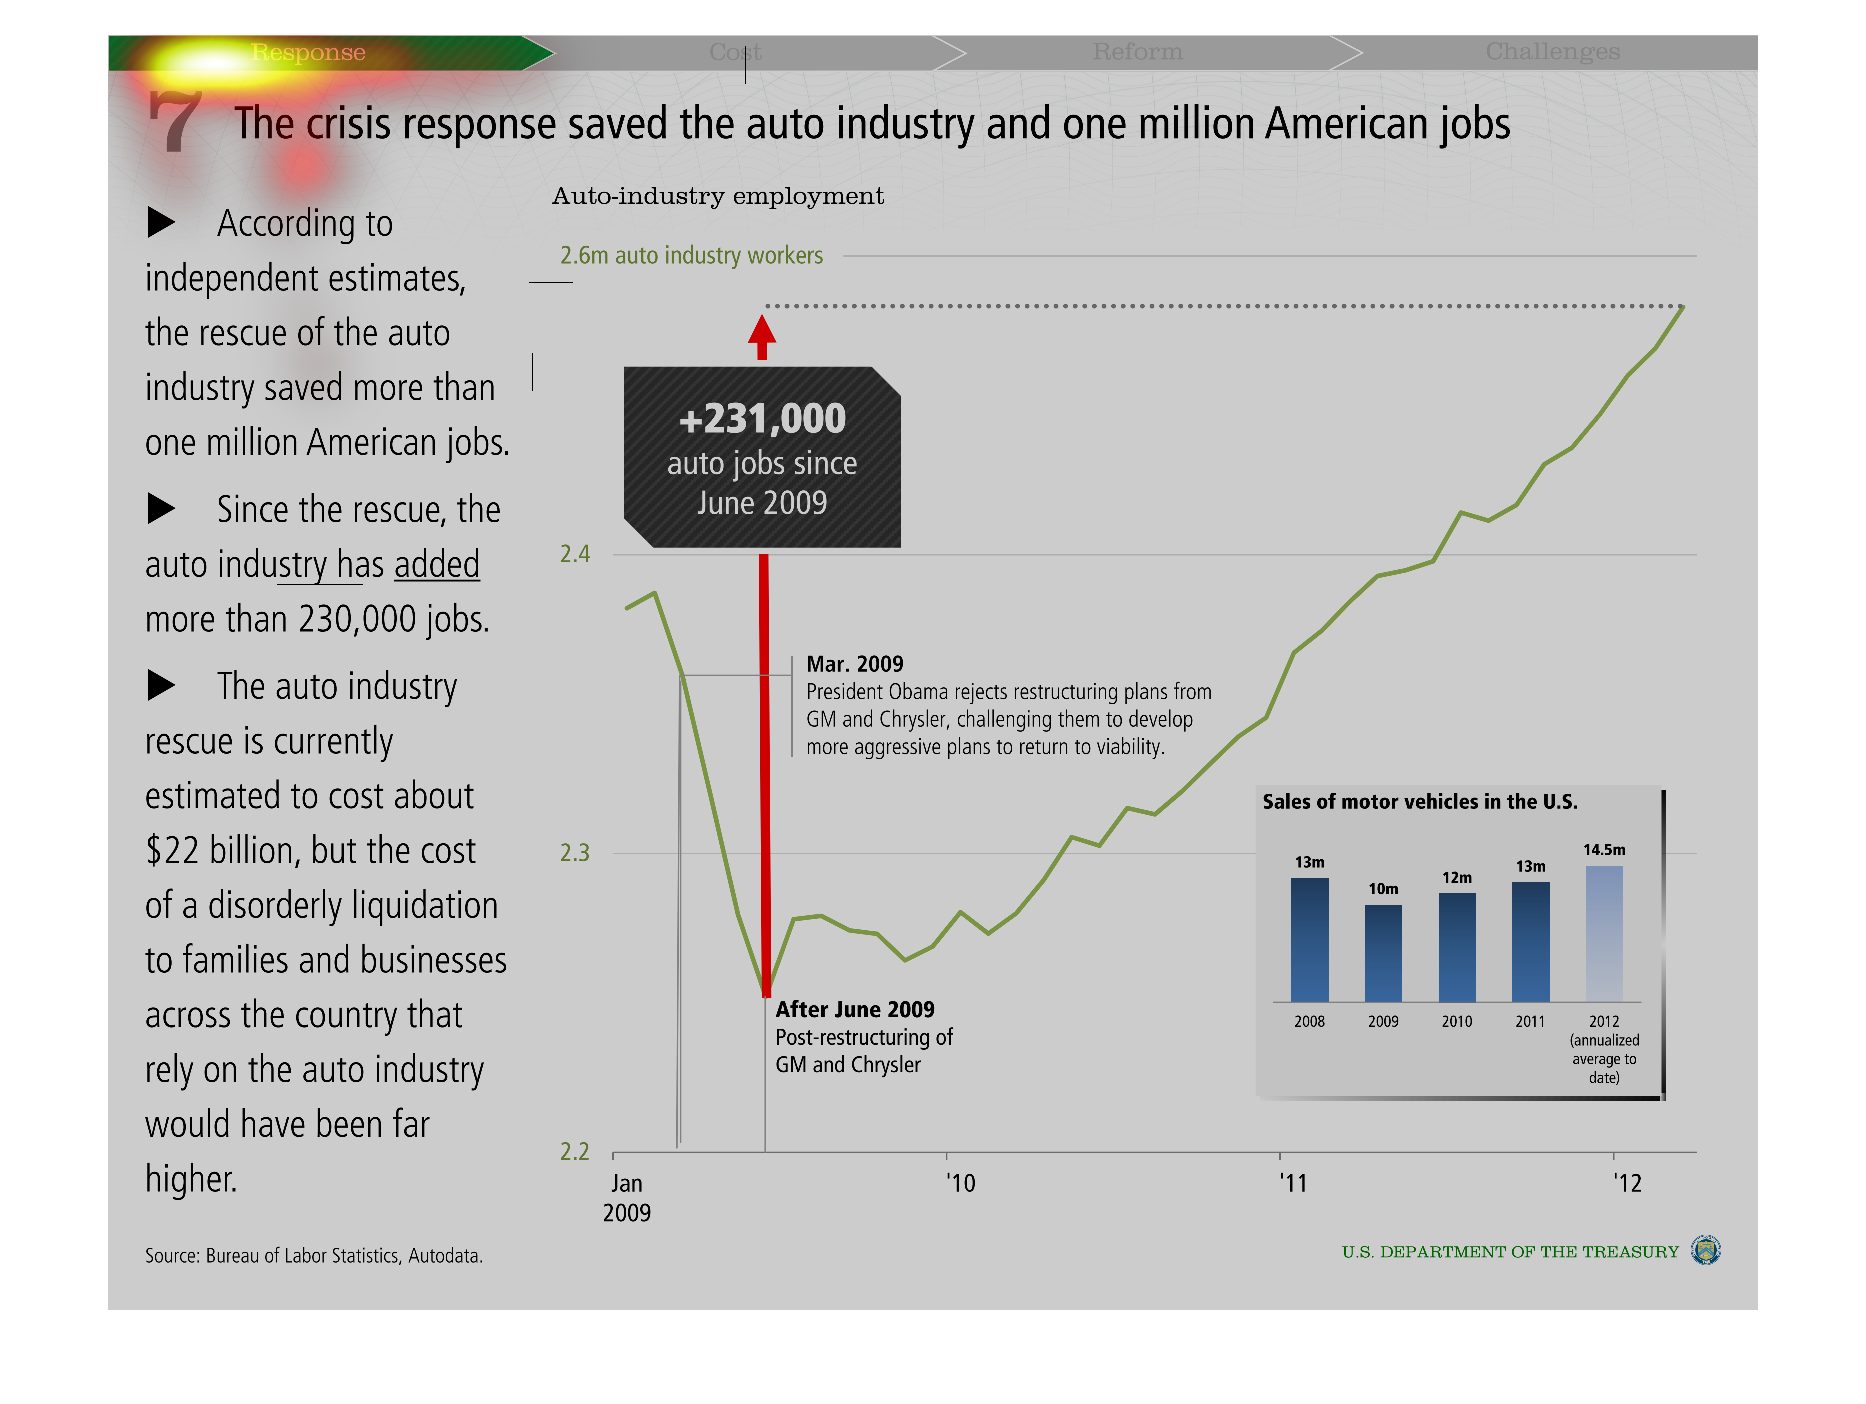
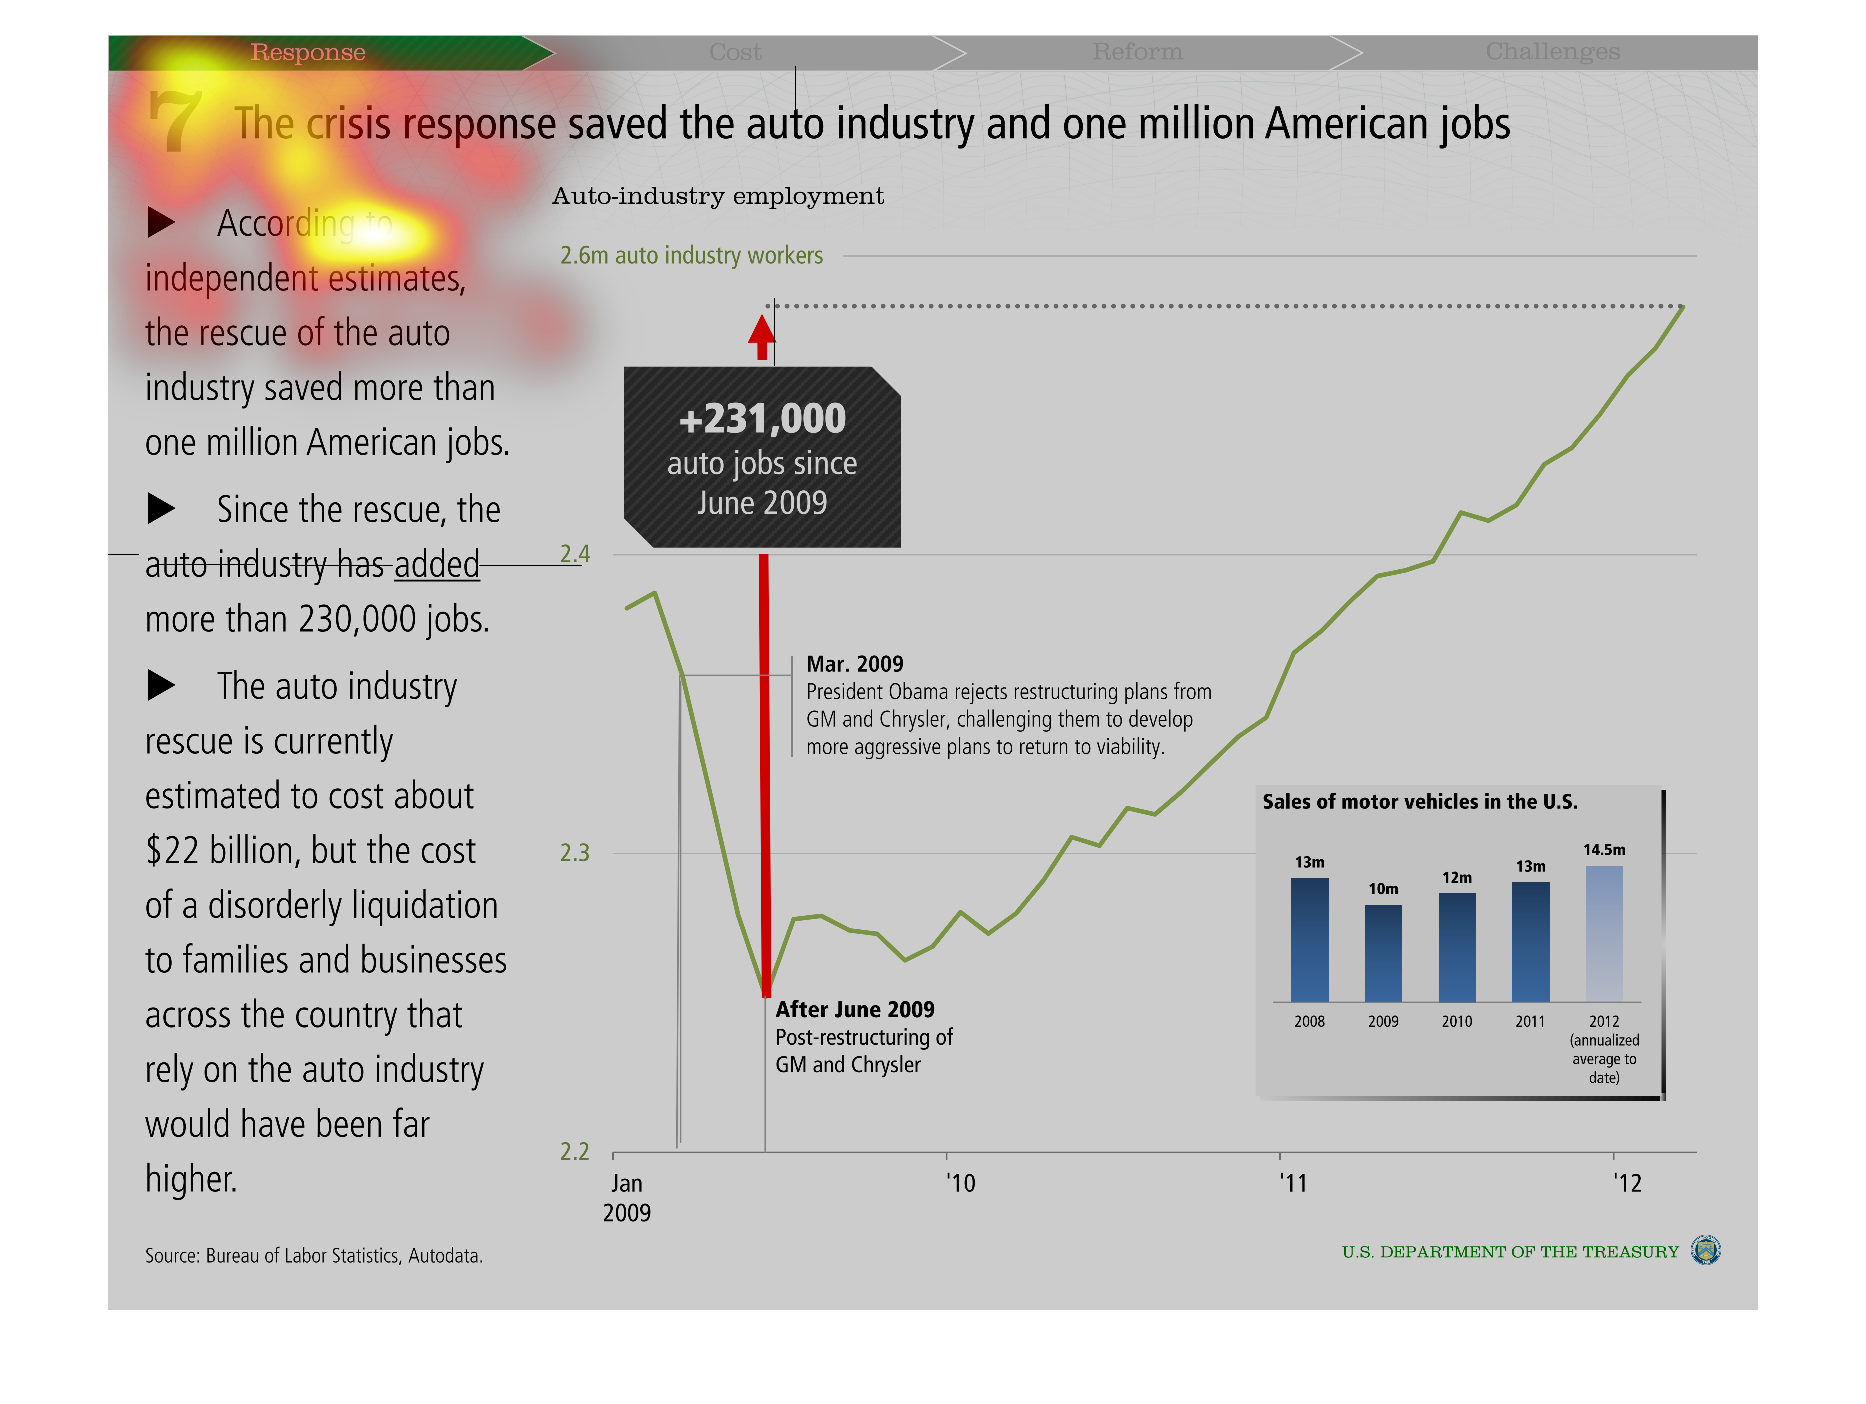
This graph shows how the crisis response saved the auto industry and one million American
jobs.  There is a narrative on the left hand side, auto industry employment figures in the
middle, and motor vehicle sales in the US figures on the right.
Warning: Image is too big to fit on screen; displaying at 50%
Warning: Image is too big to fit on screen; displaying at 50%
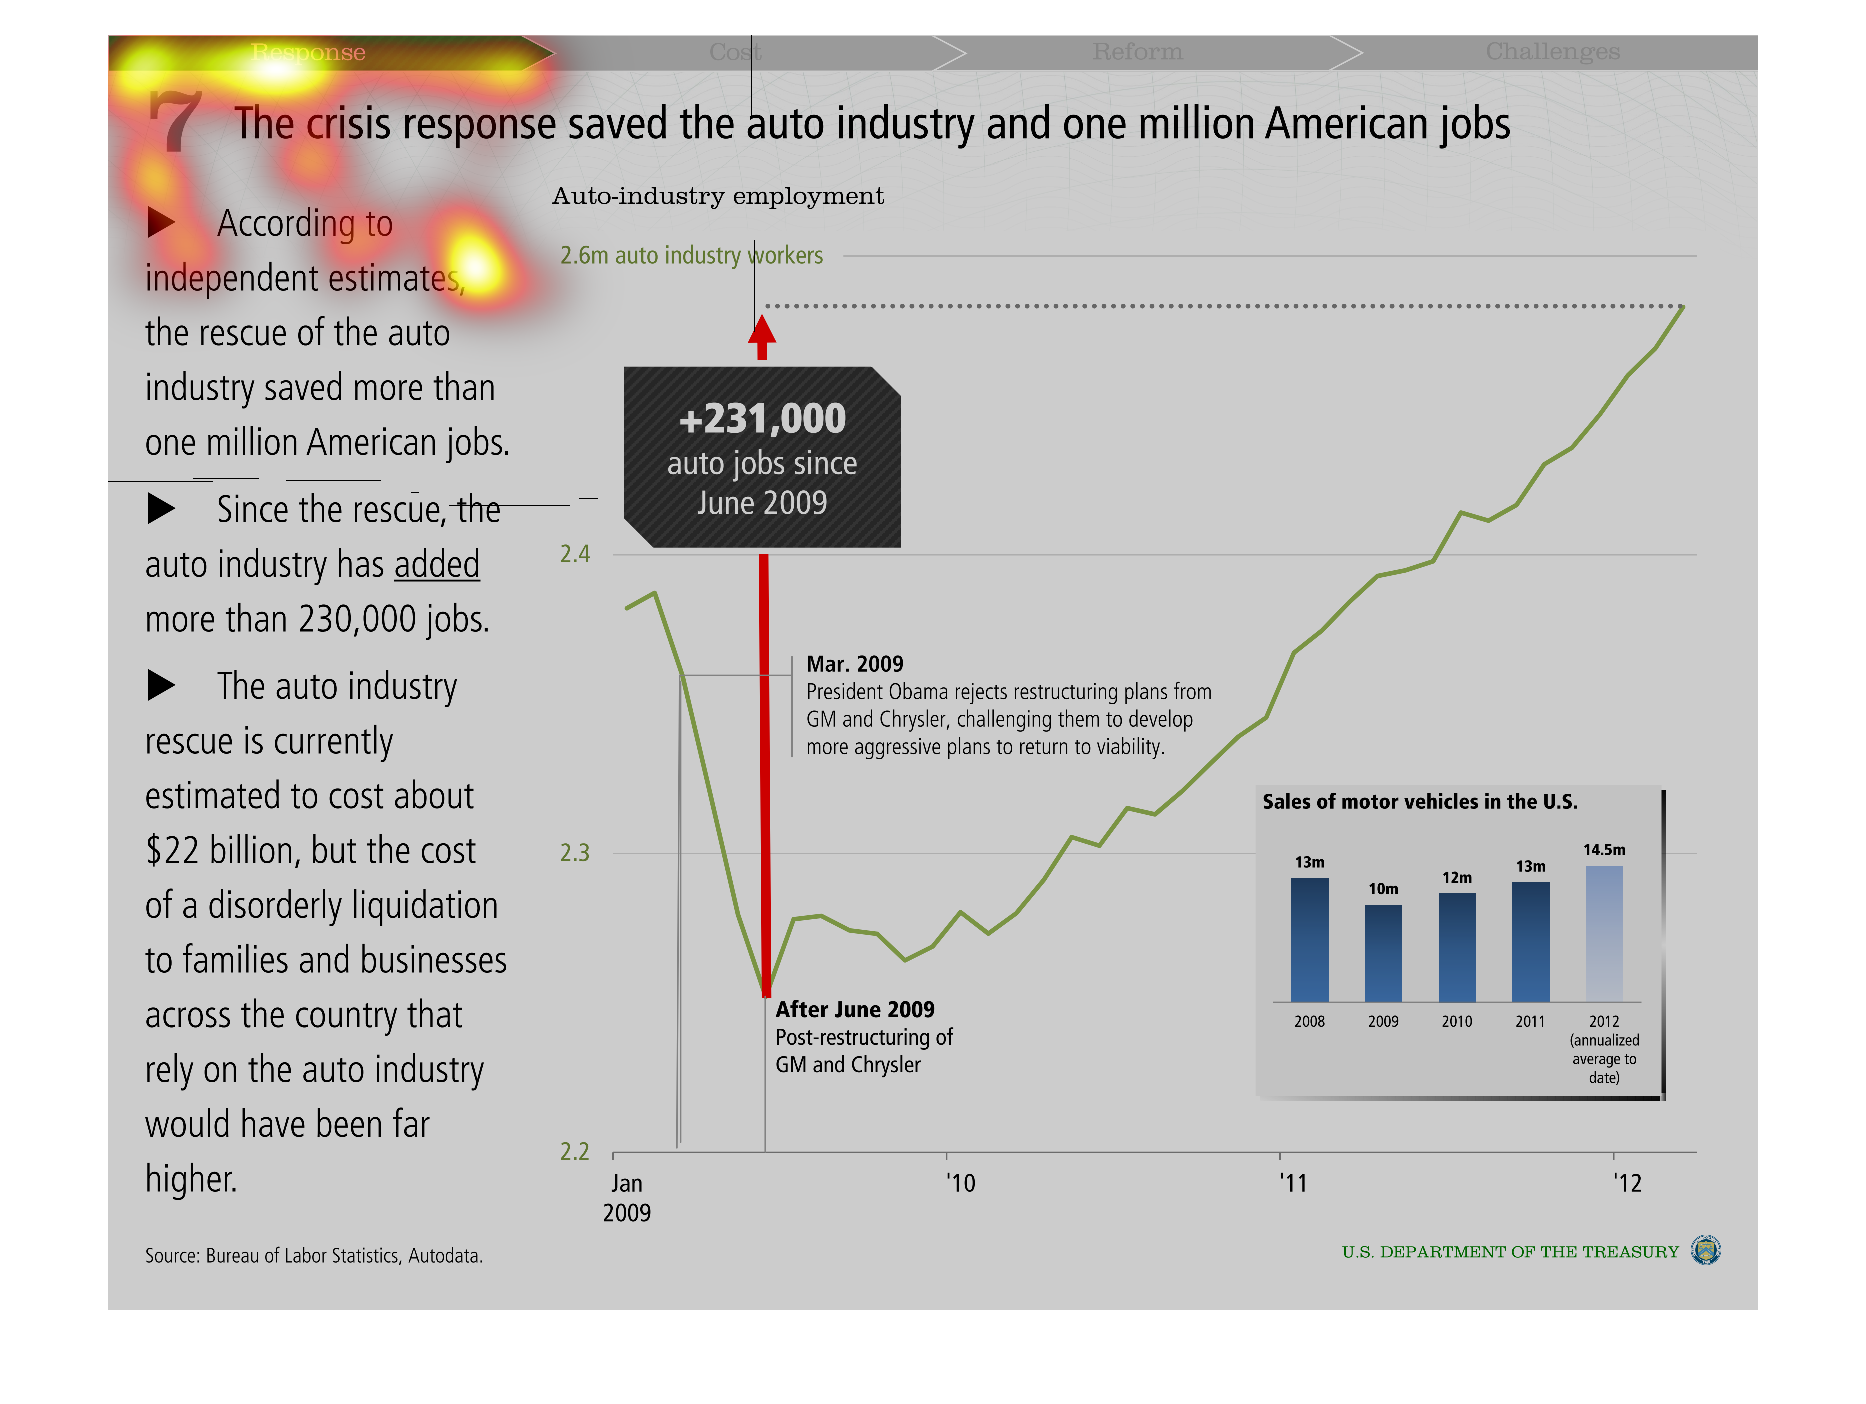
This chart shows the growth of jobs in the auto industry following the bailout of that industry
following the economic collapse of 2008. It attempts to directly tie growth in the industry
to the infusion of government funding/tax breaks/tax incentives into the industry.
Warning: Image is too big to fit on screen; displaying at 50%
Warning: Image is too big to fit on screen; displaying at 50%
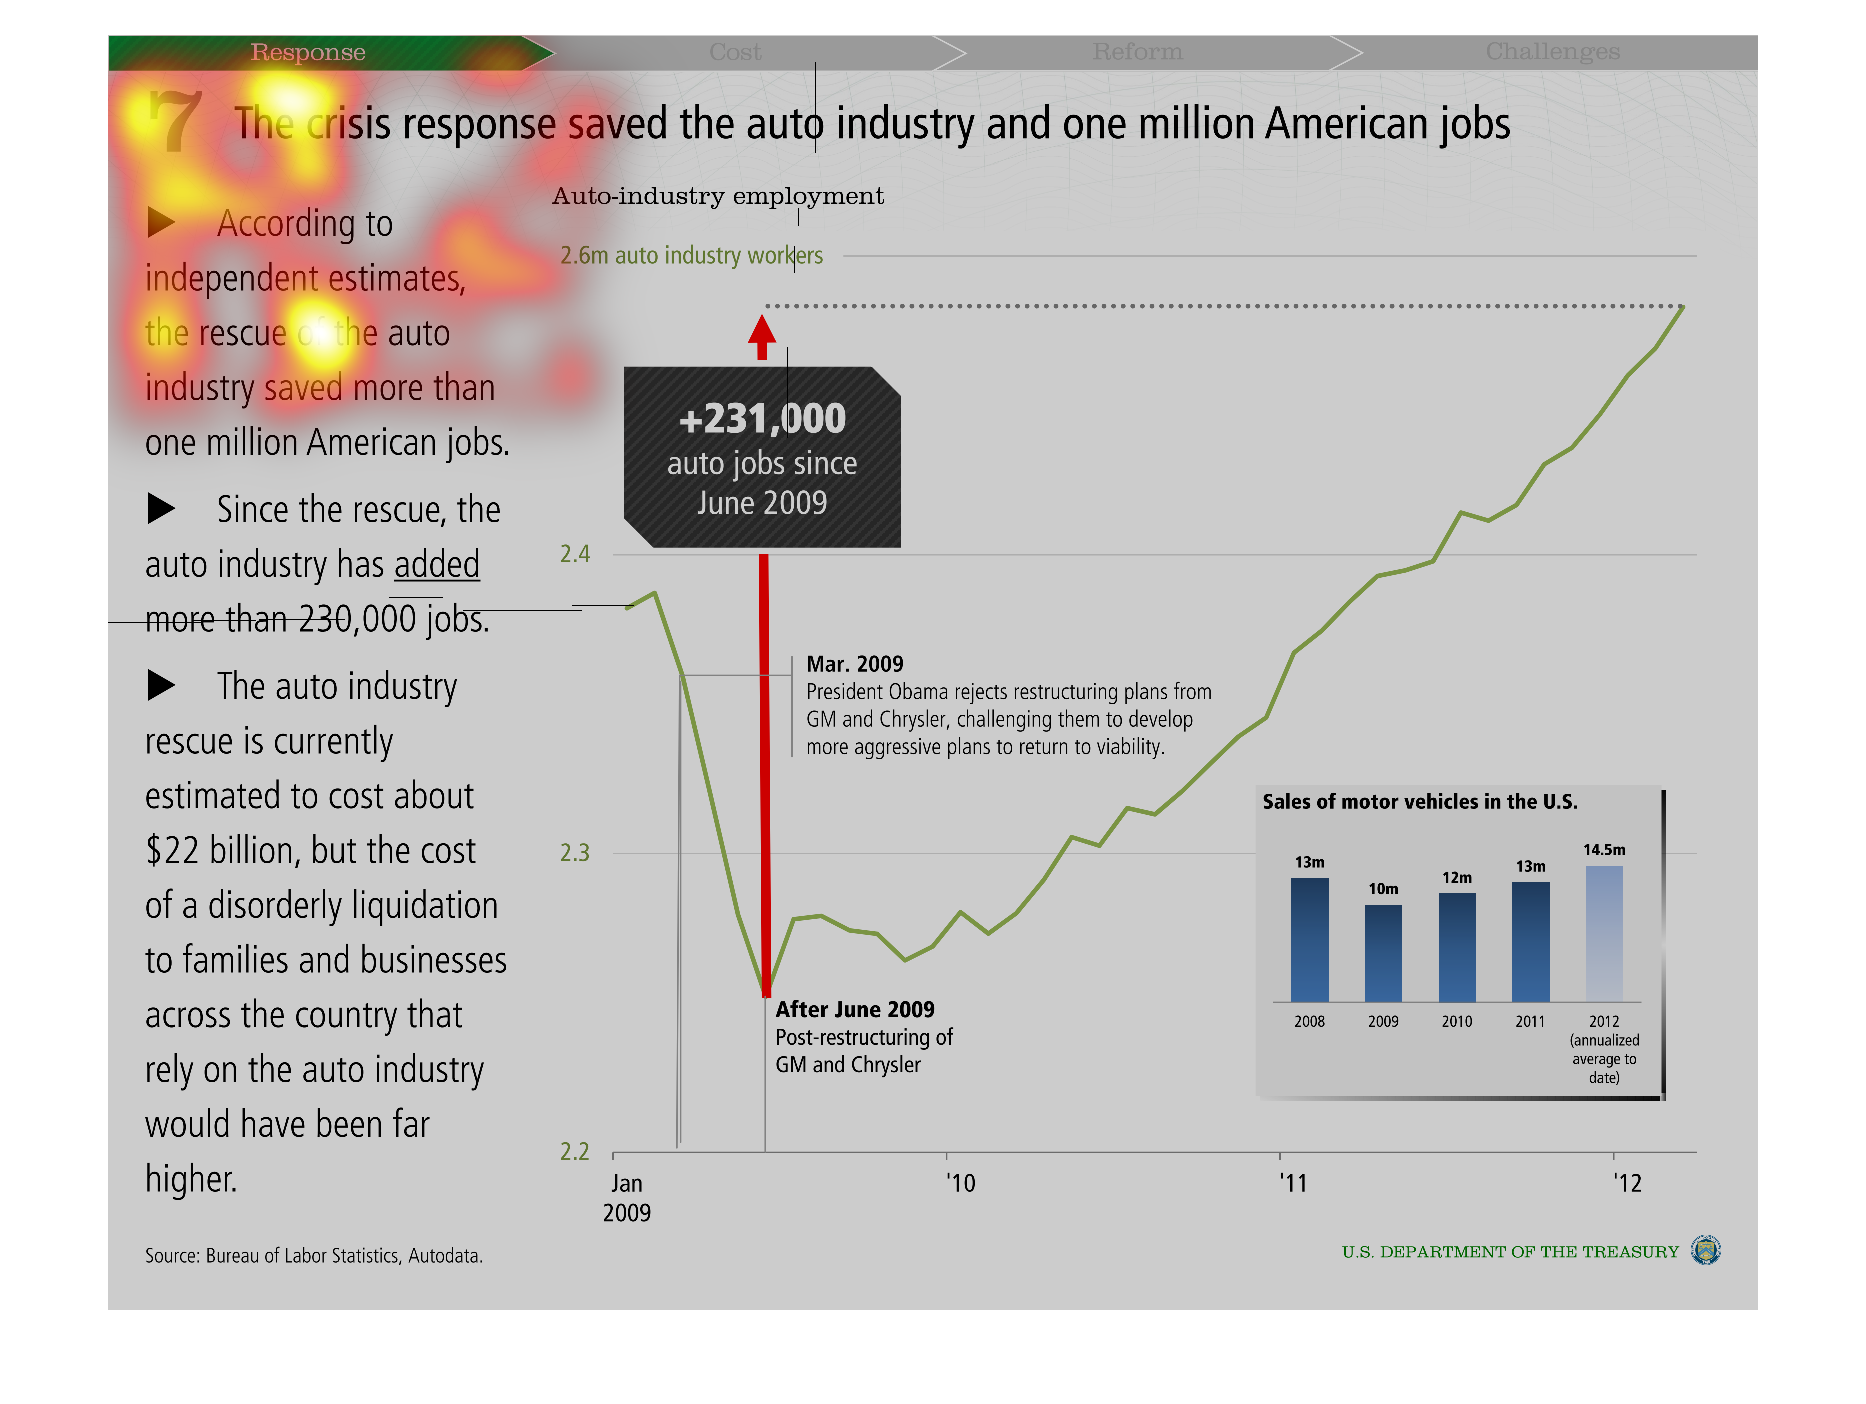
American jobs were salvaged by a rescue, and many families were kept with jobs. 231,000 jobs
went up Since June 2009. President Obama helped to restructure plans for GM and Chrysler.
Warning: Image is too big to fit on screen; displaying at 50%
Warning: Image is too big to fit on screen; displaying at 50%
This is a series of graphs and charts depicting how the response to the financial crises saved
the US auto industry and one million American jobs following the crises.
Warning: Image is too big to fit on screen; displaying at 50%
Warning: Image is too big to fit on screen; displaying at 50%
This chart is for: The crisis response saved the Auto industry, and one million American jobs.
There is a bar graph in the bottom corner for Sales of motor vehicles in the U.S.
Warning: Image is too big to fit on screen; displaying at 50%
Warning: Image is too big to fit on screen; displaying at 50%