Warning: Image is too big to fit on screen; displaying at 50%
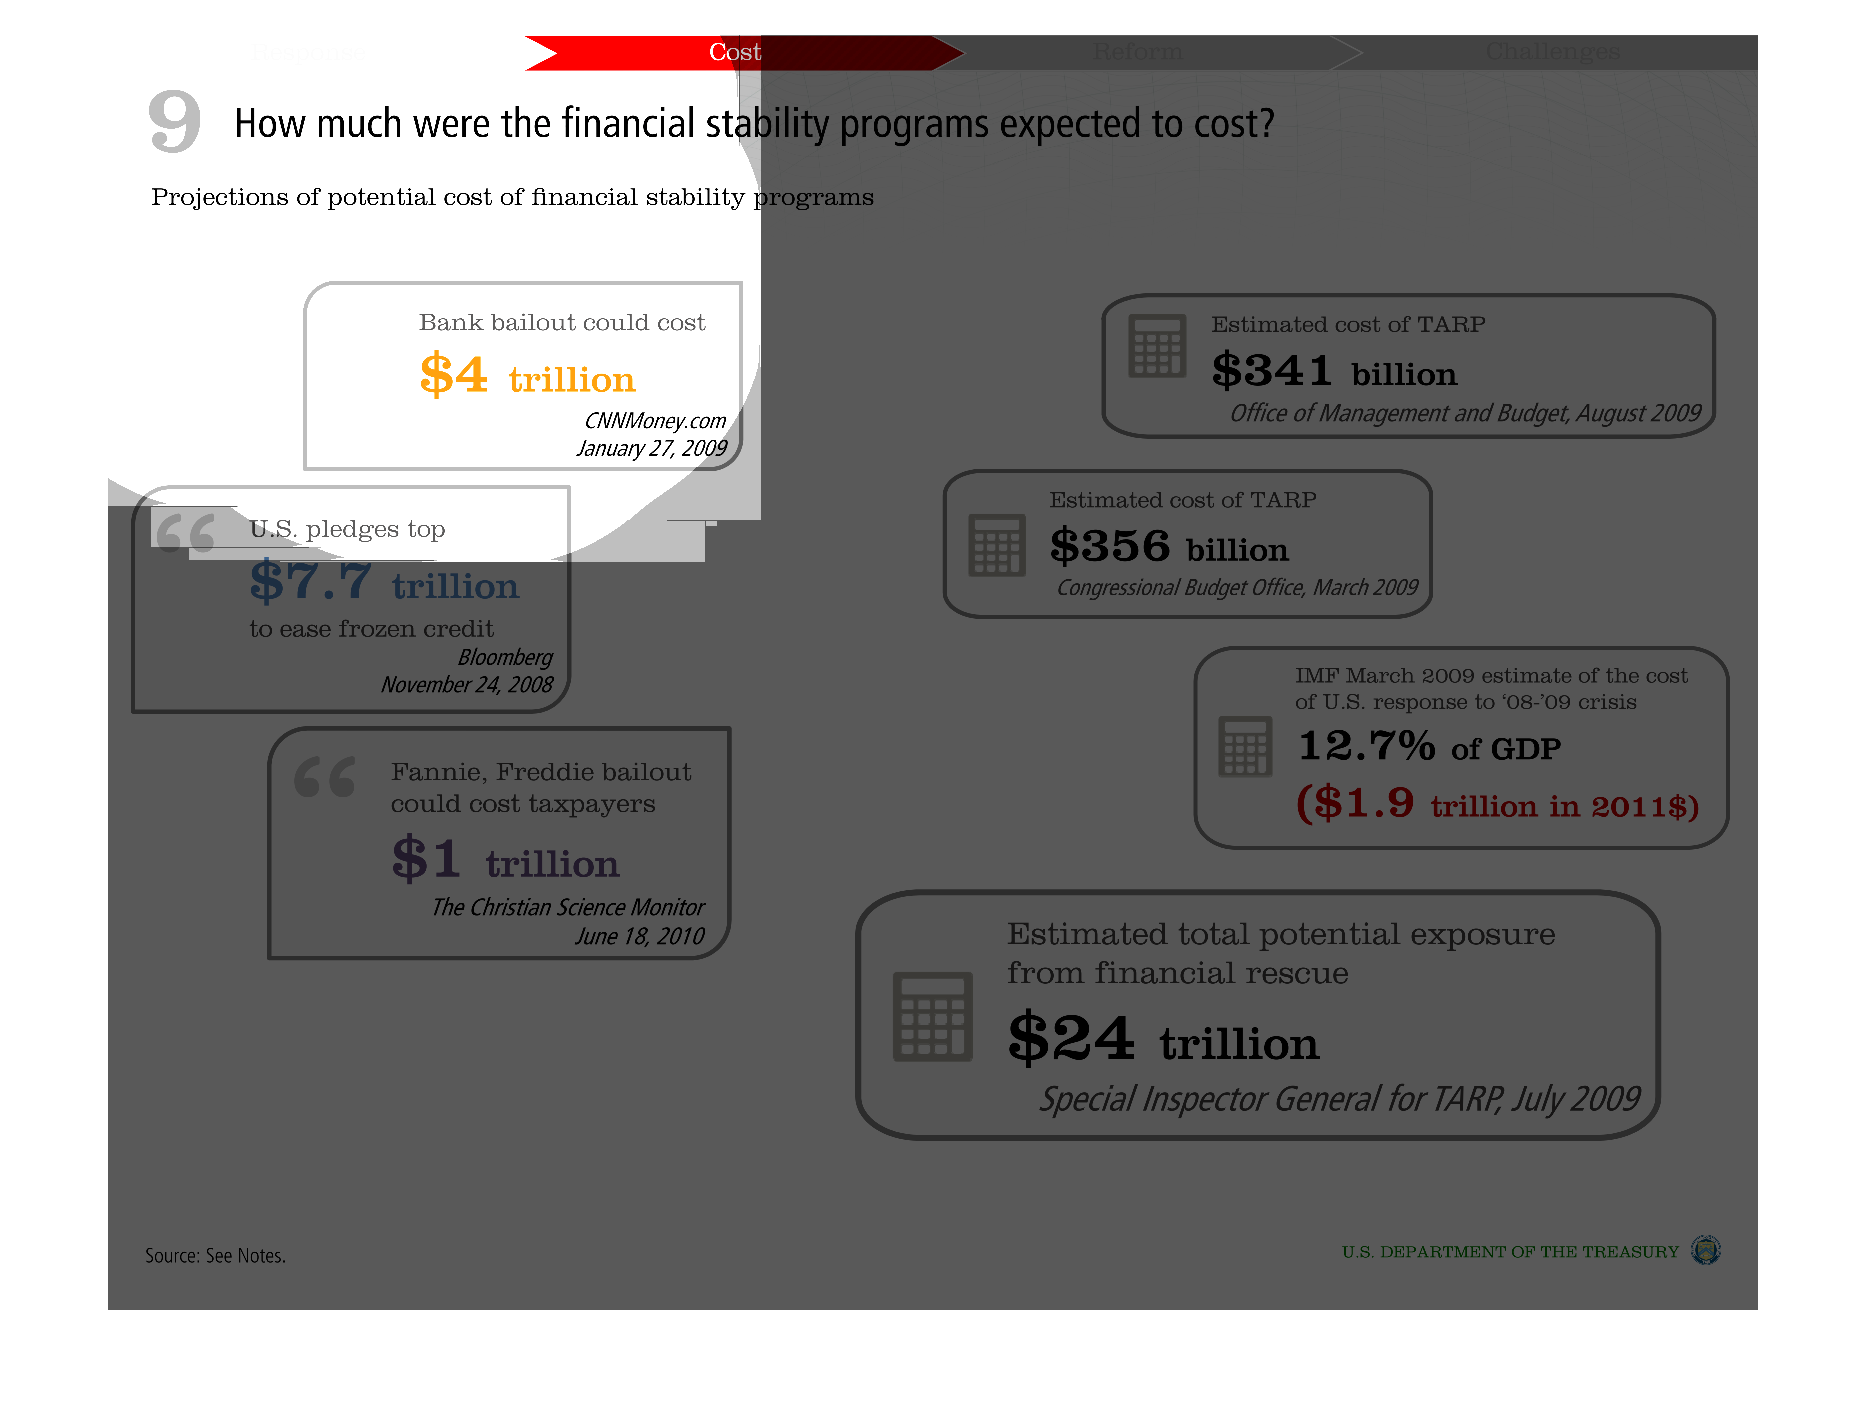
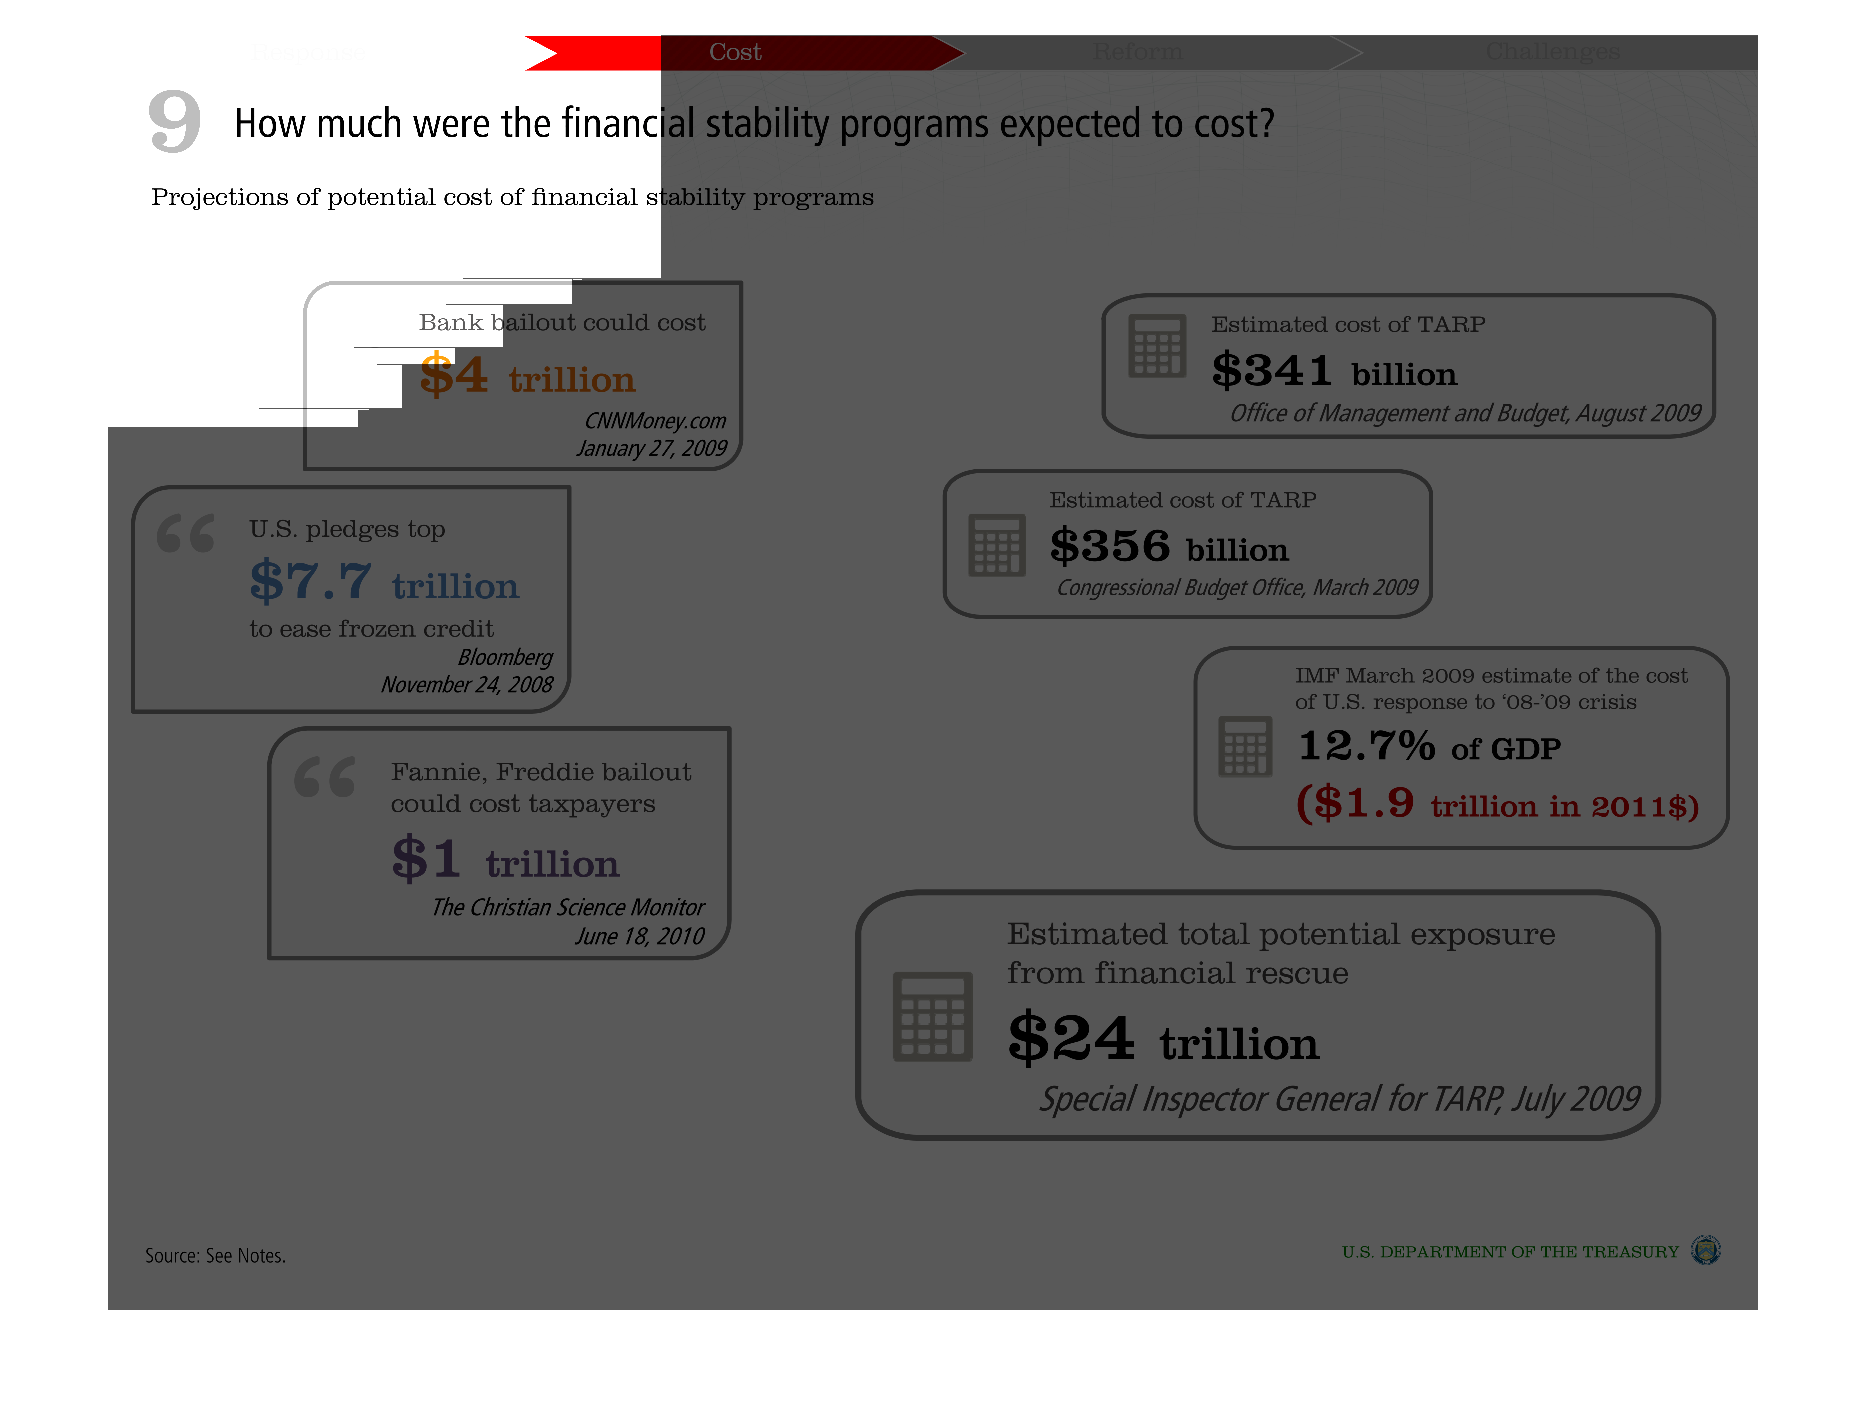
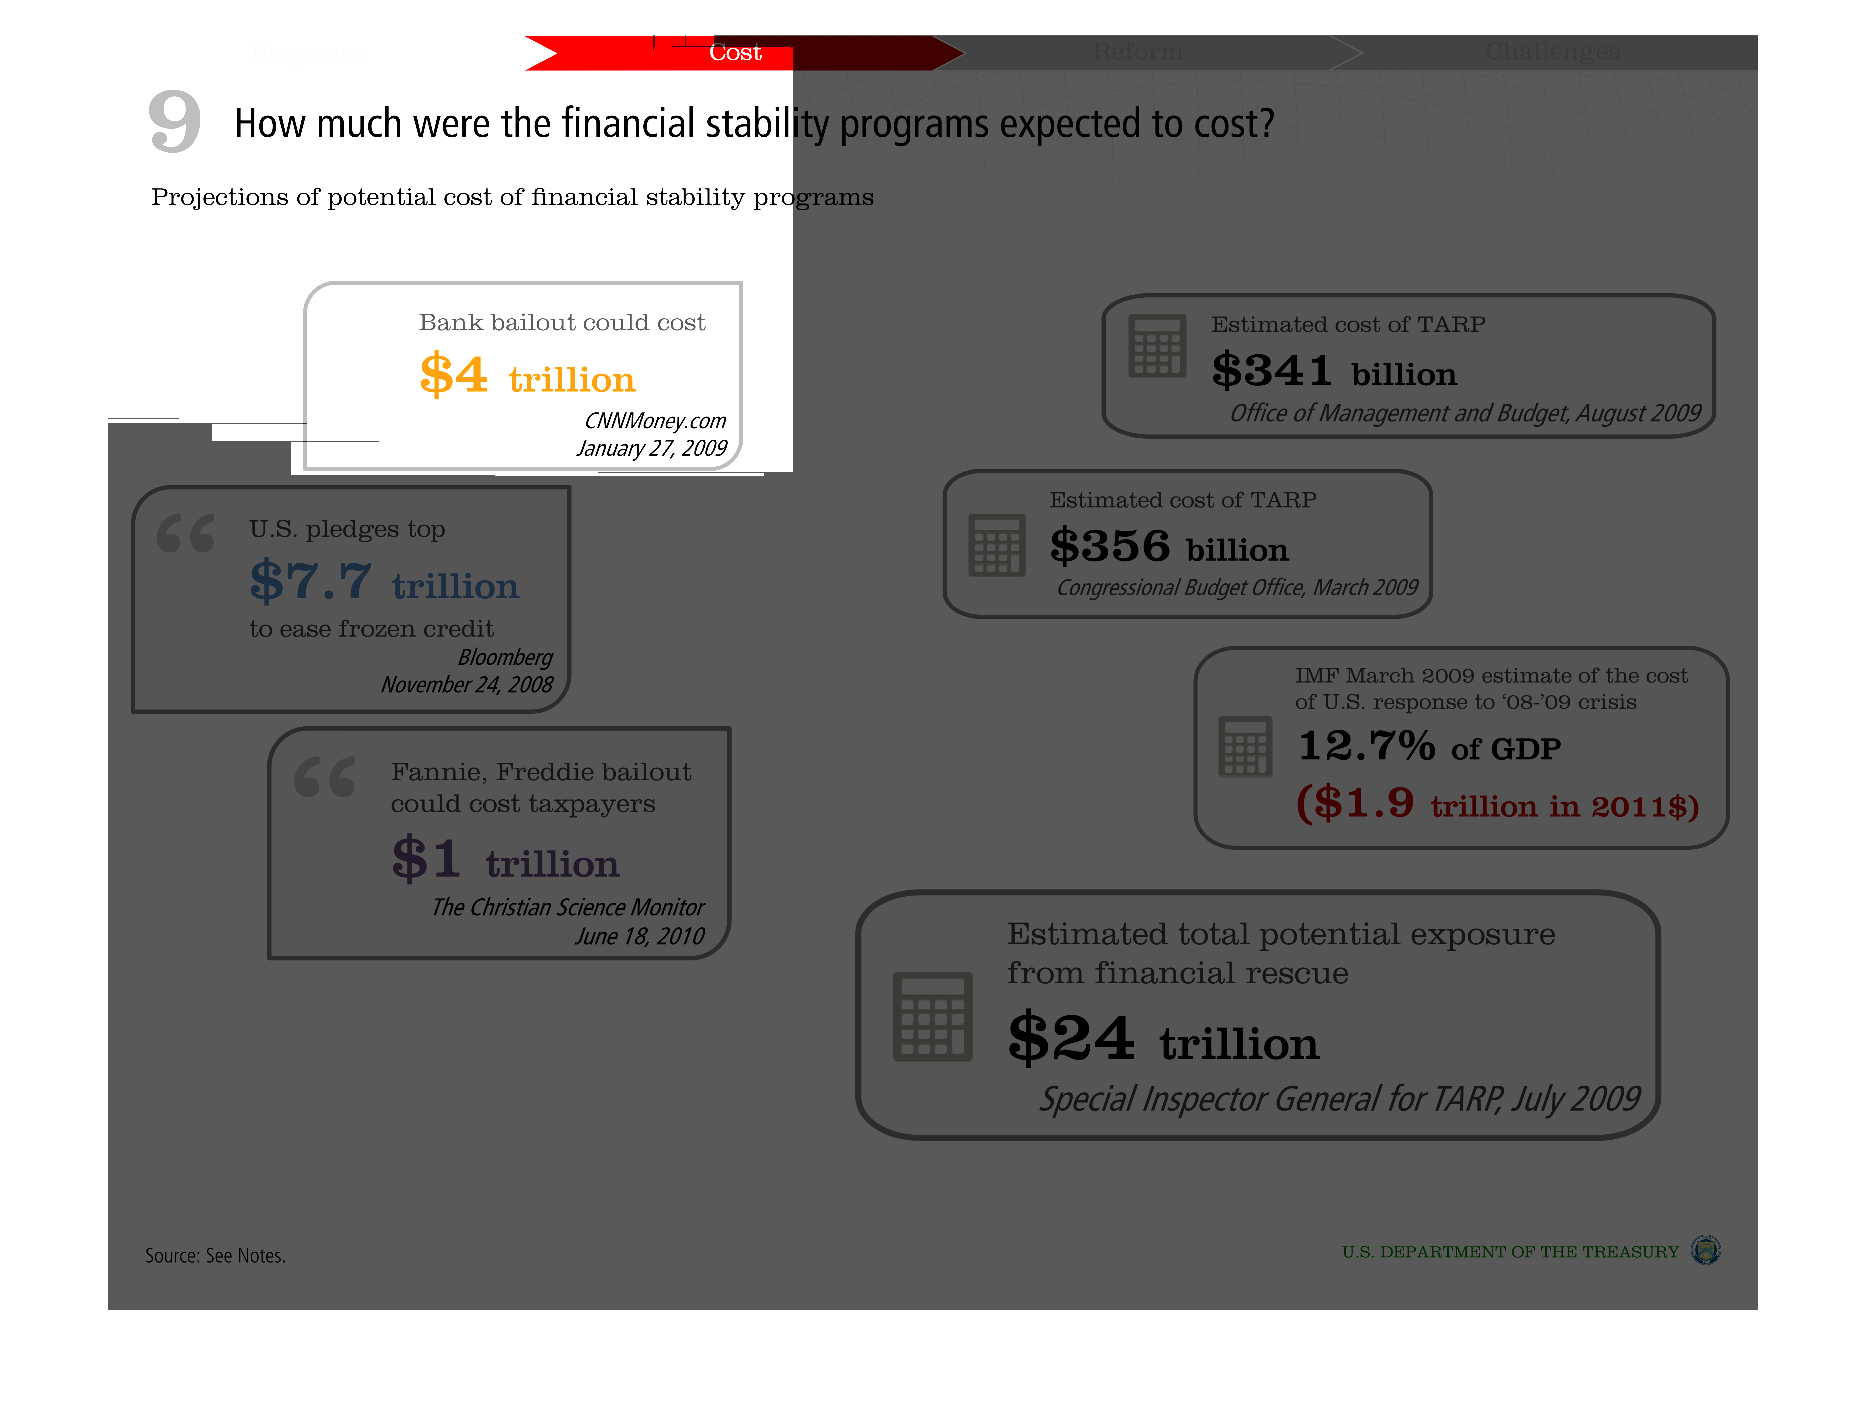
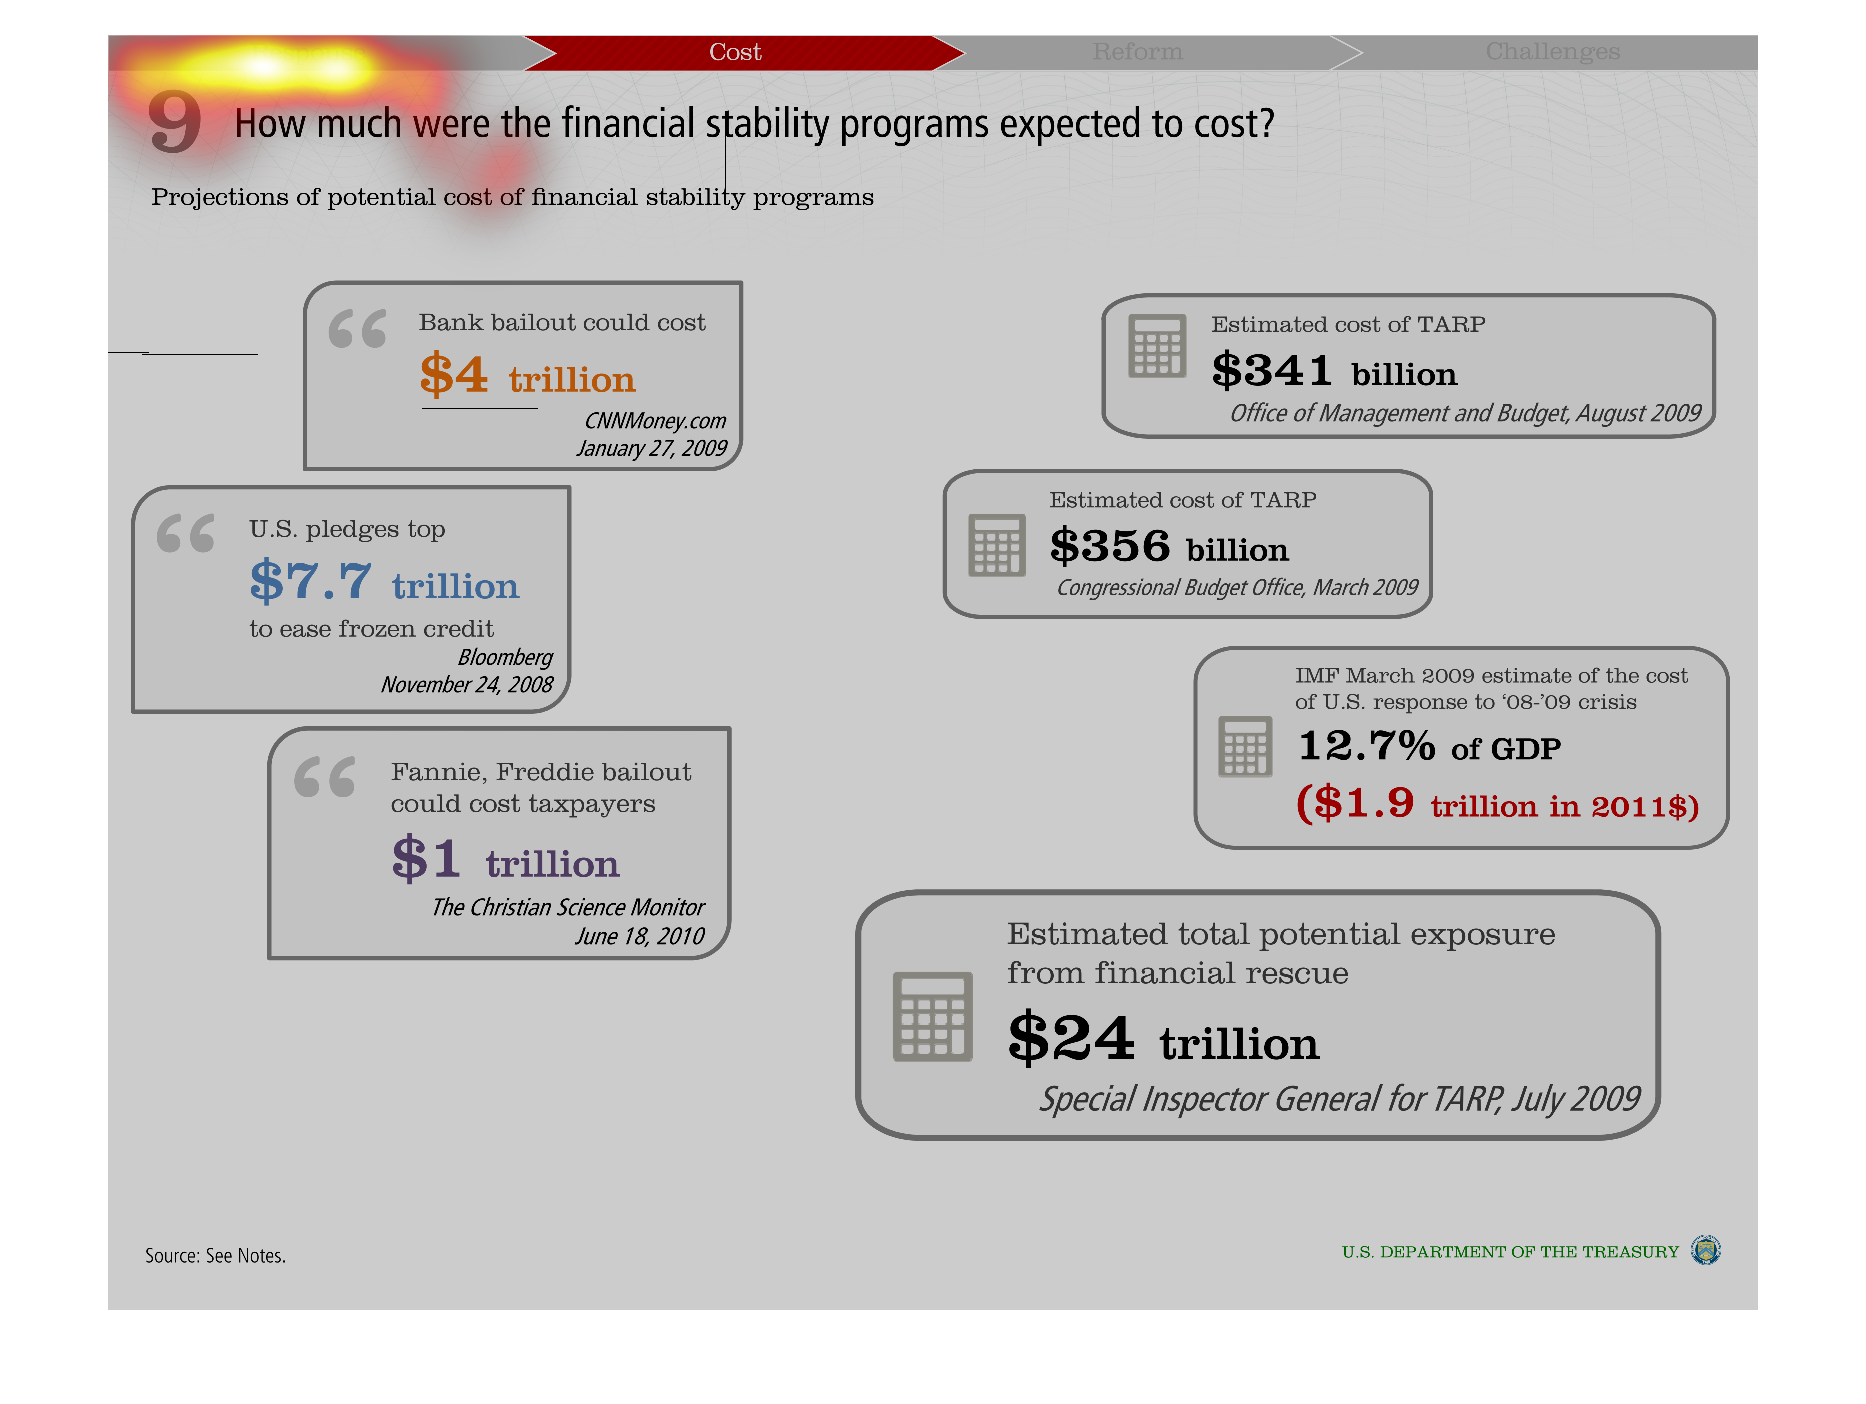
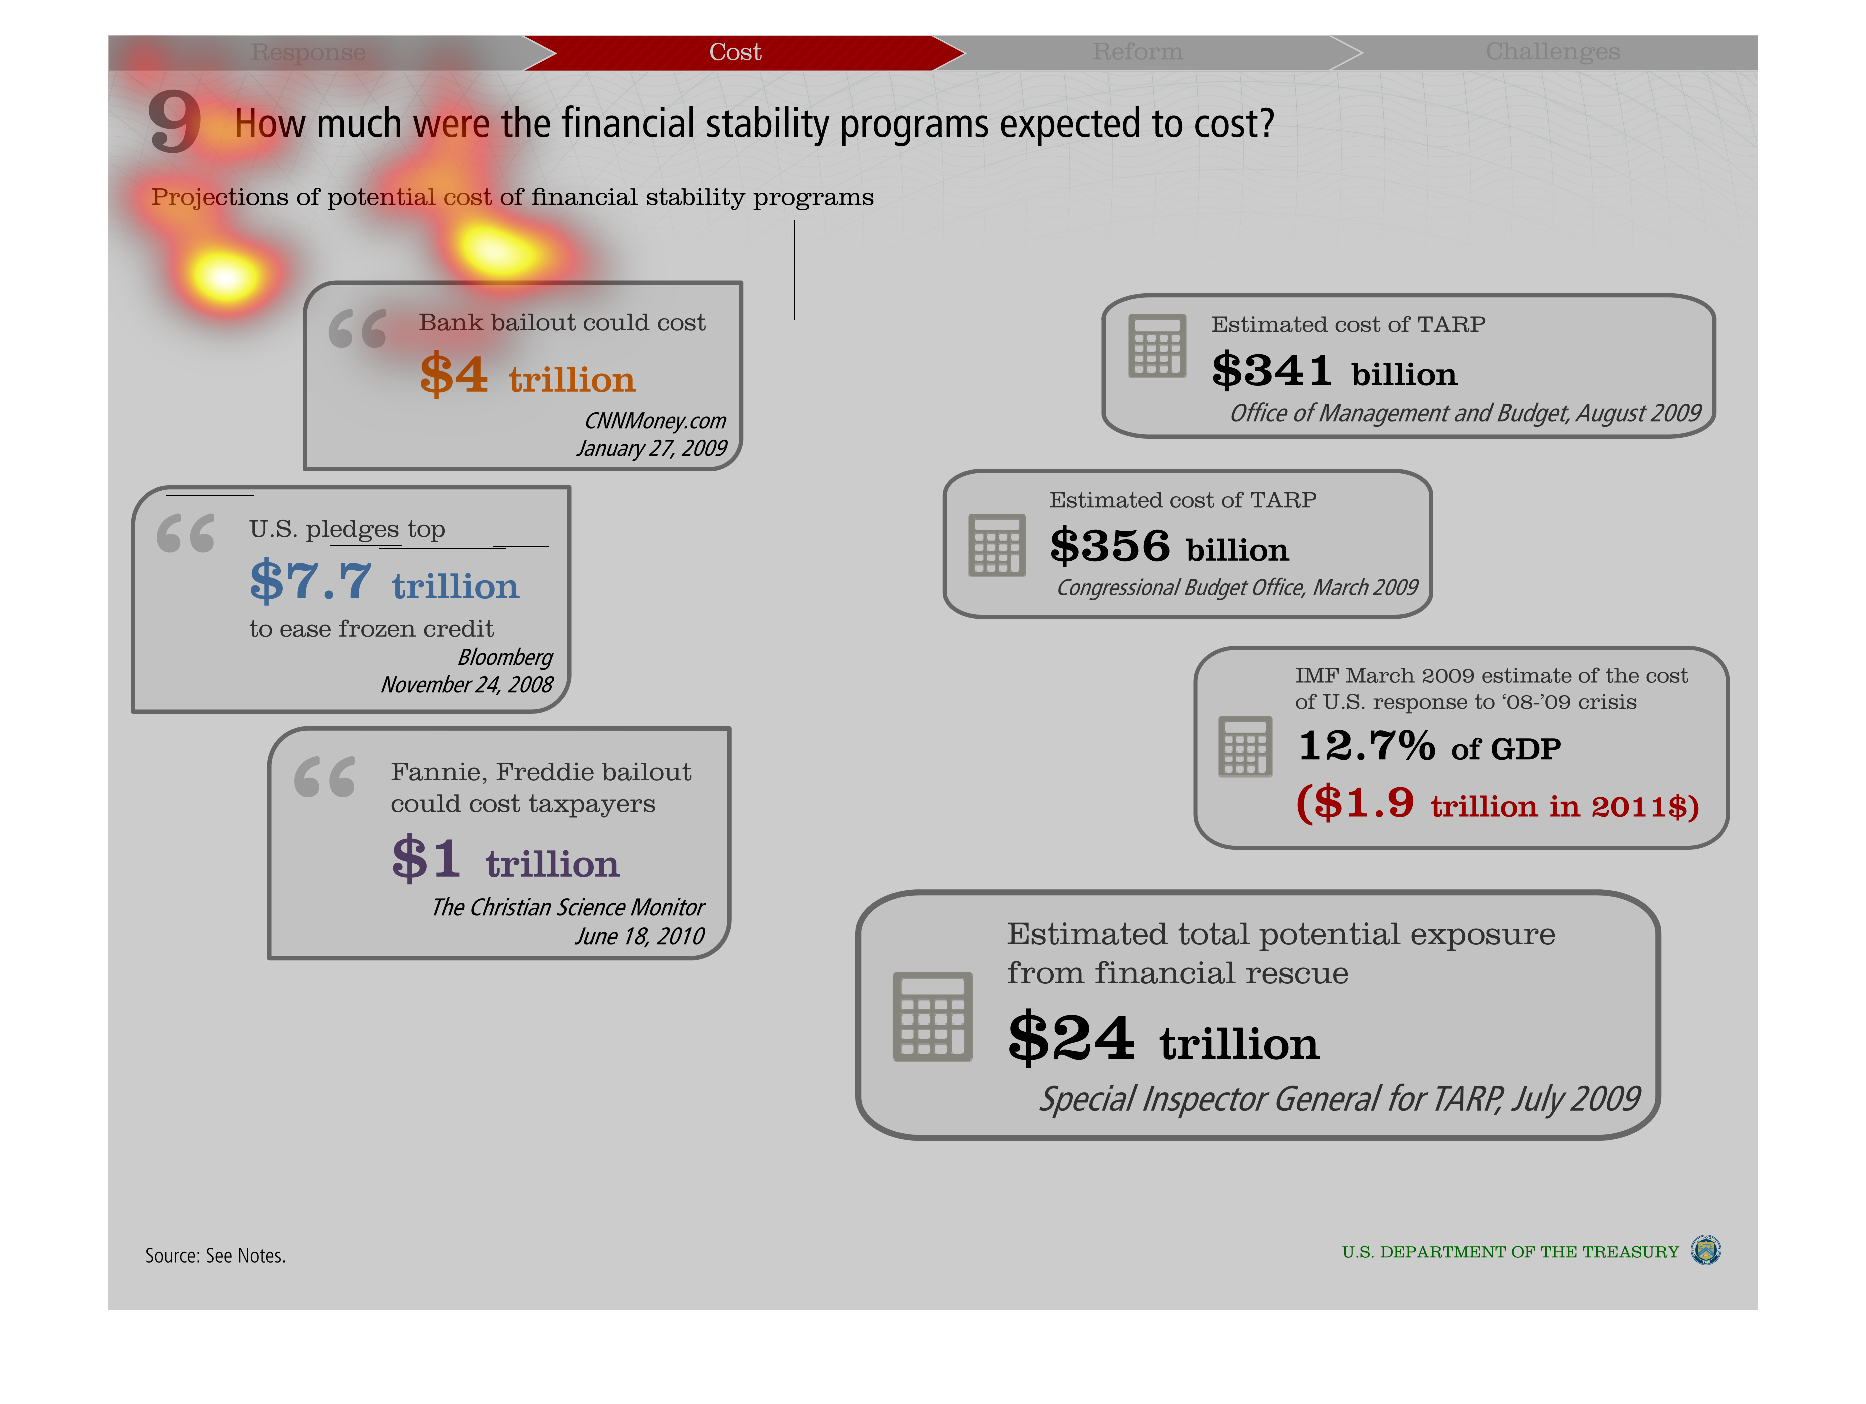
This chart states how much were the financial stability programs. Specifically projections
of potential cost of financial stability programs across the US.
Warning: Image is too big to fit on screen; displaying at 50%
Warning: Image is too big to fit on screen; displaying at 50%
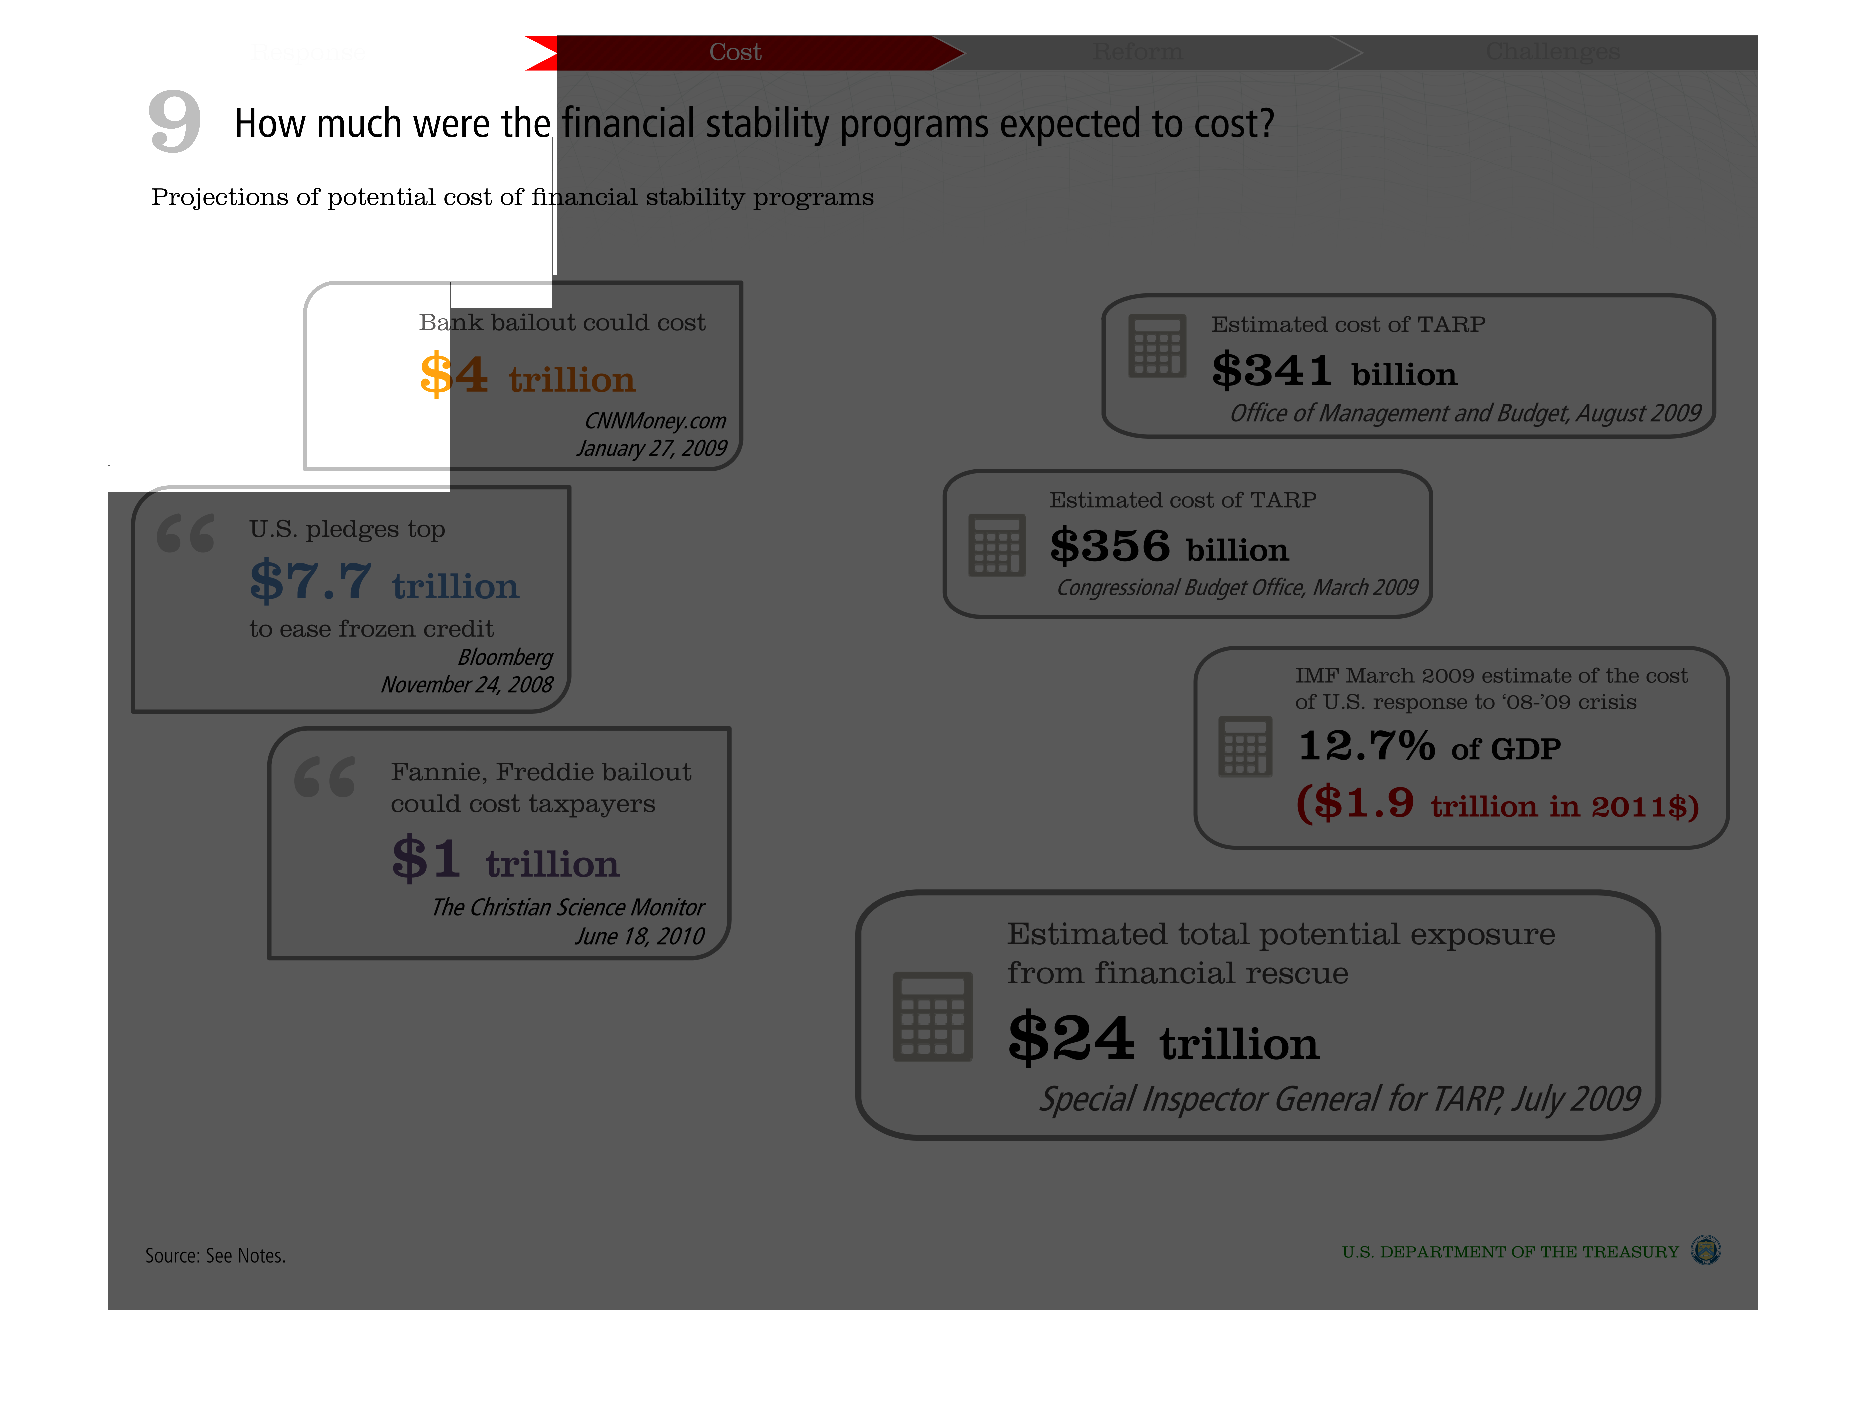
This image shows the predicted financial costs of the financial stability programs. Each program
estimates several trillion dollars based on the shown predictions.
Warning: Image is too big to fit on screen; displaying at 50%
Warning: Image is too big to fit on screen; displaying at 50%
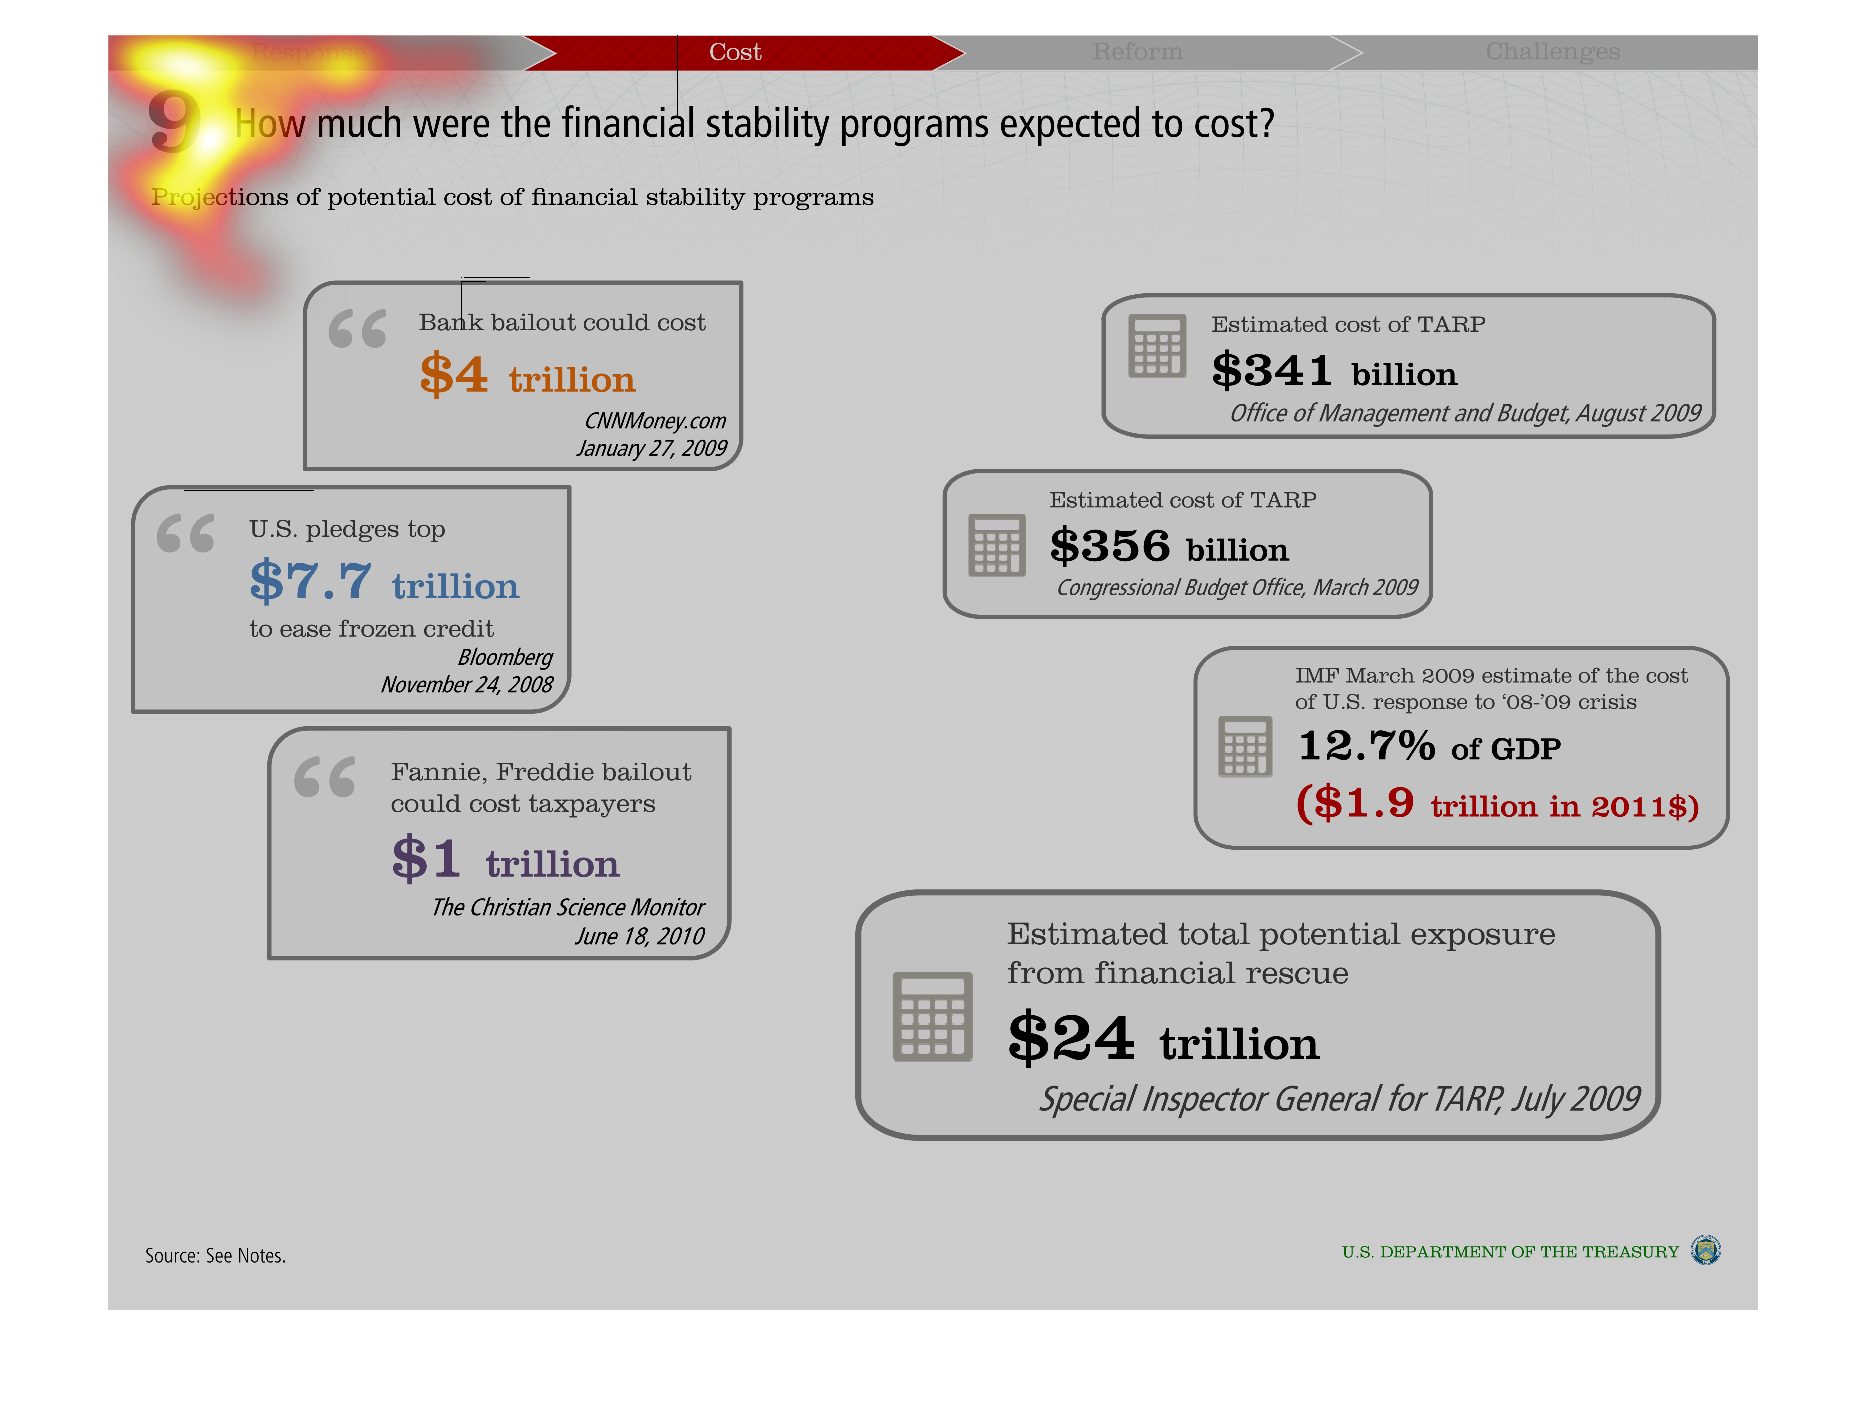
This chart is about how much financial stability programs are supposed to cost, according
to different sources. The highest estimation is 4 trillion dollars.
Warning: Image is too big to fit on screen; displaying at 50%
Warning: Image is too big to fit on screen; displaying at 50%

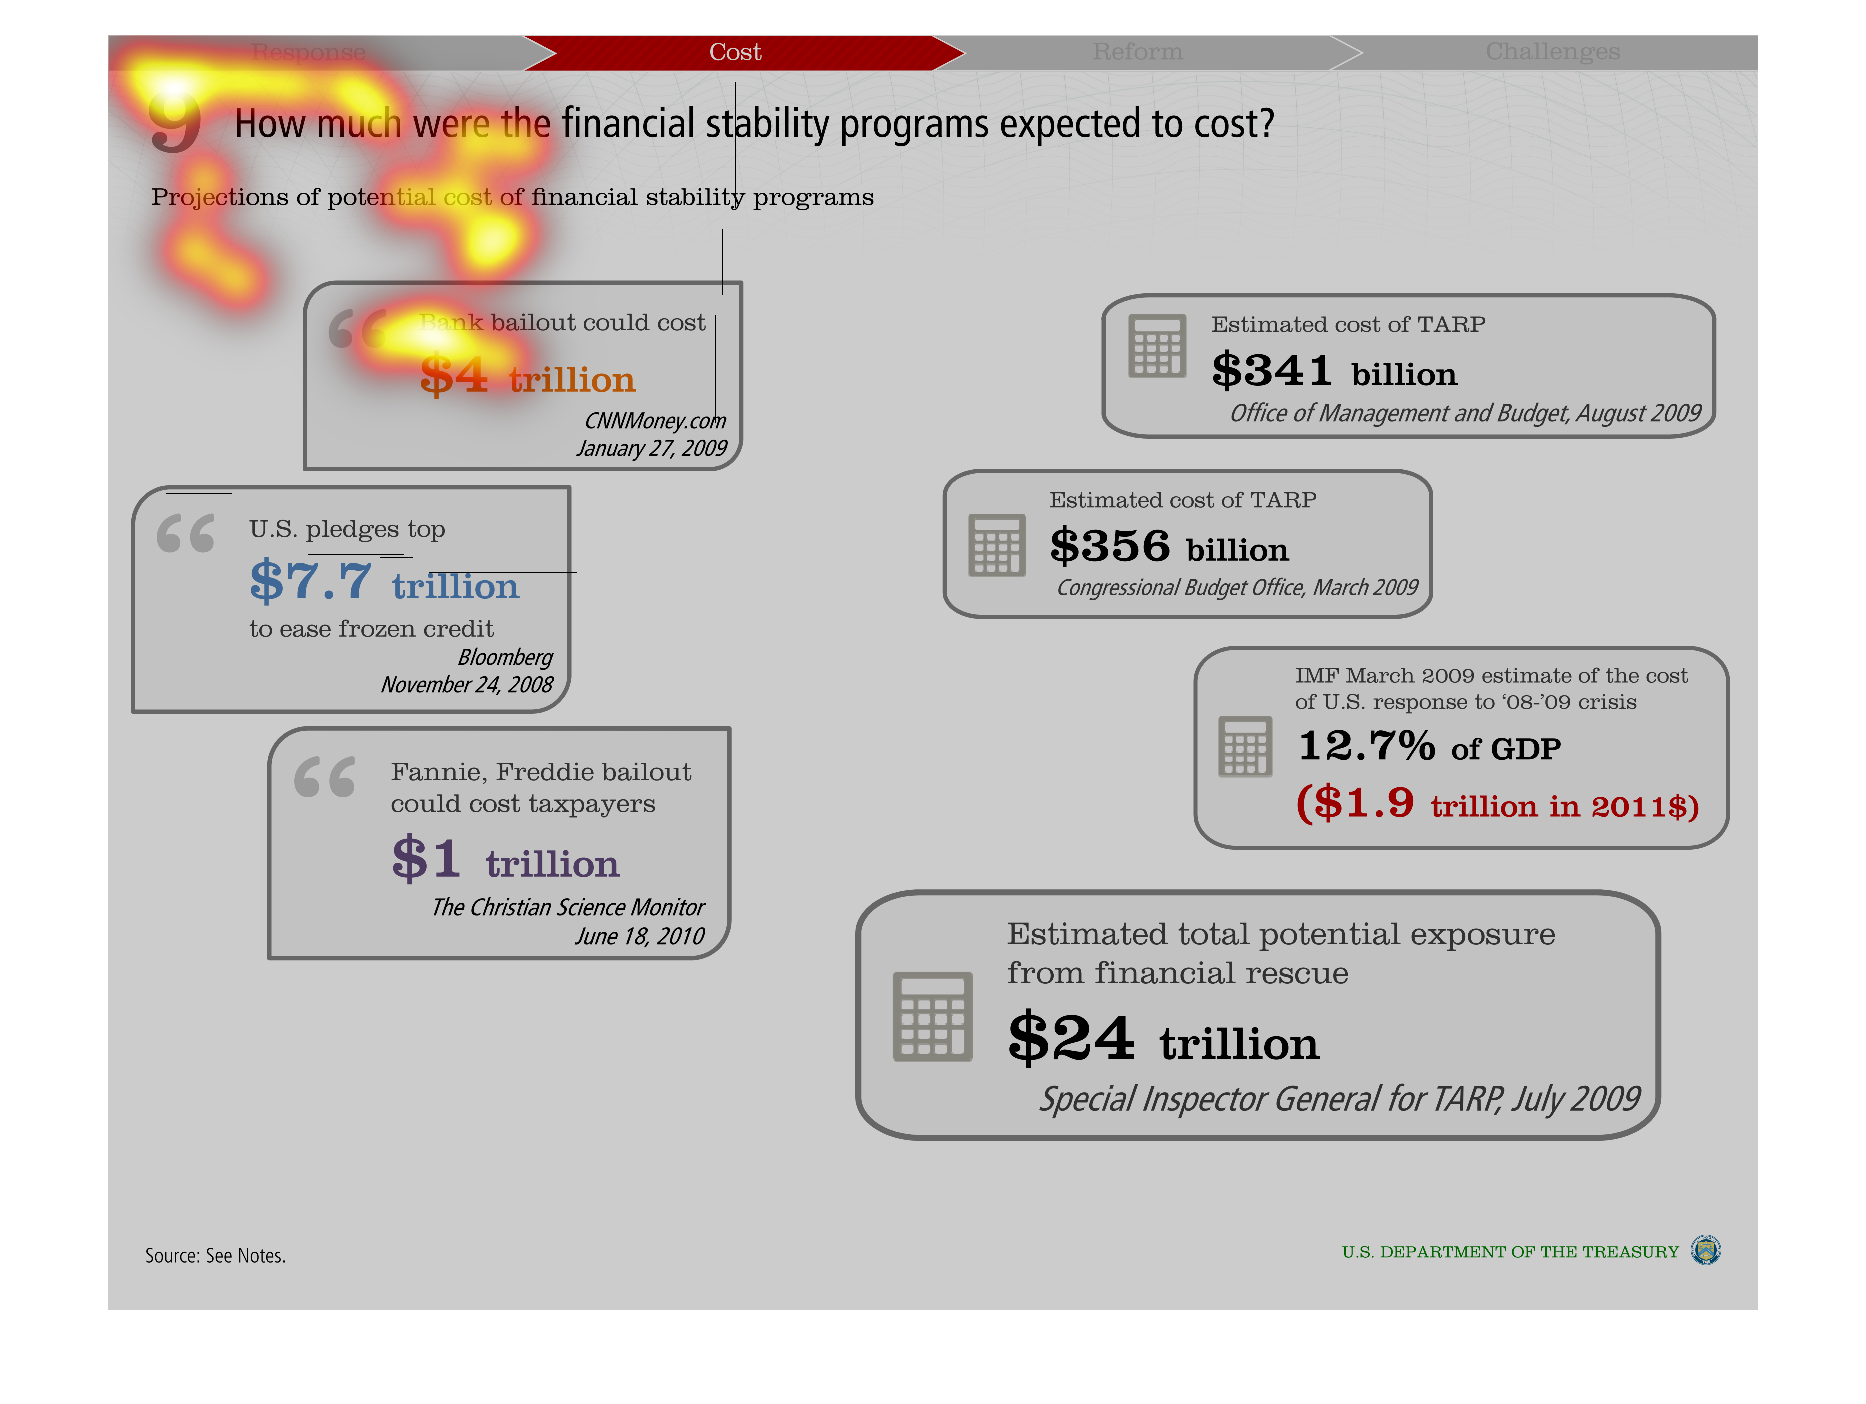
An infograph looking at how much financial stability programs were expected to cost. Each
box provides an estimate (with sources) of how much the financial stability programs would
cost, most estimates within the trillion dollar/multi billion dollar range.
Warning: Image is too big to fit on screen; displaying at 50%
Warning: Image is too big to fit on screen; displaying at 50%

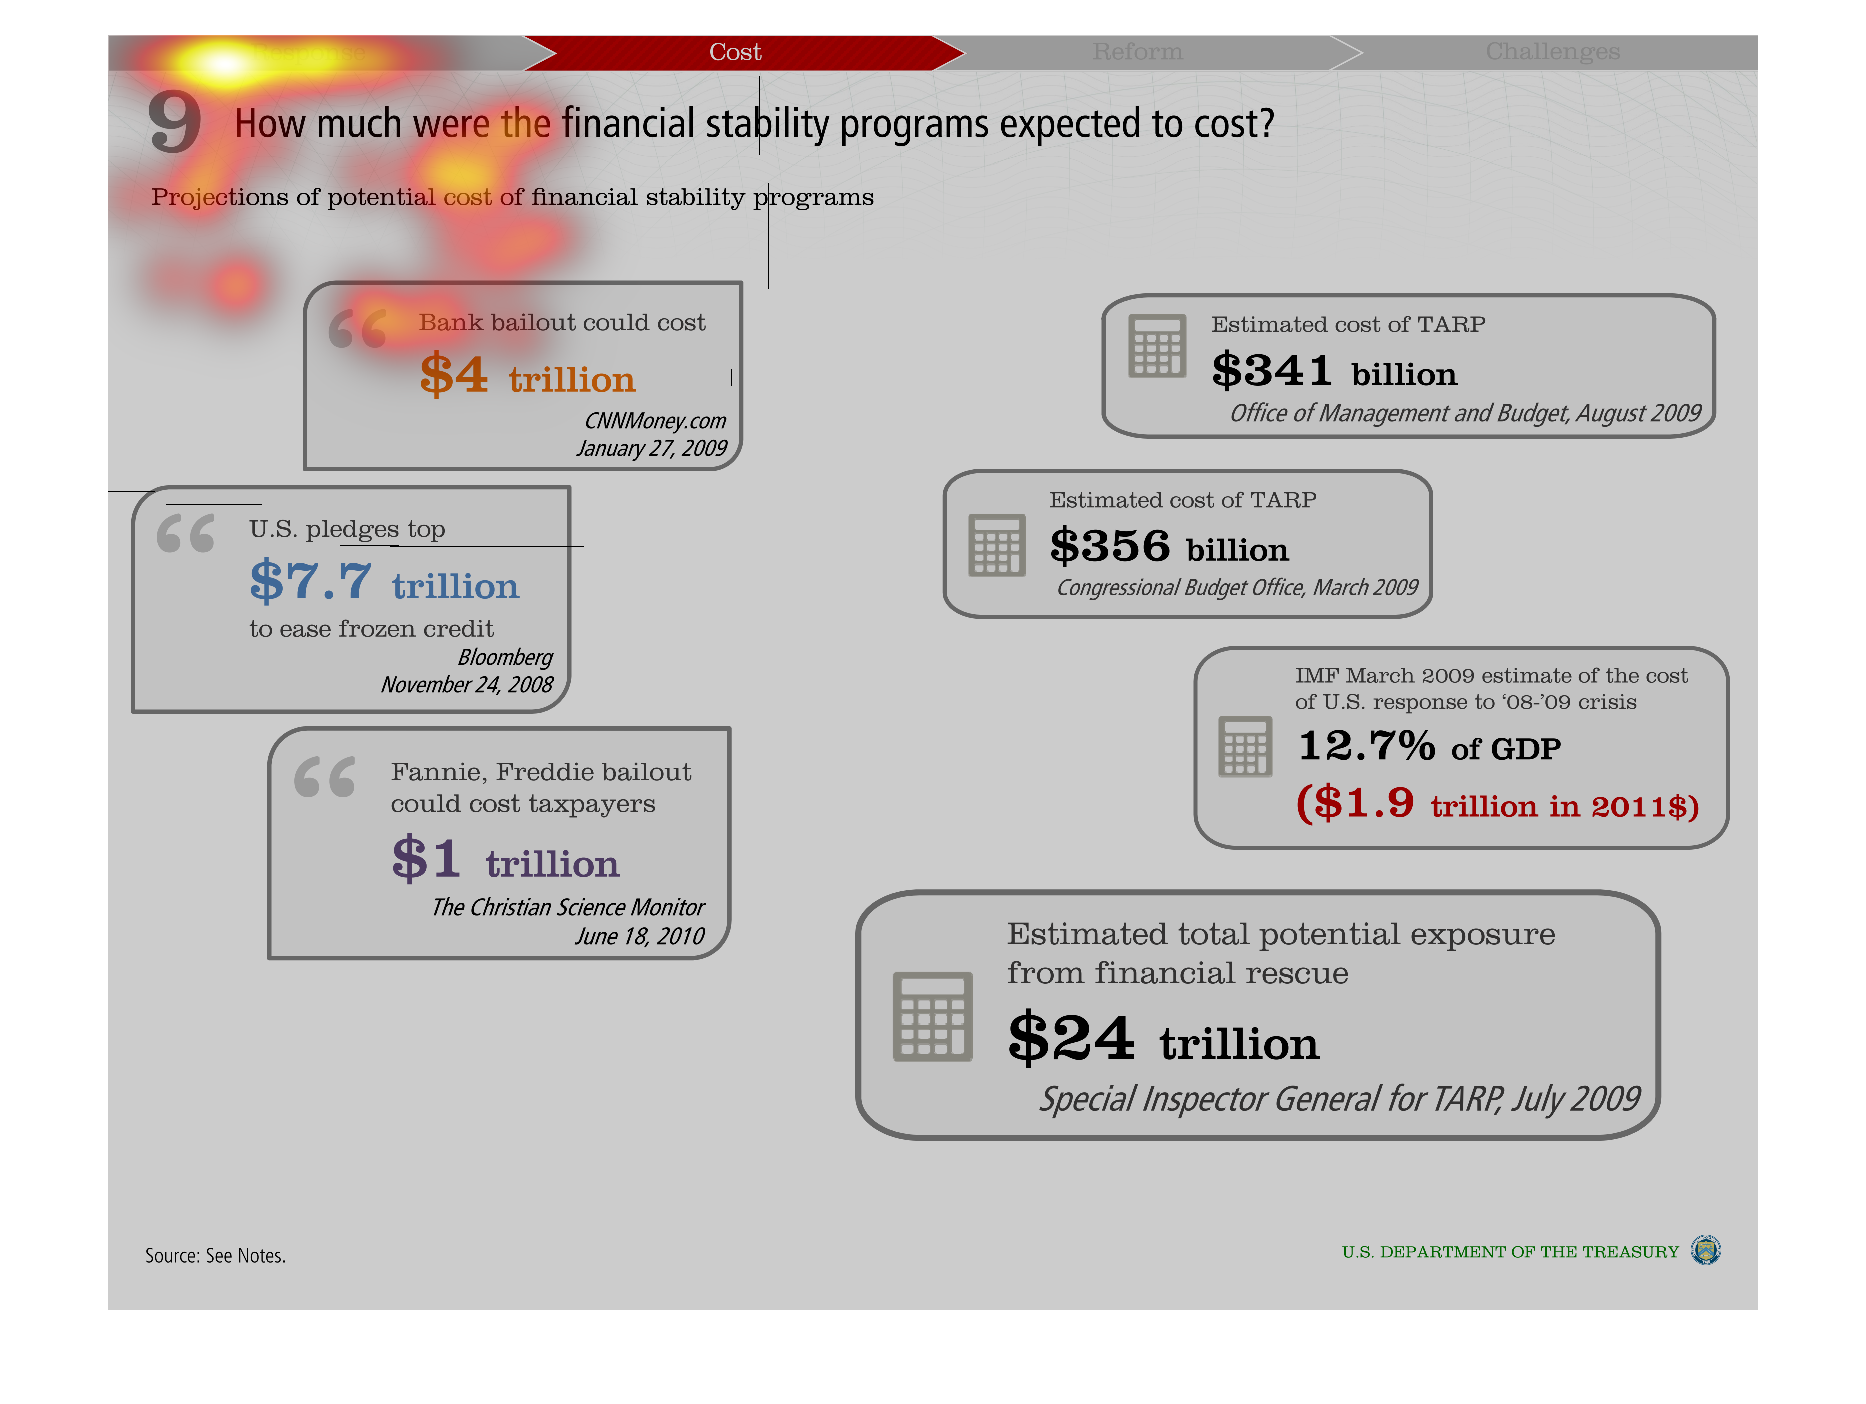
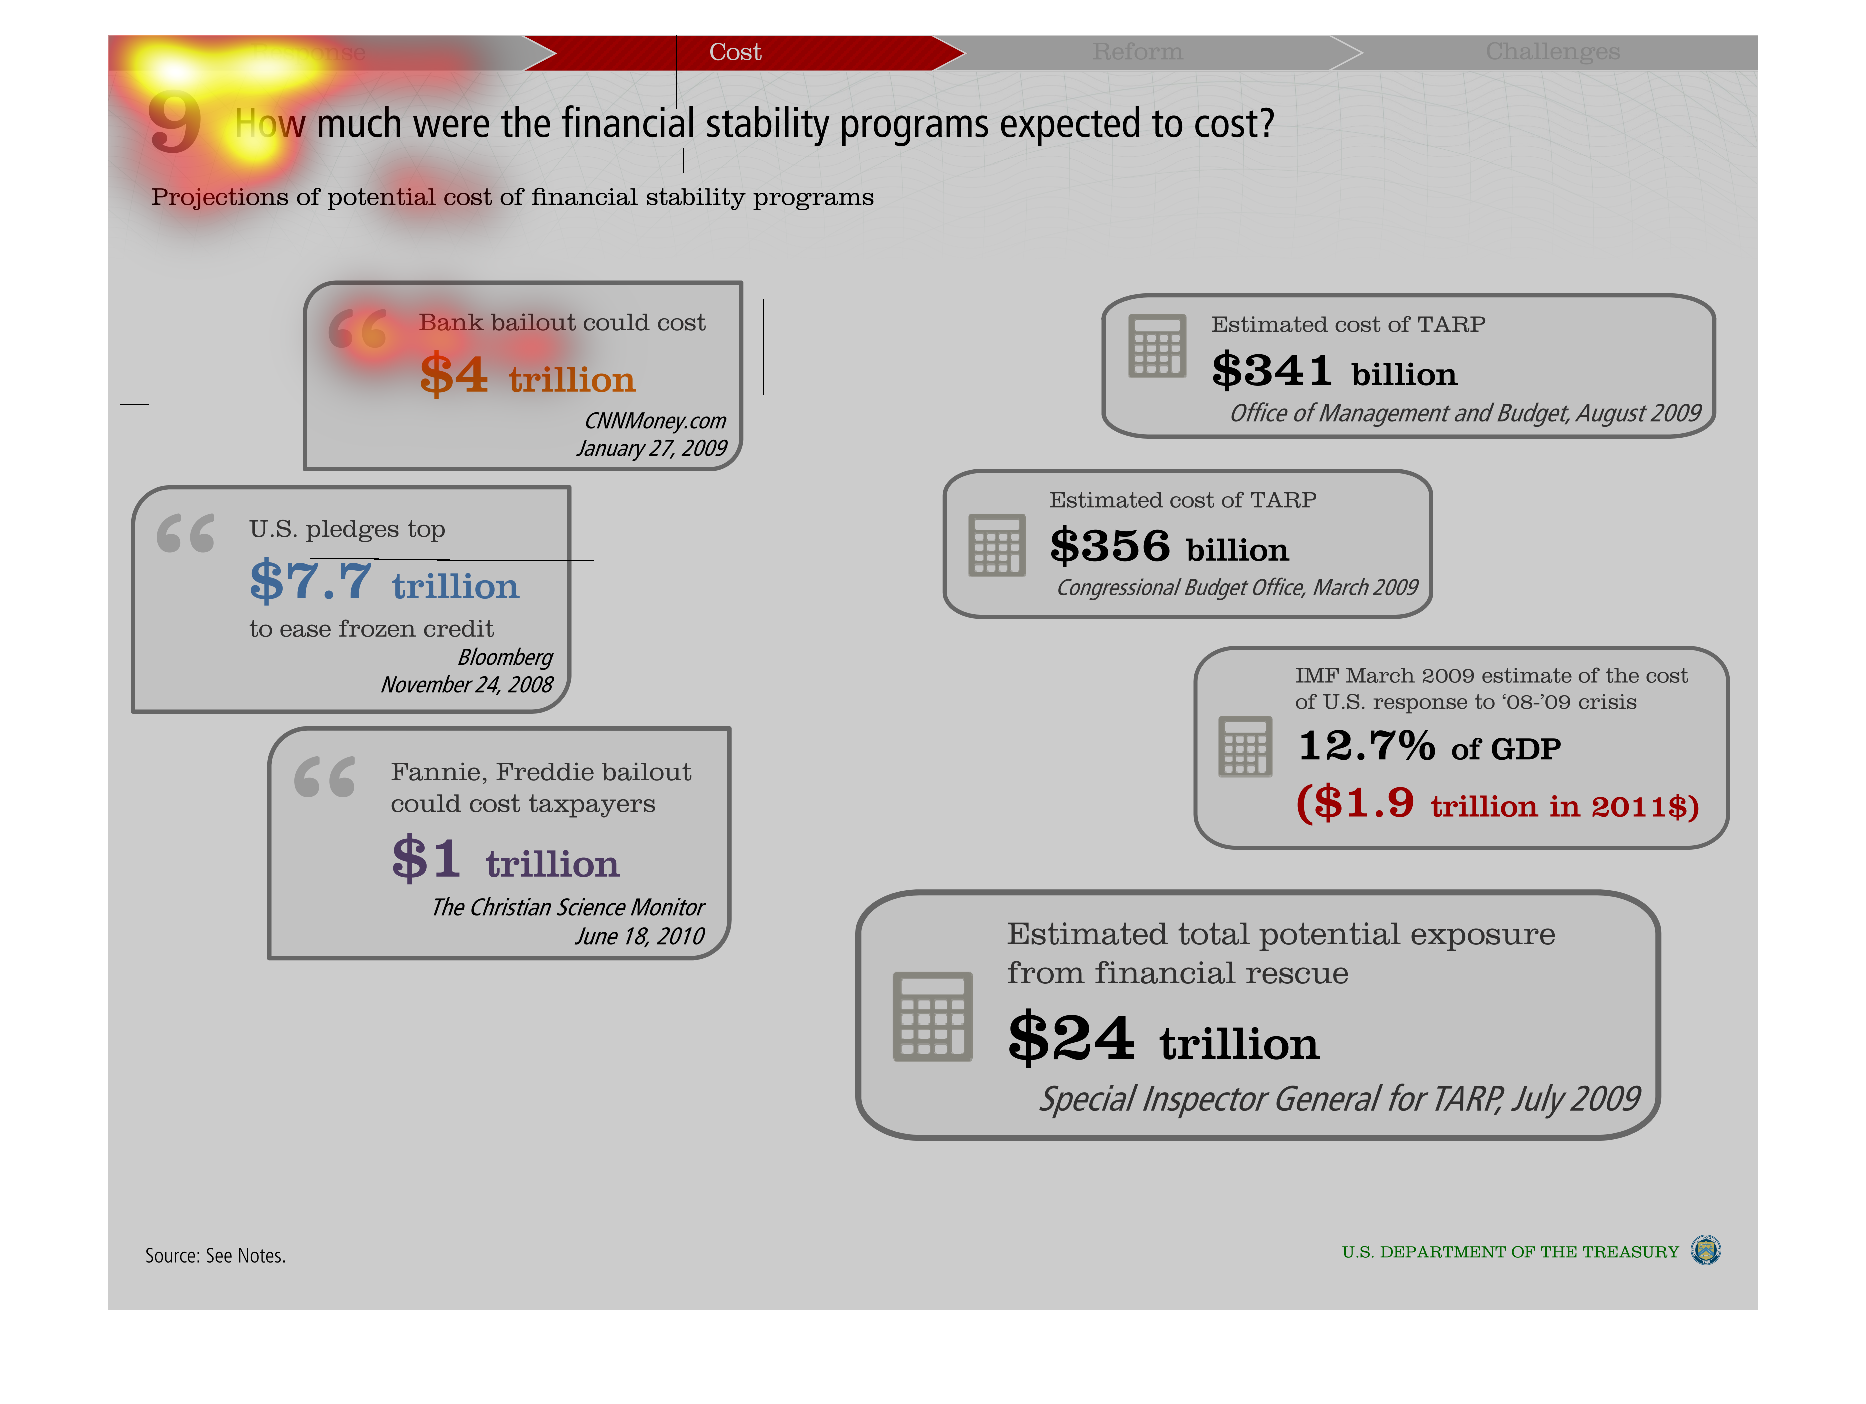
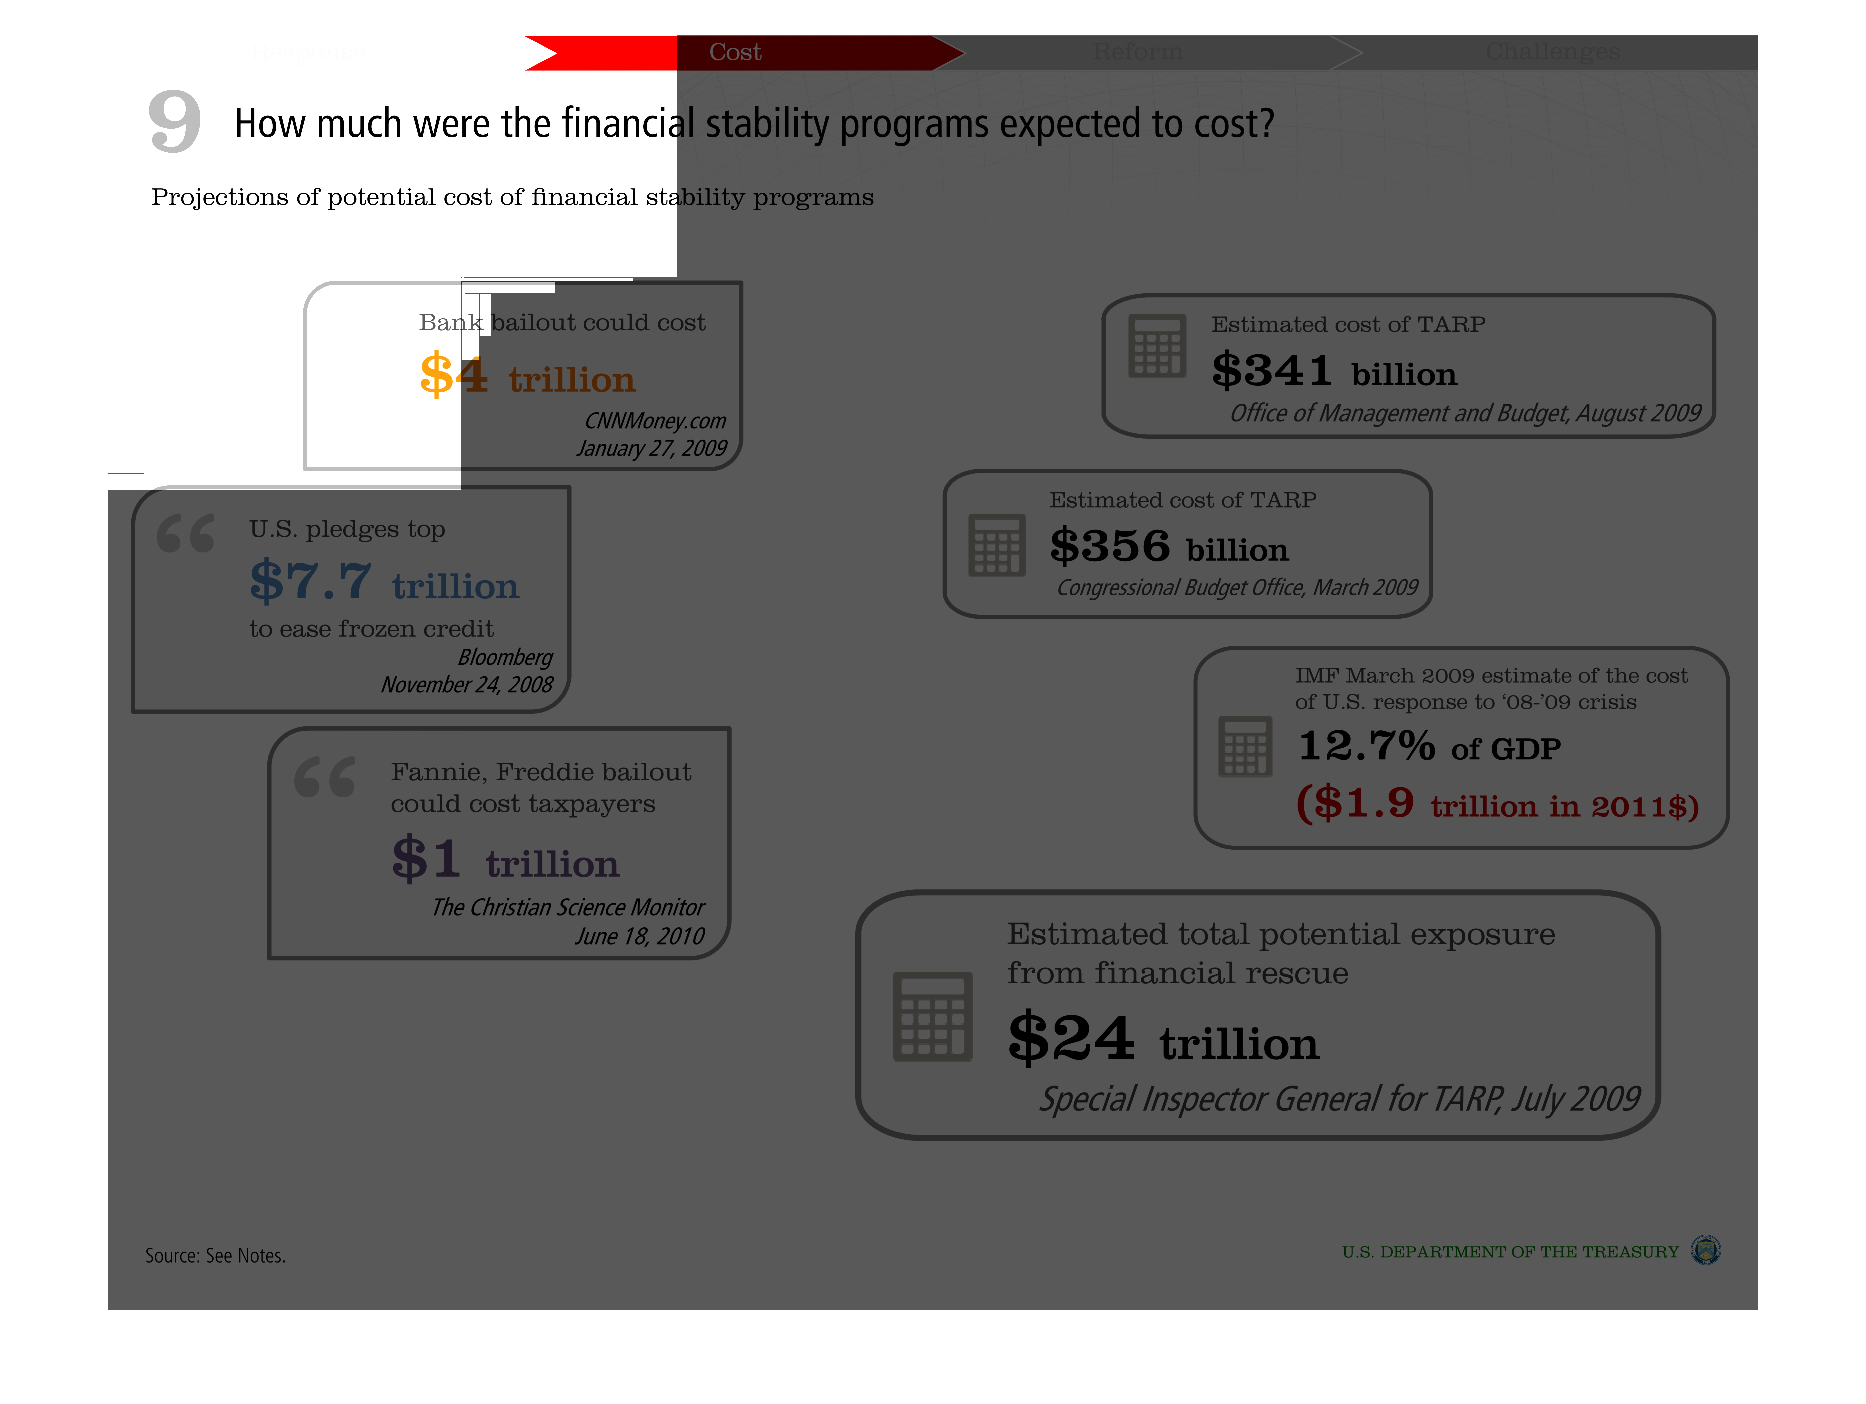
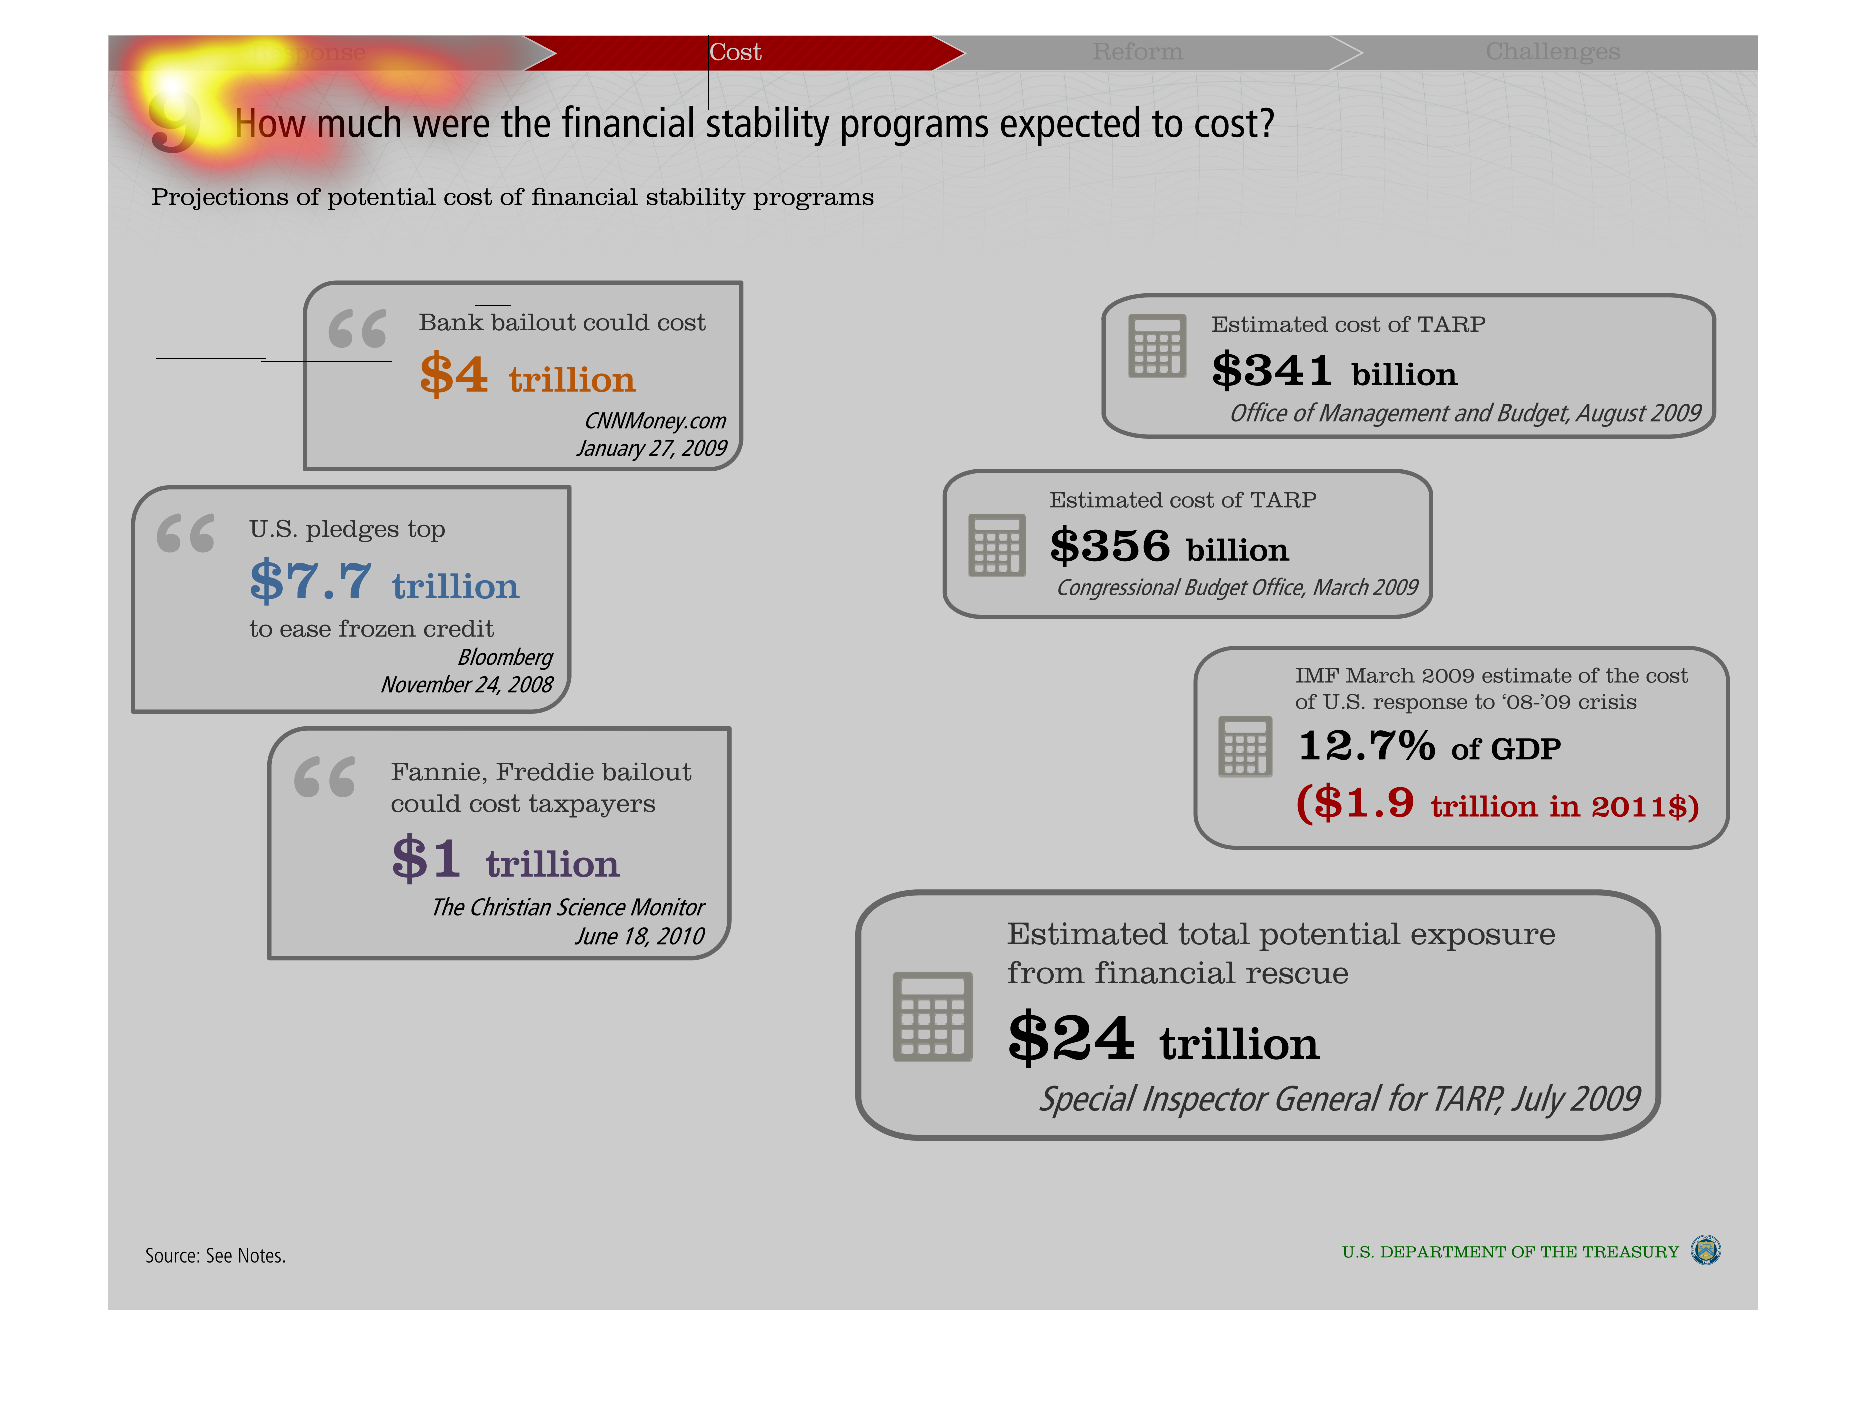
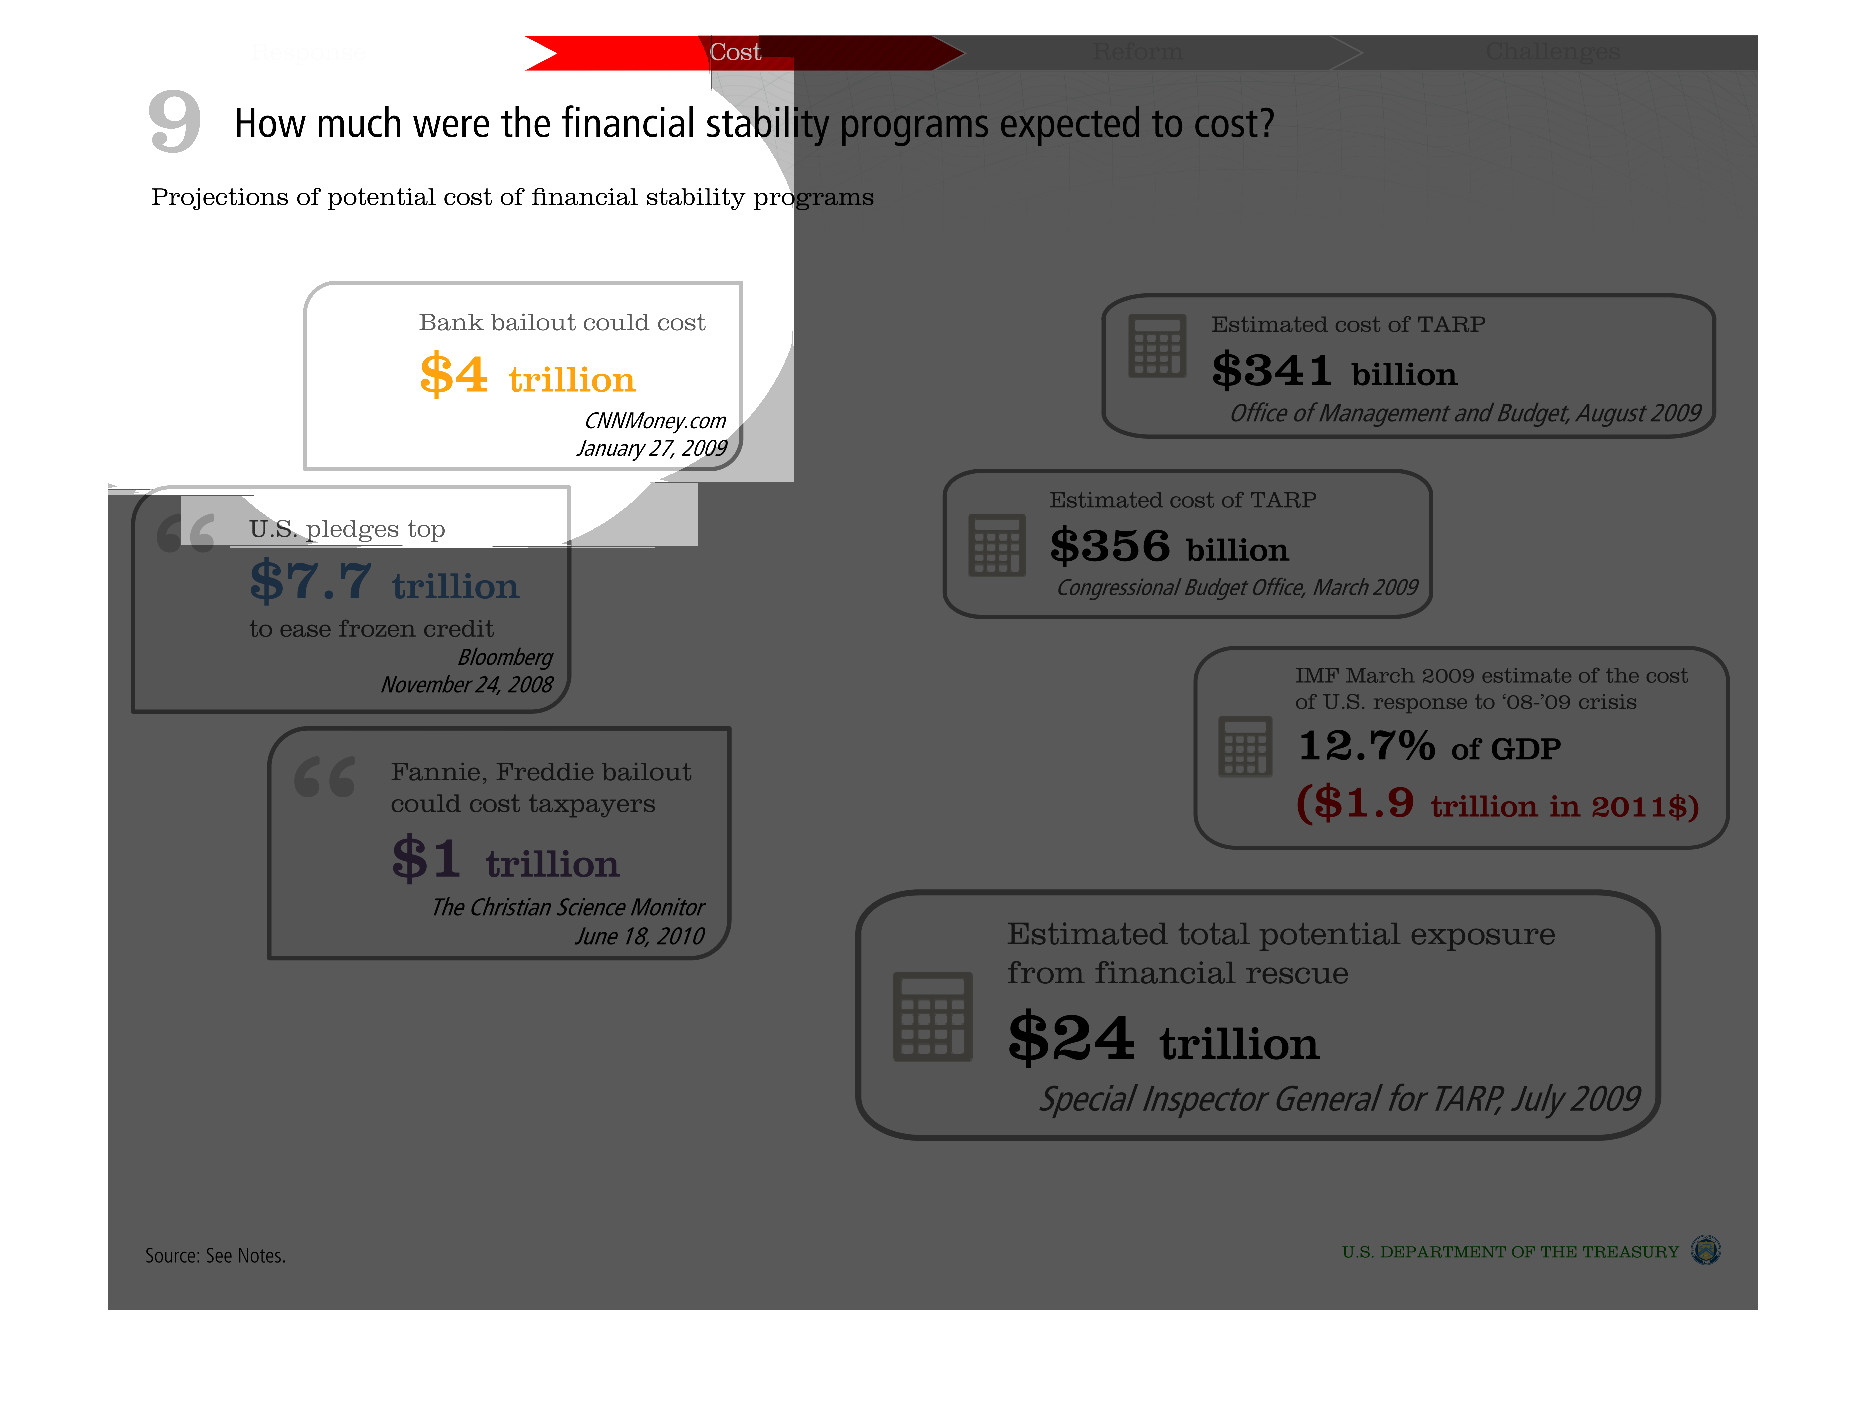
This infographic is a series of quotes pertaining to the cost of the financial stability programs
in the us. They are presented as text in speech bubbles, with attributions included.
Warning: Image is too big to fit on screen; displaying at 50%
Warning: Image is too big to fit on screen; displaying at 50%
how much were the financial stability programs expected to cost? unfortunately I cannot read
this infographic at all so im just gonna fill in the space
Warning: Image is too big to fit on screen; displaying at 50%
Warning: Image is too big to fit on screen; displaying at 50%
This is a chart showing how much the financial stability programs are expected to cost. It
shows several different markets/sectors and associated costs to each.
Warning: Image is too big to fit on screen; displaying at 50%
Warning: Image is too big to fit on screen; displaying at 50%
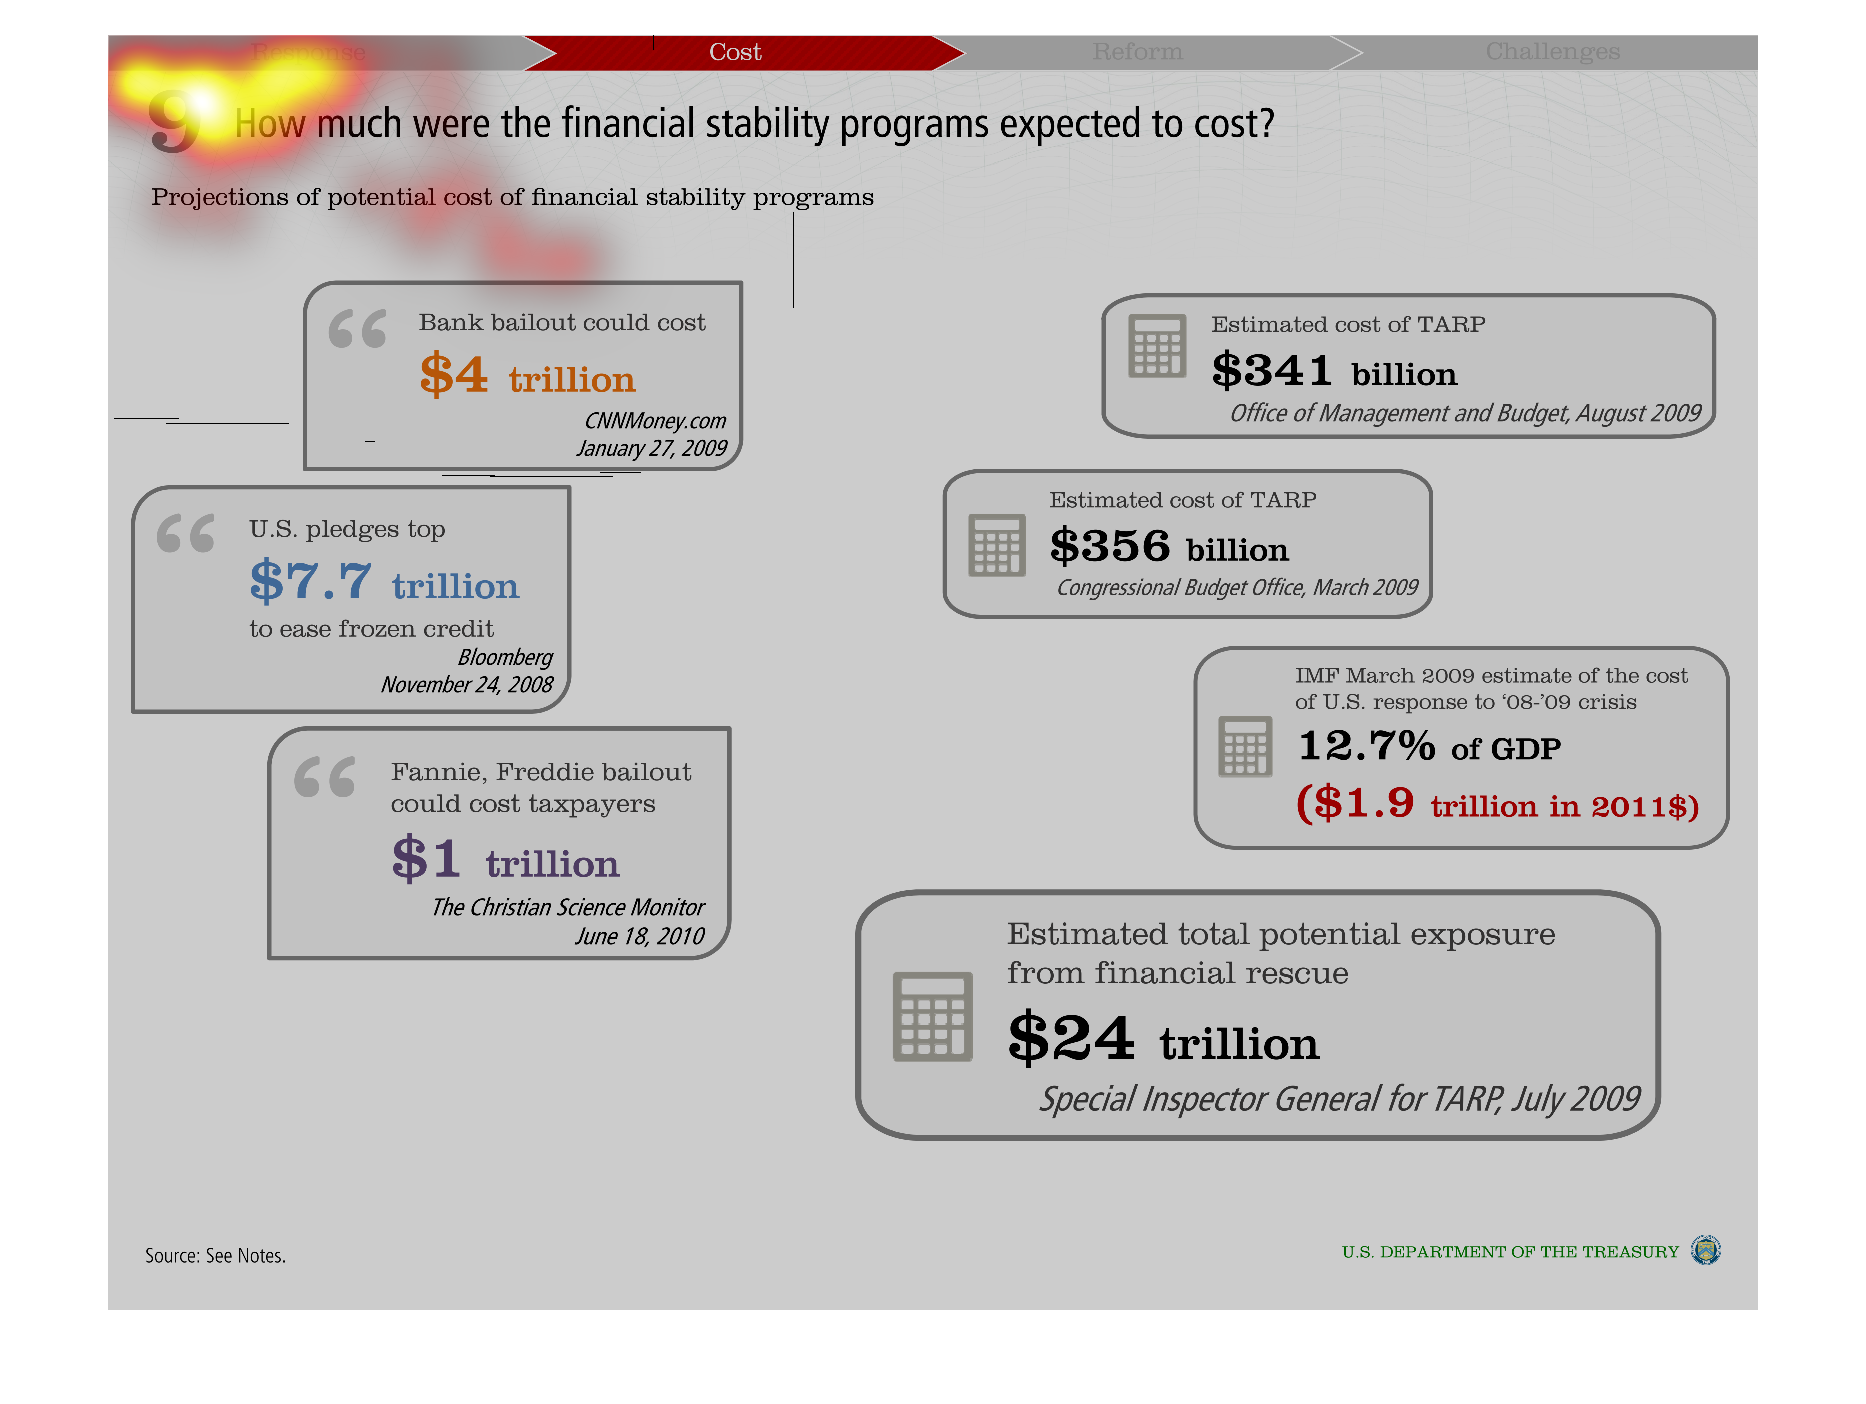
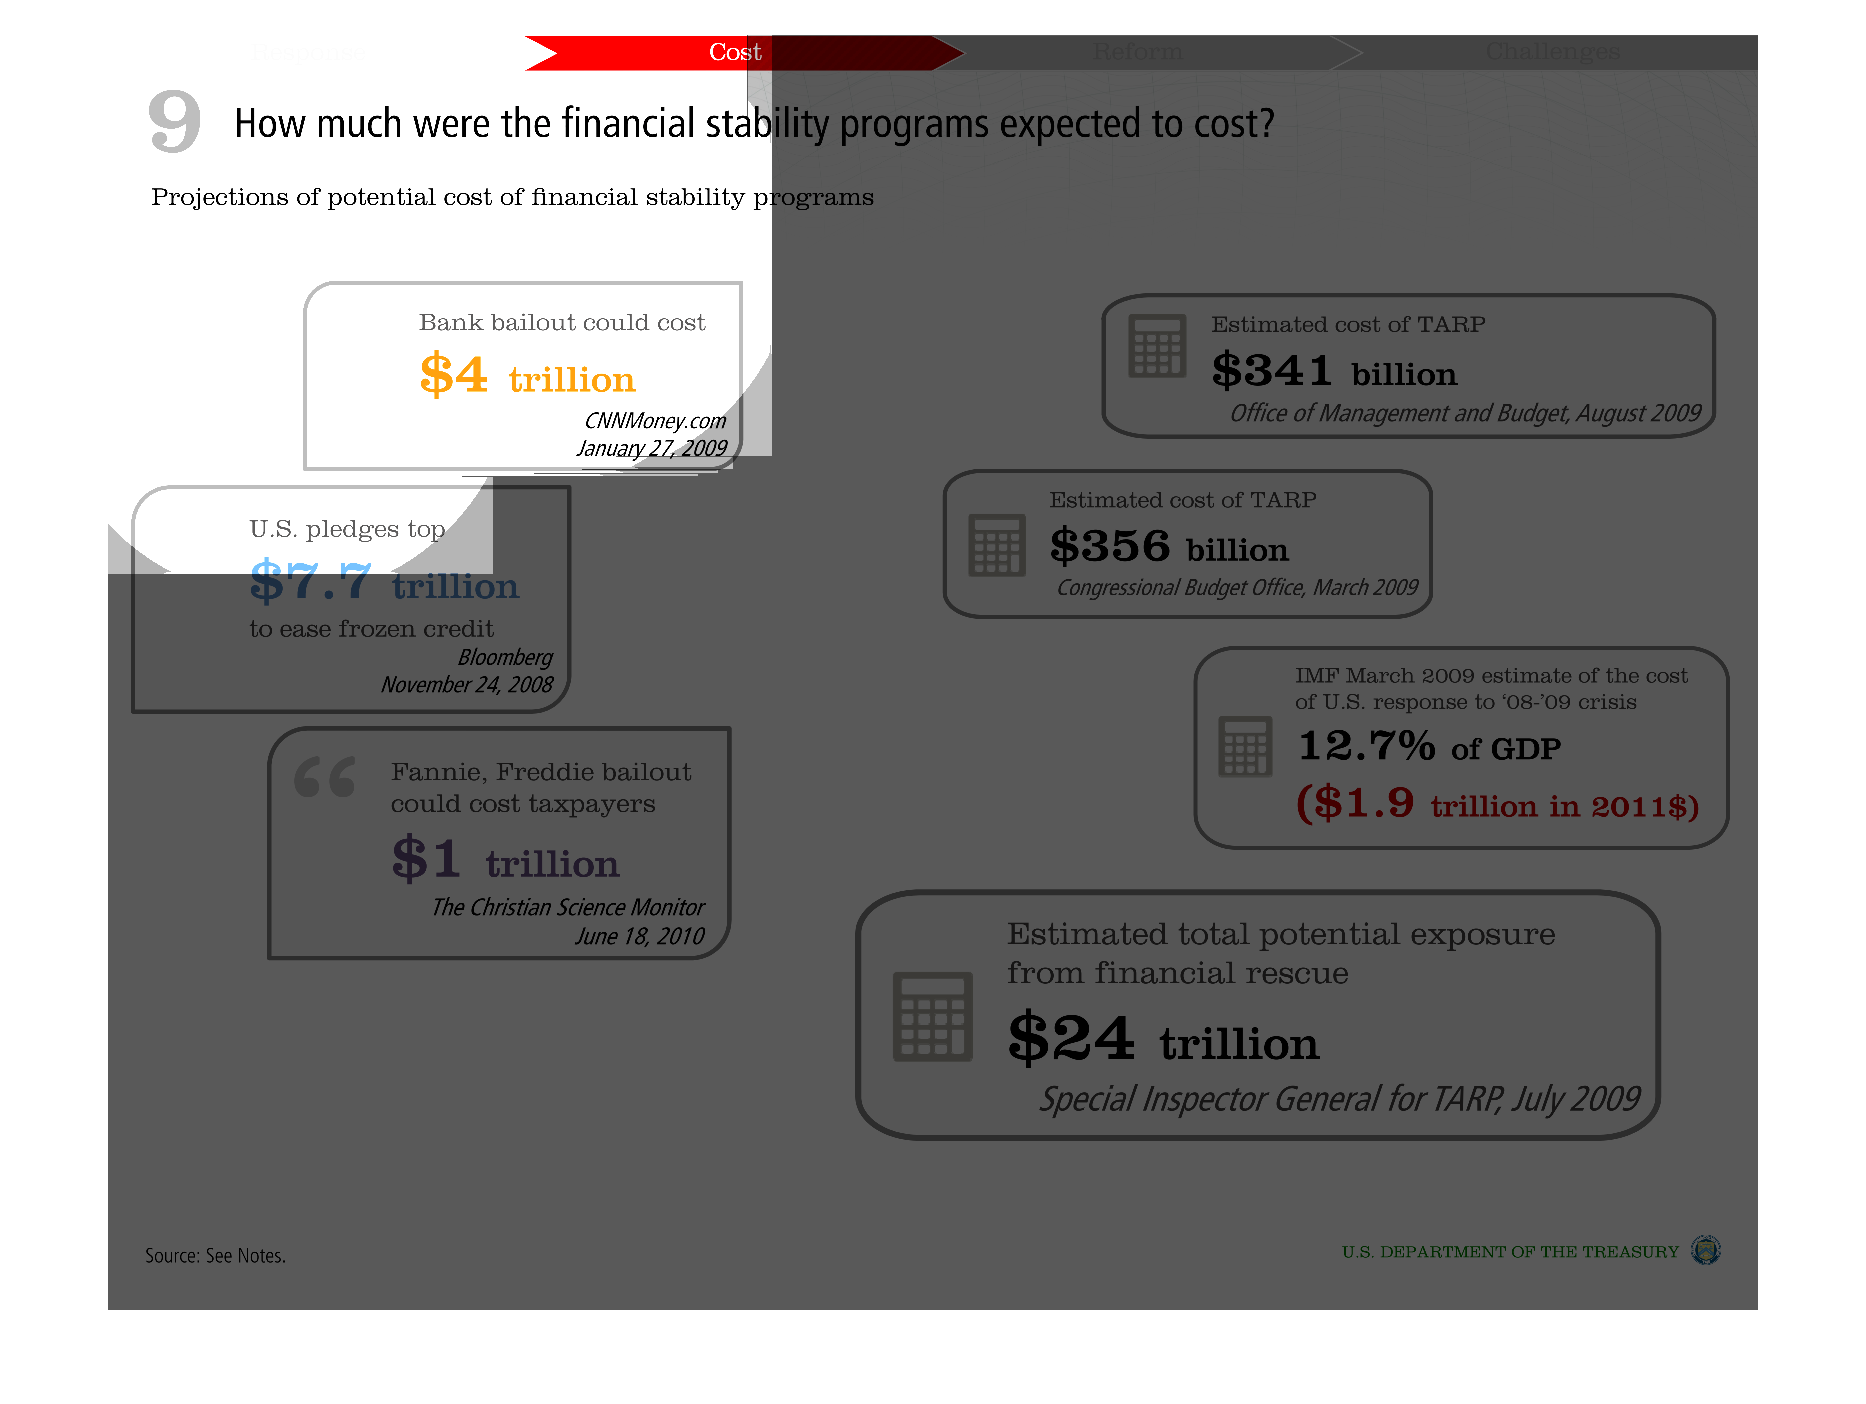
An info graphic showing the anticipated price of each financial stability program as estimated
by various sources like CNN. Costs of these programs range from hundreds of millions to even
trillions
Warning: Image is too big to fit on screen; displaying at 50%
Warning: Image is too big to fit on screen; displaying at 50%
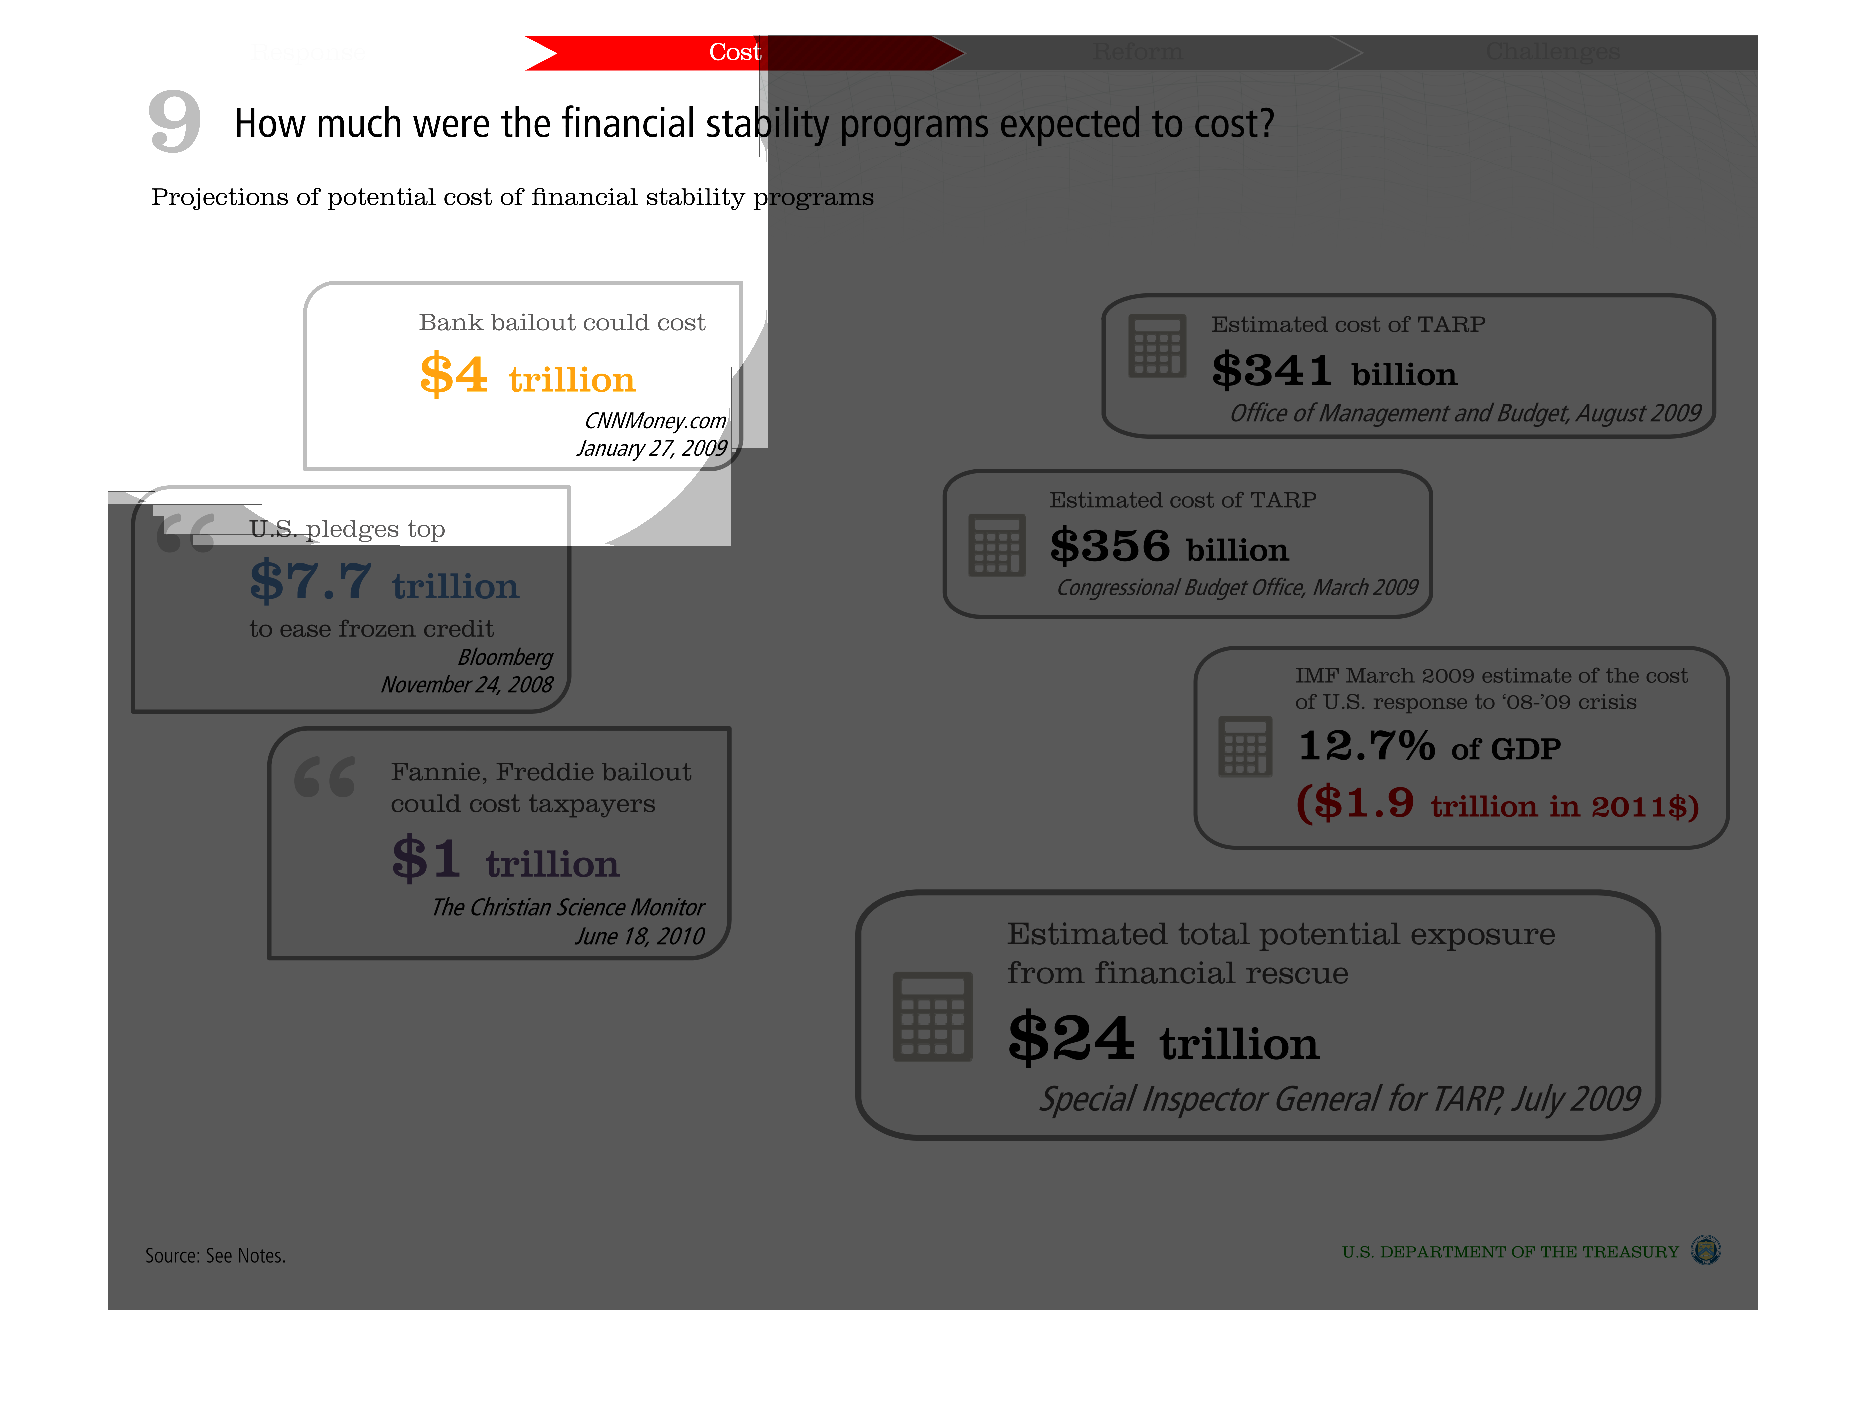
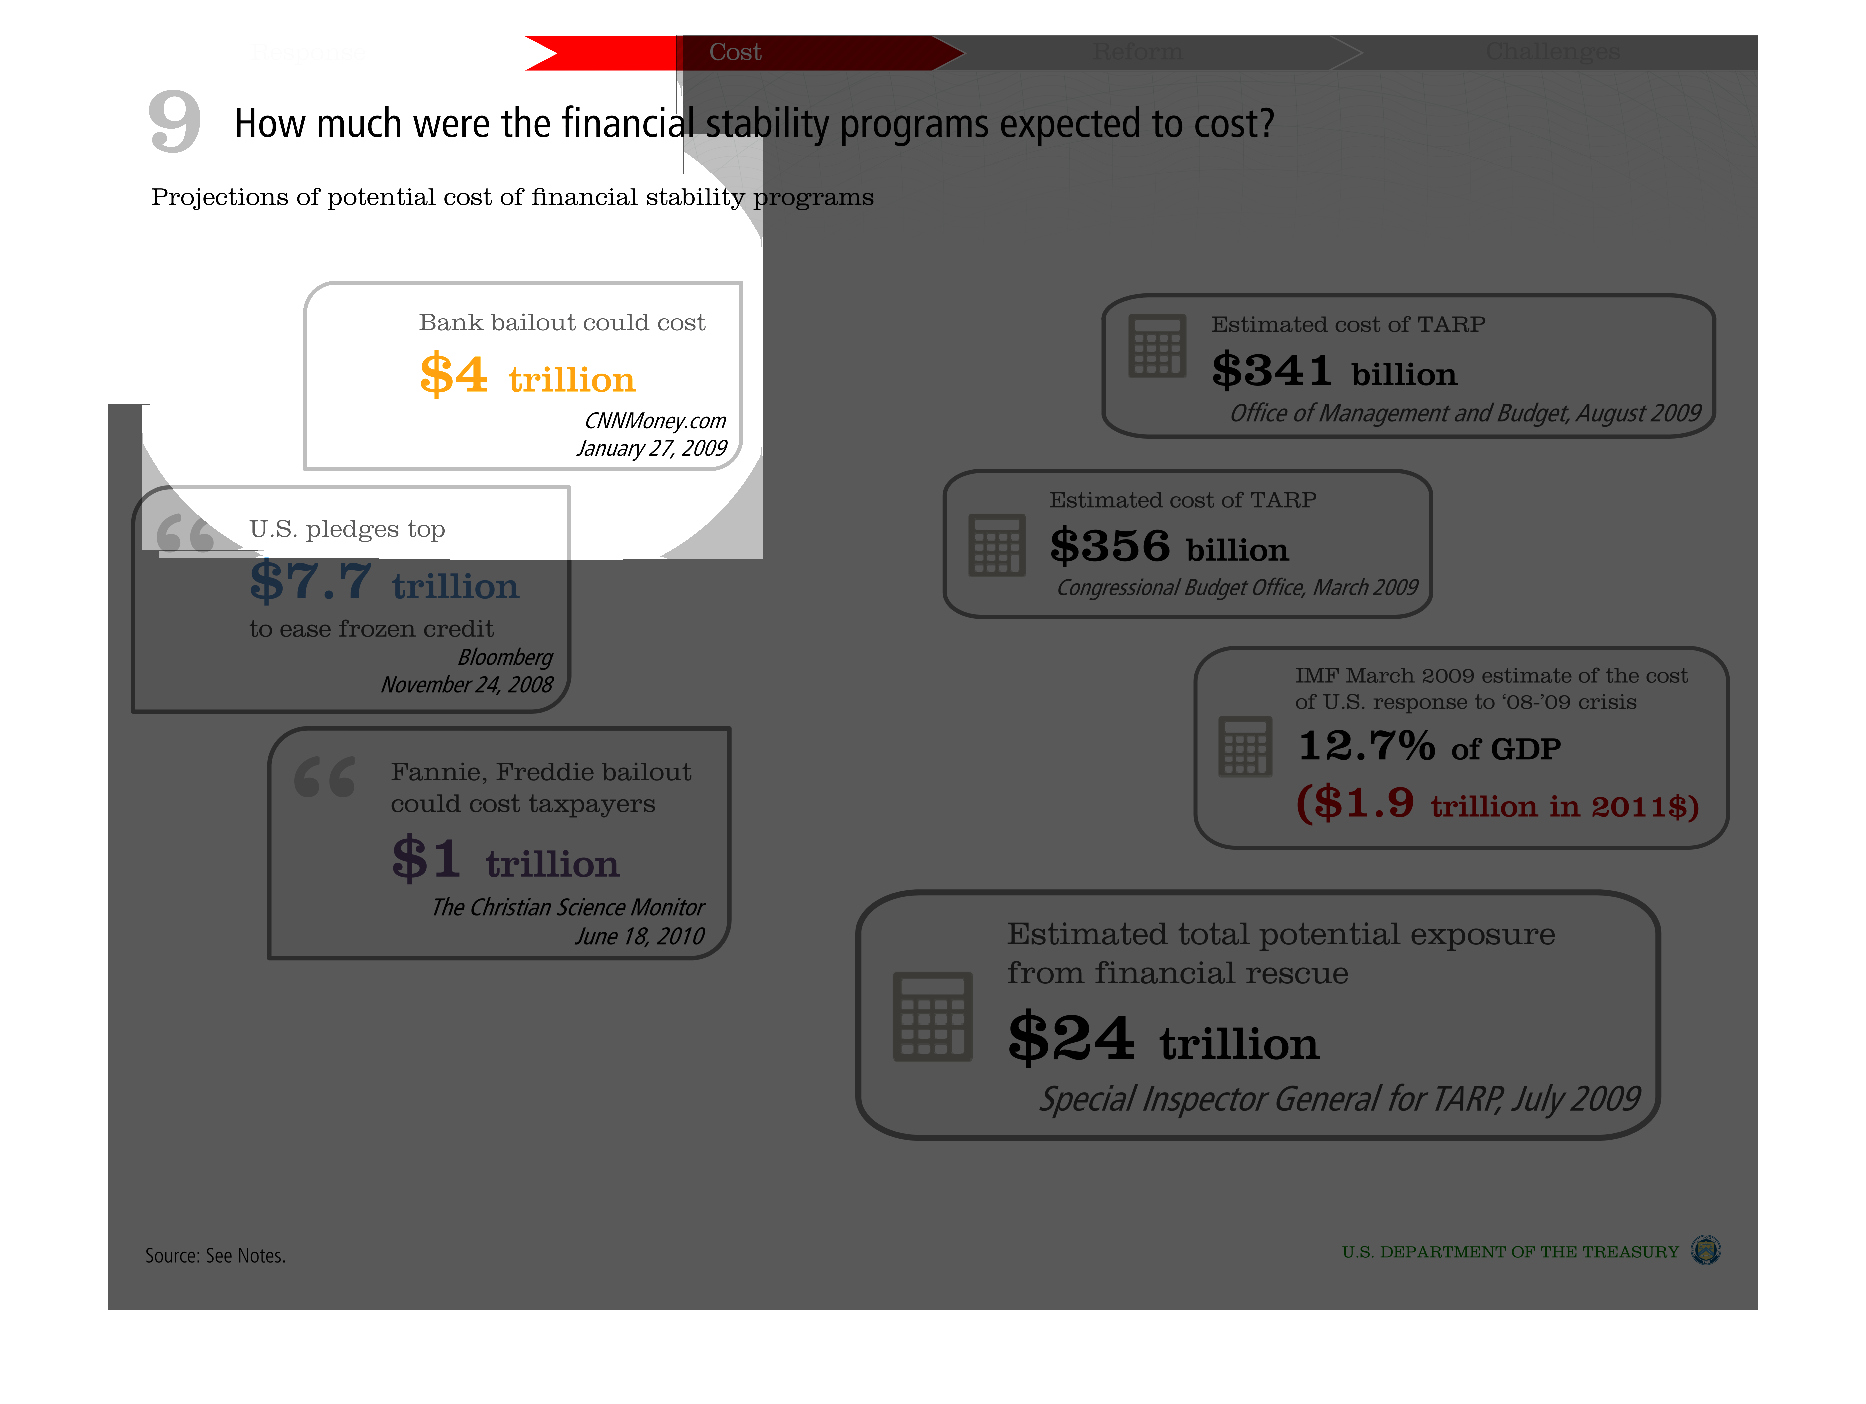
This shows the amount of money American tax payers will have to pay for the bank bailout.
It says that the bailout could end up costing 4 trillion dollars
Warning: Image is too big to fit on screen; displaying at 50%
Warning: Image is too big to fit on screen; displaying at 50%
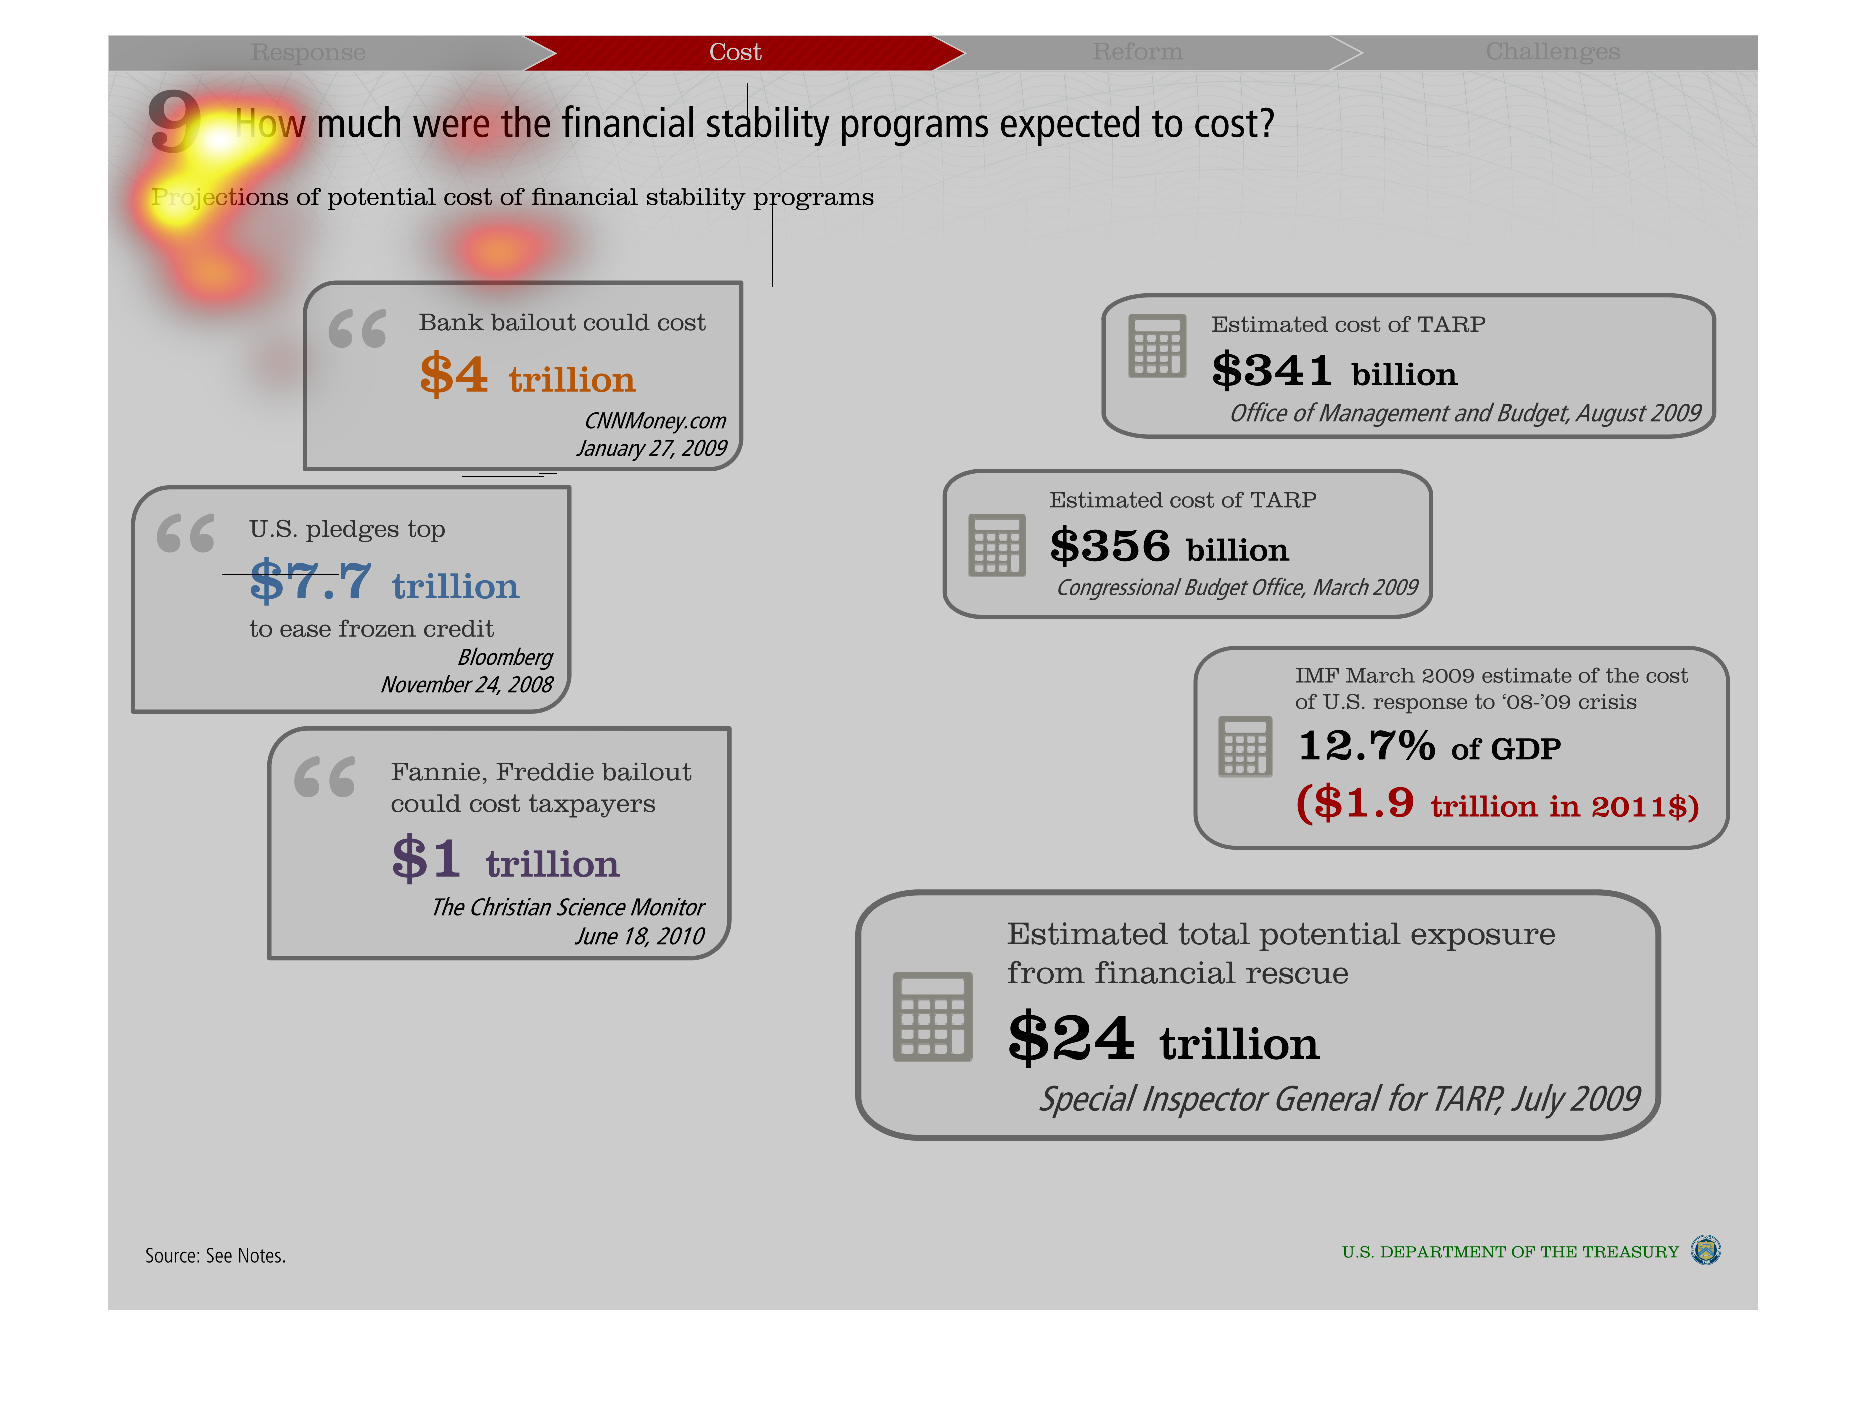
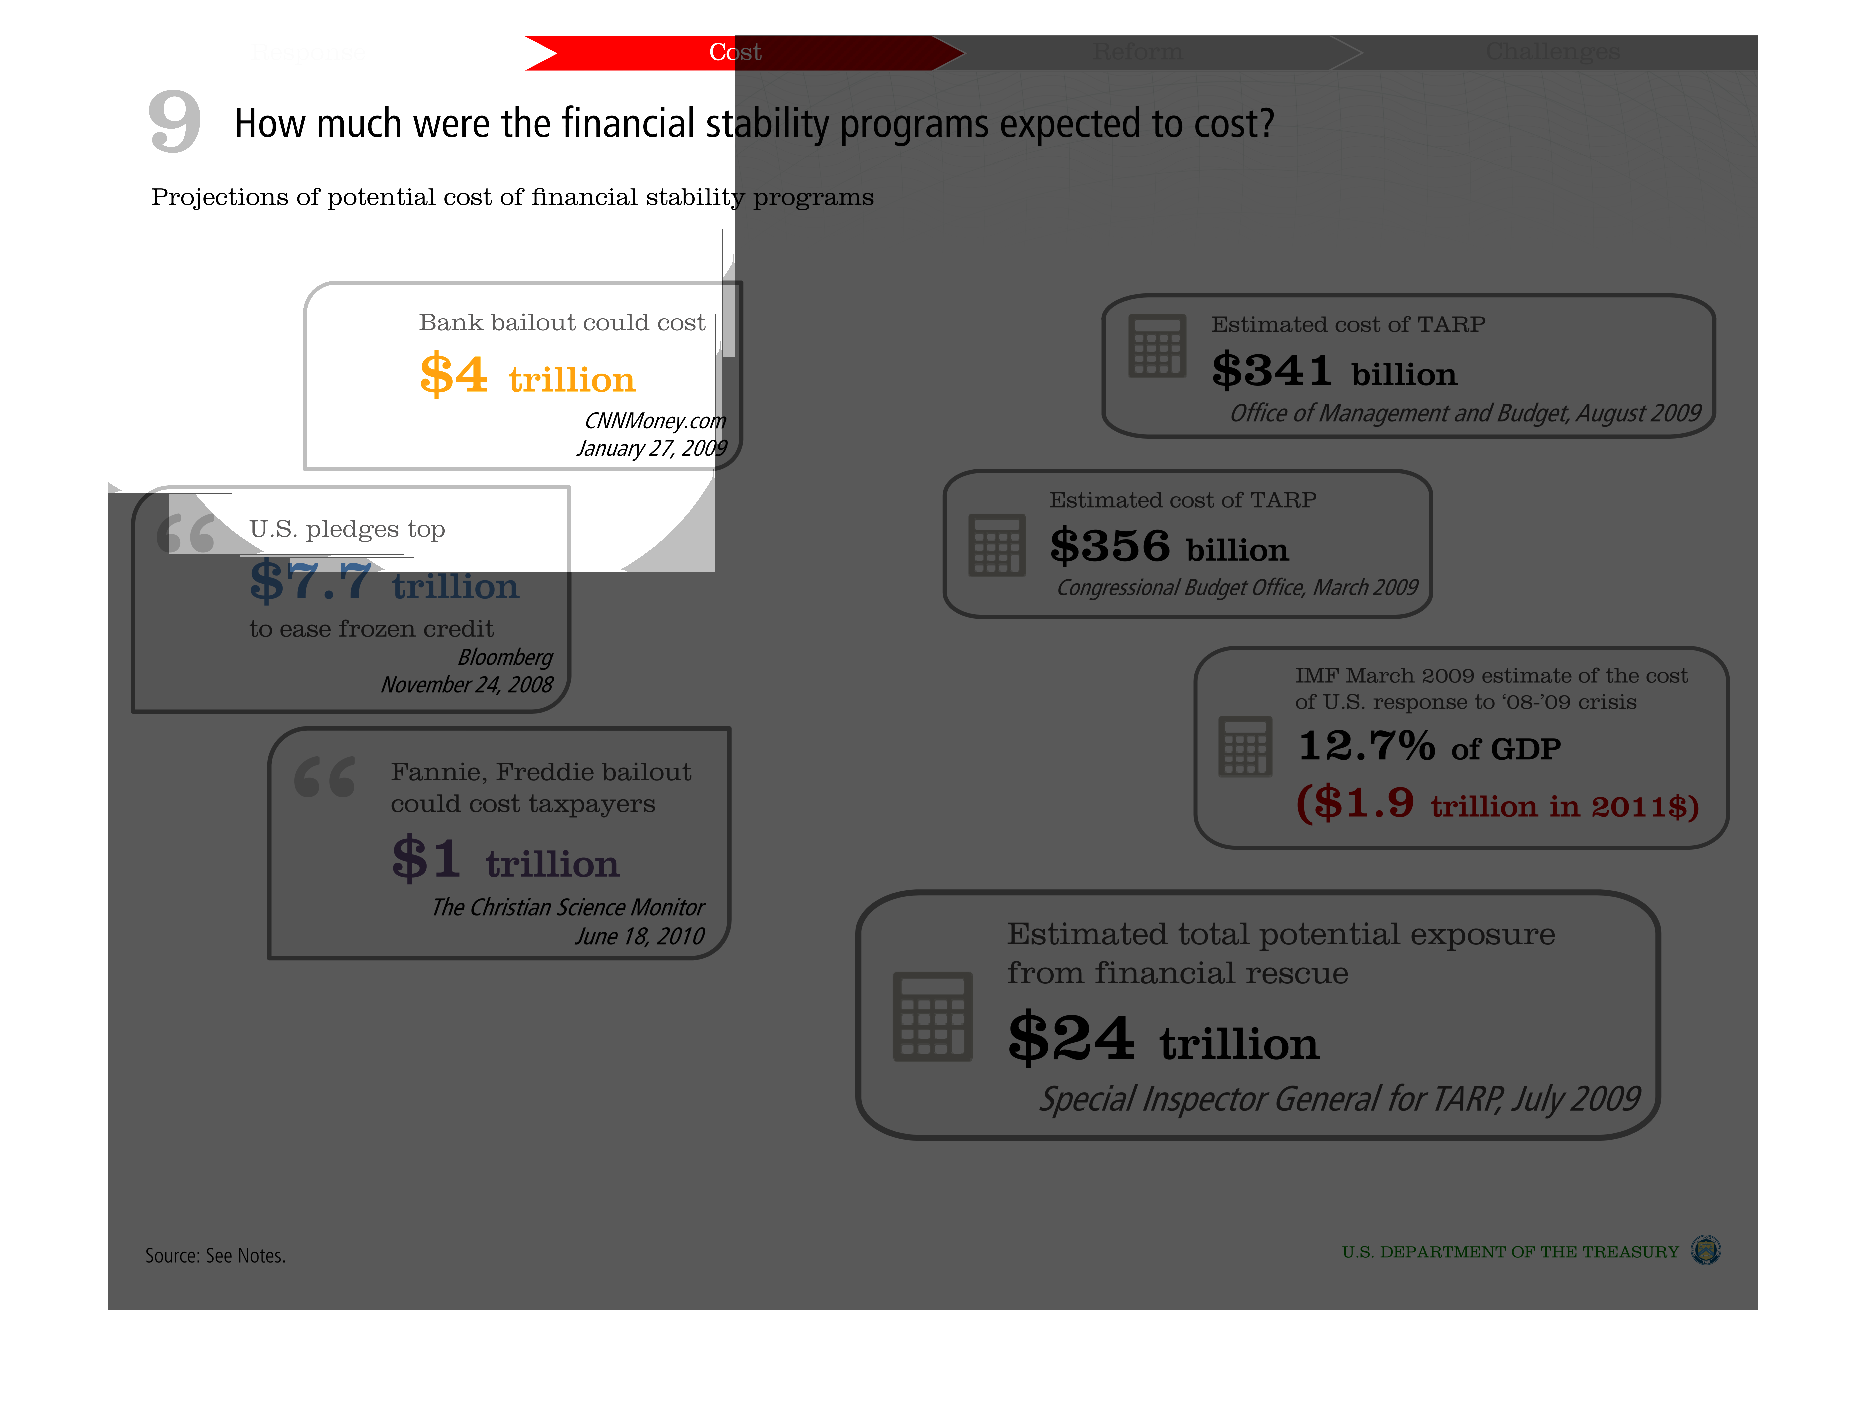
This is  a chart that shows the Financial stability programs were expected to cost. TARP was
expected to cost $341 billion, while bank bailouts was 4 trillion. It estimated a total of
$24 trillion.
Warning: Image is too big to fit on screen; displaying at 50%
Warning: Image is too big to fit on screen; displaying at 50%

This chart shows the amount of impact these financial stability programs have had across a
wide range of institutions, and it try to see if in fact they have made a difference.
Warning: Image is too big to fit on screen; displaying at 50%
Warning: Image is too big to fit on screen; displaying at 50%
This chart shows the total and complete cost of government bailouts of the financial industry,
The bailouts themselves did not work however very well.
Warning: Image is too big to fit on screen; displaying at 50%
Warning: Image is too big to fit on screen; displaying at 50%
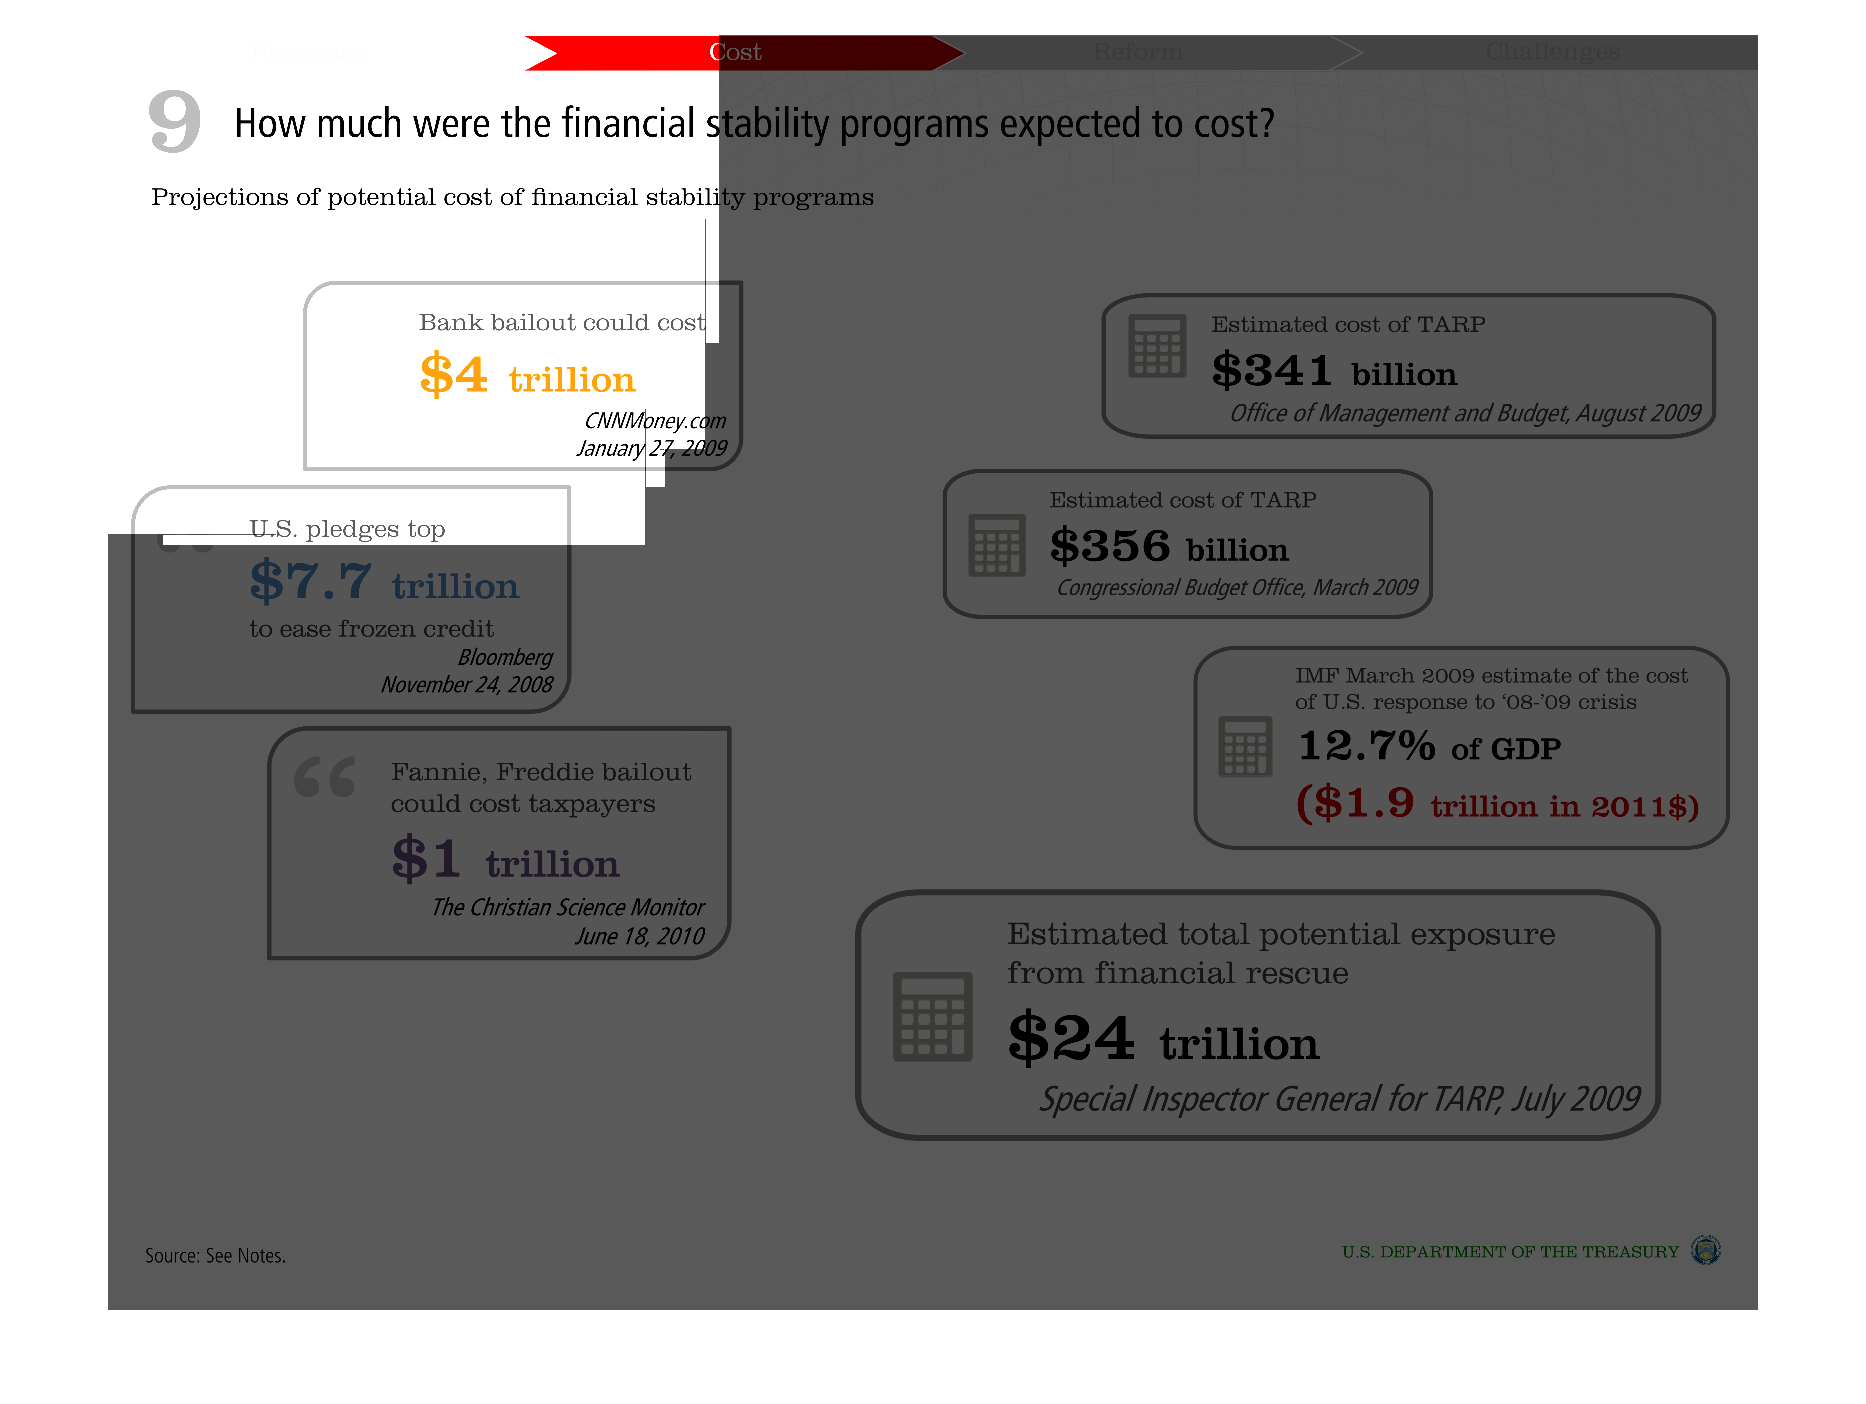
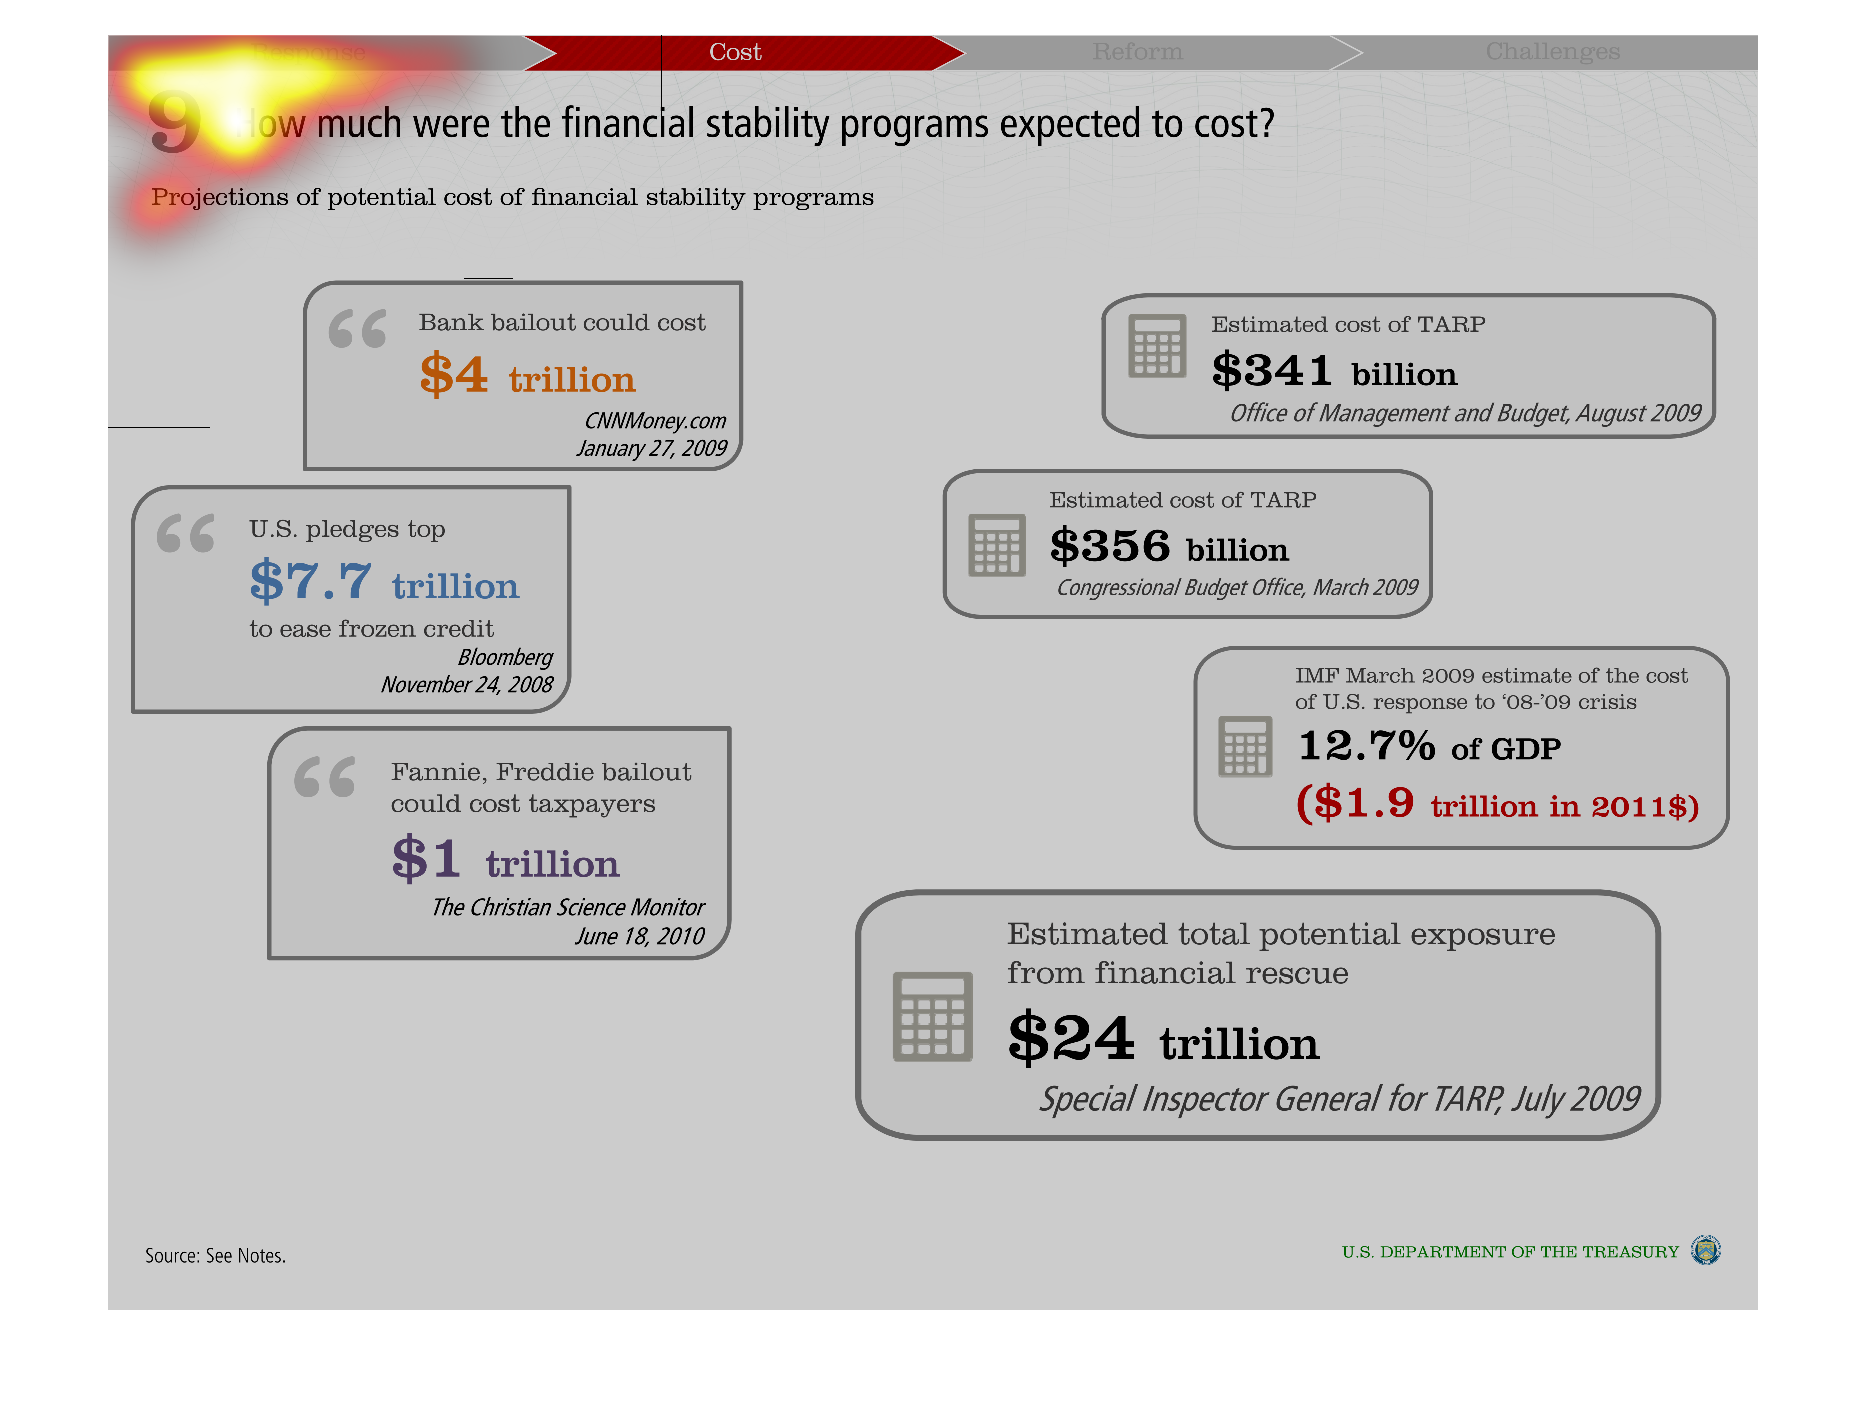
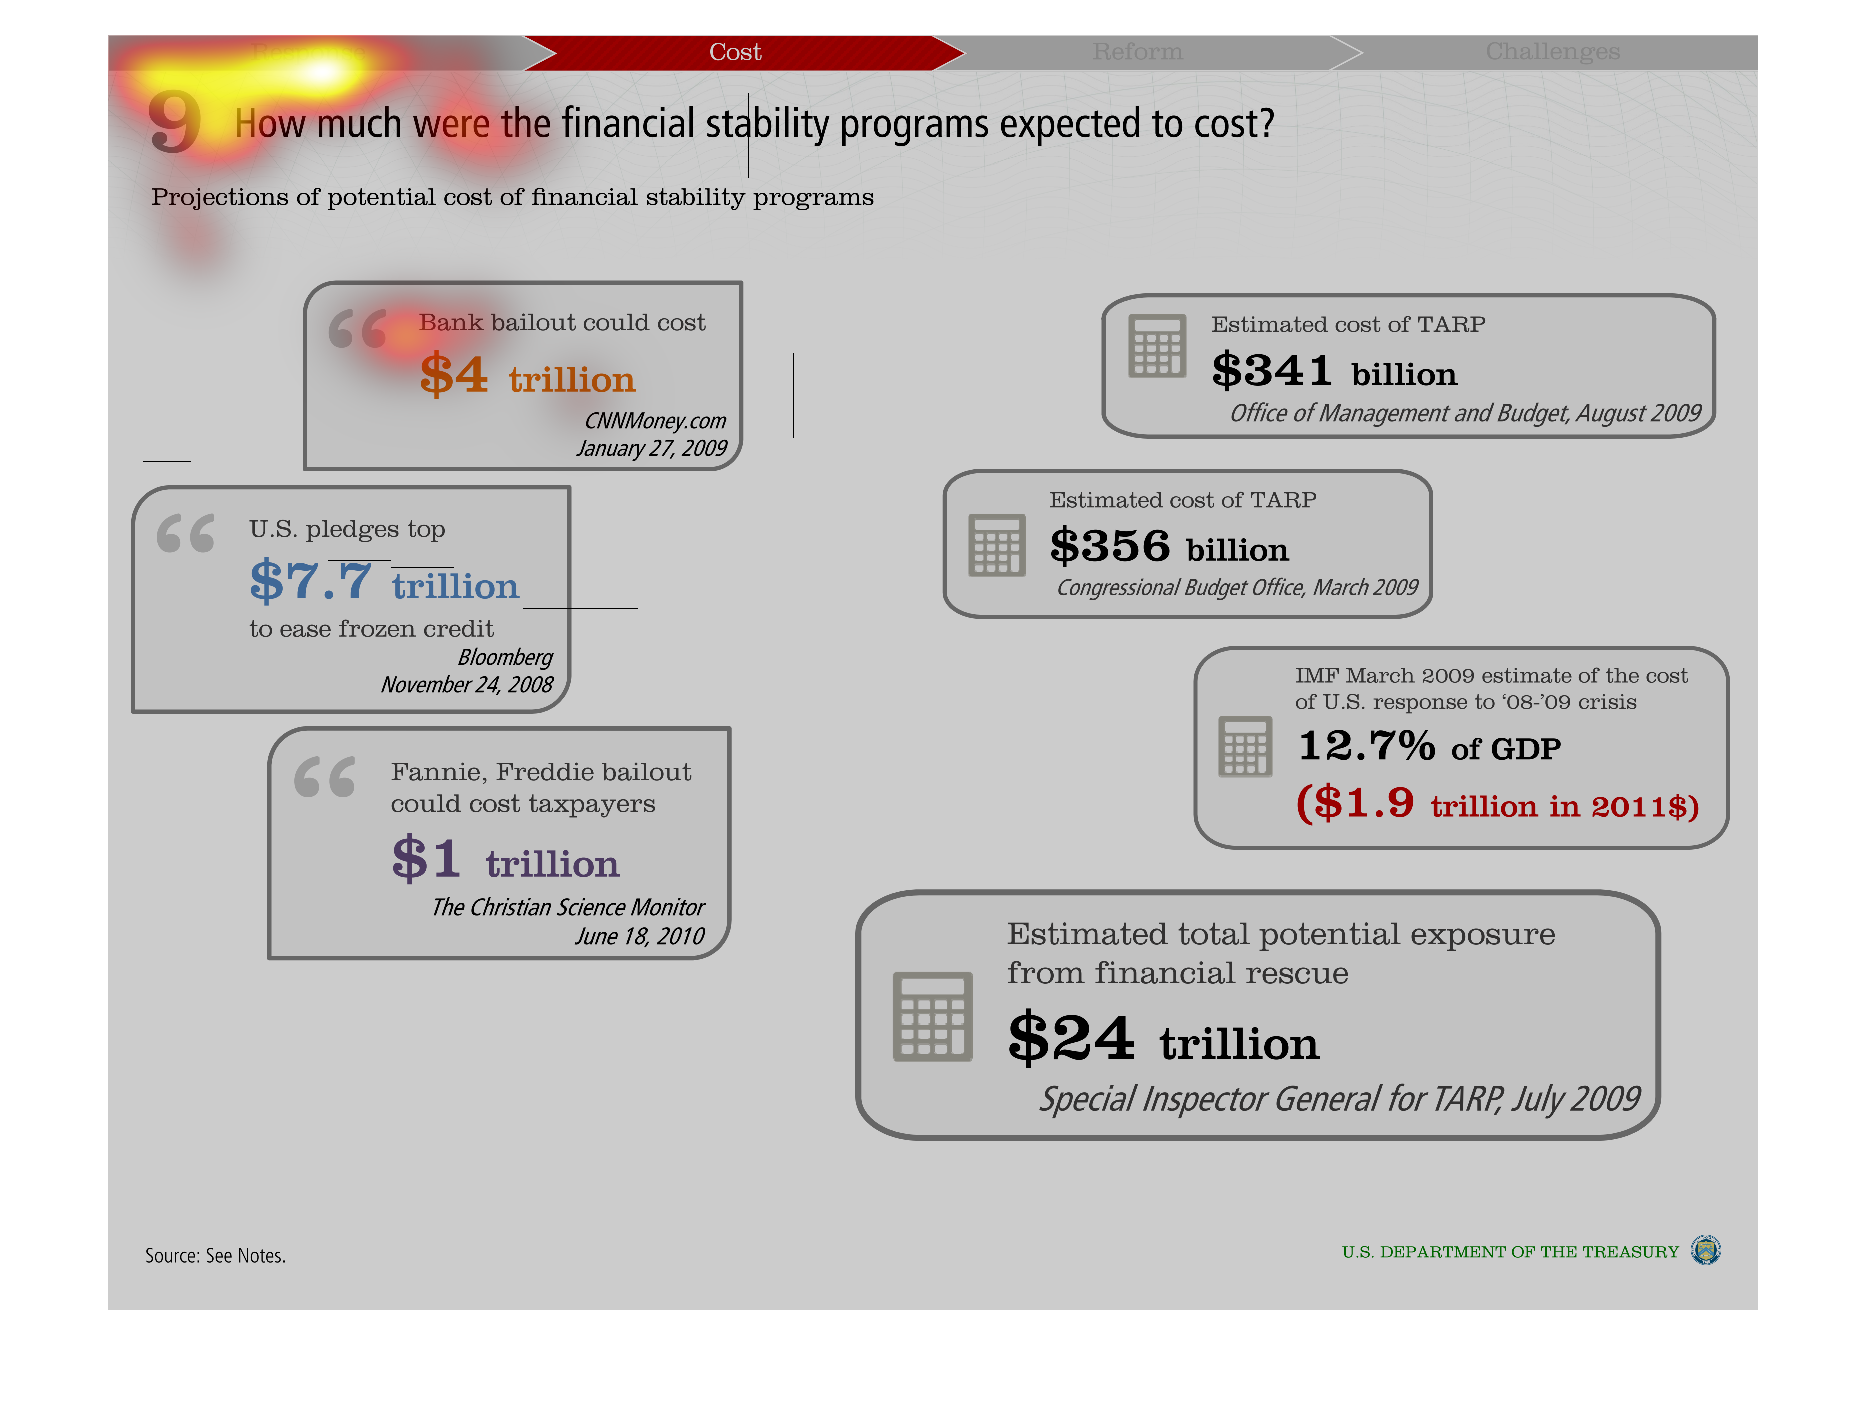
This is a scattered blurb aggregate for estimated cost of financial-related programs in the
US. Bank bailouts and estimated in the trillions of dollars.
Warning: Image is too big to fit on screen; displaying at 50%
Warning: Image is too big to fit on screen; displaying at 50%
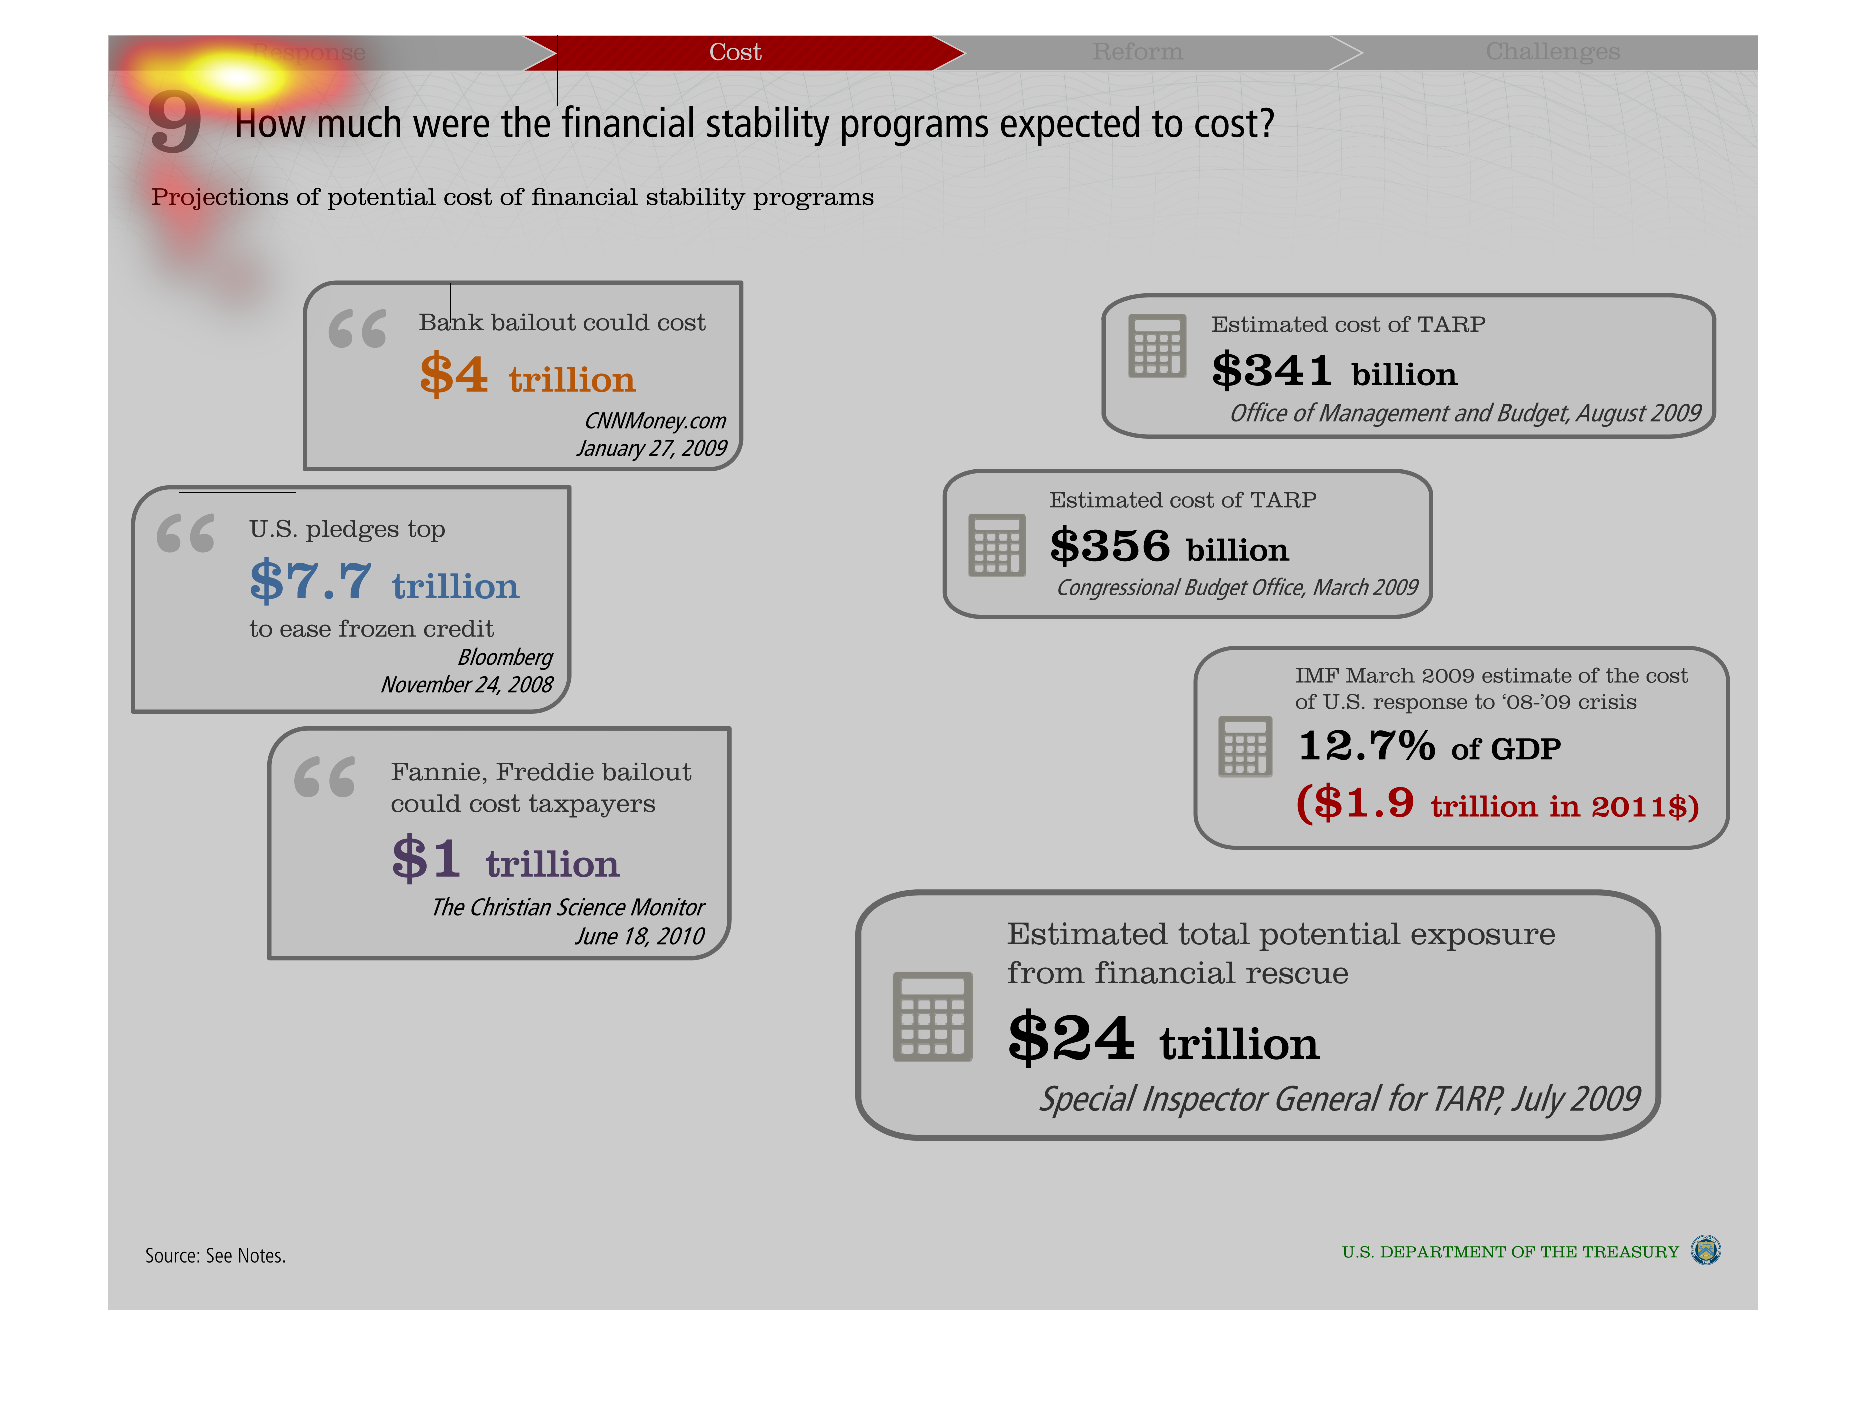
This image shows or depicts in statistical label quote format how much were the financial
stability programs expected to cost? The costs range from billions to trillions of dollars.
Warning: Image is too big to fit on screen; displaying at 50%
Warning: Image is too big to fit on screen; displaying at 50%
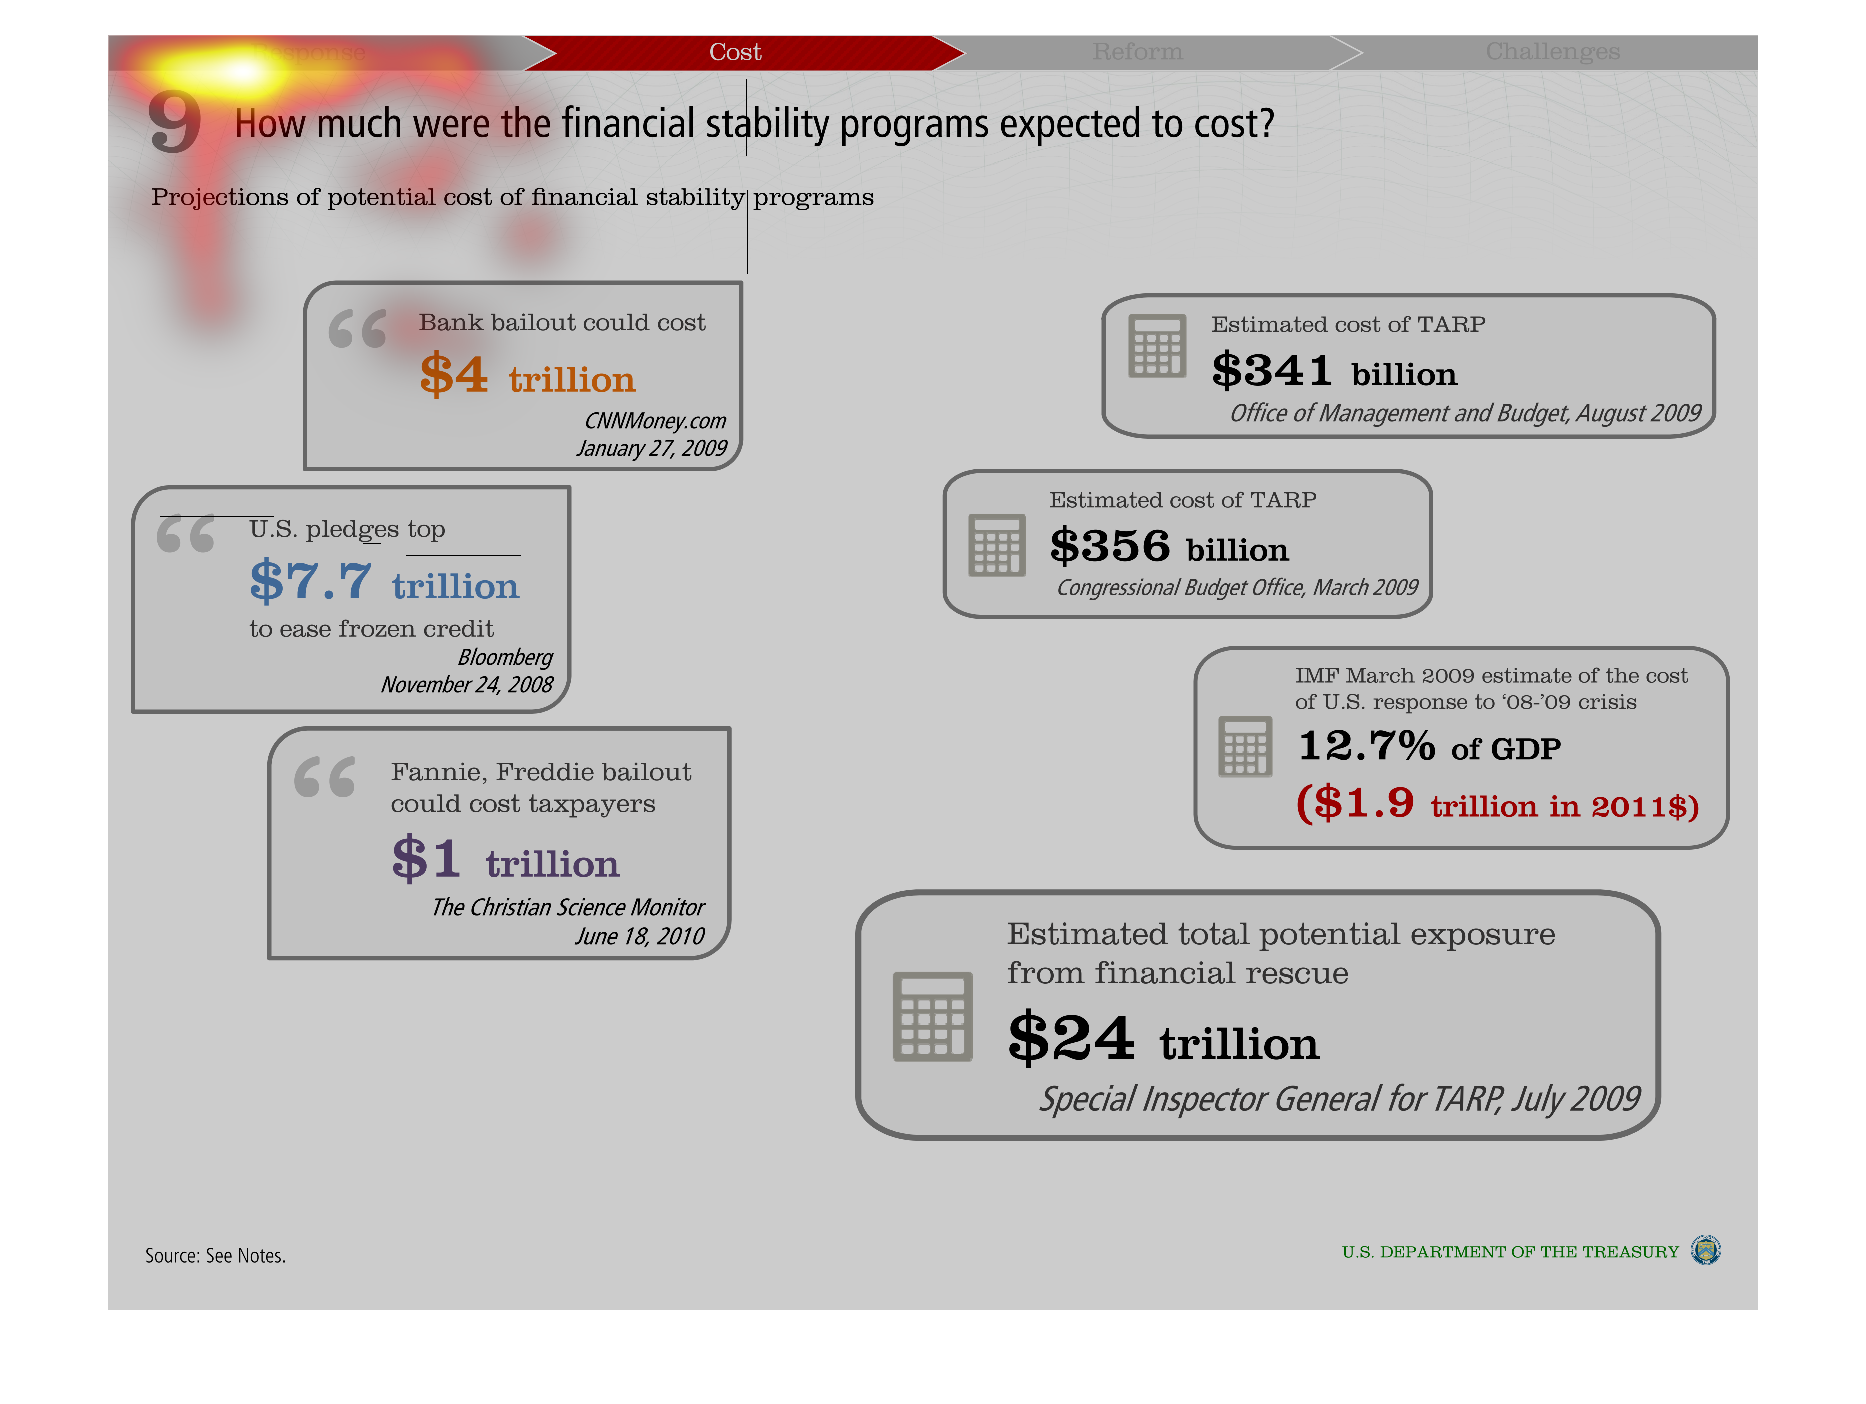

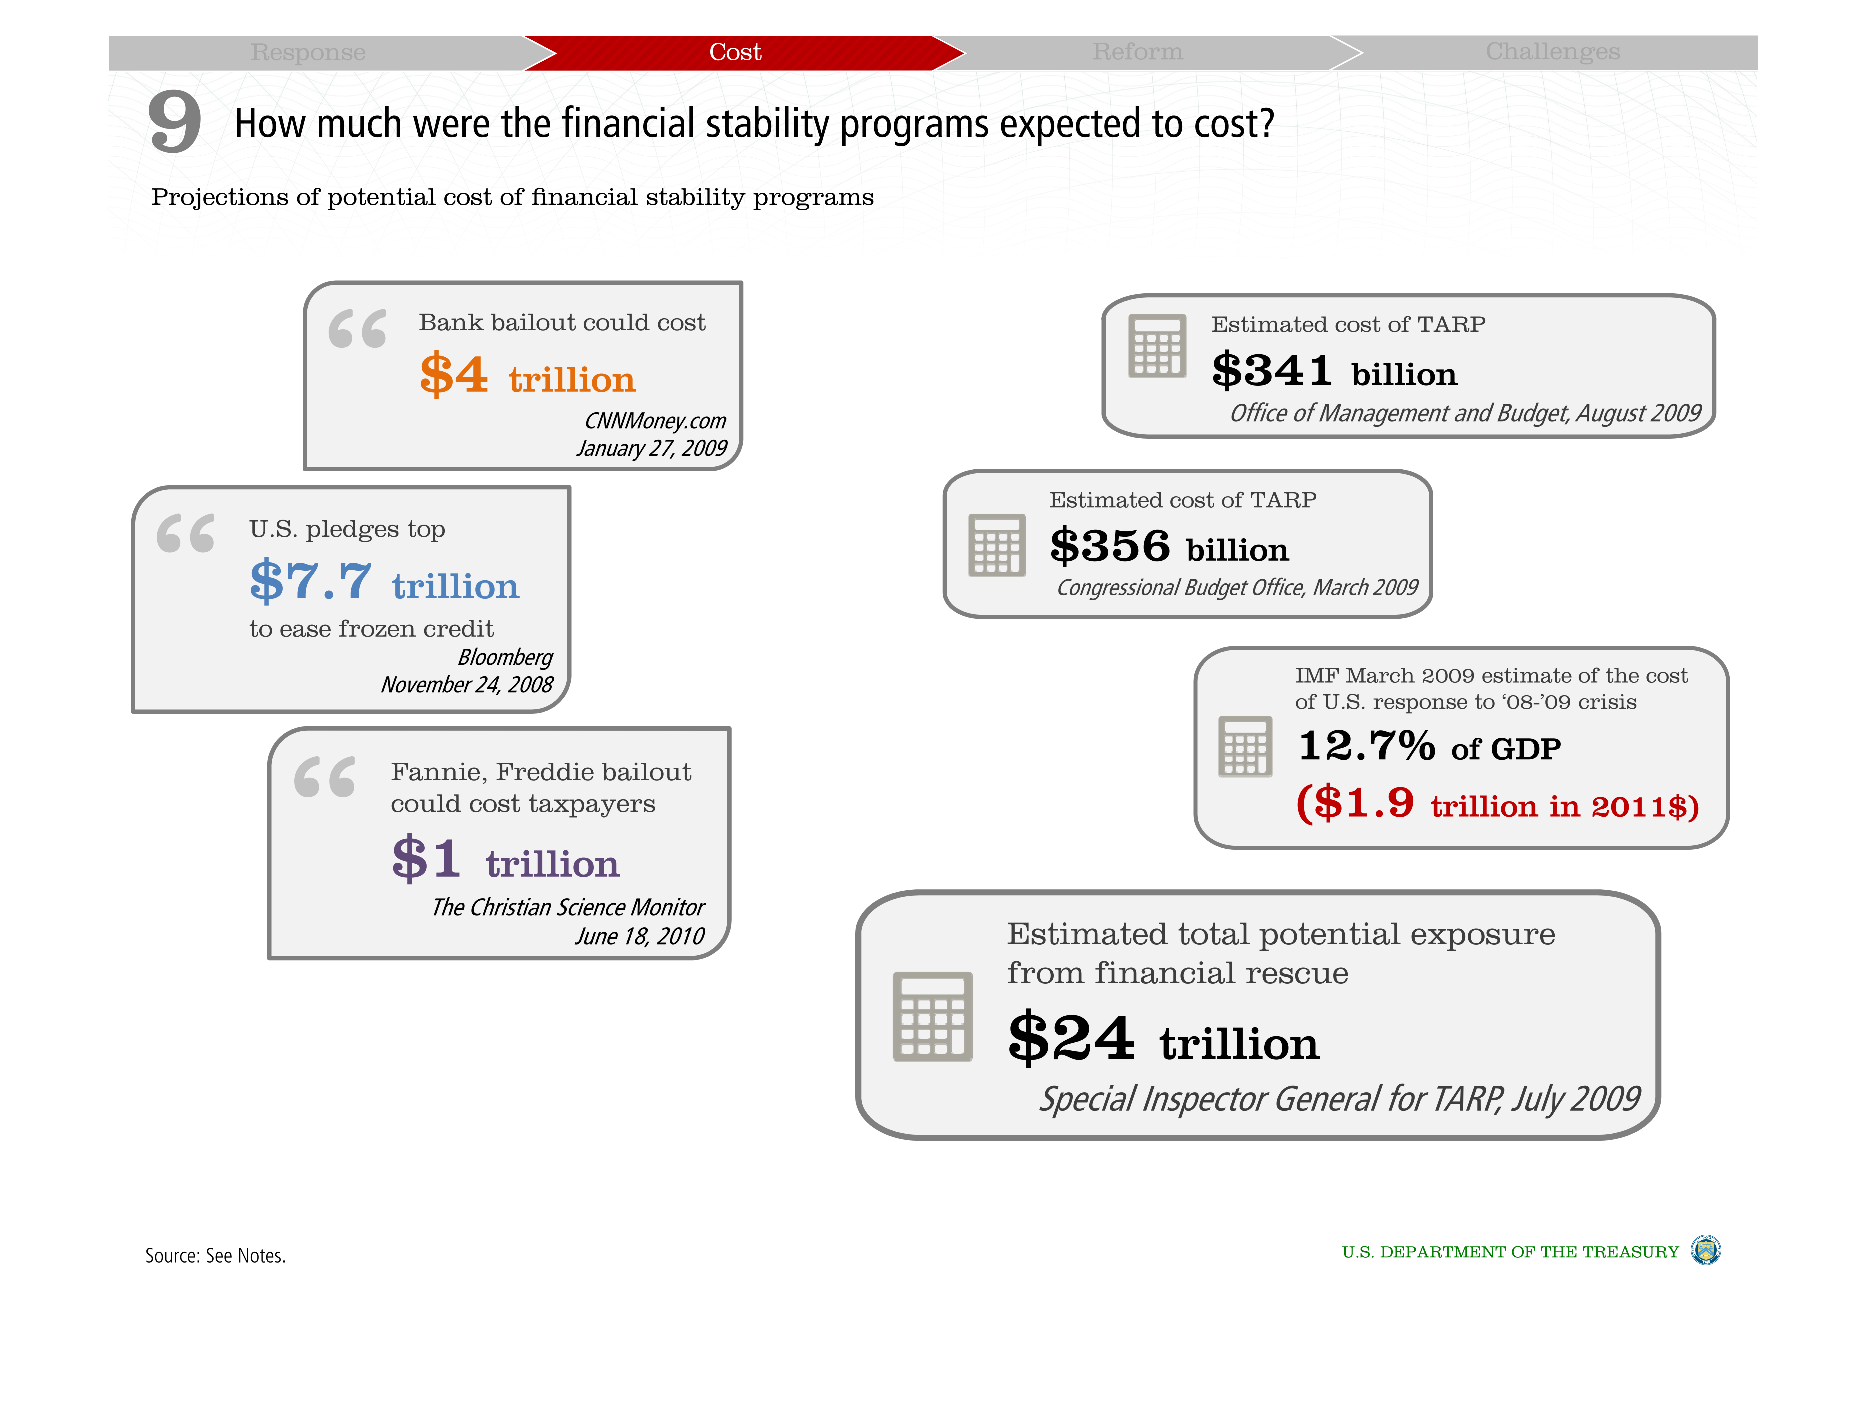
These graphs shows the projections of potential costs of financial stability programs.  The
left side contains quotes and facts and figures.  The right side describes financial infusions.
Warning: Image is too big to fit on screen; displaying at 50%
Warning: Image is too big to fit on screen; displaying at 50%