Warning: Image is too big to fit on screen; displaying at 50%
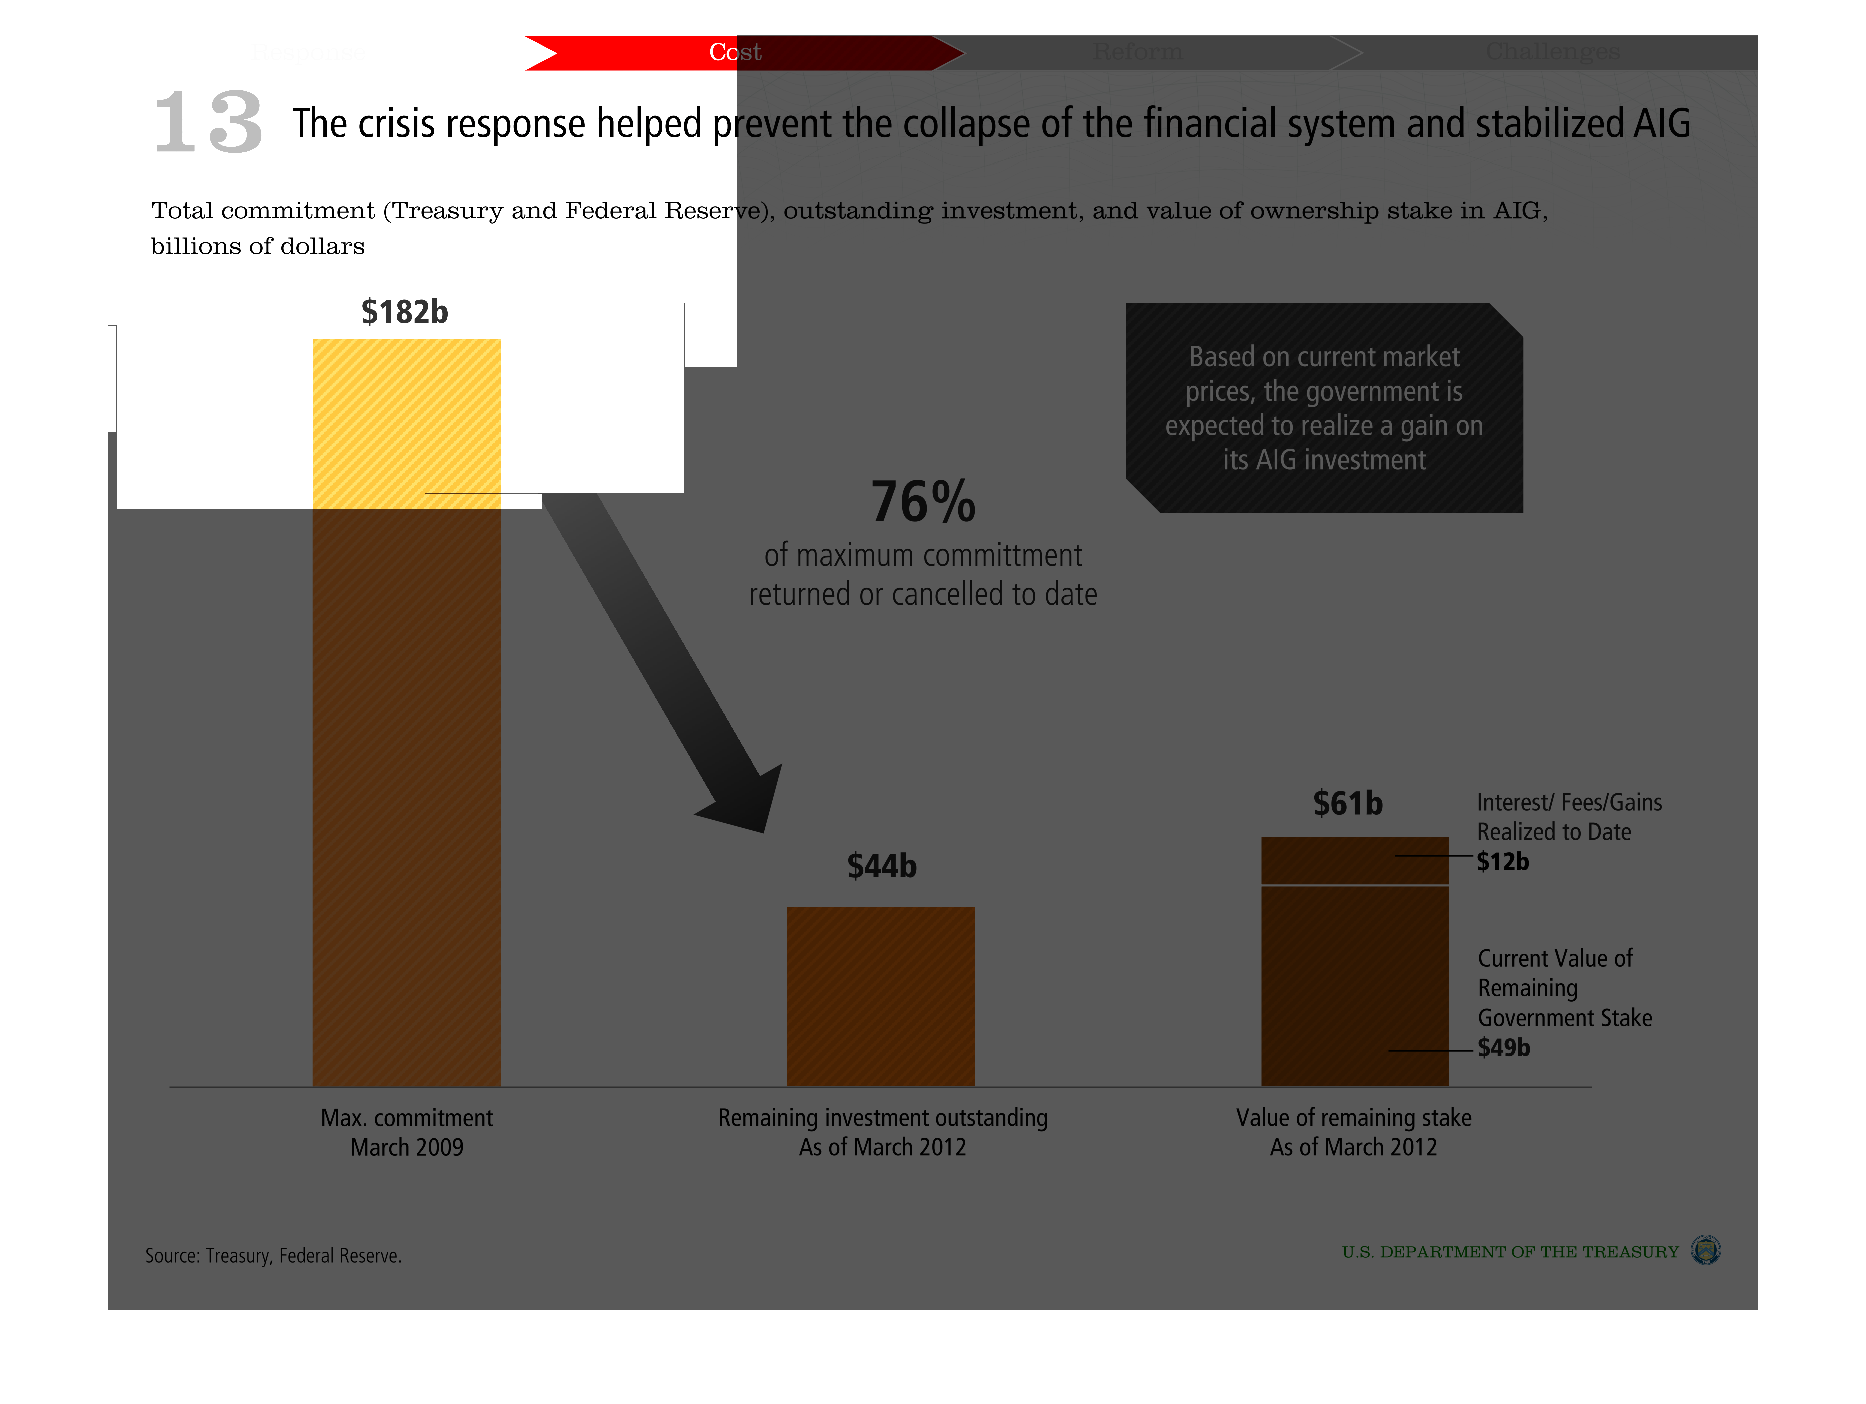
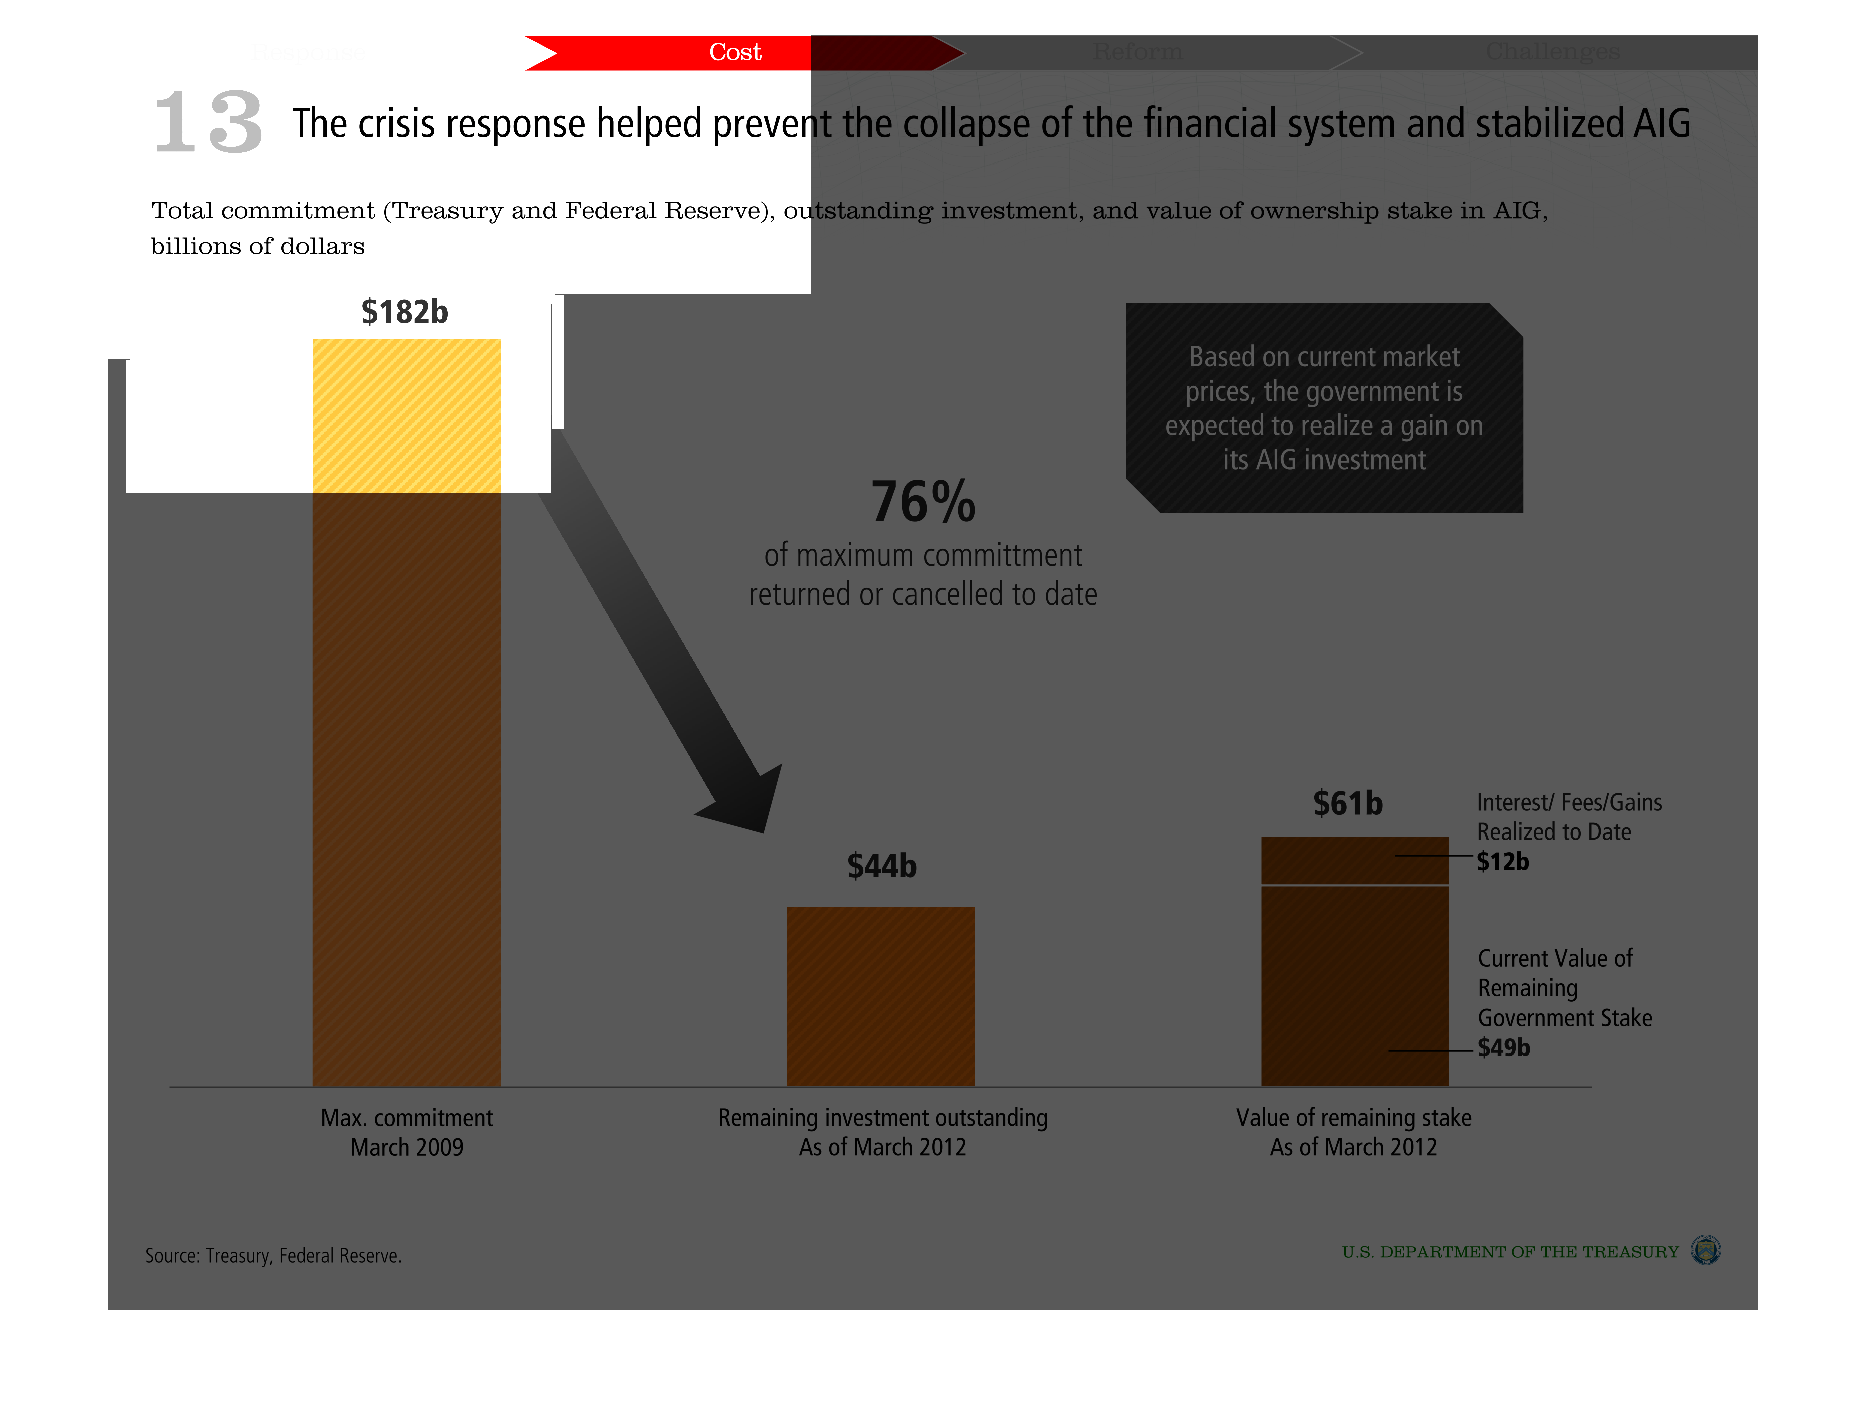
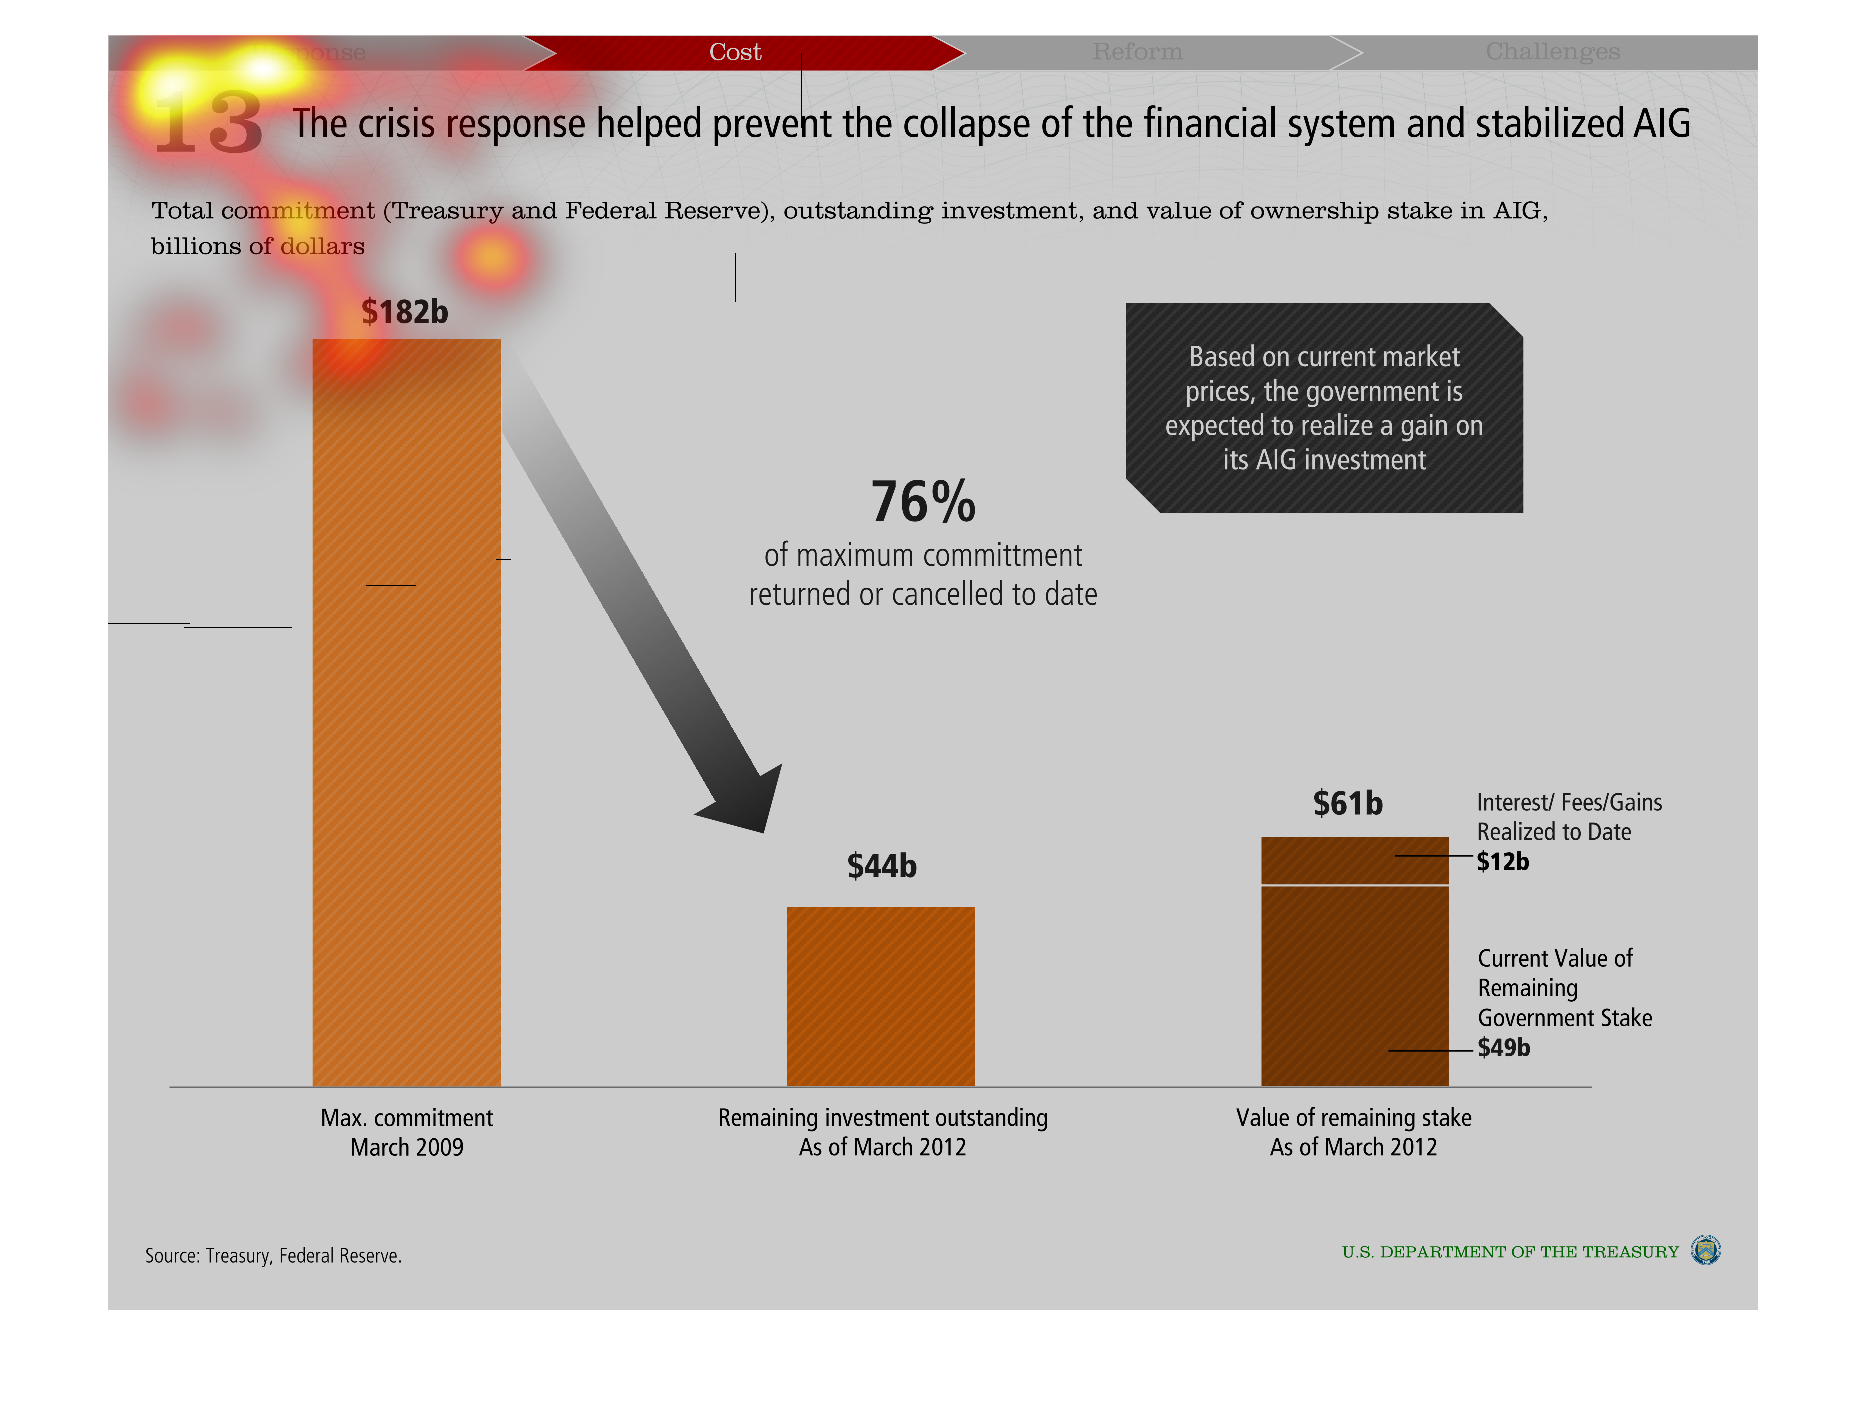
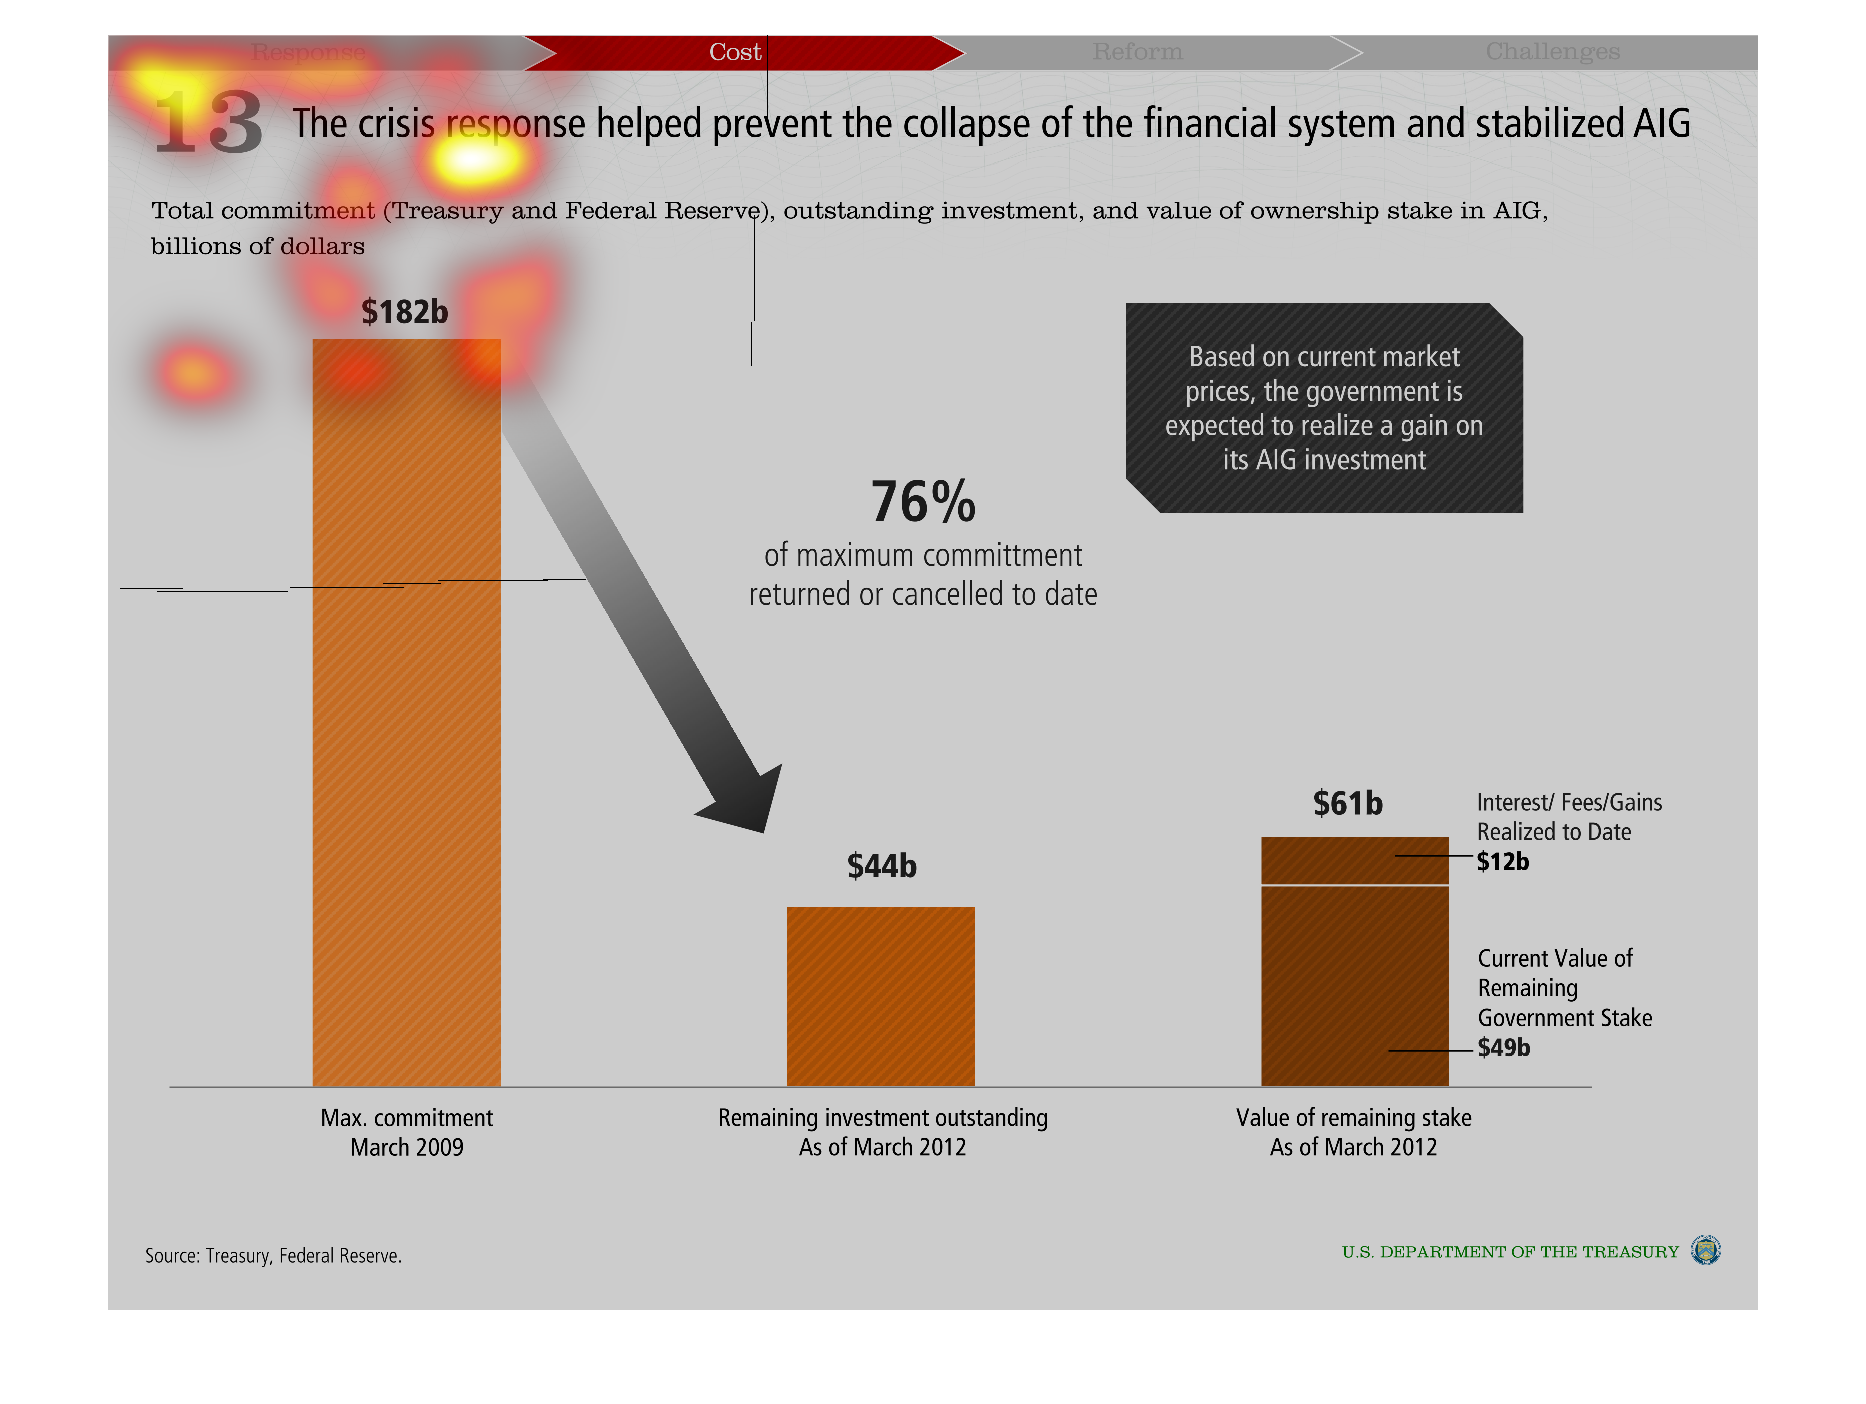
This chart describes the crisis response helped prevent the collapse of the financial system
and stabilized AIG. Specifically total commitment in the billions.
Warning: Image is too big to fit on screen; displaying at 50%
Warning: Image is too big to fit on screen; displaying at 50%
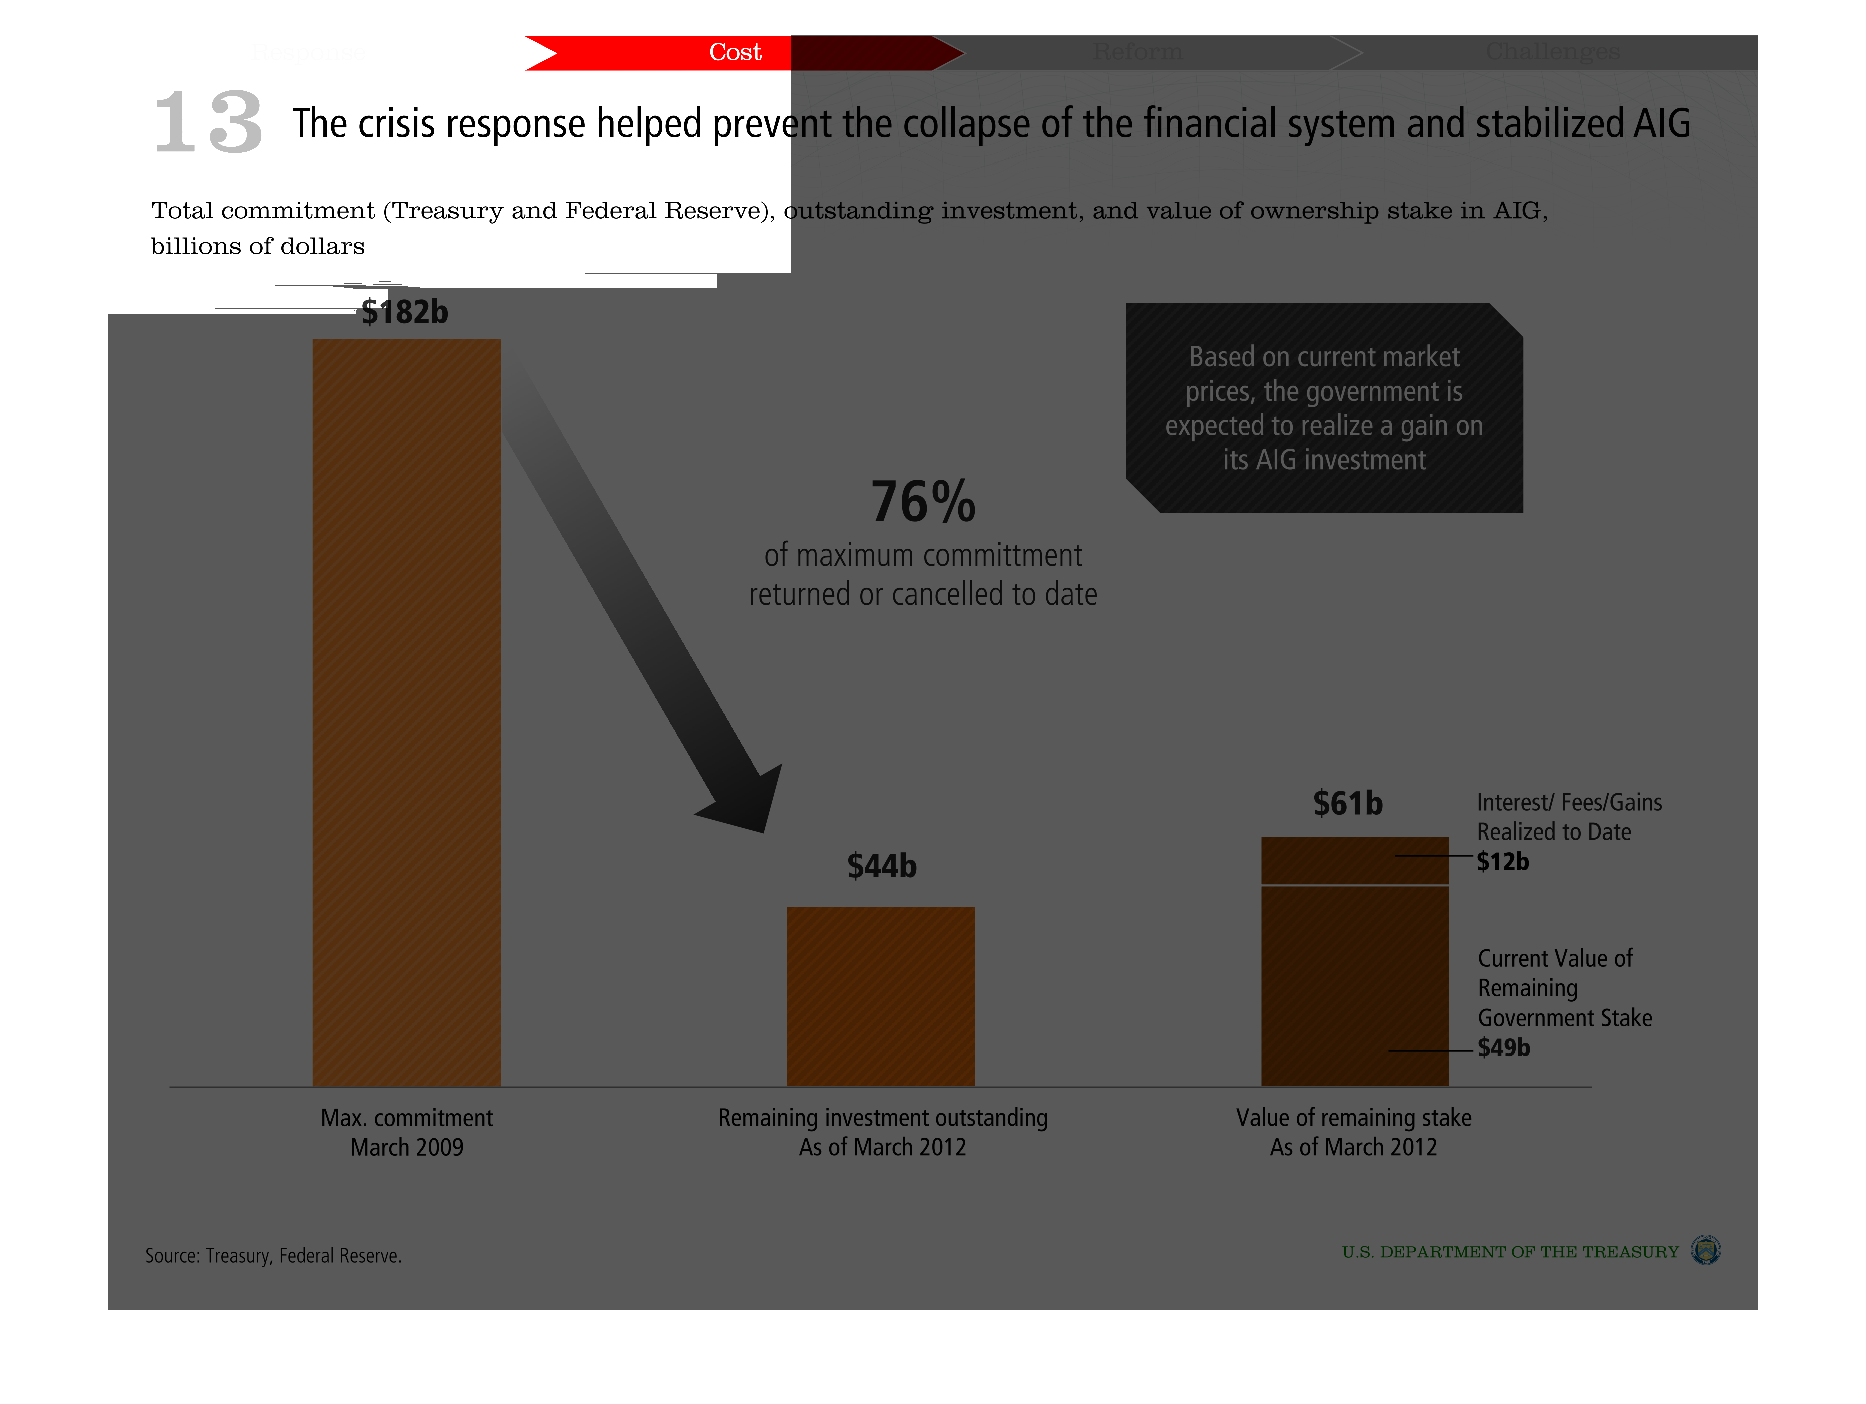
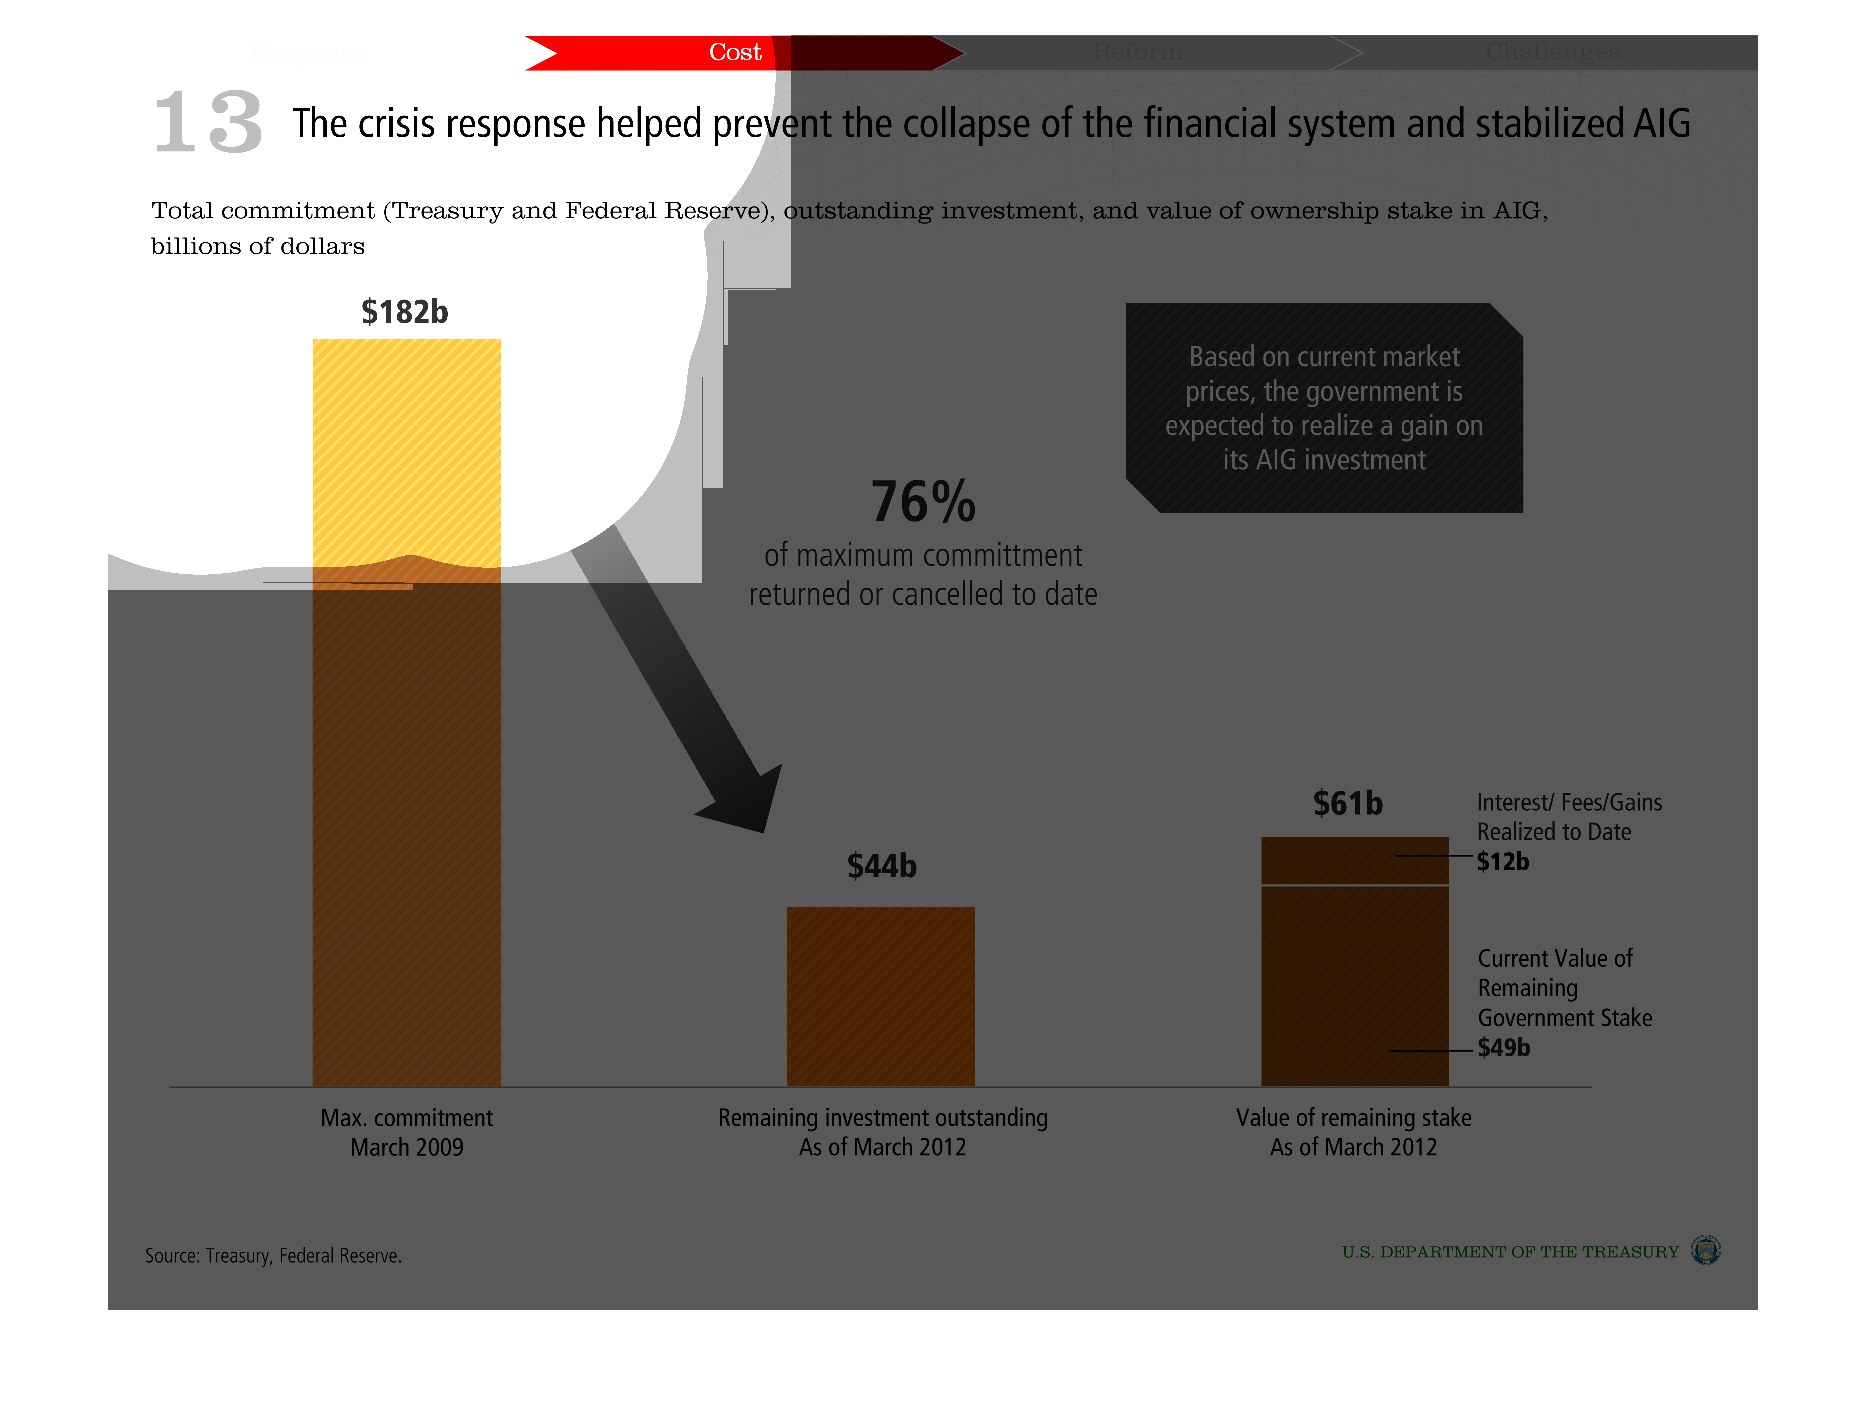
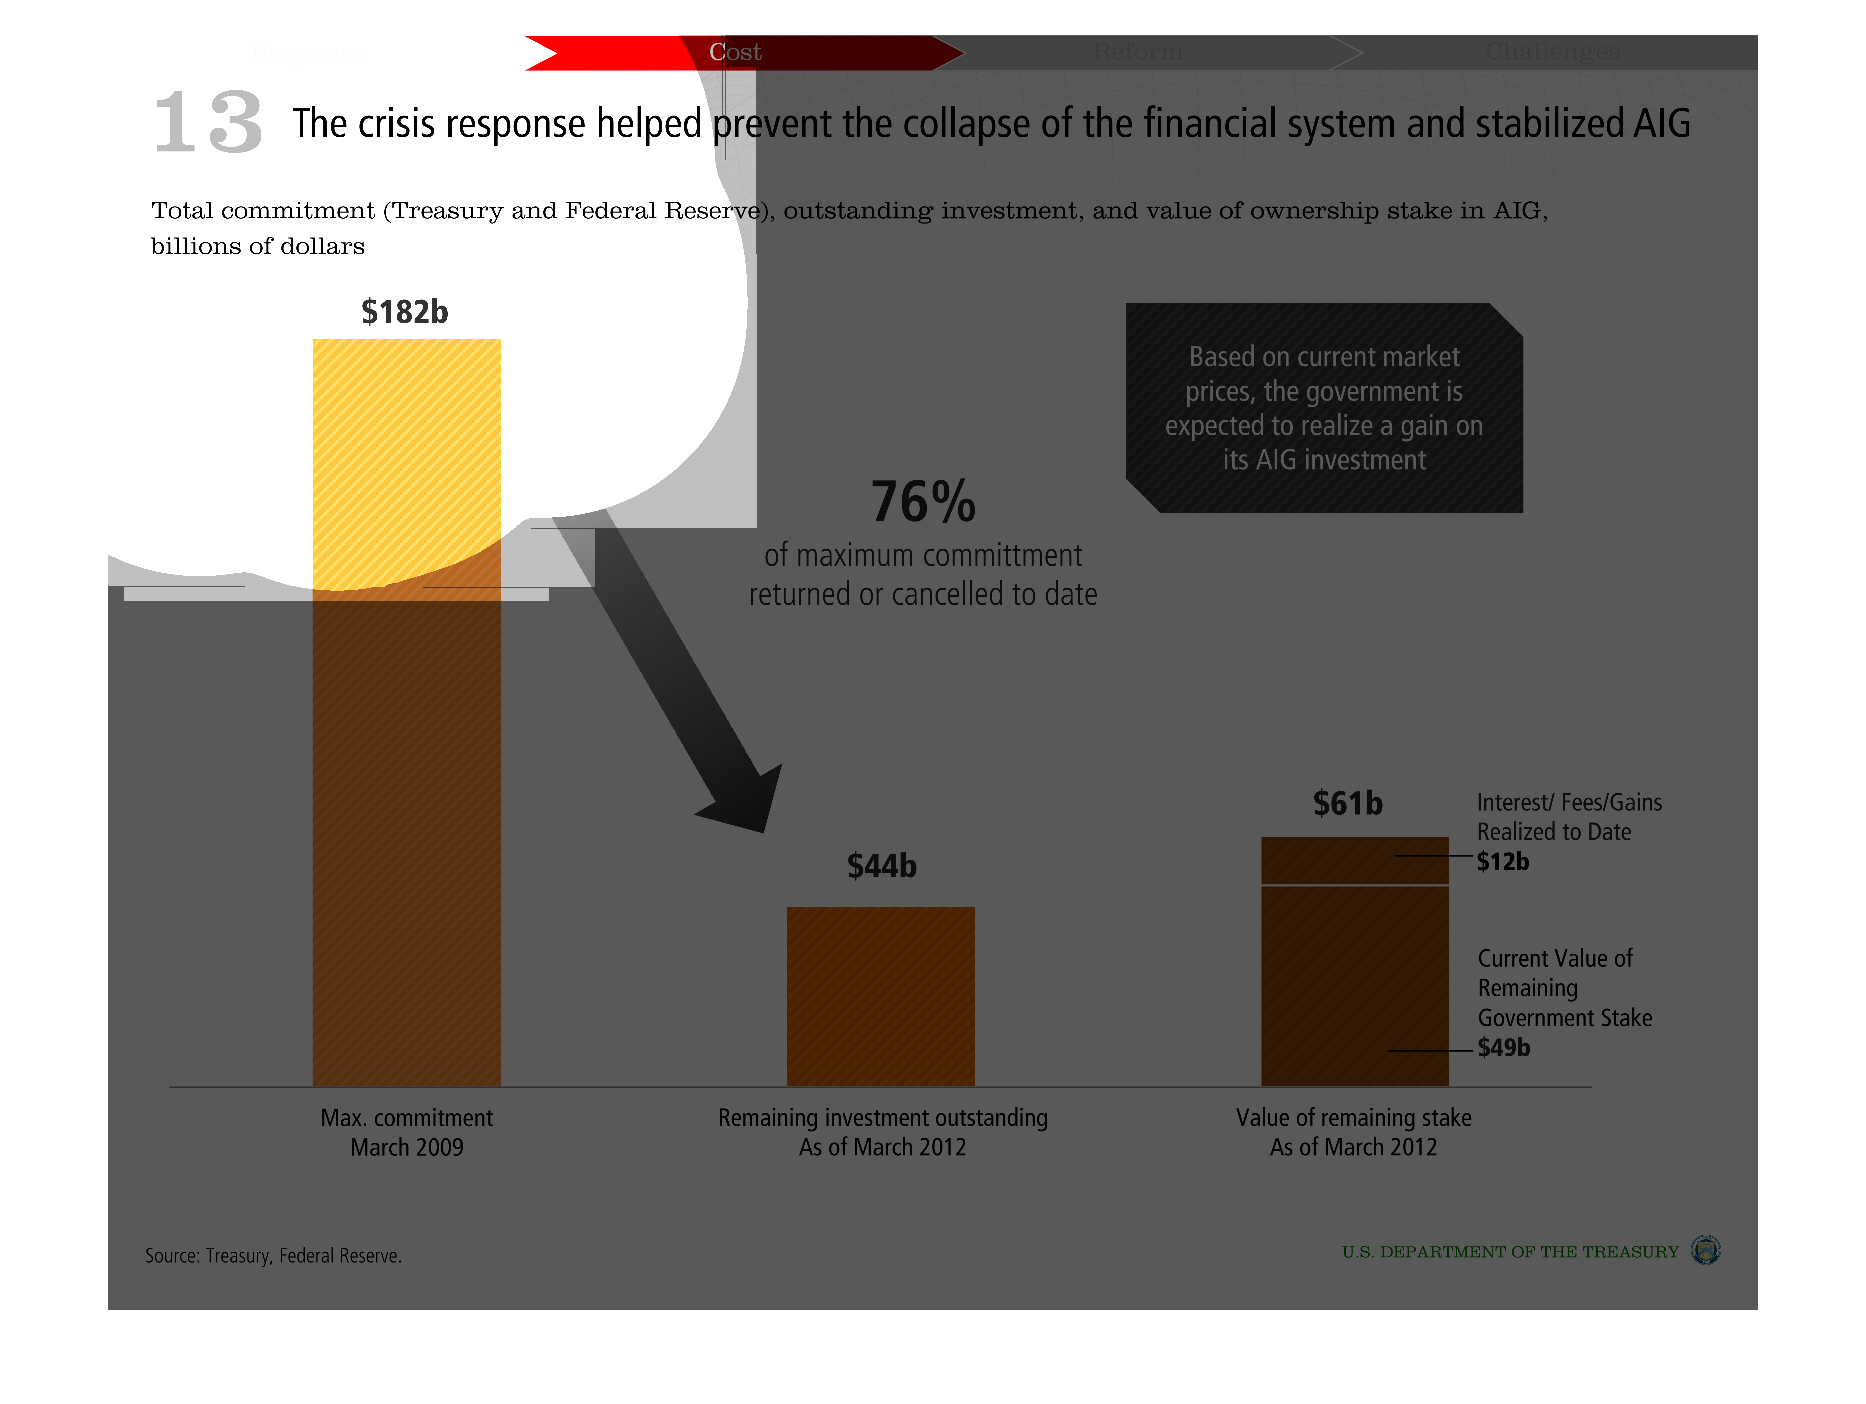
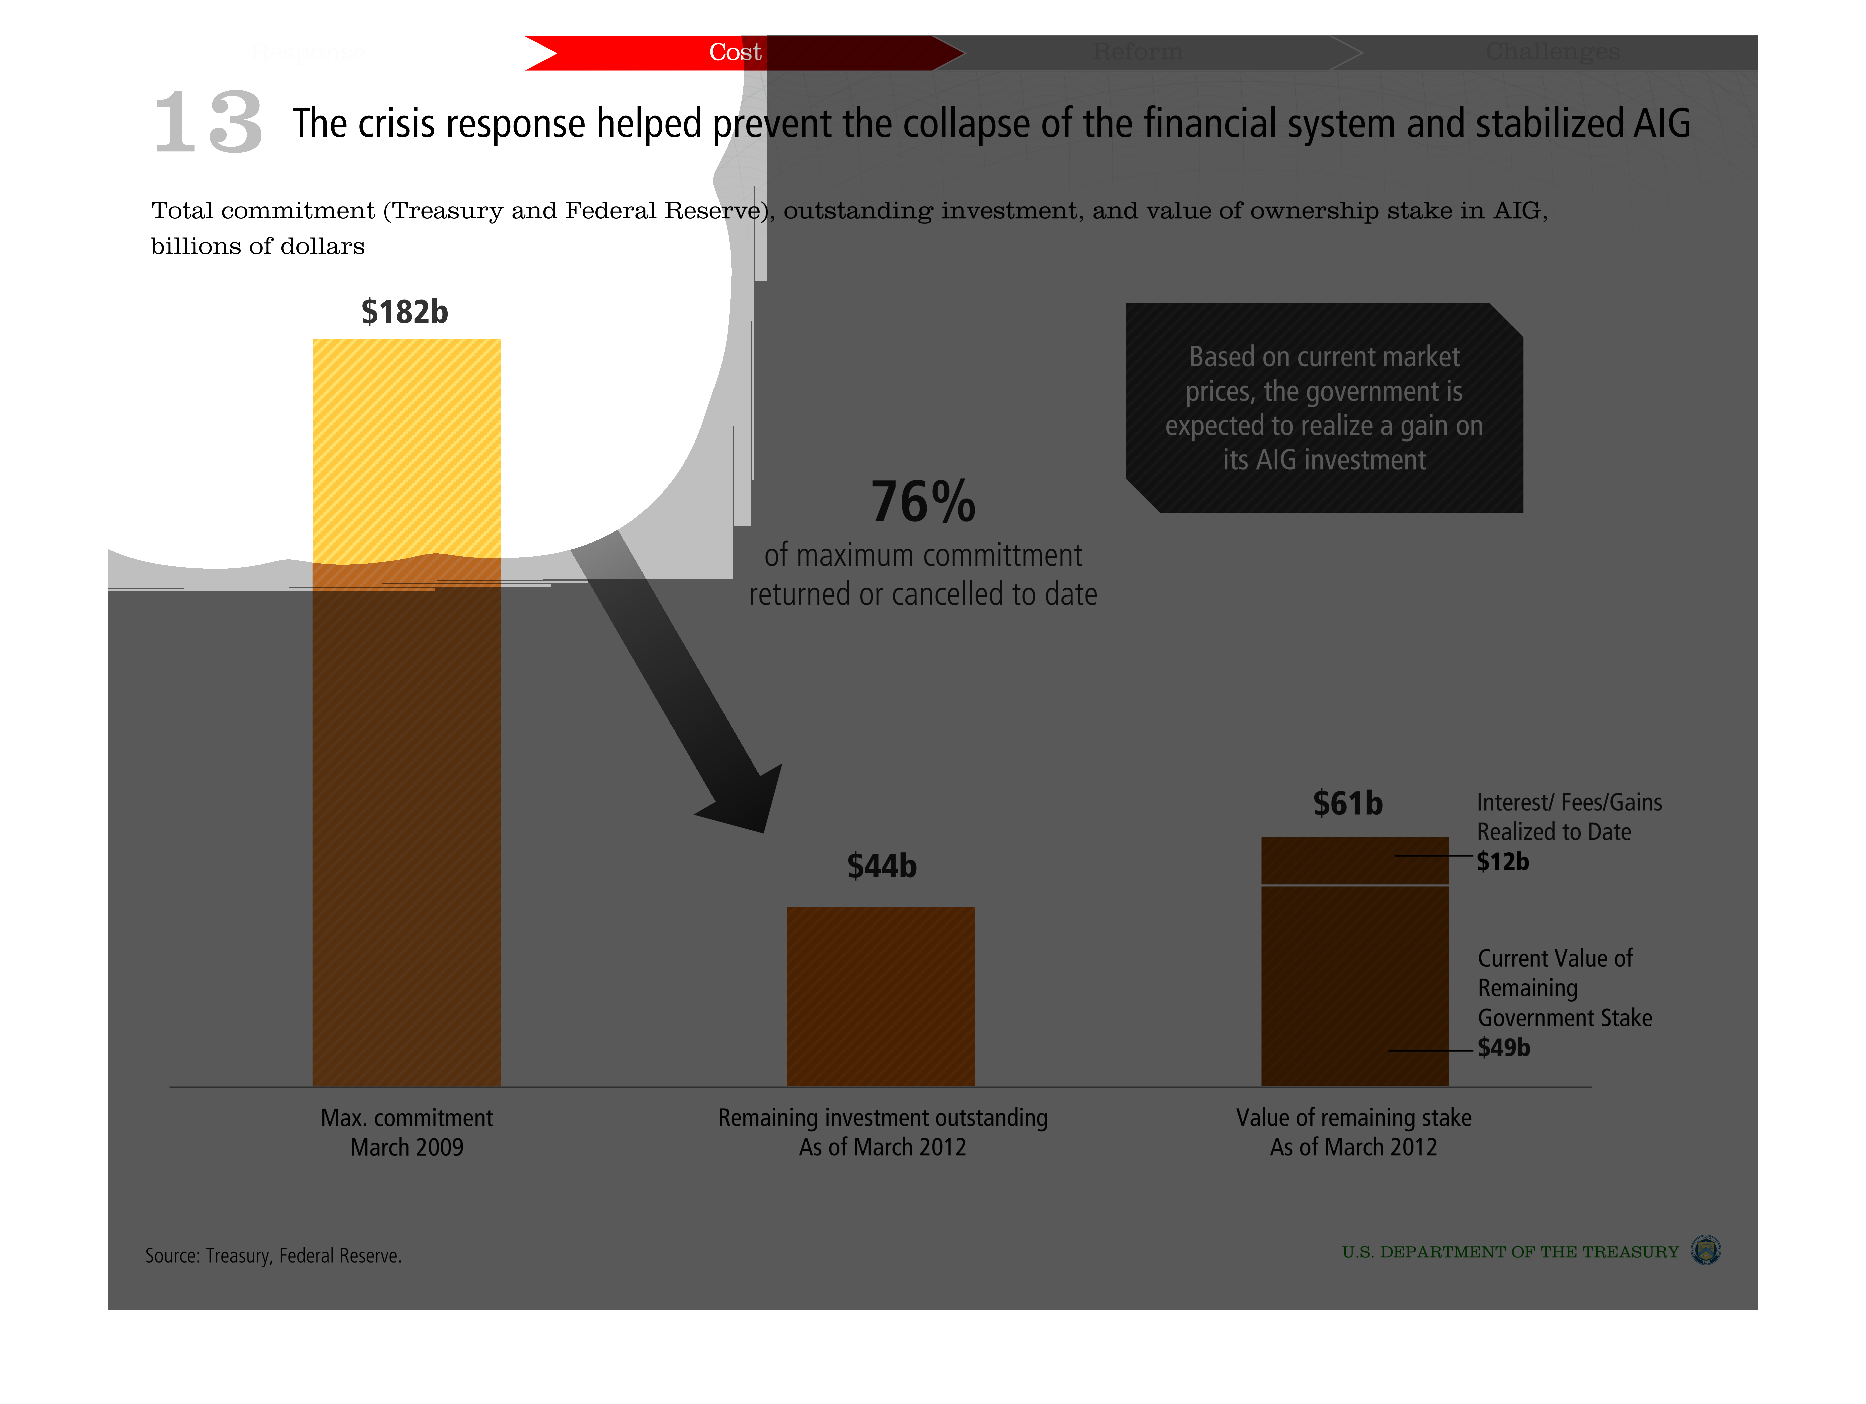
The image shows the factors contributing to the bailout of AIG and how it affected different
factors in the company with the allotted money that was given to save them.
Warning: Image is too big to fit on screen; displaying at 50%
Warning: Image is too big to fit on screen; displaying at 50%
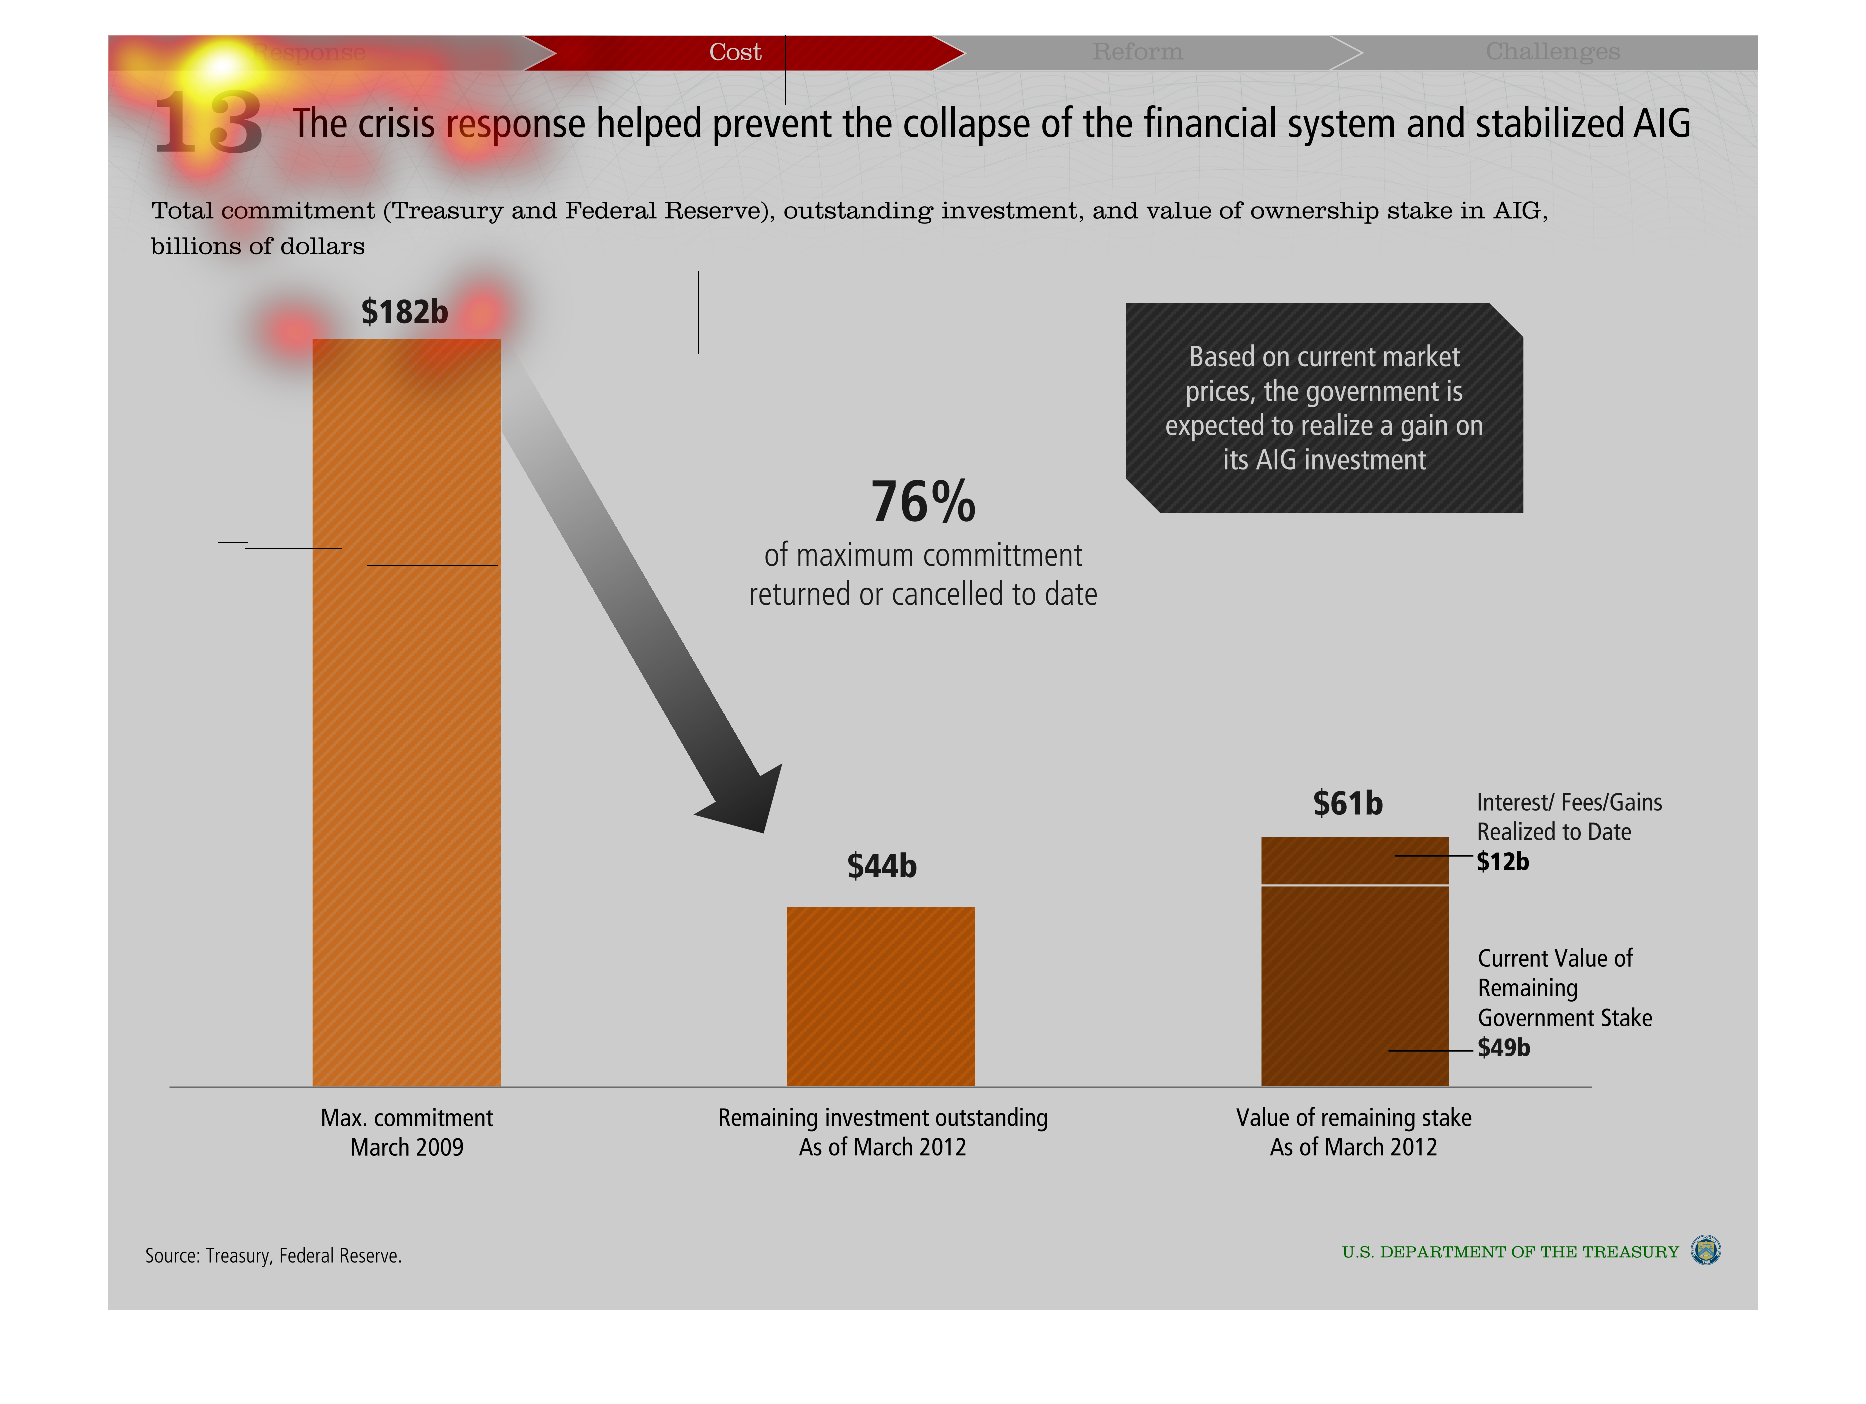

This chart describes the crisis response to the collapse of the financial system and how it
stabilized AIG. The maximum commitment was 182 billion dollars.
Warning: Image is too big to fit on screen; displaying at 50%
Warning: Image is too big to fit on screen; displaying at 50%

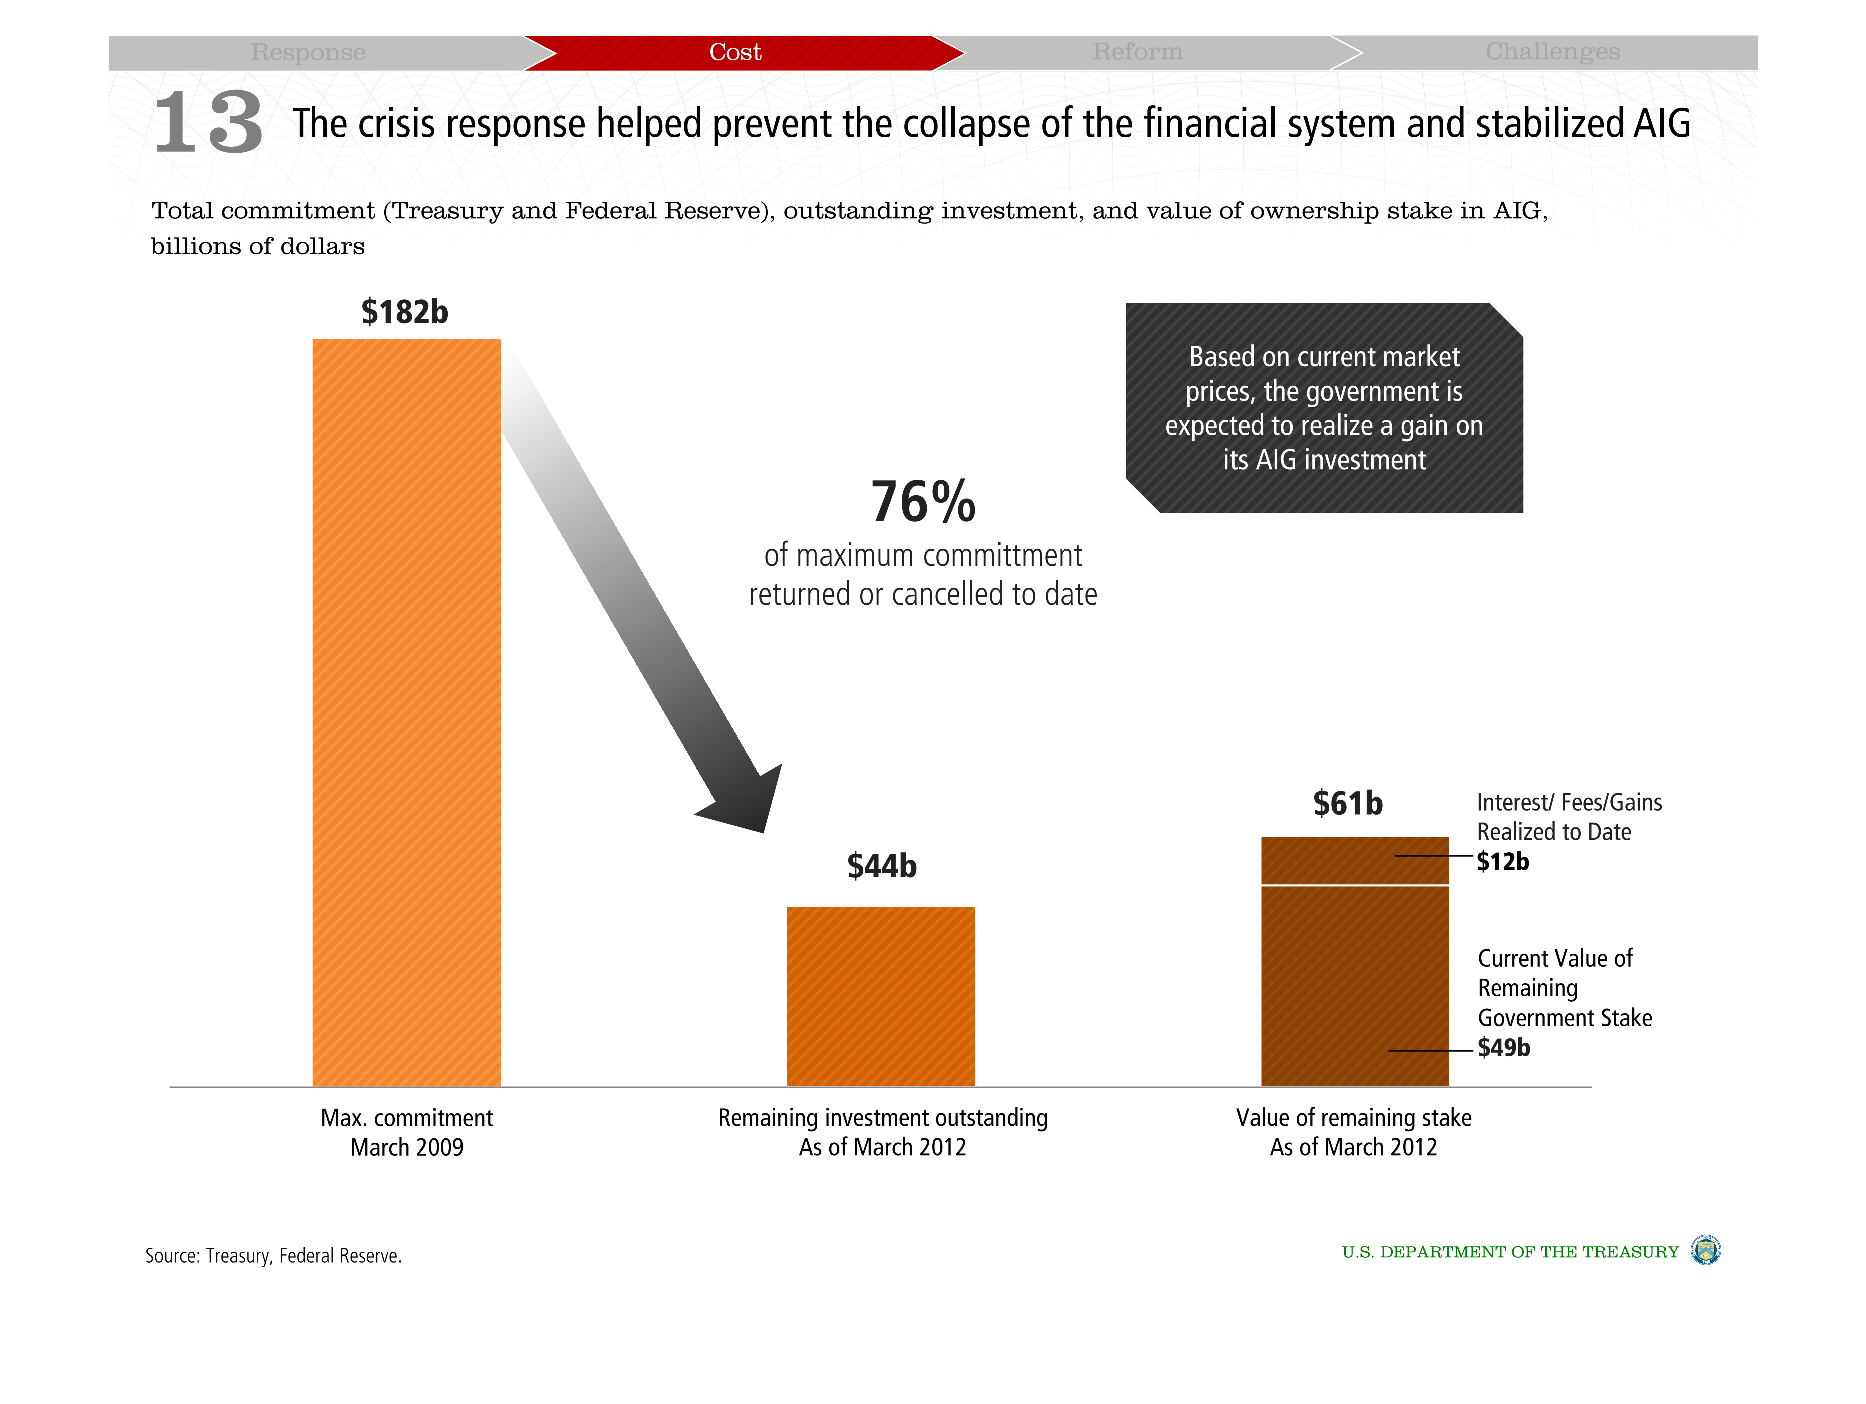
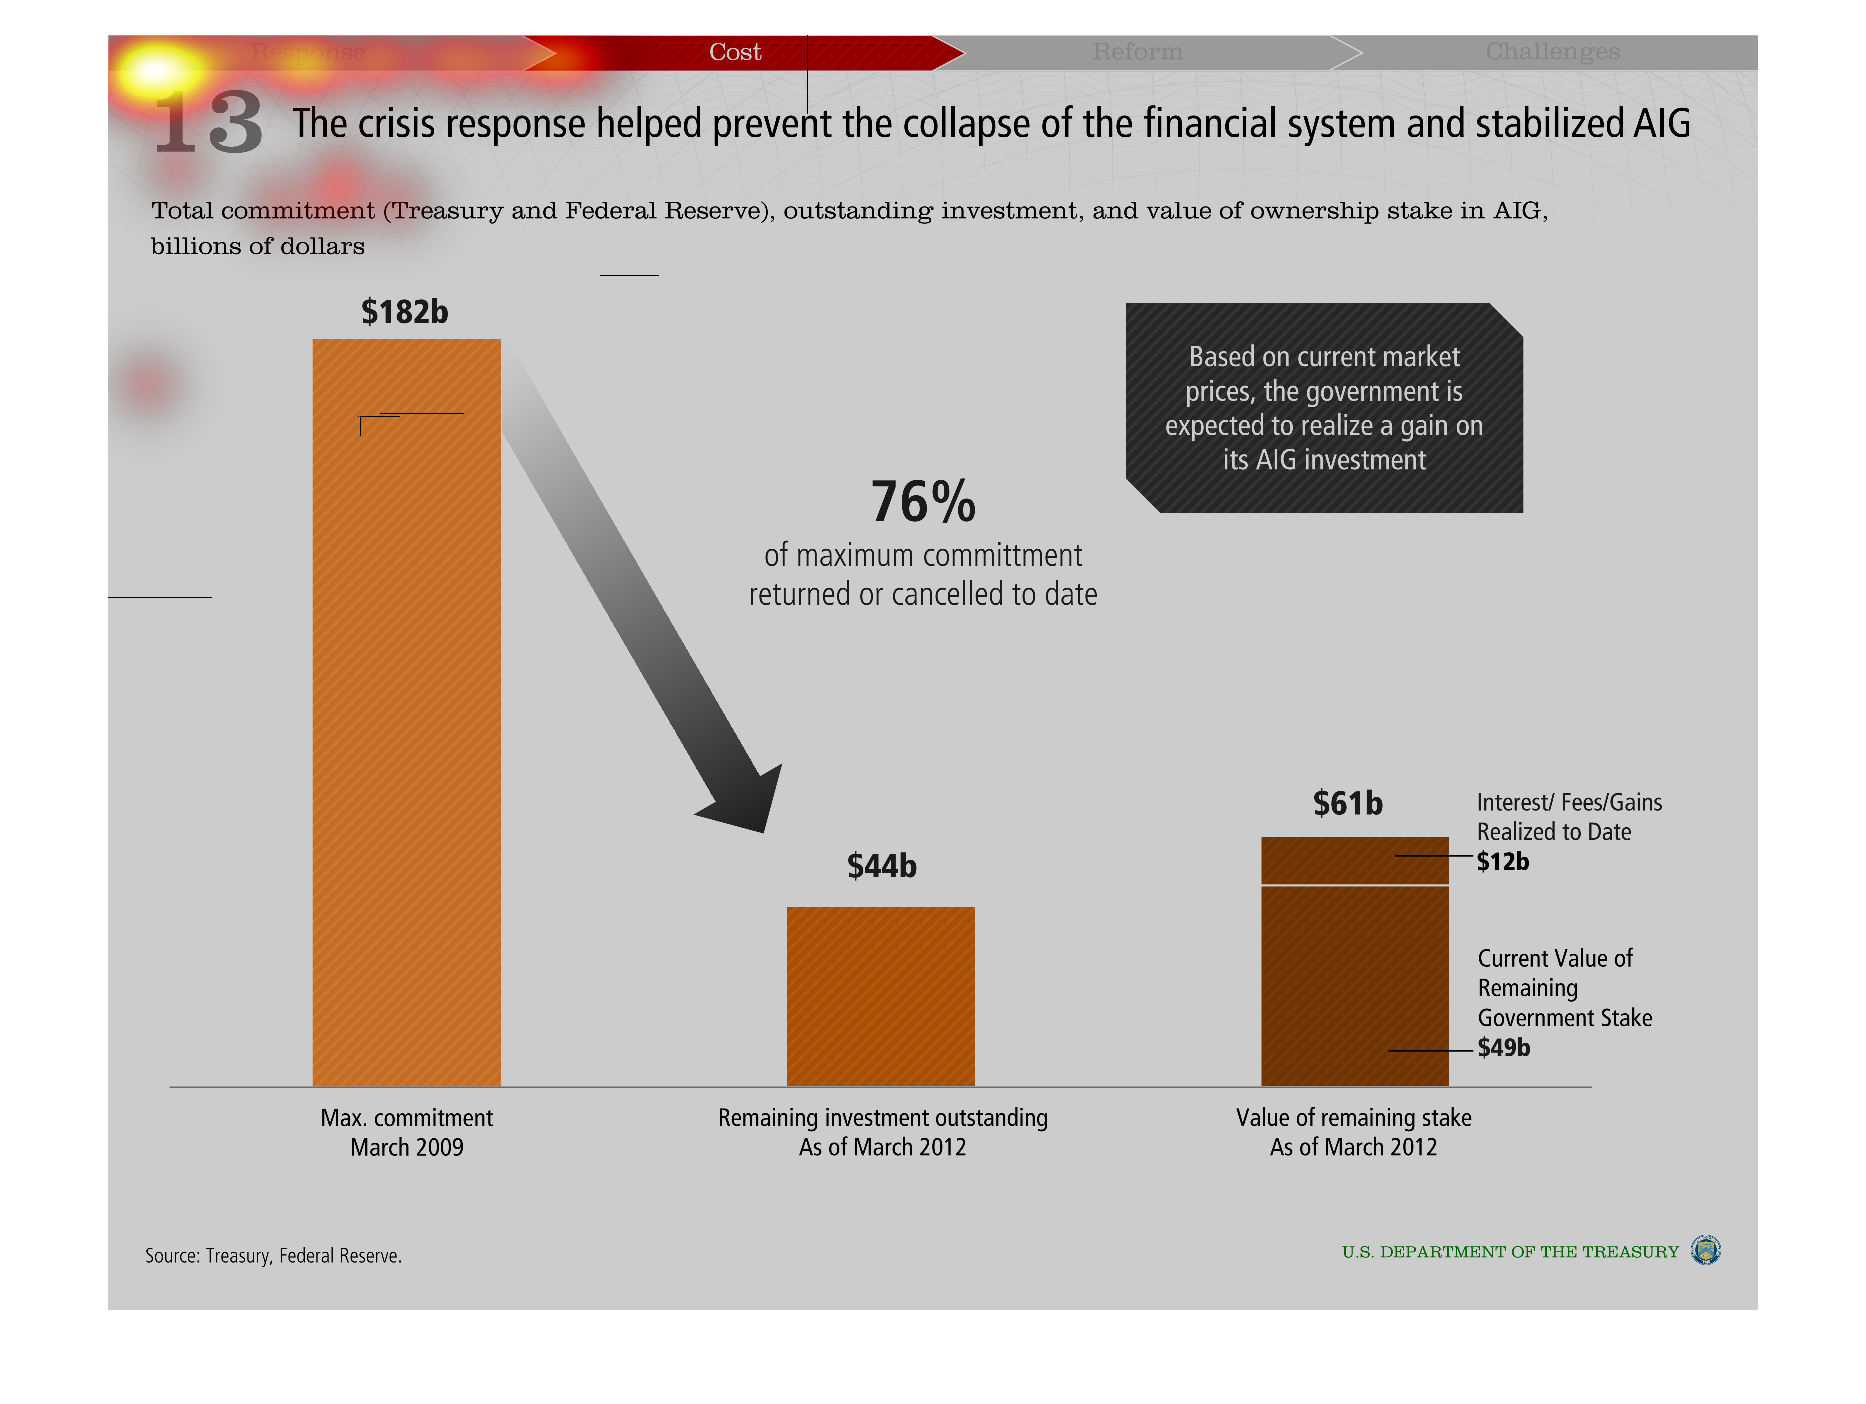
This infograph is talking about the returns of investments in the AIG. The government pledged
a lot more than they actually gave and are planned to see a gain on its AIG investments.
Warning: Image is too big to fit on screen; displaying at 50%
Warning: Image is too big to fit on screen; displaying at 50%


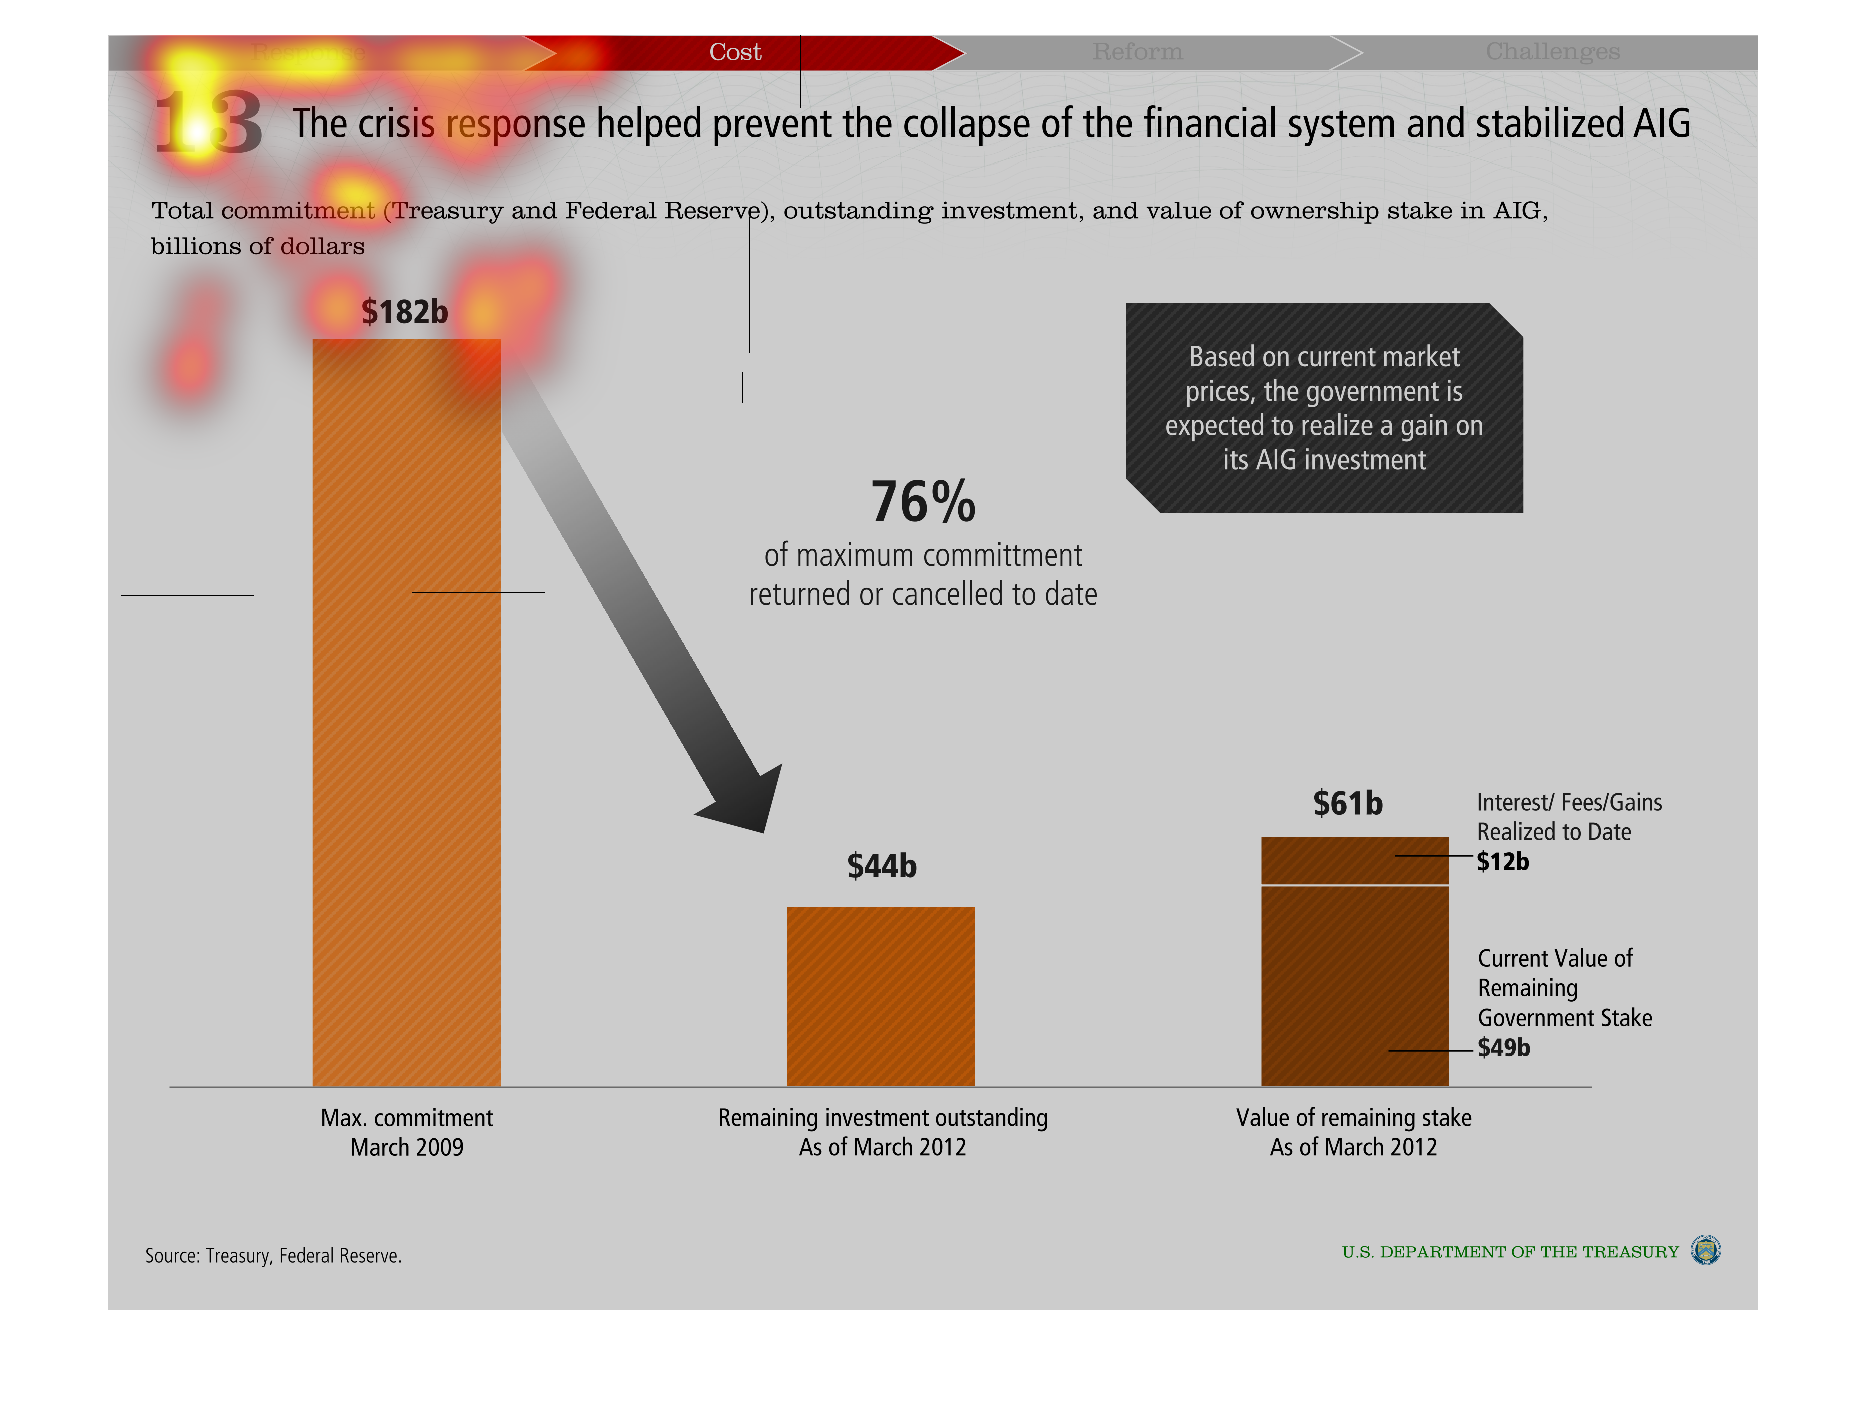
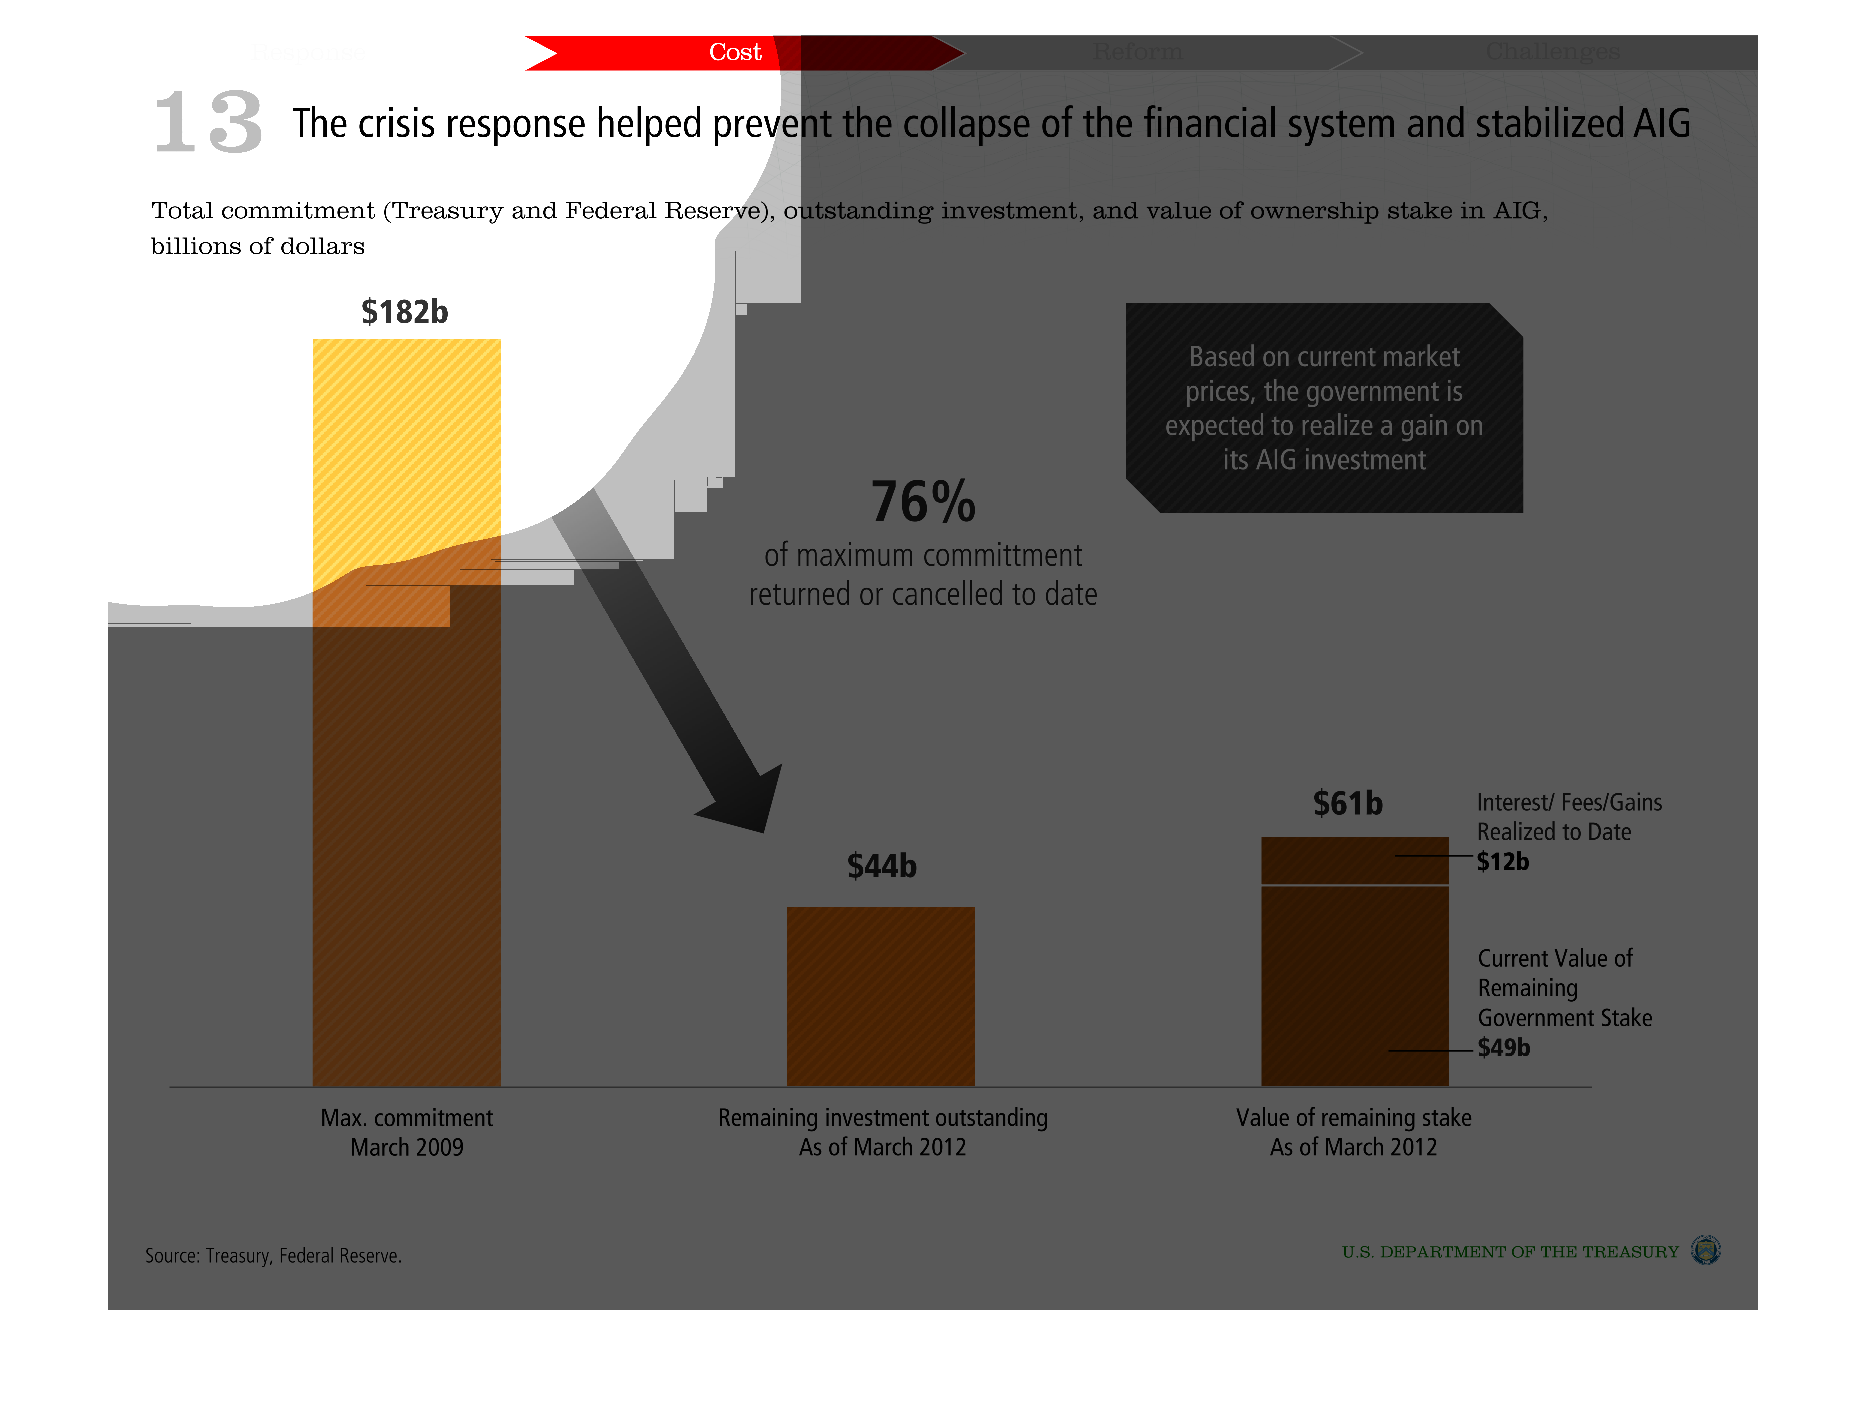
This infographic shows how the financial bailout saved AIG from certain doom. A colored bar
representing total commitment in 2009 shrinks to nearly 10% of its size in 2012. The remaining
stake is shown in a third bar for 2012.
Warning: Image is too big to fit on screen; displaying at 50%
Warning: Image is too big to fit on screen; displaying at 50%

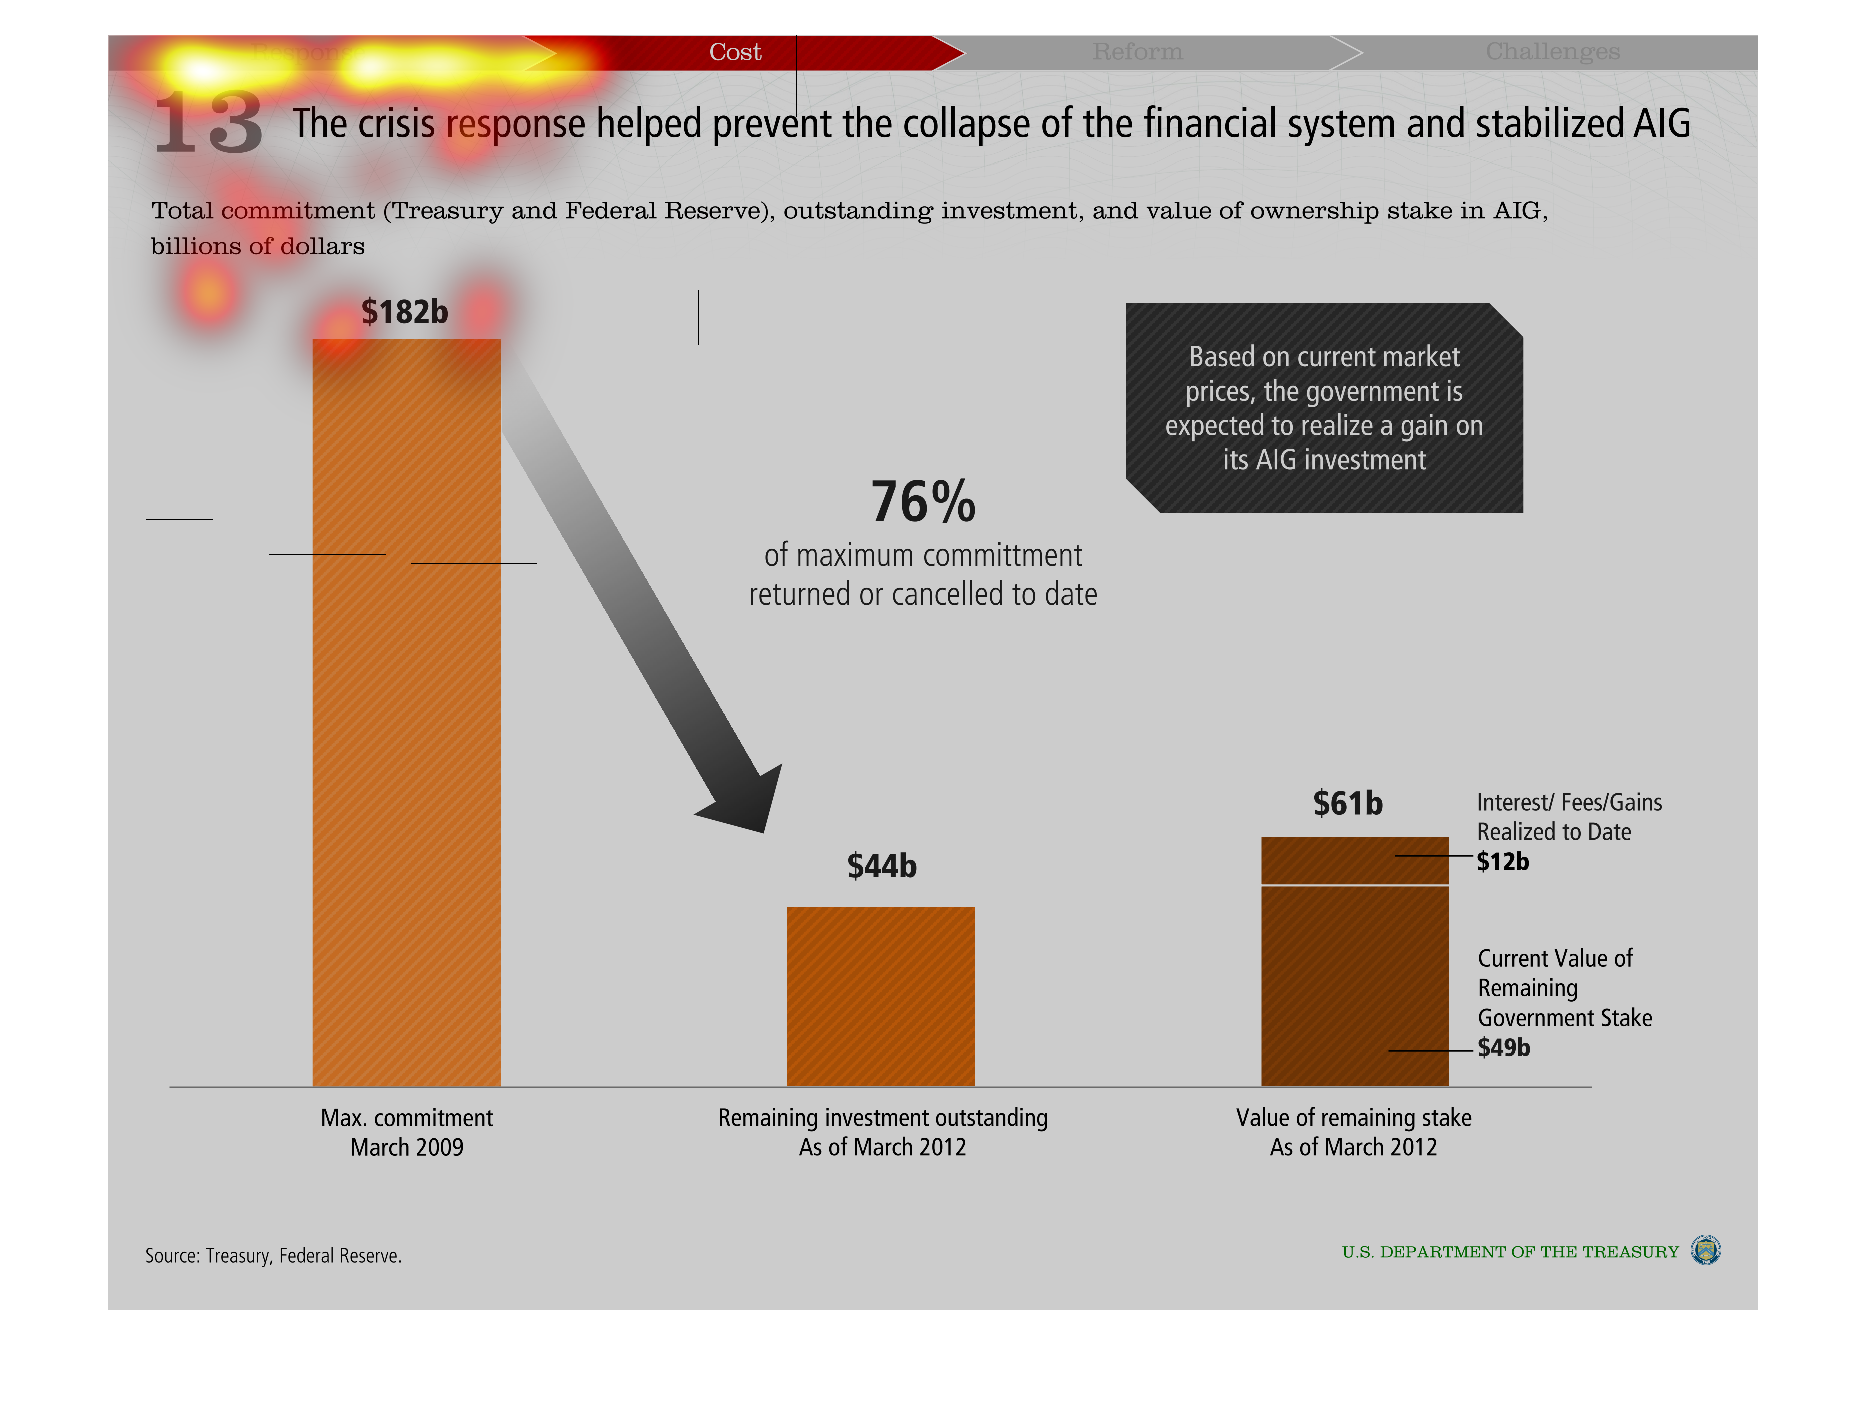
the crisis response helped prevent the collapse of the financial system and stabaliized AIG,
once again, i cannot read anything in this infographic...
Warning: Image is too big to fit on screen; displaying at 50%
Warning: Image is too big to fit on screen; displaying at 50%
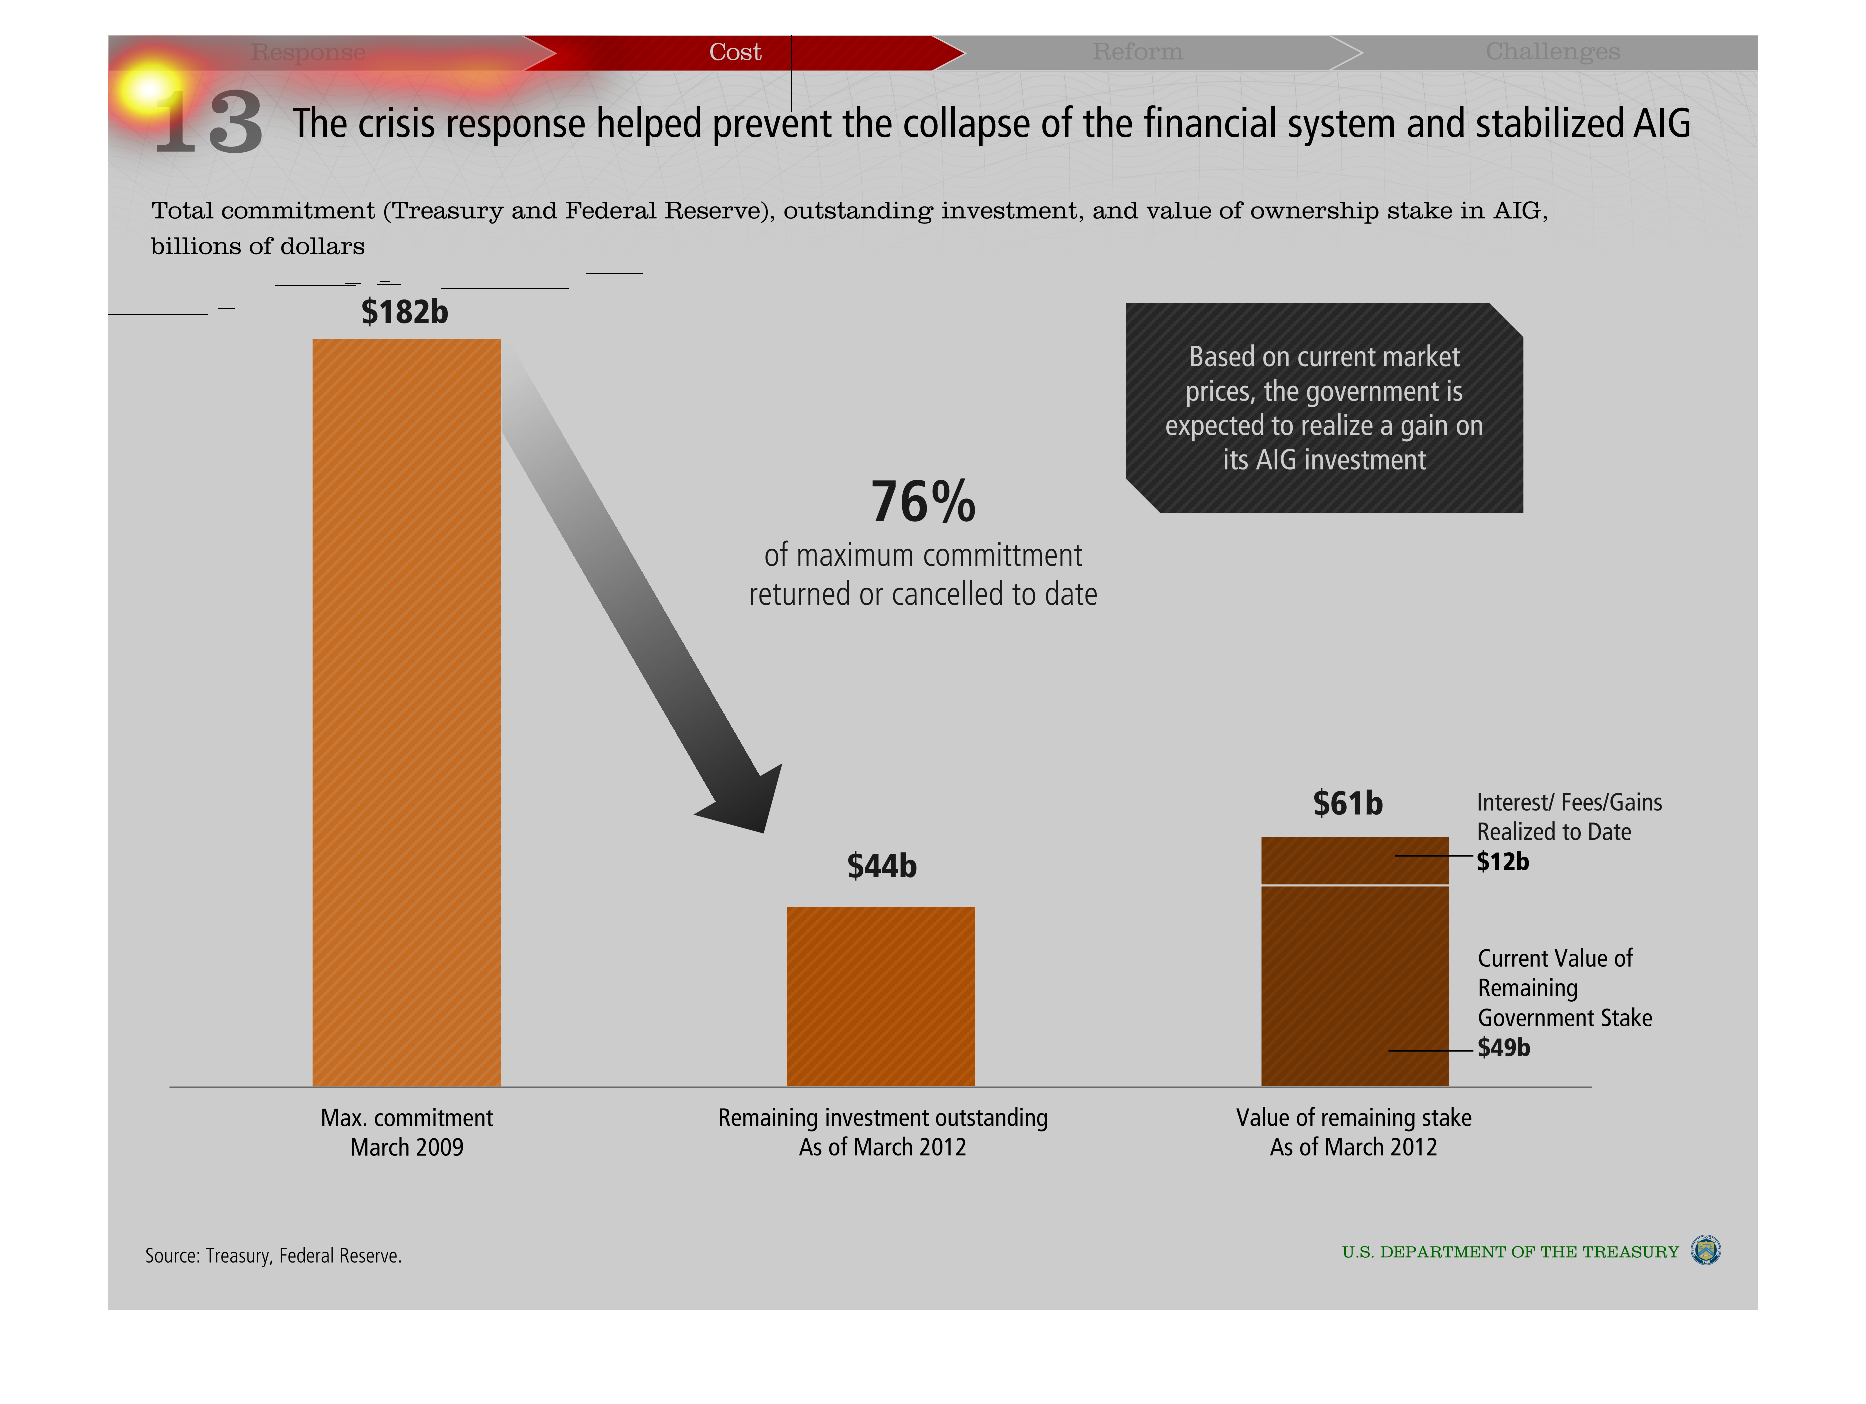
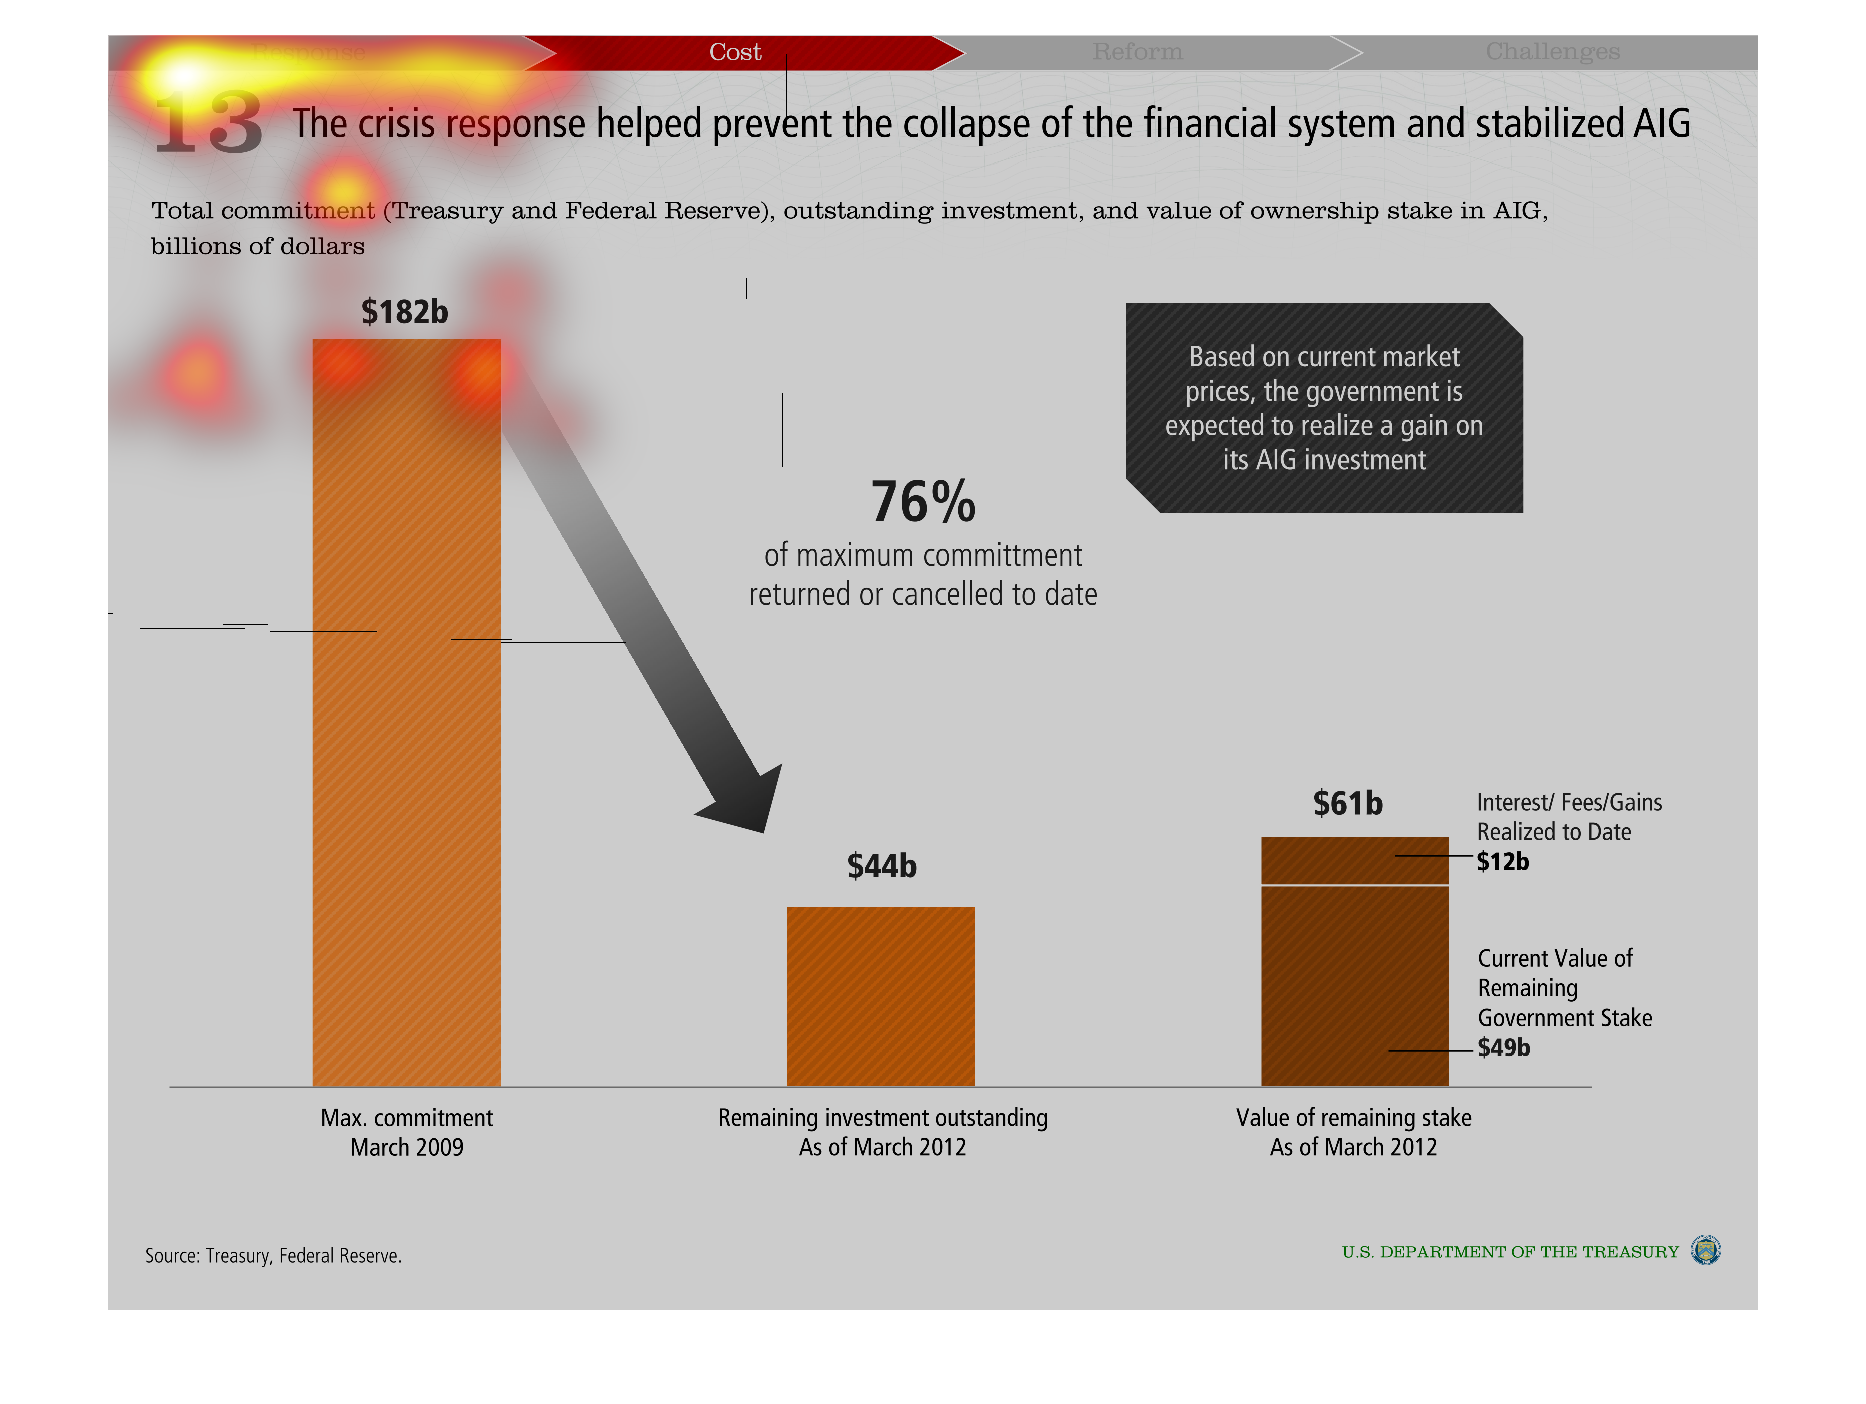
This is a graphical chart showing that the response to the financial crises helped prevent
the collapse of the financial system and also stabilized AIG.
Warning: Image is too big to fit on screen; displaying at 50%
Warning: Image is too big to fit on screen; displaying at 50%
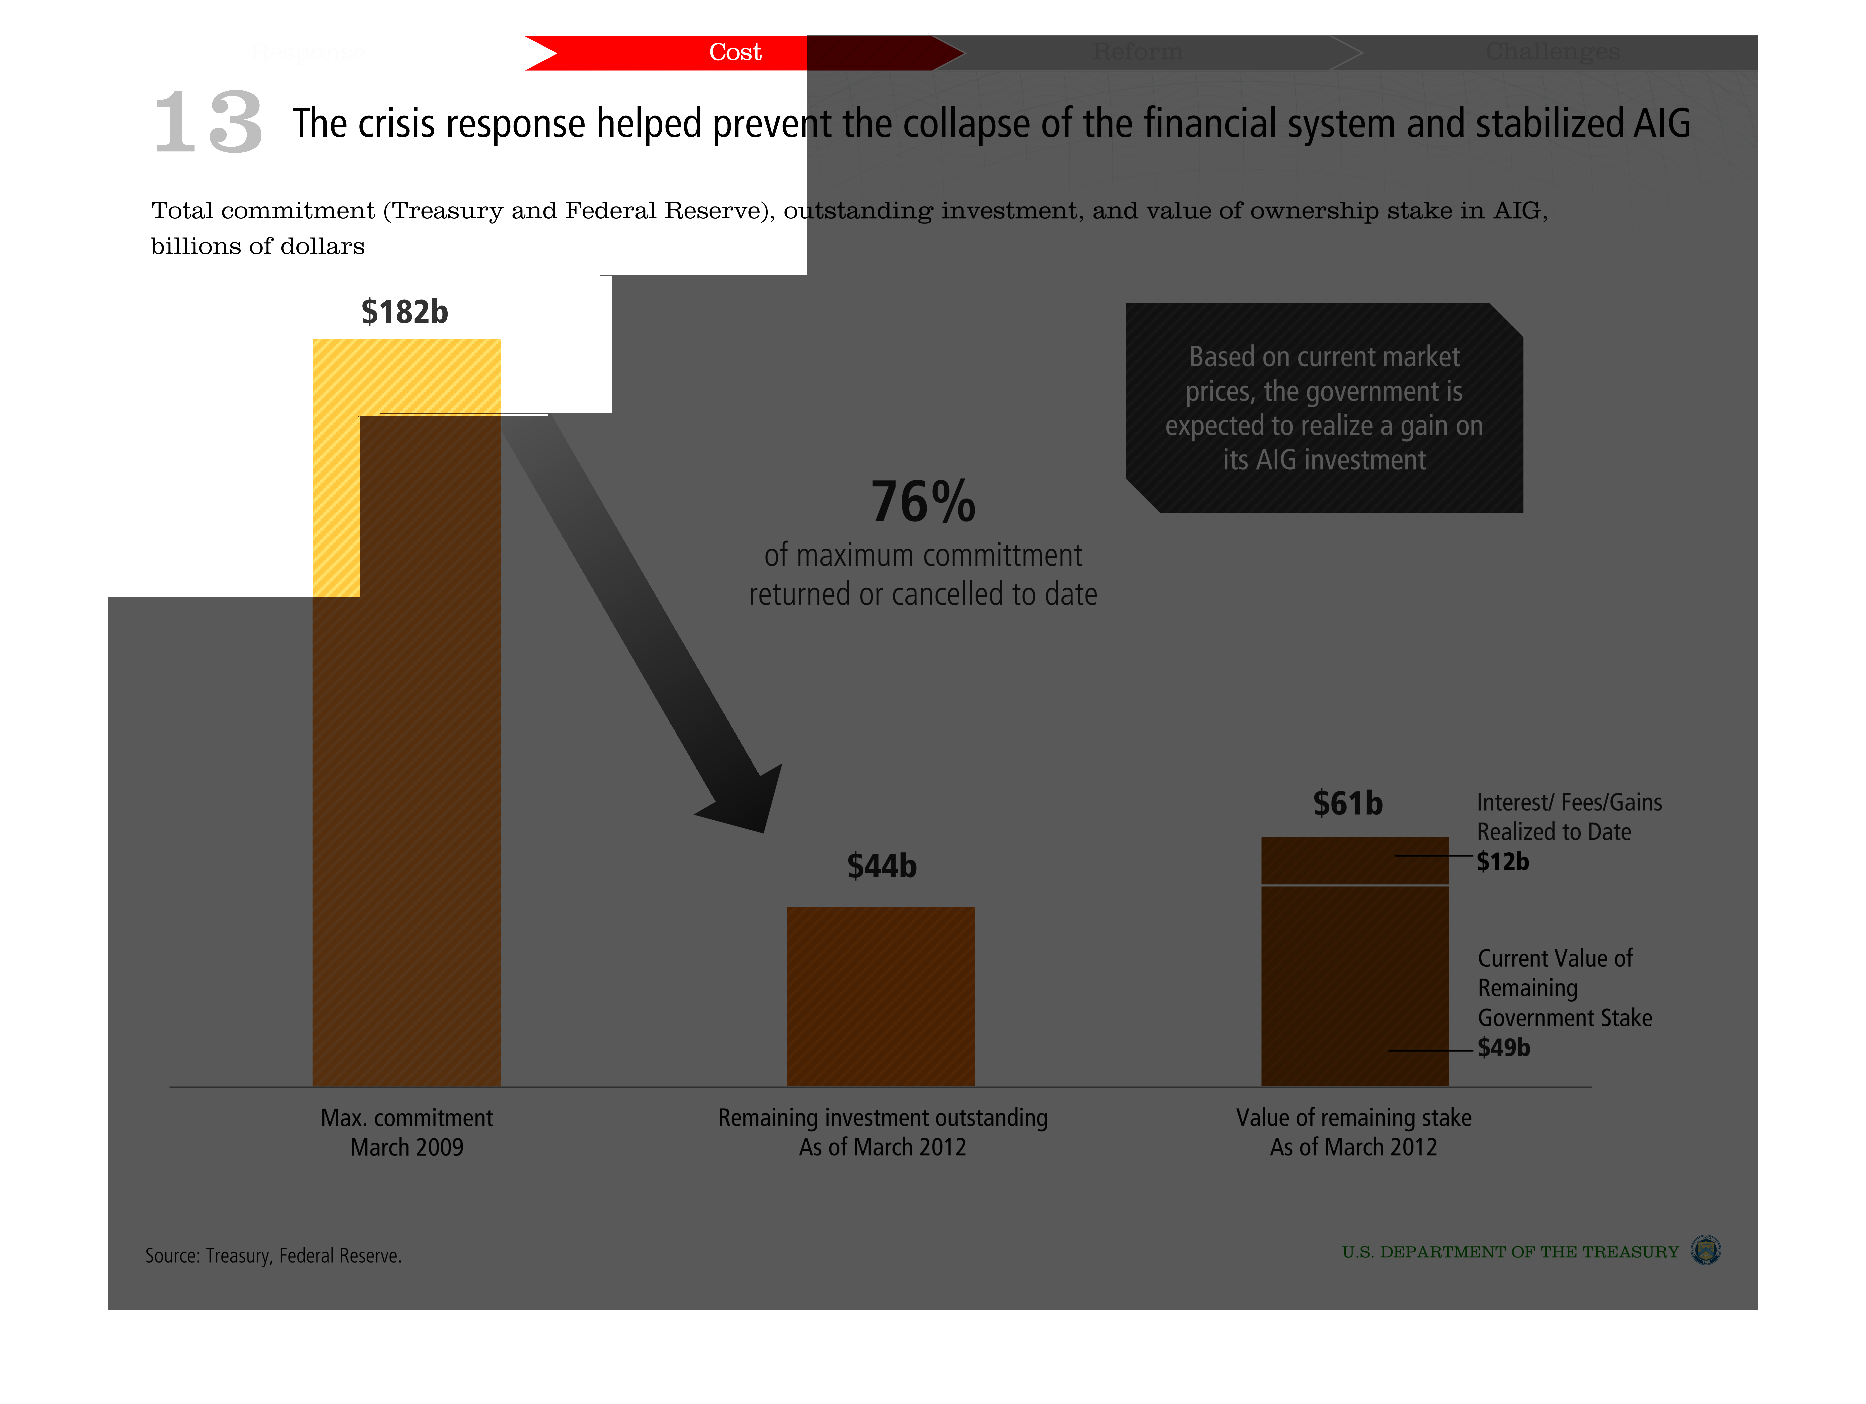
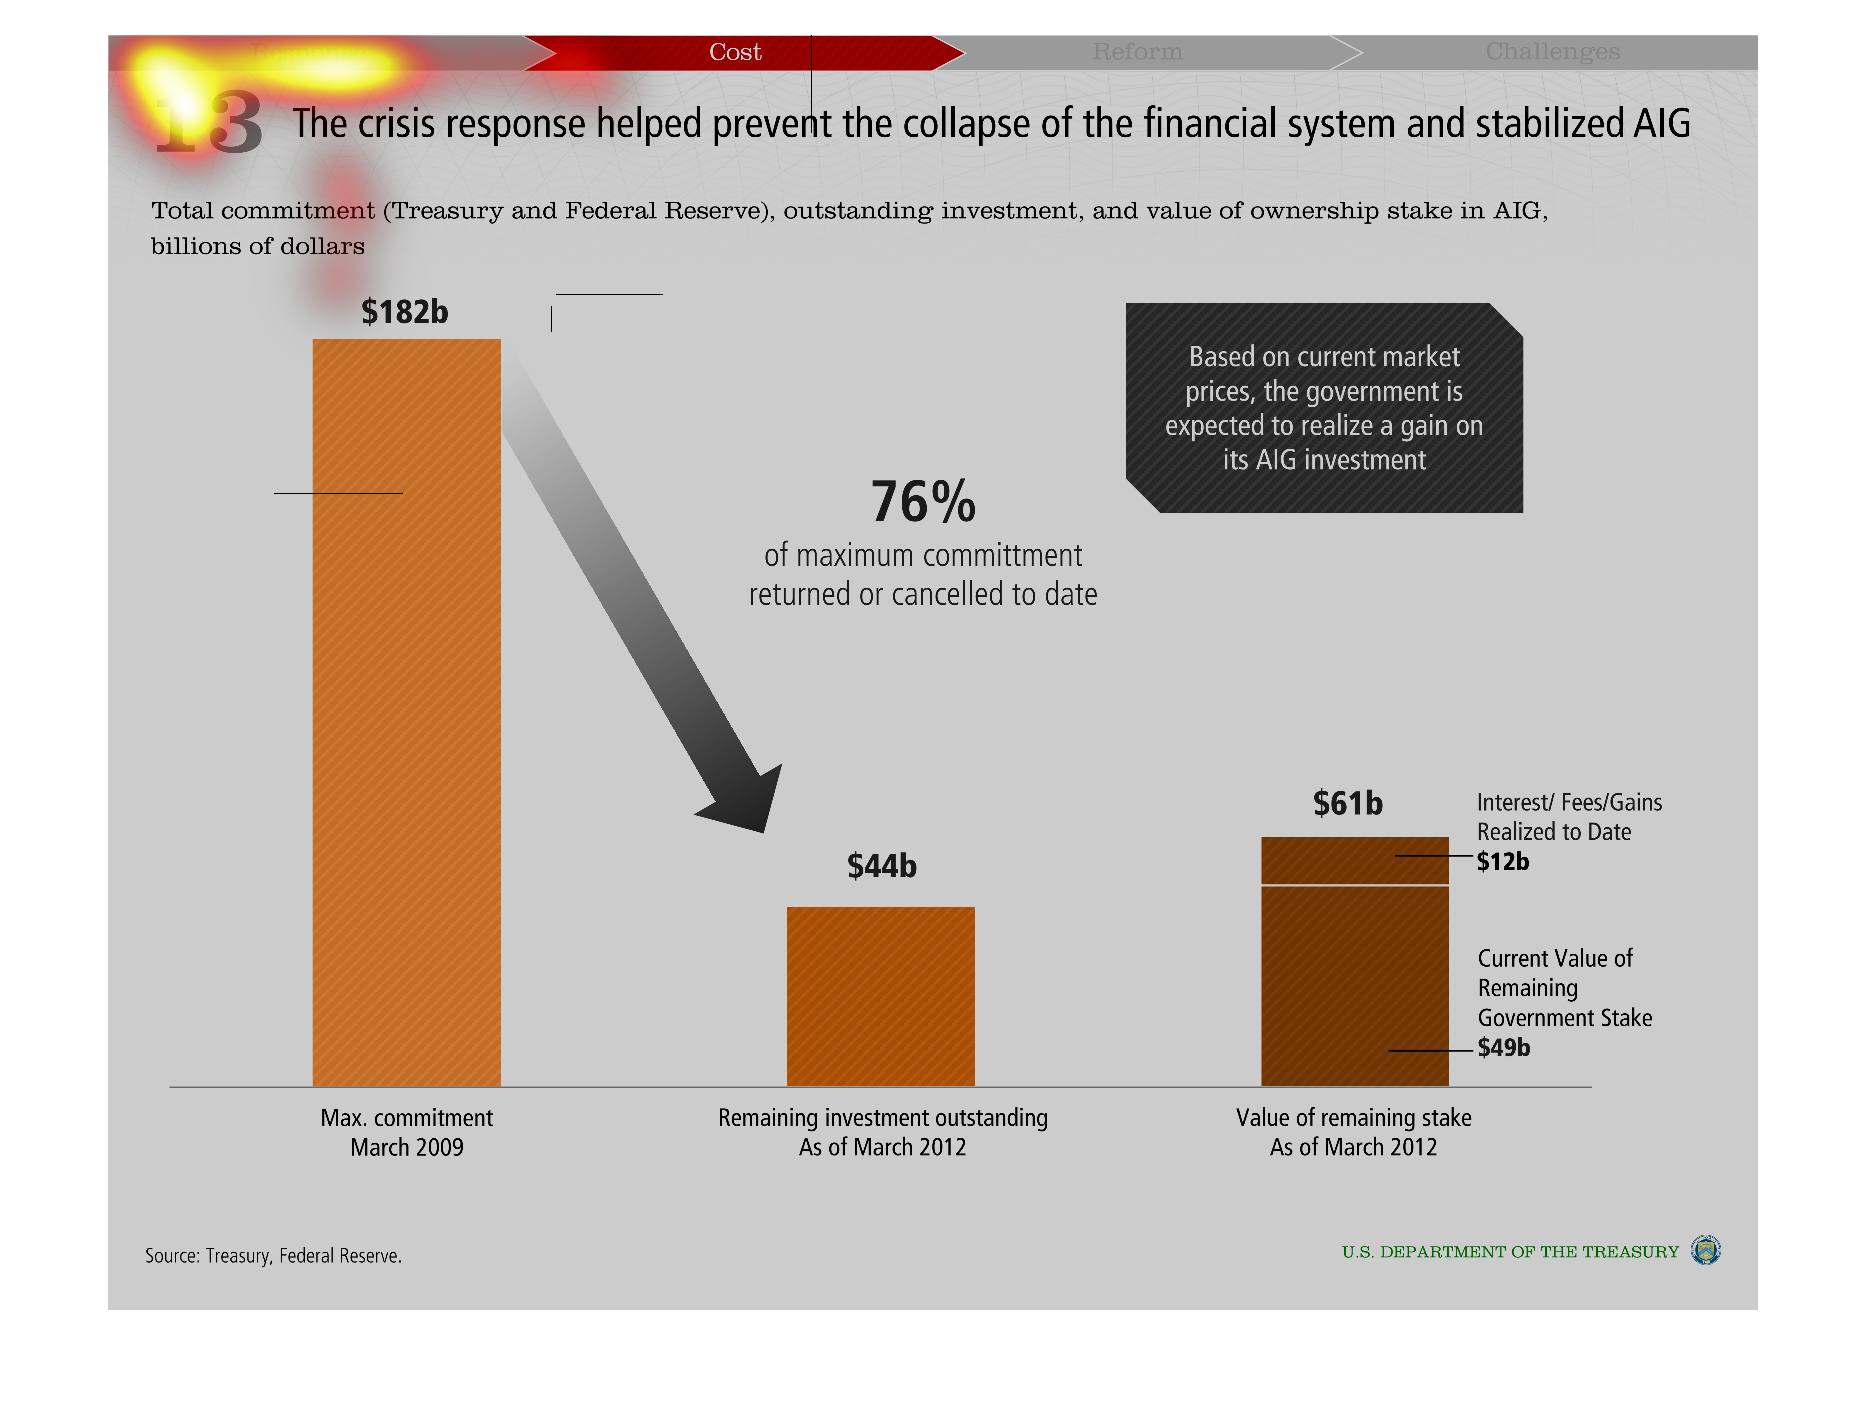
A bar graph showing the impact that the crisis response had in preventing the failure of the
financial system back in March 2009 and how it stablized the AIG
Warning: Image is too big to fit on screen; displaying at 50%
Warning: Image is too big to fit on screen; displaying at 50%

This graph shows the amount of return the banks are expected to get for their investments
in the bank. This states that the amount of money owed will be reduced over time per the graphics
Warning: Image is too big to fit on screen; displaying at 50%
Warning: Image is too big to fit on screen; displaying at 50%
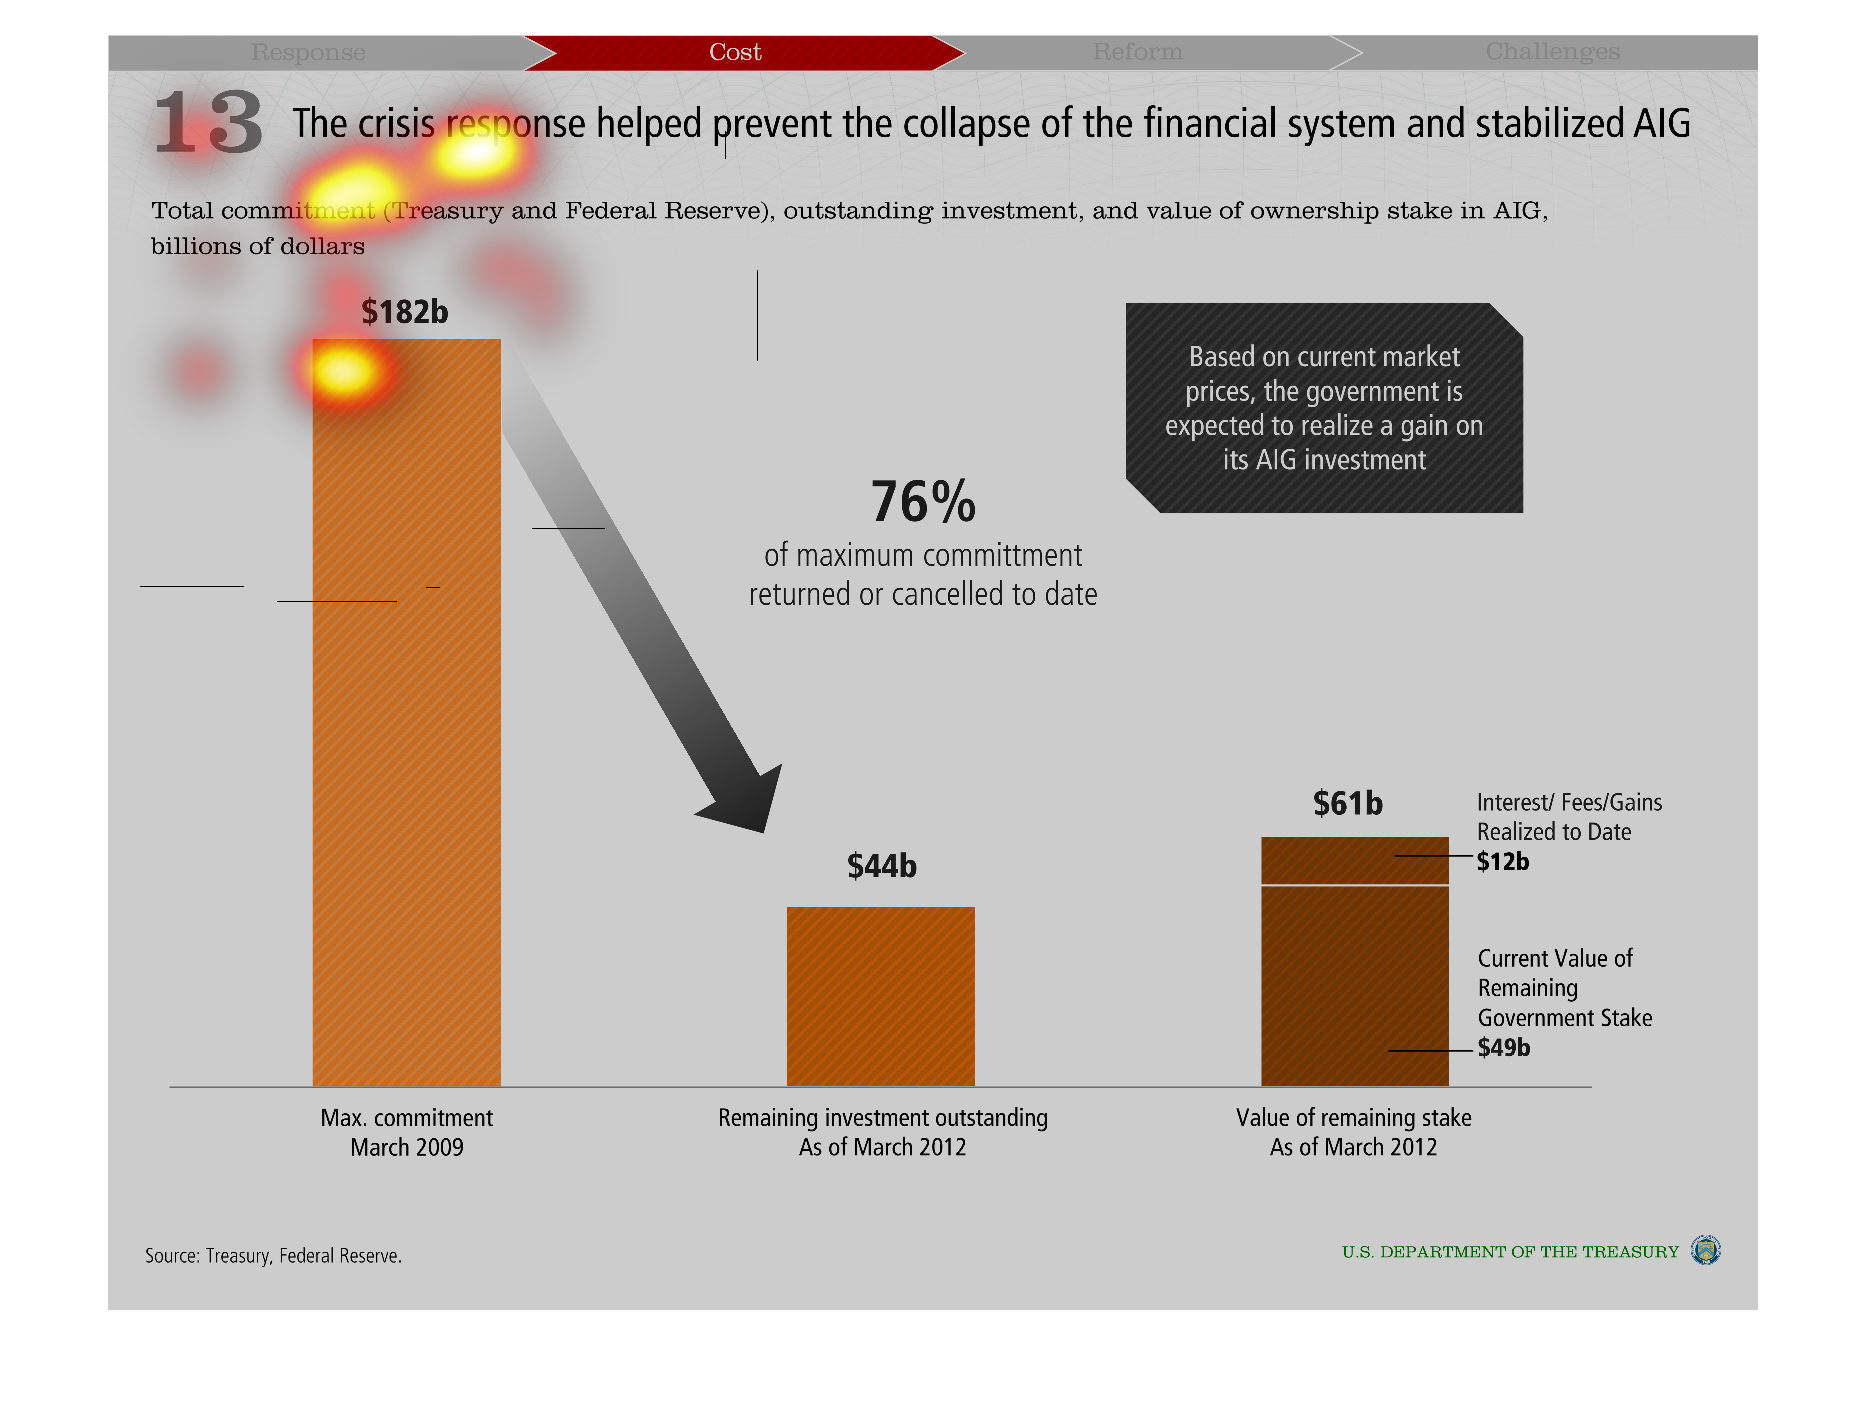
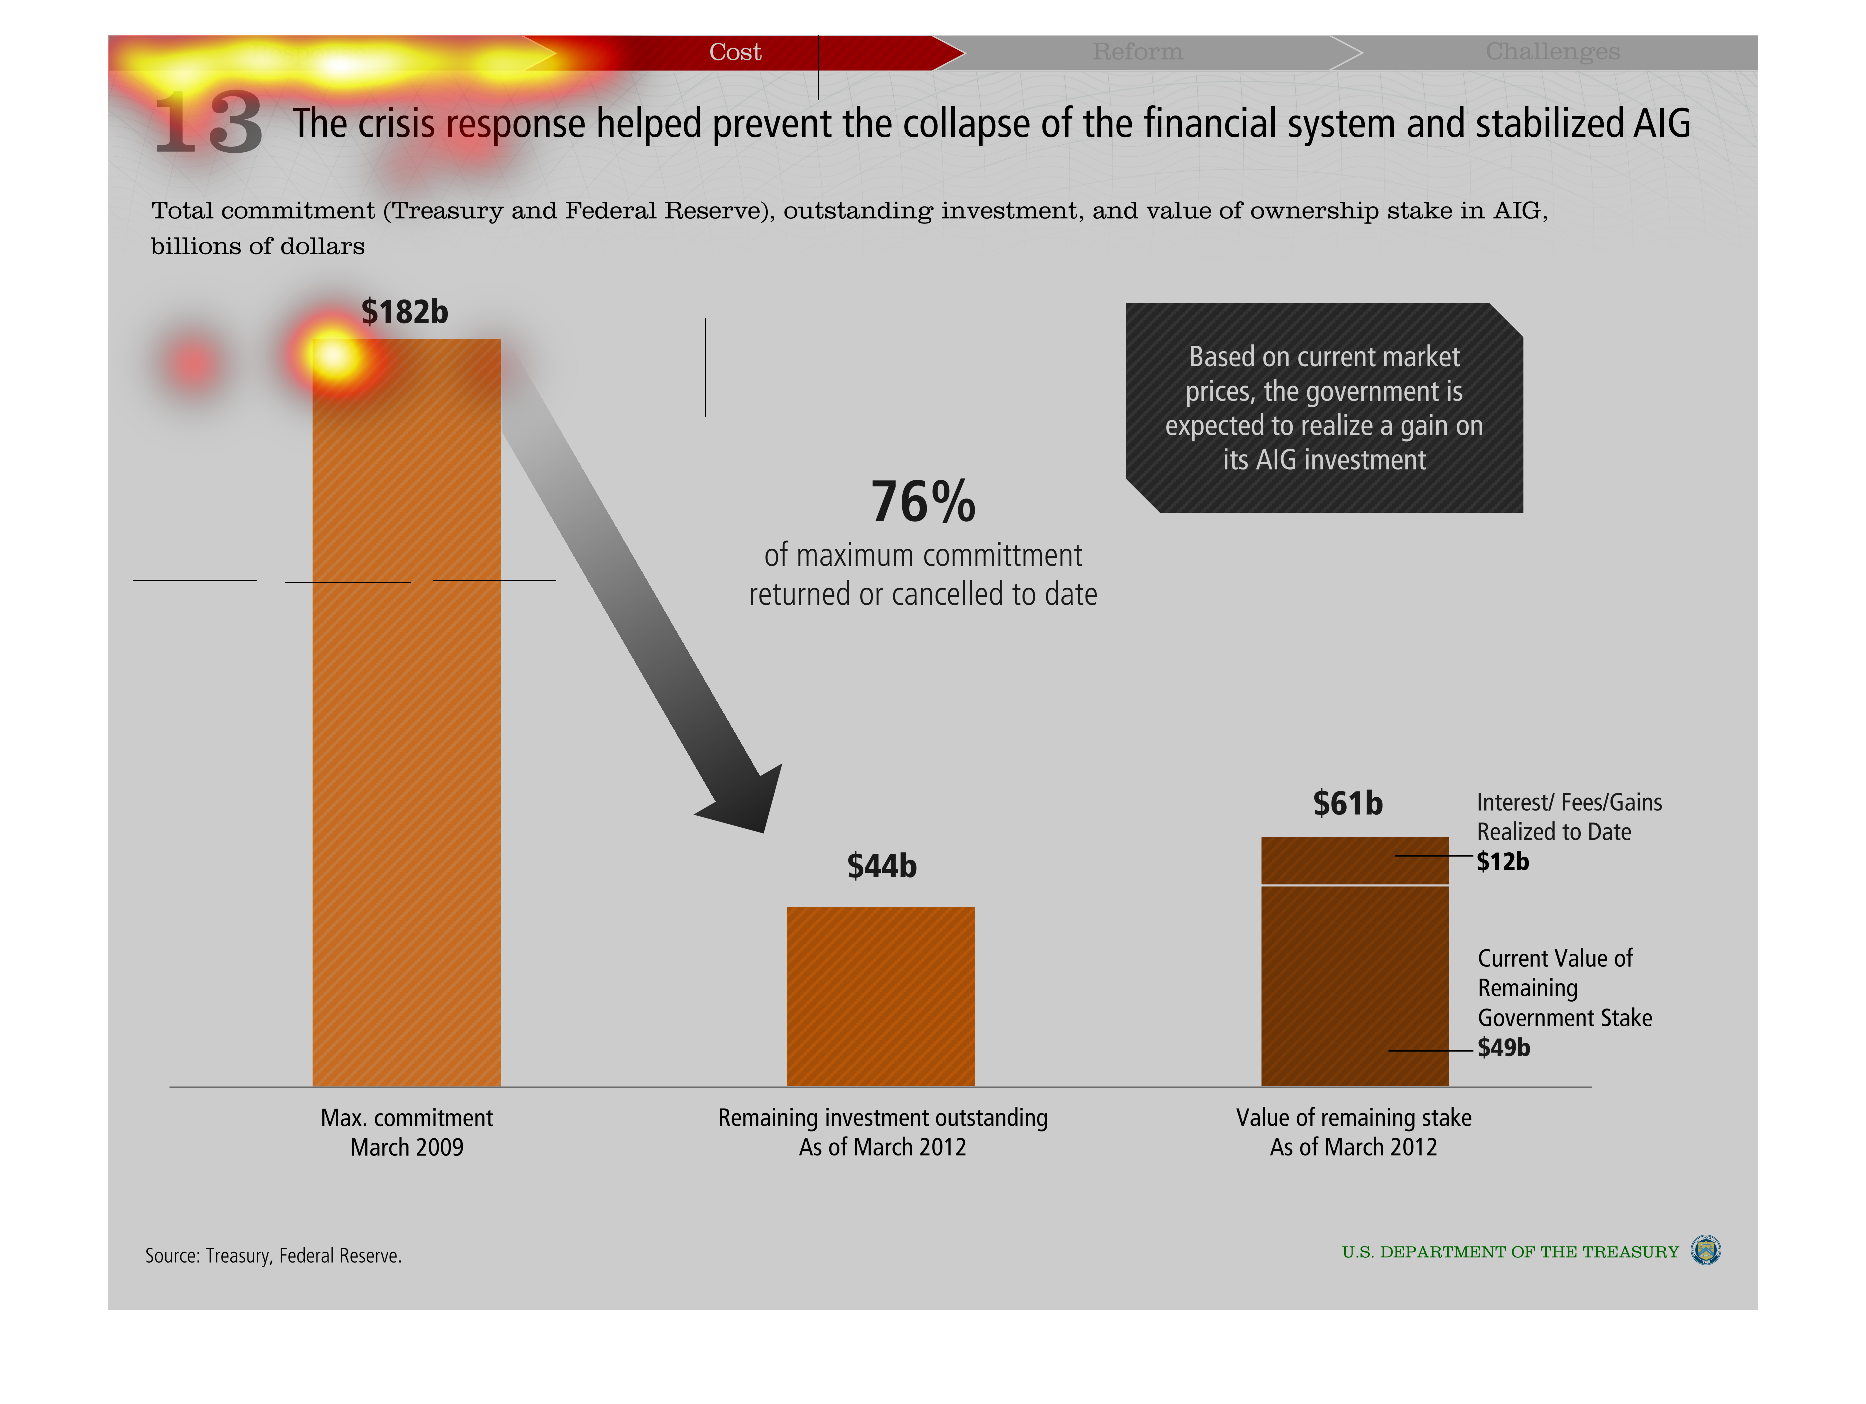
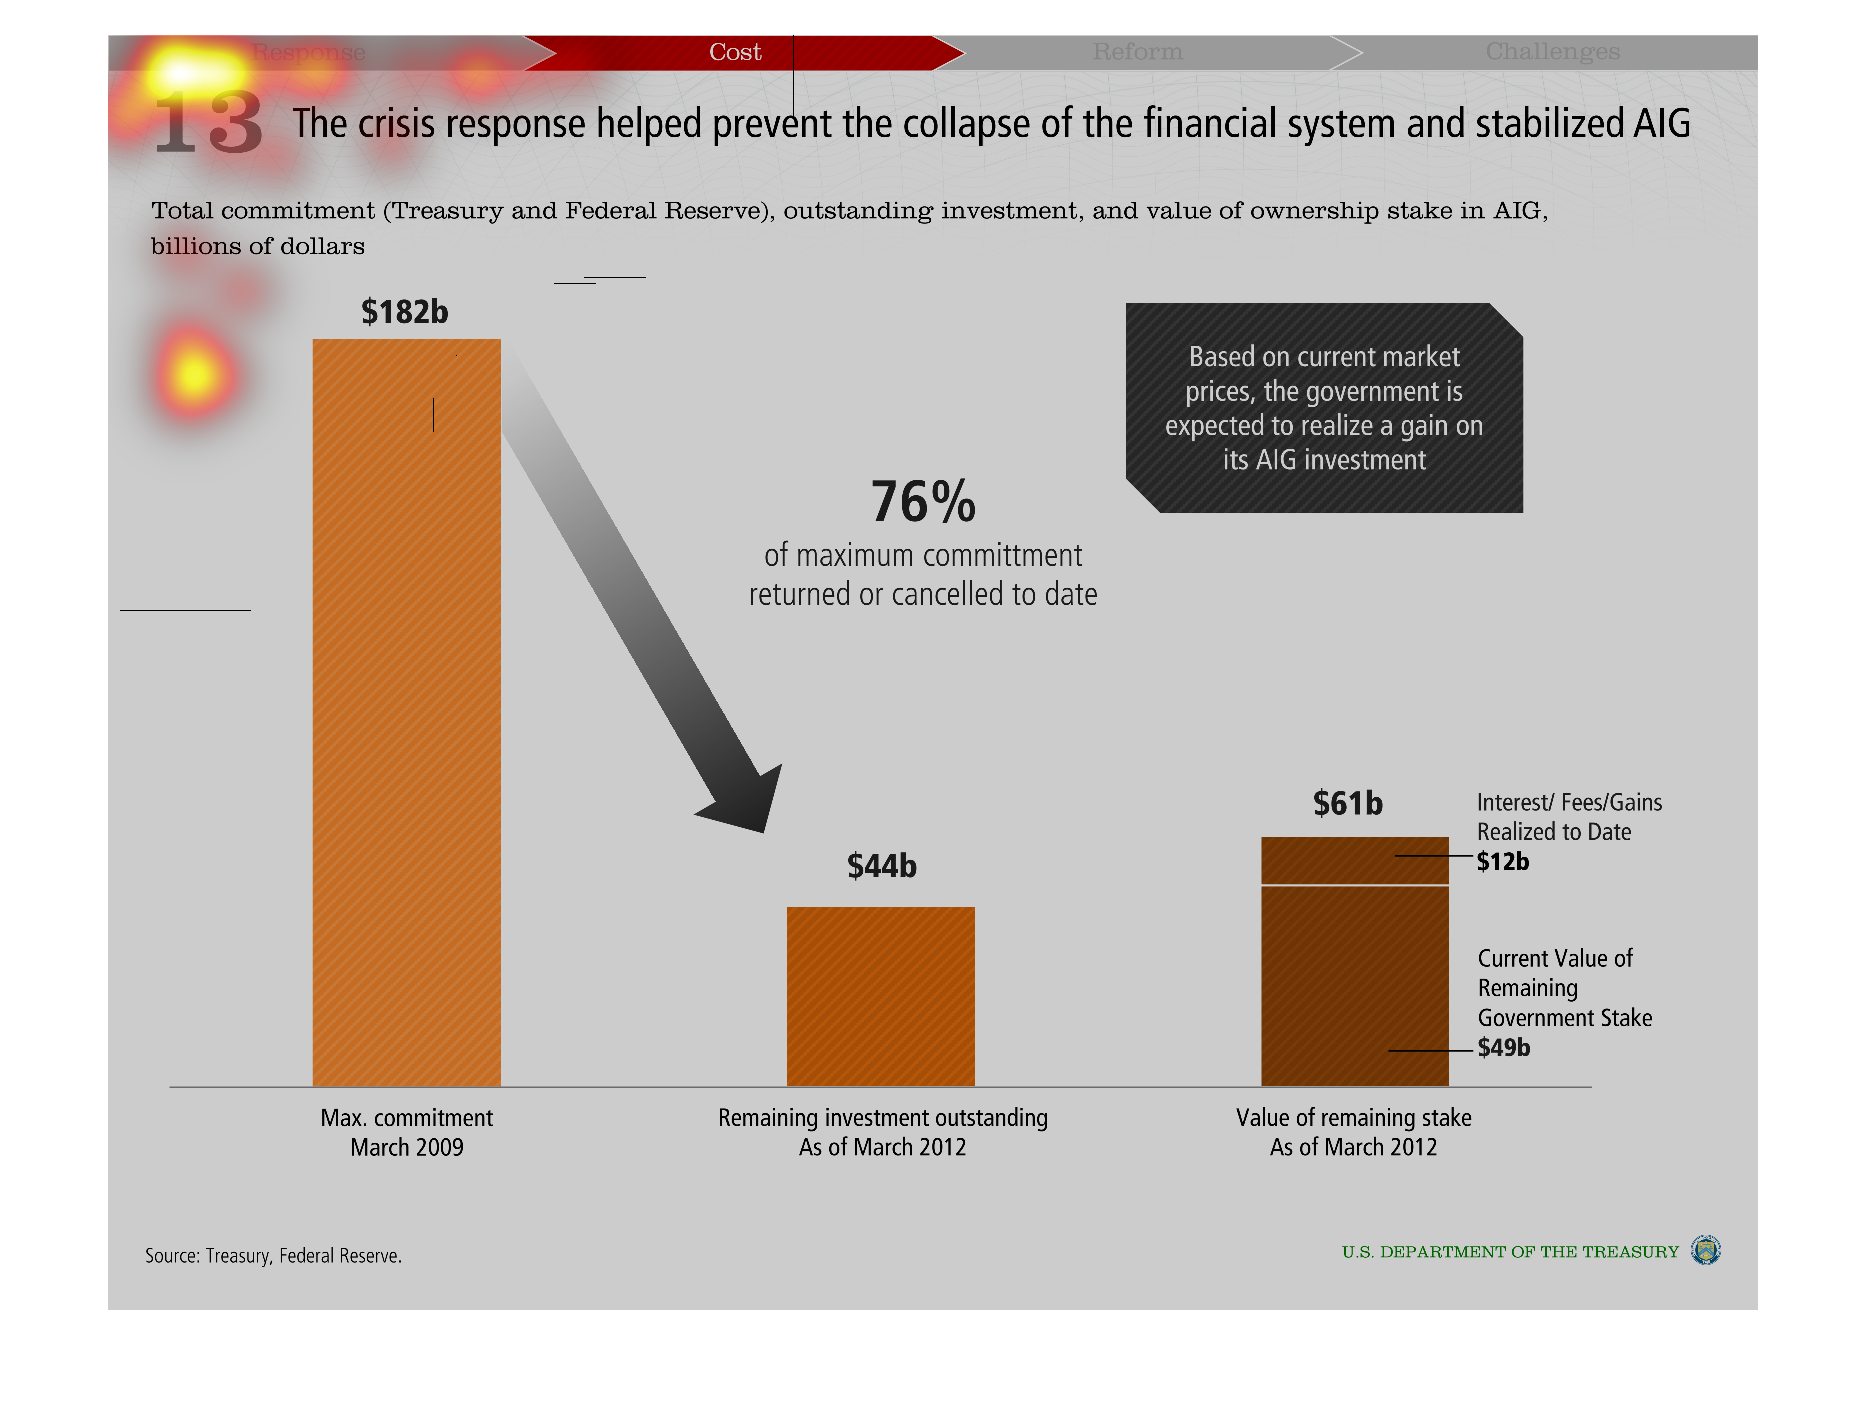
This chart shows financial crisis was lessened by the crisis, and prevented the financial
collapse. it shows 76% of the maximum commitment of 182 billion was cancelled or returned.
Warning: Image is too big to fit on screen; displaying at 50%
Warning: Image is too big to fit on screen; displaying at 50%
The graph states how the intervention of government helped the financial systems from totally
collapsing and states how without it things would have been a whole lot worse.
Warning: Image is too big to fit on screen; displaying at 50%
Warning: Image is too big to fit on screen; displaying at 50%
This chart purports to show the collapse of the financial system, as well as the effects of
preventing it. It does not seem that the prevention efforts have worked.
Warning: Image is too big to fit on screen; displaying at 50%
Warning: Image is too big to fit on screen; displaying at 50%
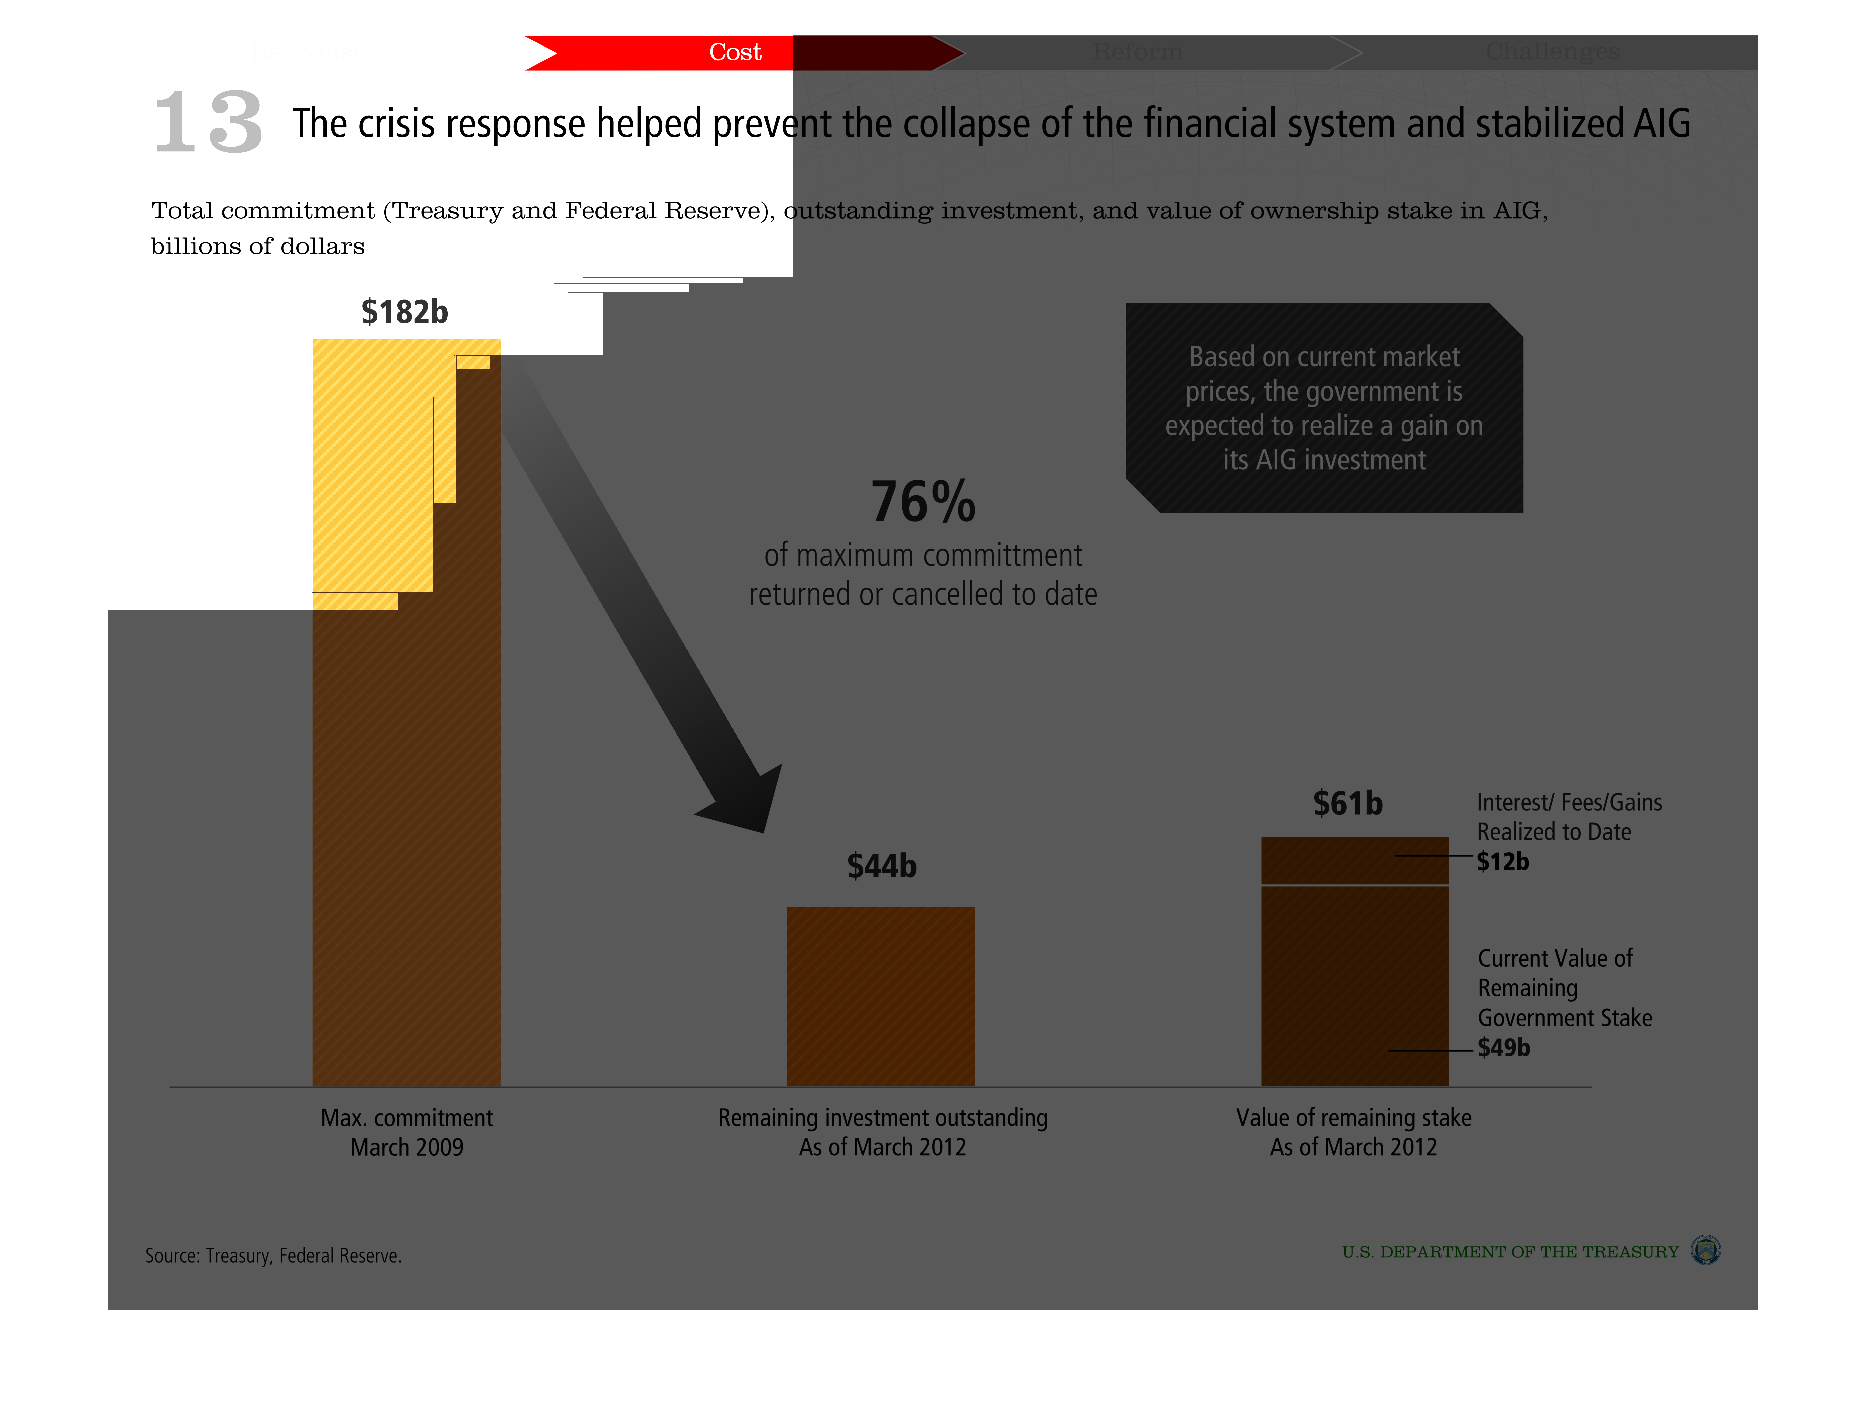
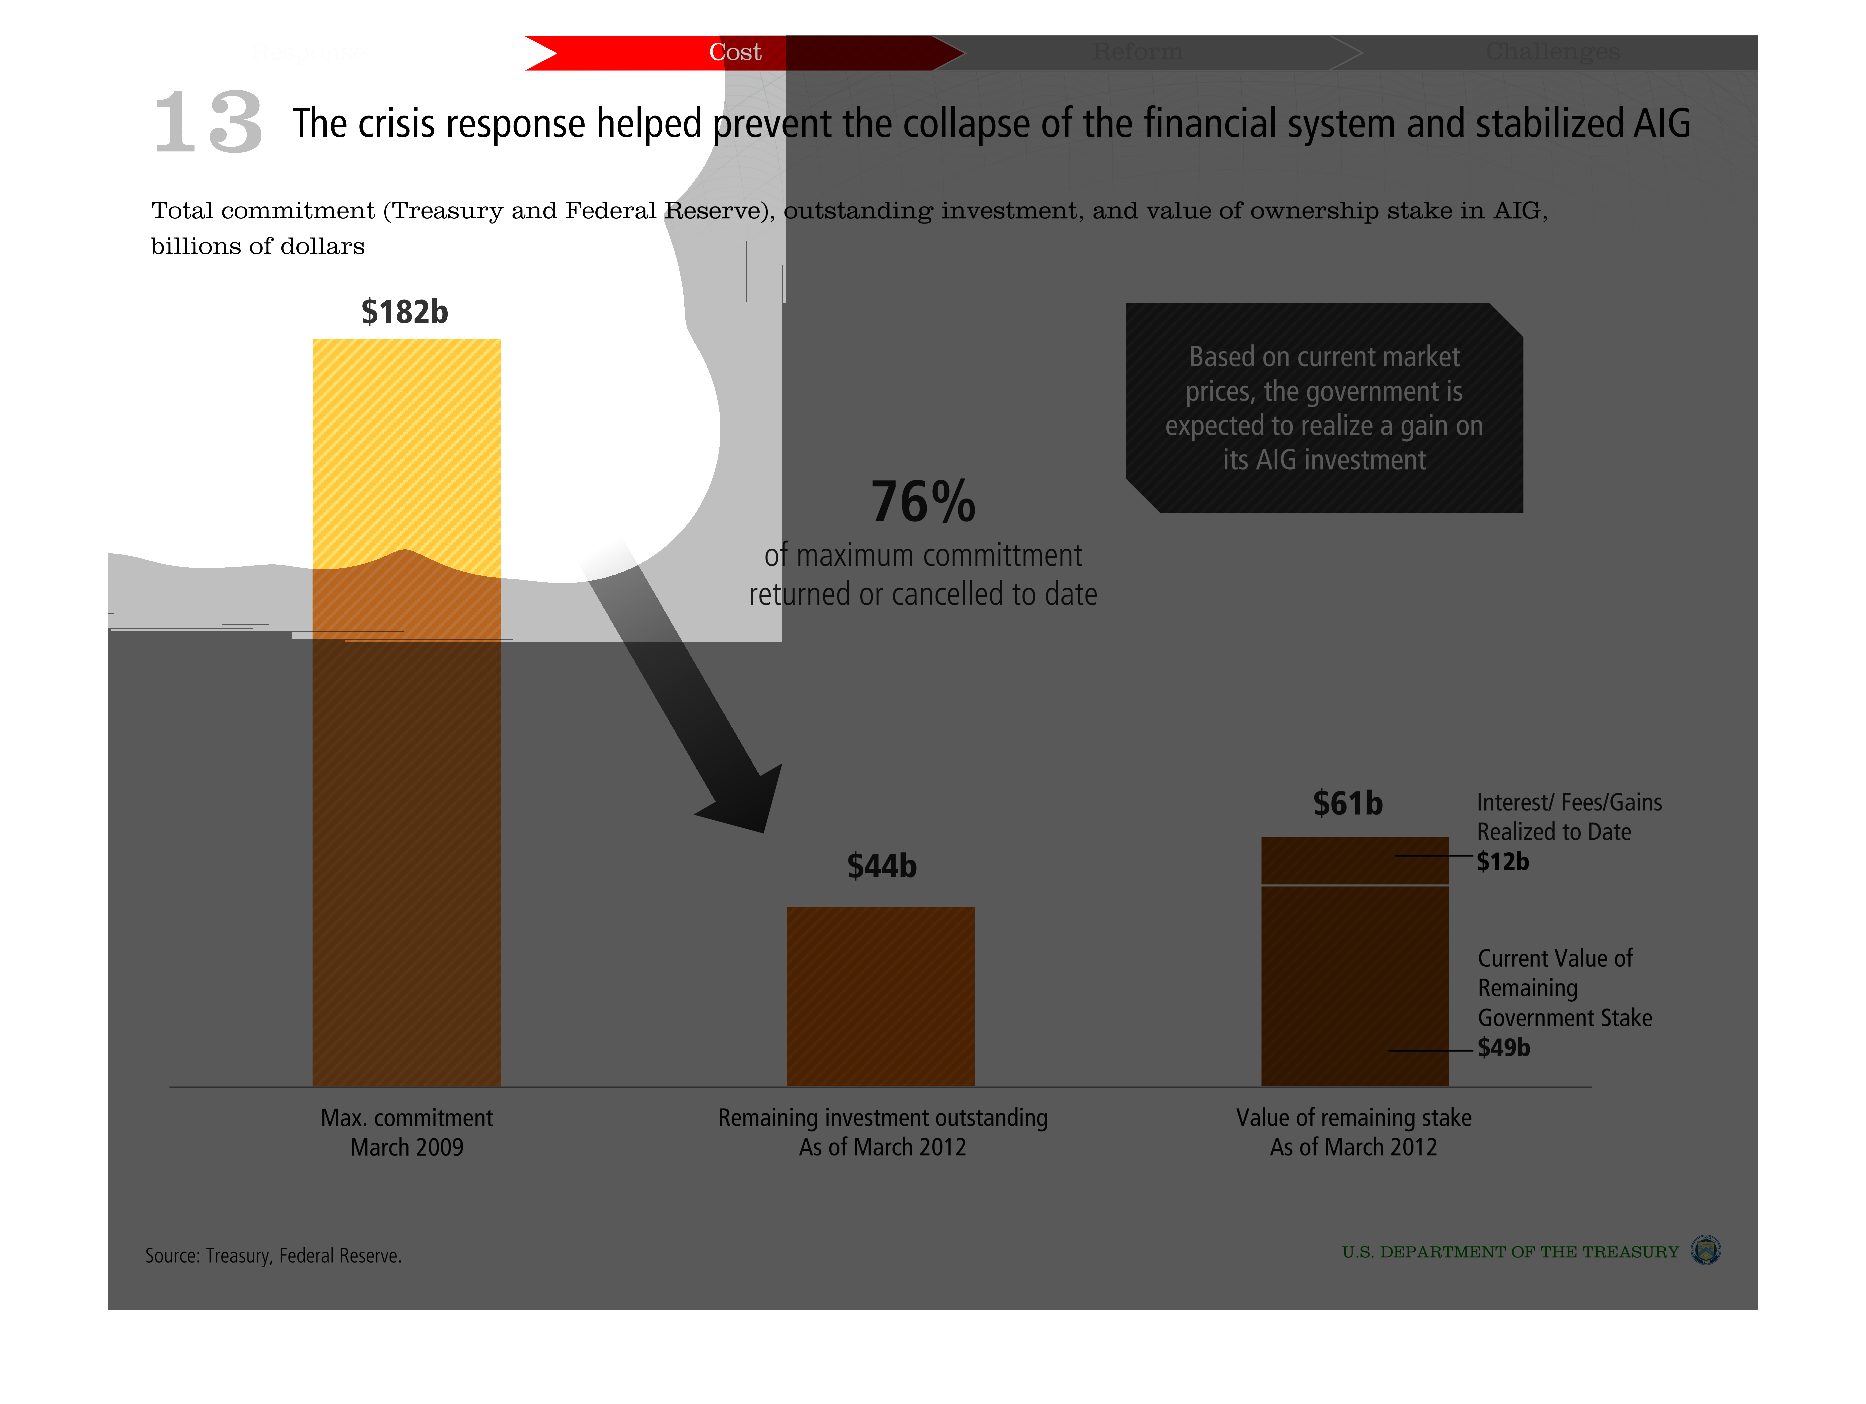
This is a simble bar chart illustrating how AIG collapsed in the recession and was brought
up by government intervention. It is expected that it will grow and survive.
Warning: Image is too big to fit on screen; displaying at 50%
Warning: Image is too big to fit on screen; displaying at 50%
This image shows or depicts in various statistical formats the crisis response helped prevent
the collapse of the financial system and stabilized AIG.
Warning: Image is too big to fit on screen; displaying at 50%
Warning: Image is too big to fit on screen; displaying at 50%

This graph shows how the crisis response helped prevent the collapse of the financial system.
 It shows the amount and describes the timeline of infusions from the Federal Reserve Bank.
Warning: Image is too big to fit on screen; displaying at 50%
Warning: Image is too big to fit on screen; displaying at 50%