Warning: Image is too big to fit on screen; displaying at 50%
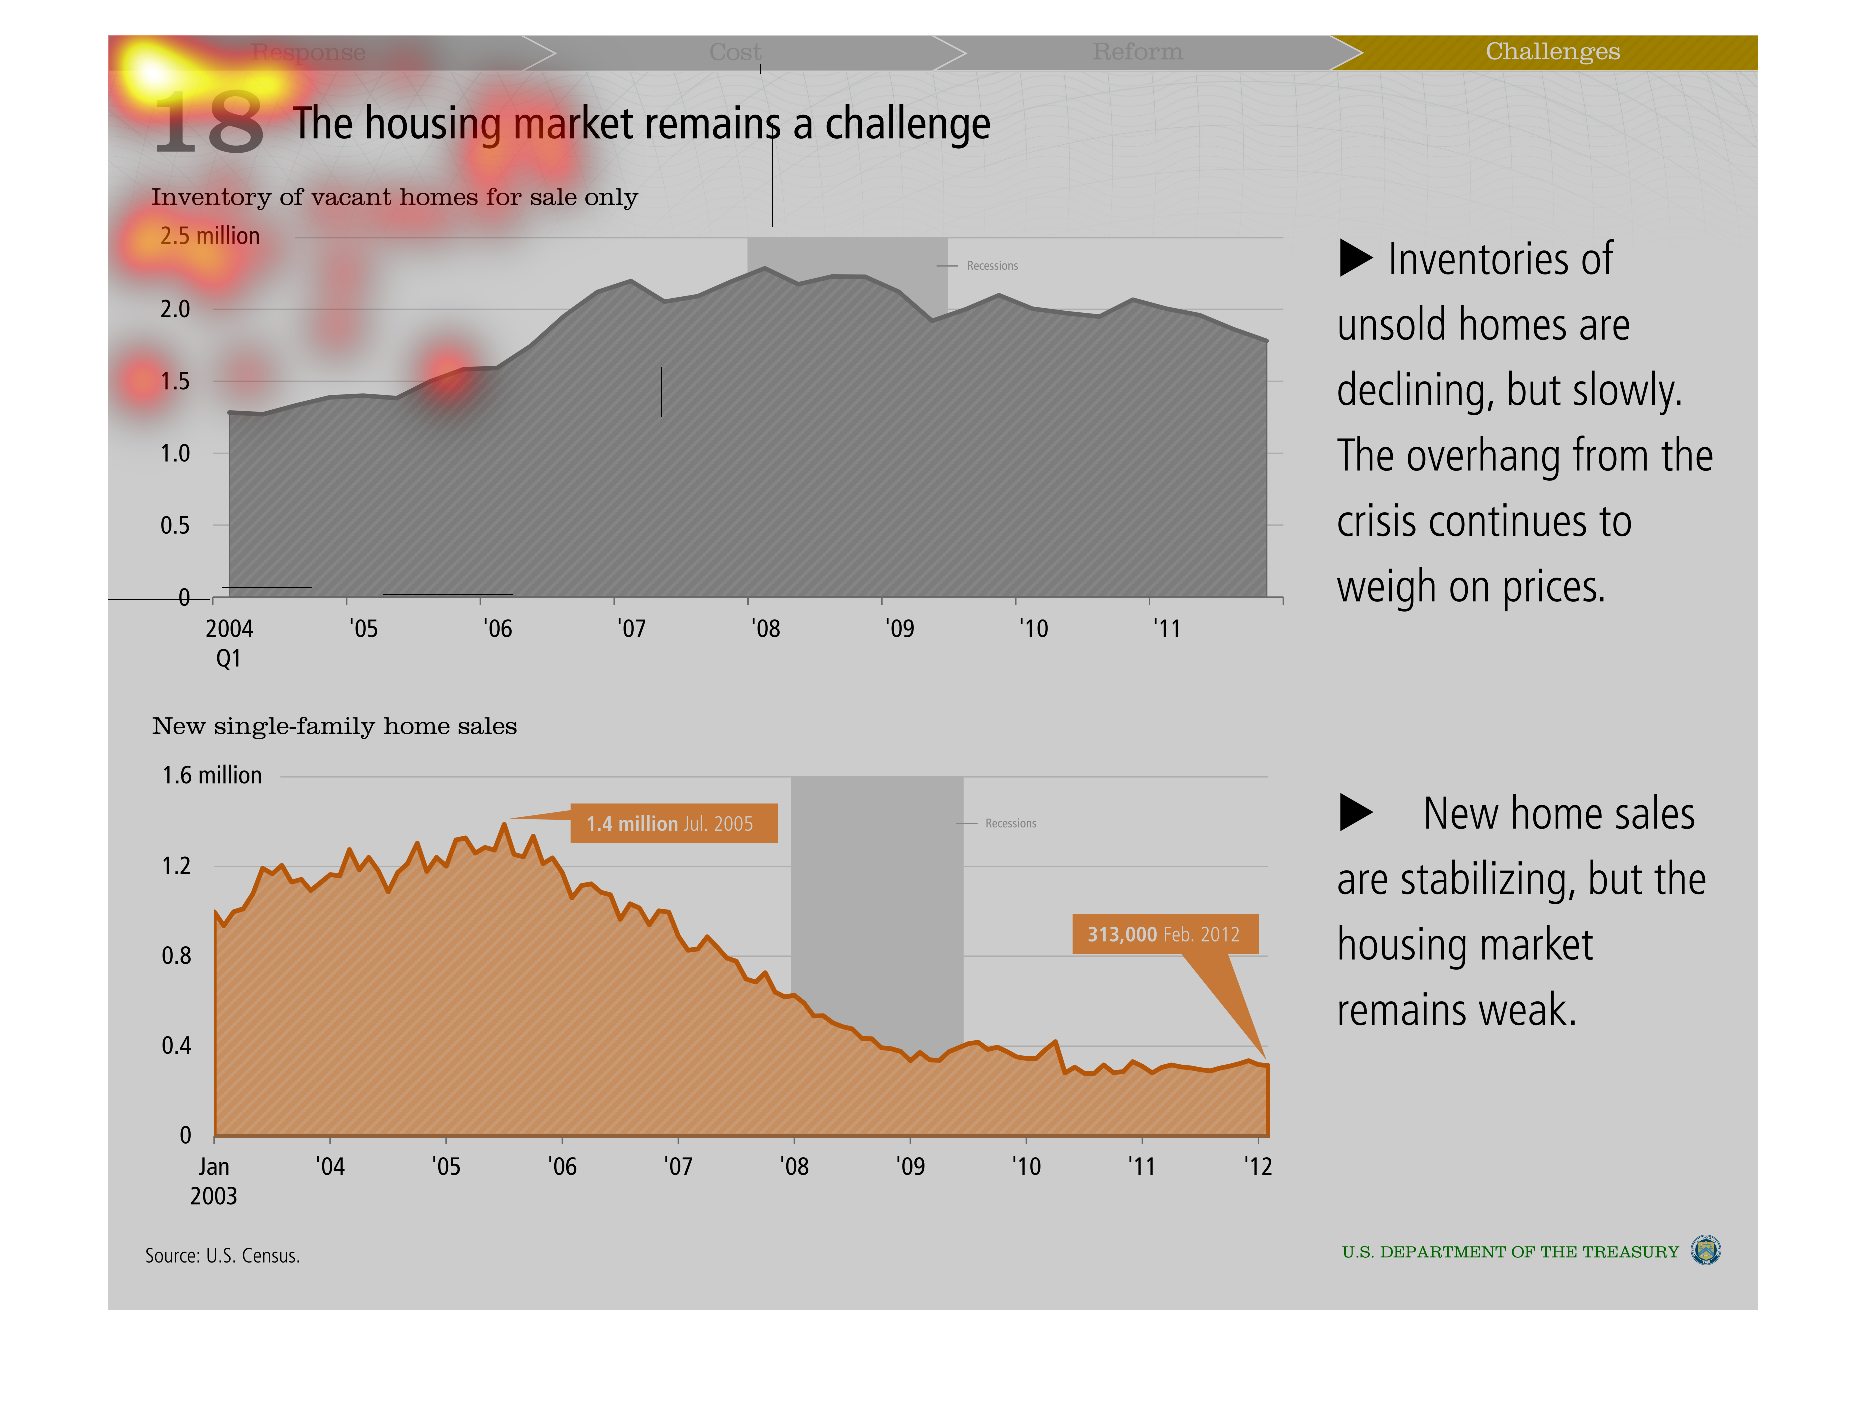
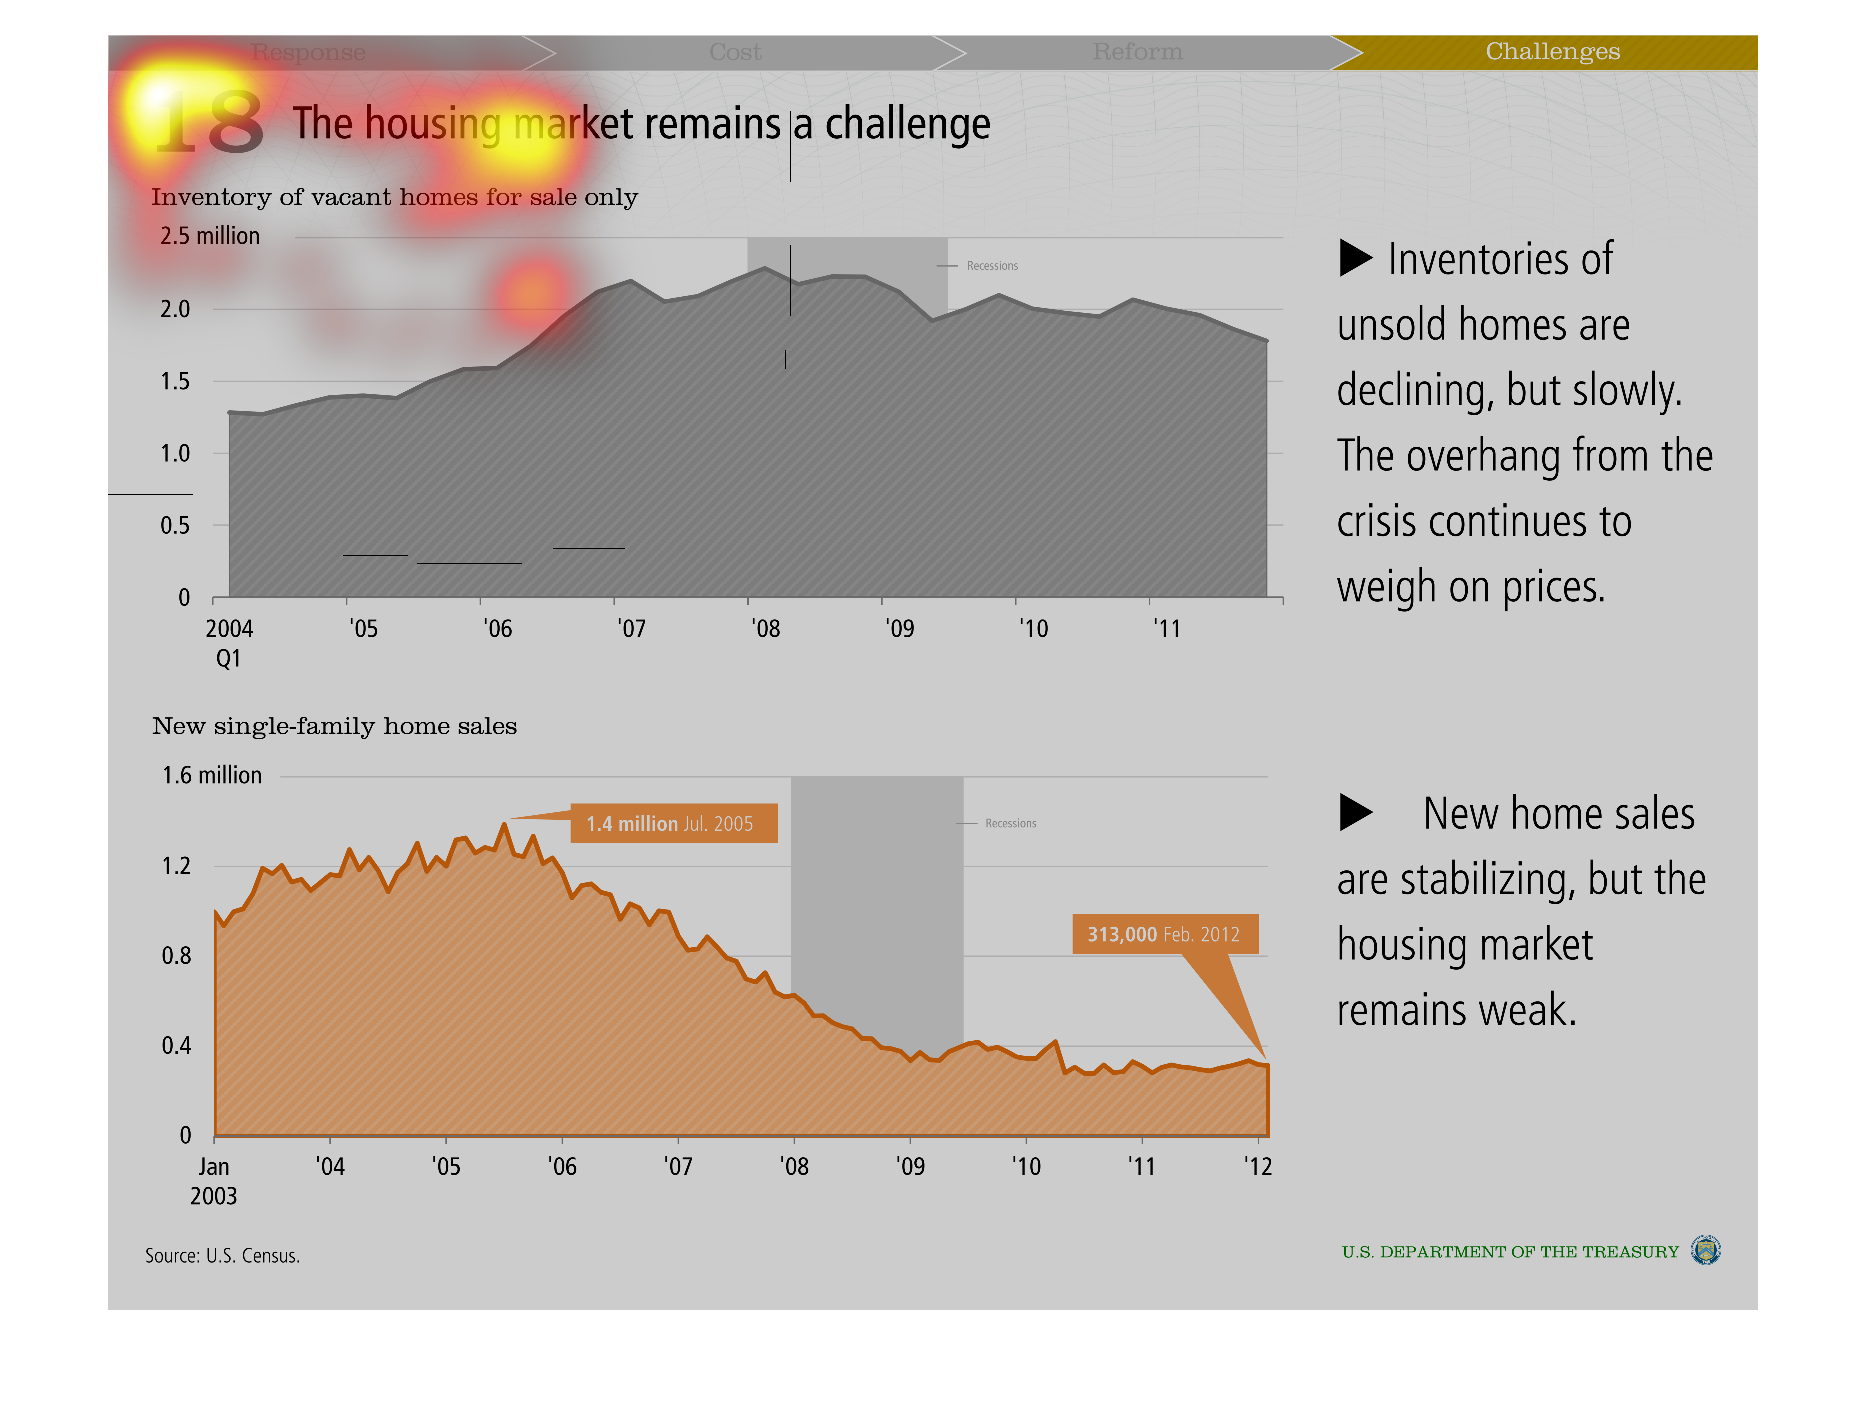
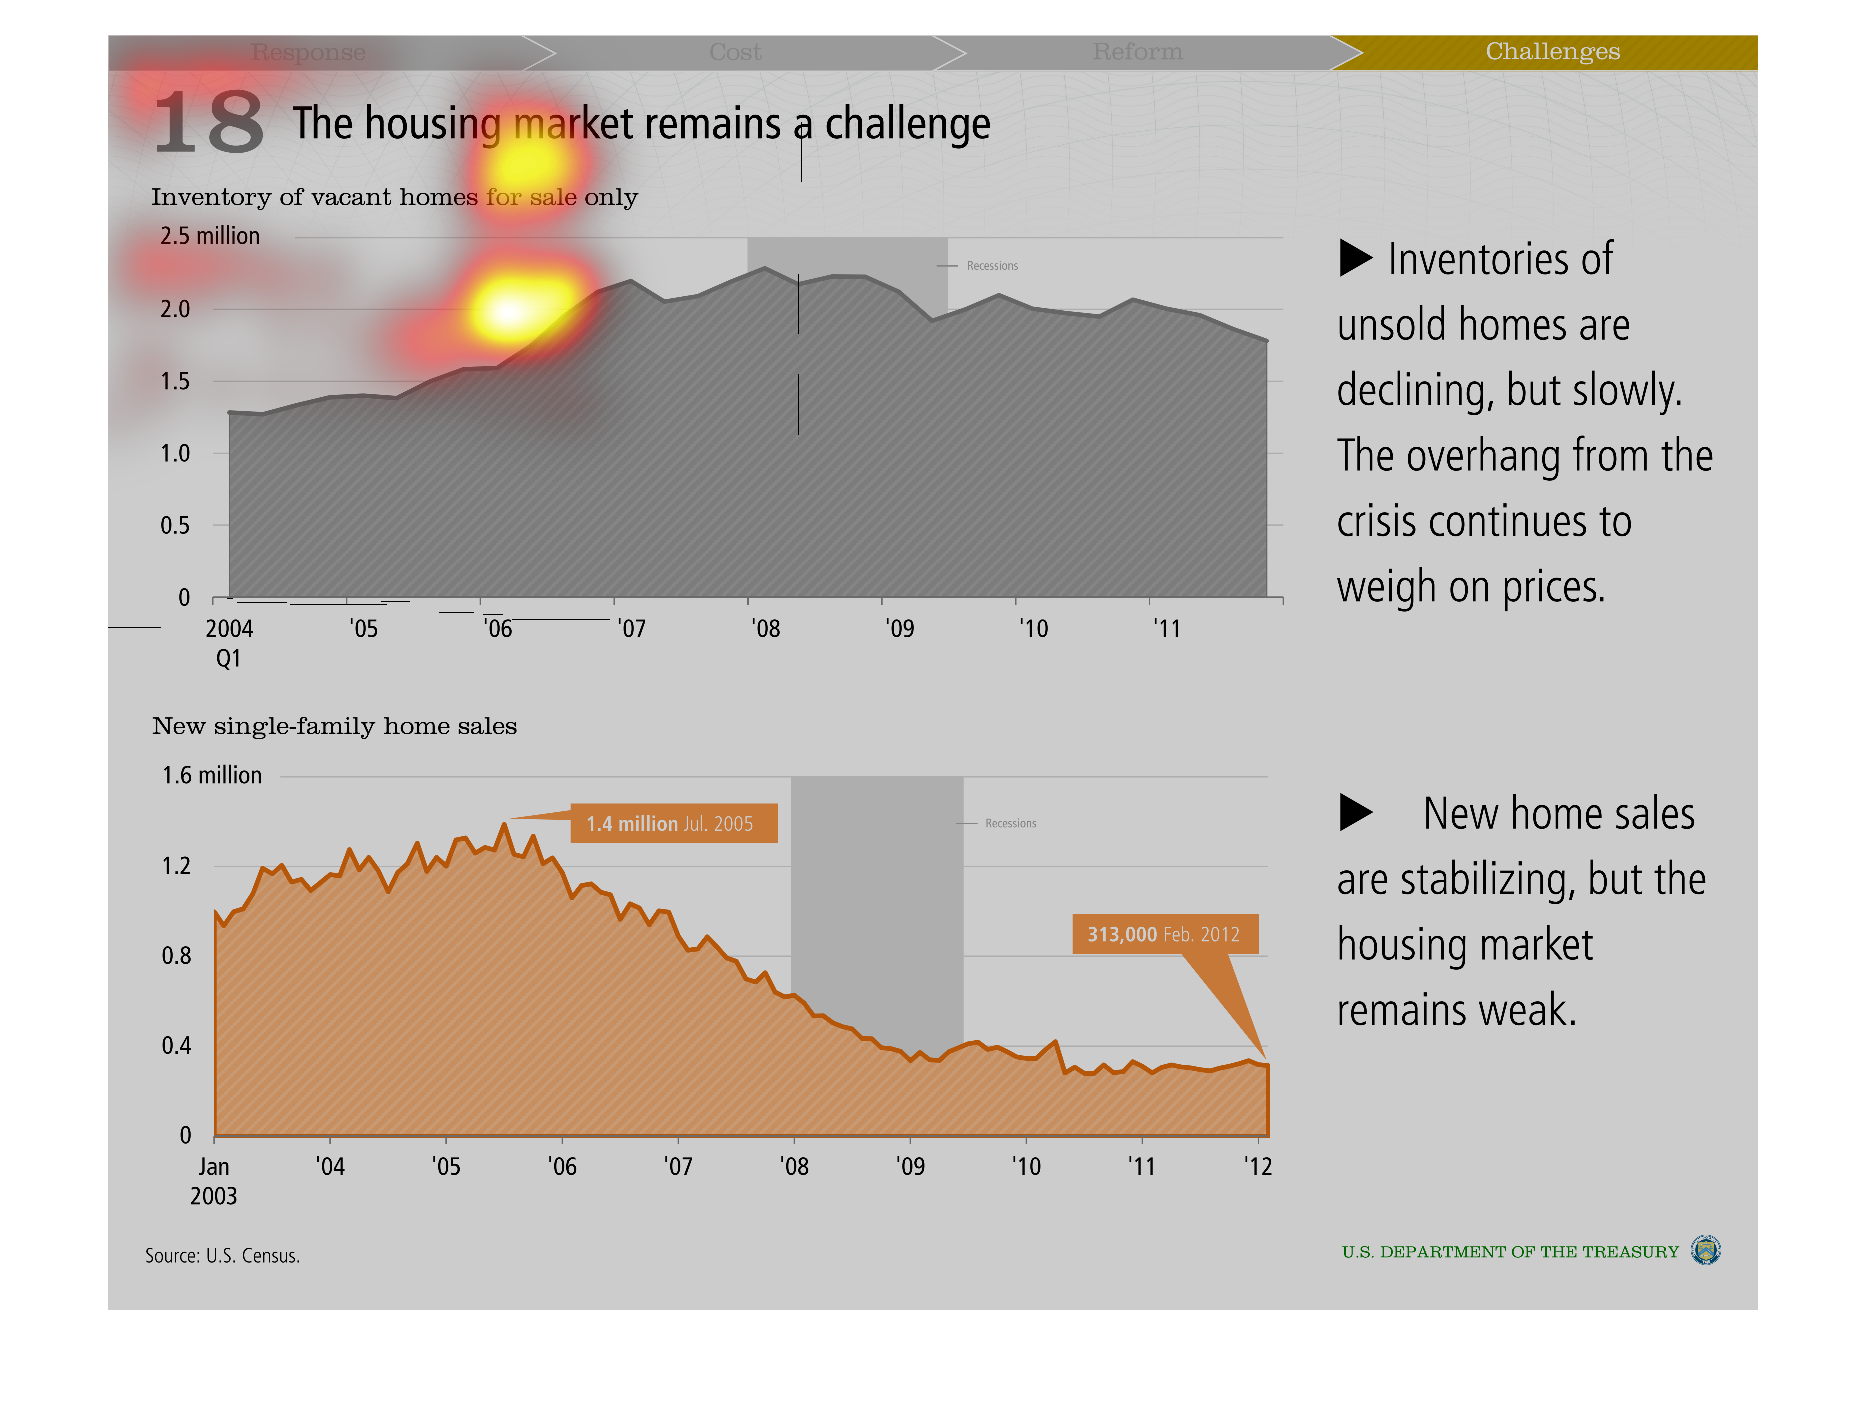
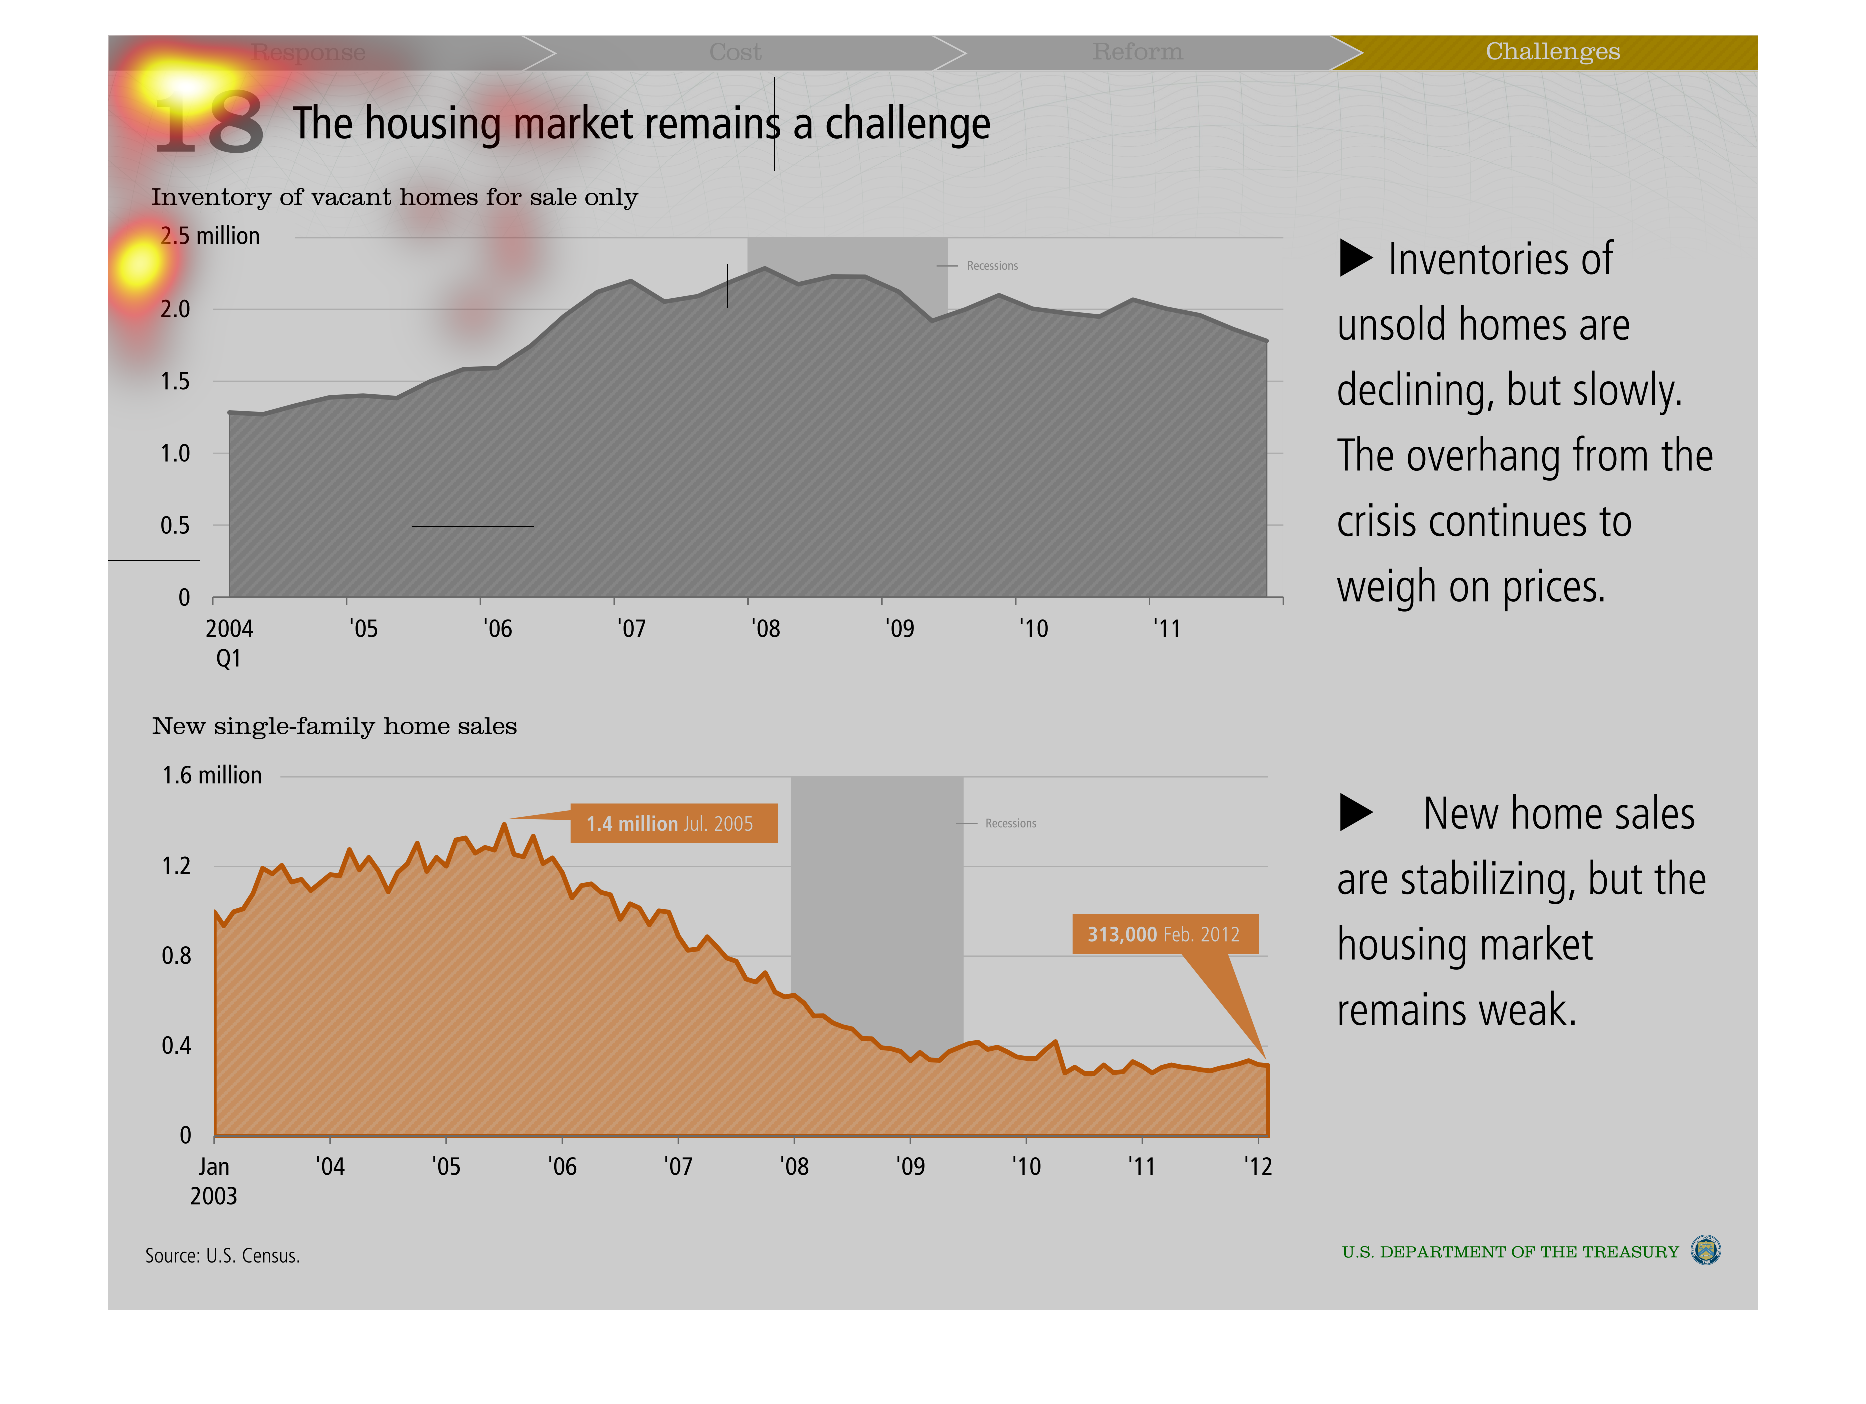
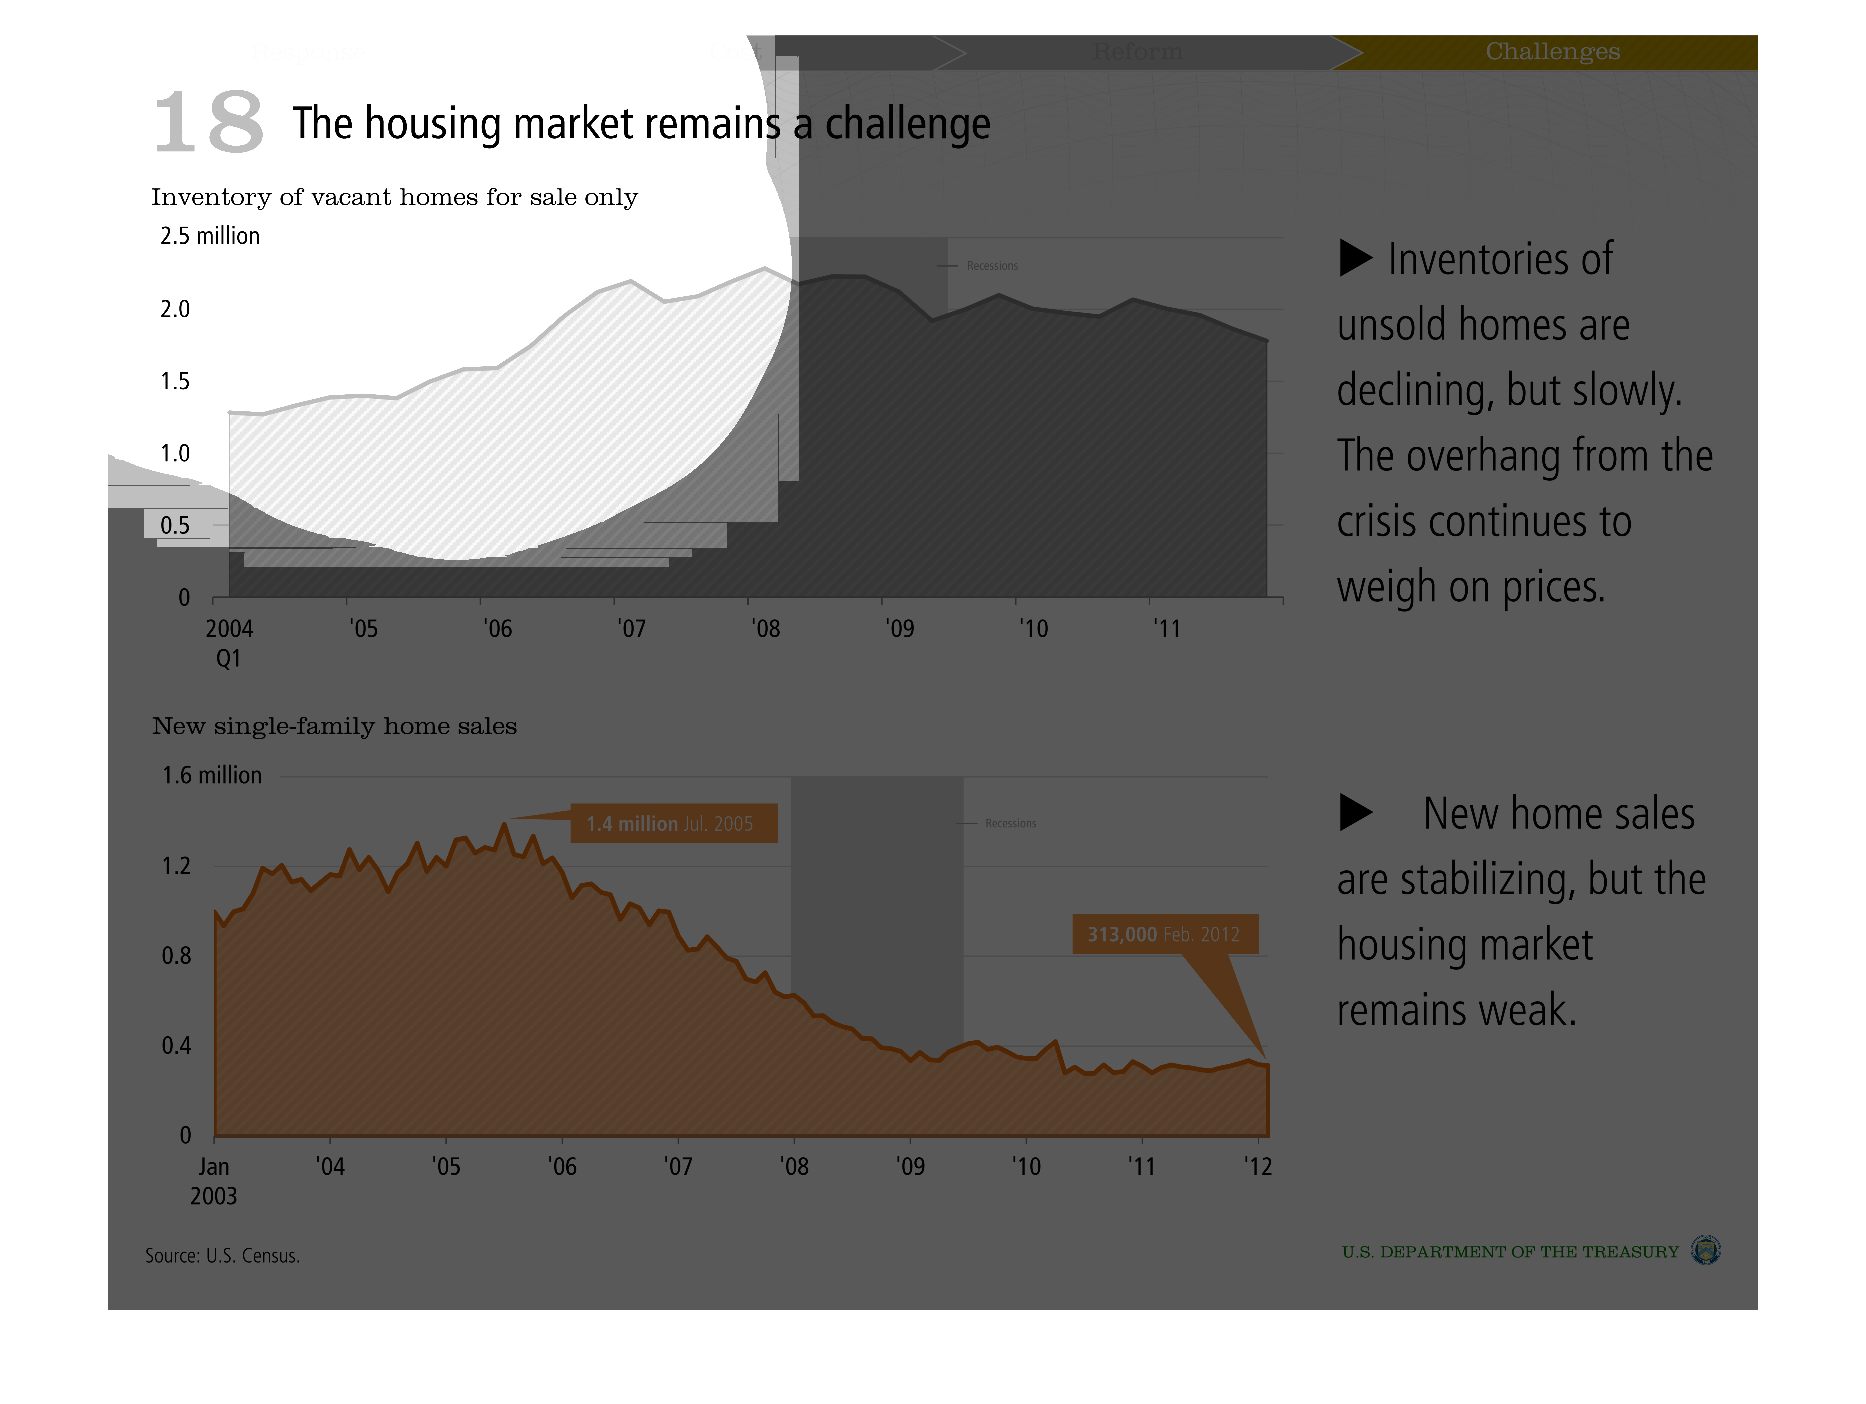
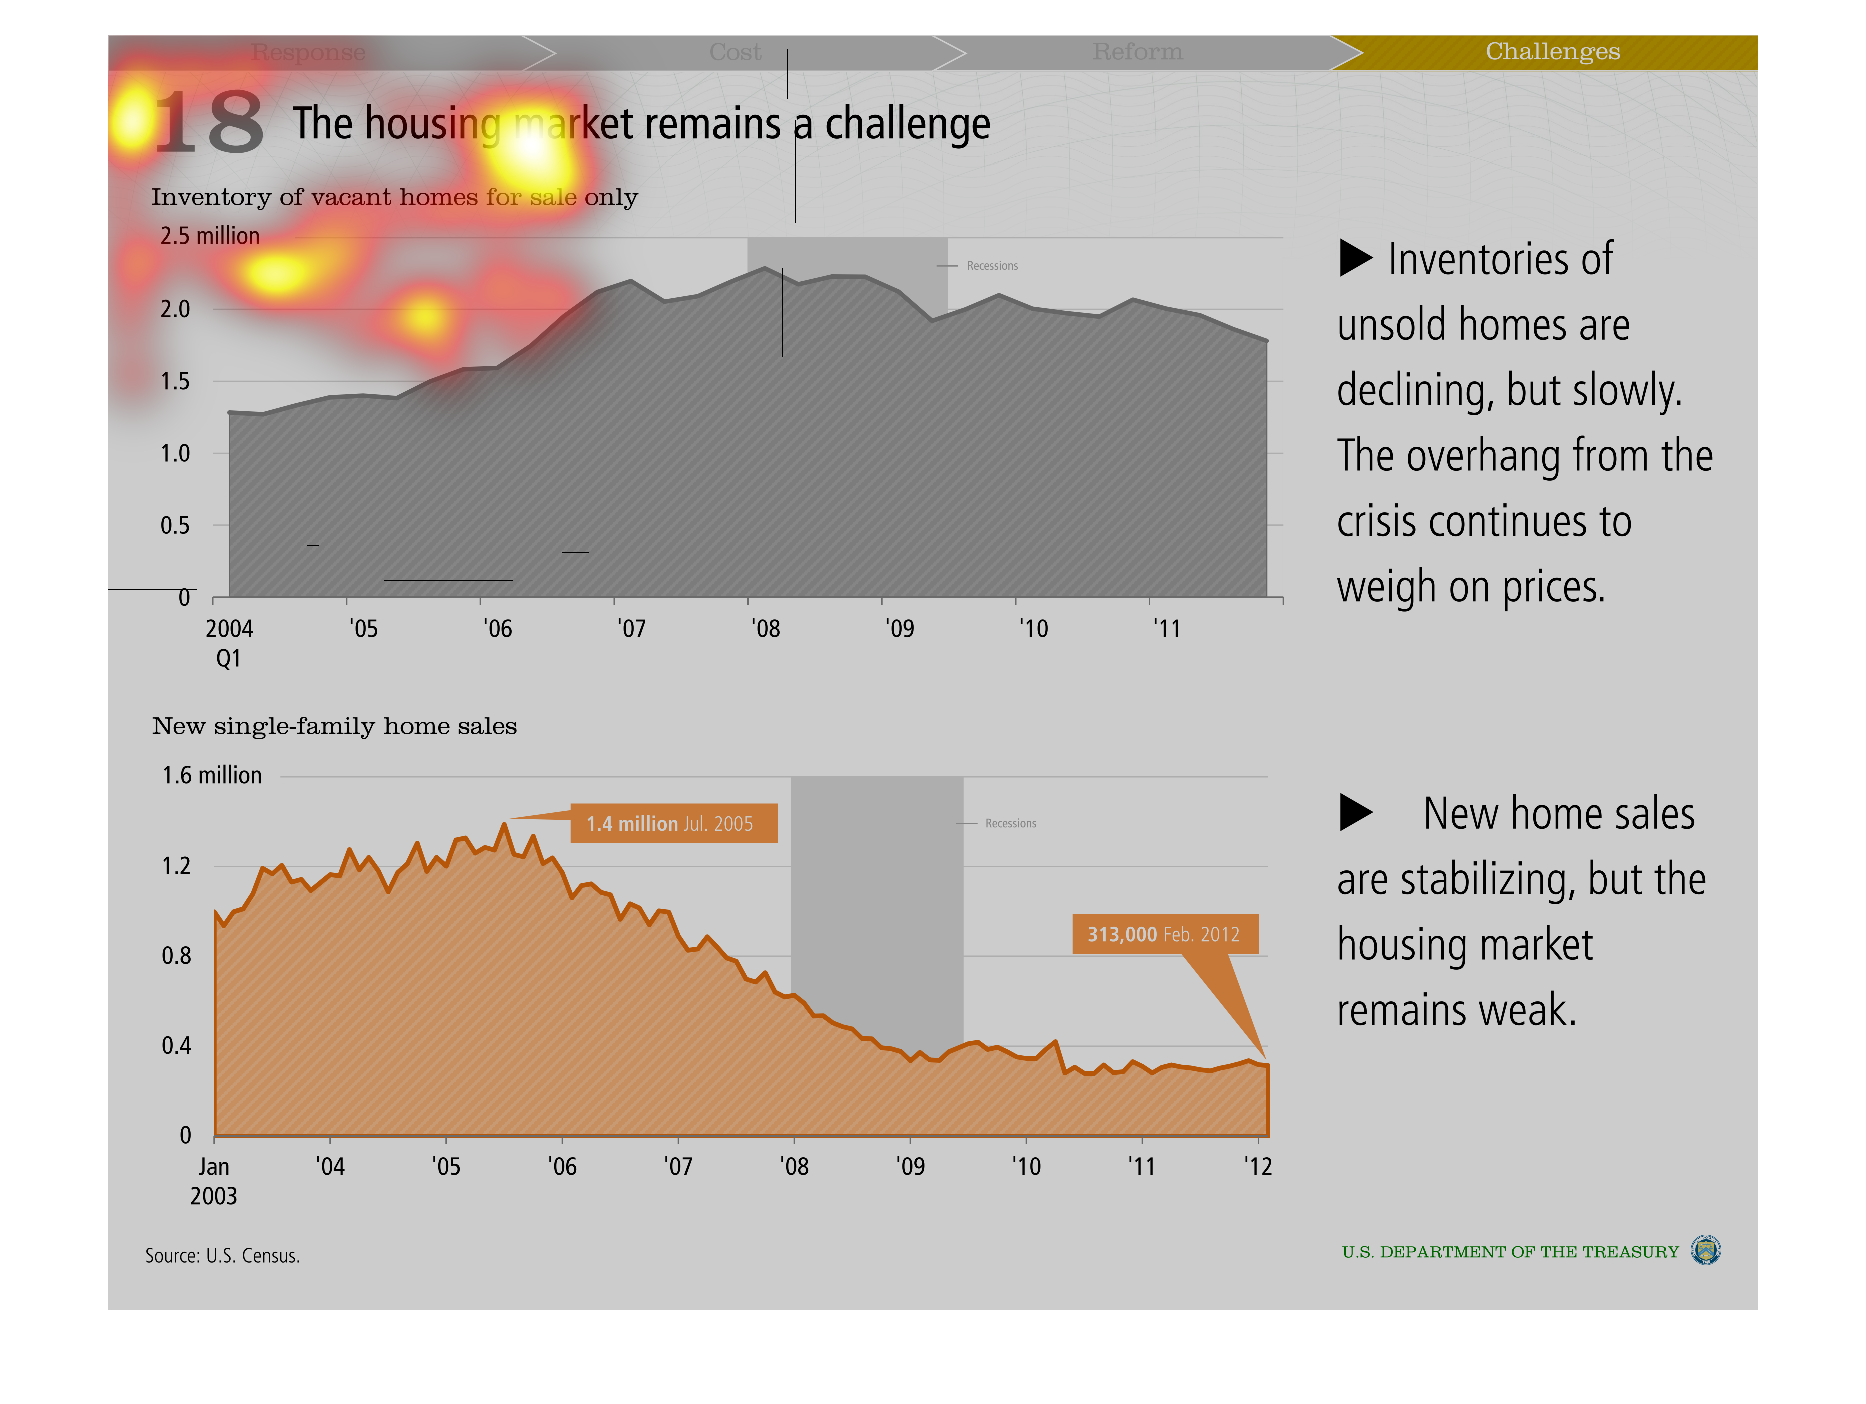
This graph illustrates the challenge that remains in the housing market.  The top shows inventories
of homes from 2004 to 2011.  The bottom shows new home sales from 2003 to 2012.
Warning: Image is too big to fit on screen; displaying at 50%
Warning: Image is too big to fit on screen; displaying at 50%

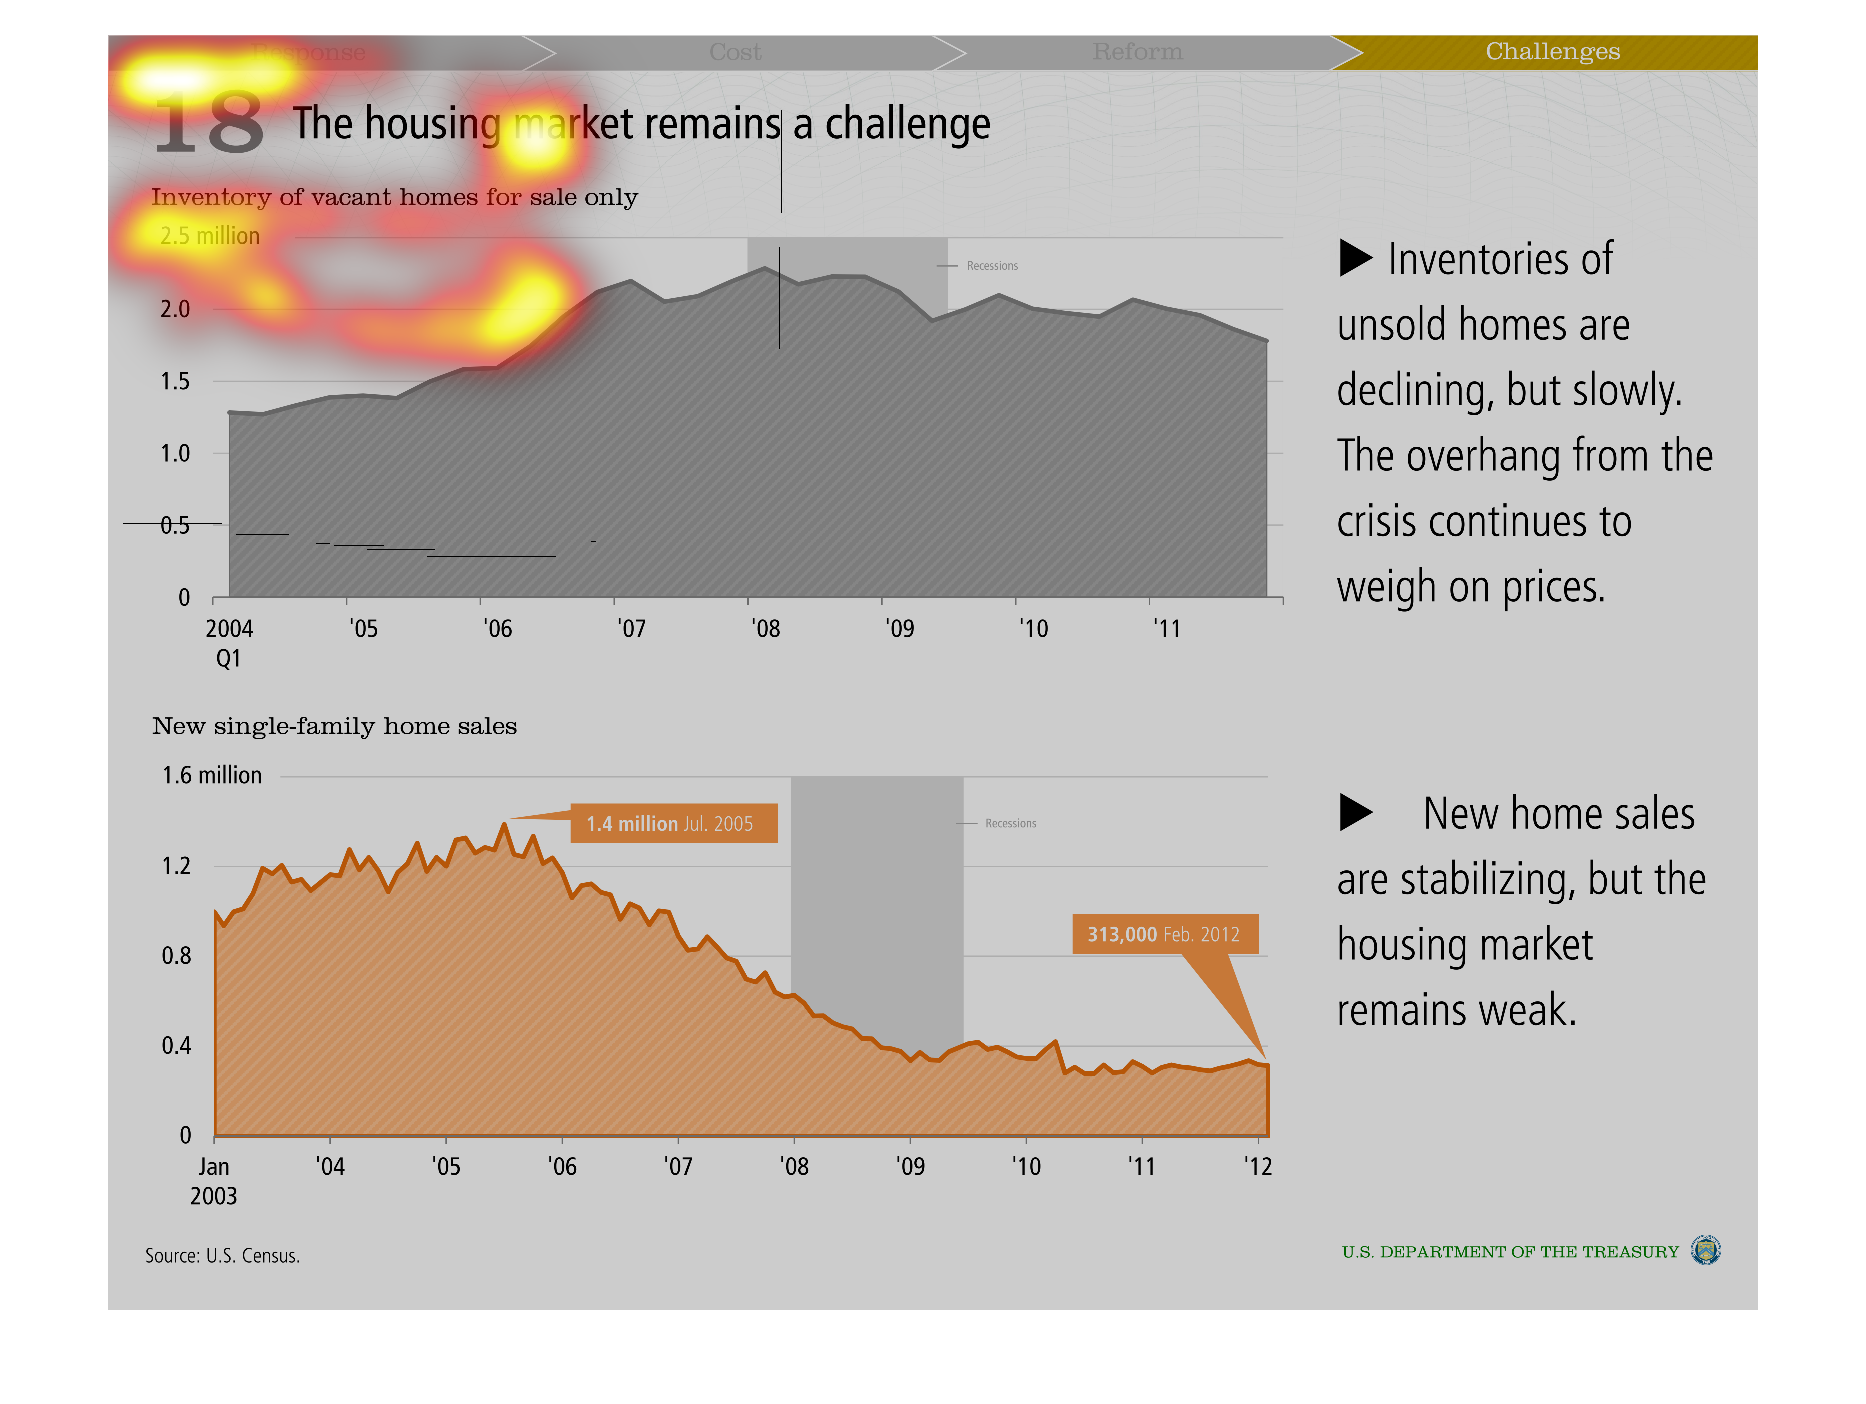
The chats are about the housing market and why it is still a challenge. The first graph shows
the the inventory of vacant homes sales from 2004 to 2011. In 2004 the sales were at 1.3 million
by 2011 the sales were around 2 million. The inventory of the unsold home were declining slowly.
  The second chart showed that the new single family home sales were stabilizing the weak
housing market.
Warning: Image is too big to fit on screen; displaying at 50%
Warning: Image is too big to fit on screen; displaying at 50%
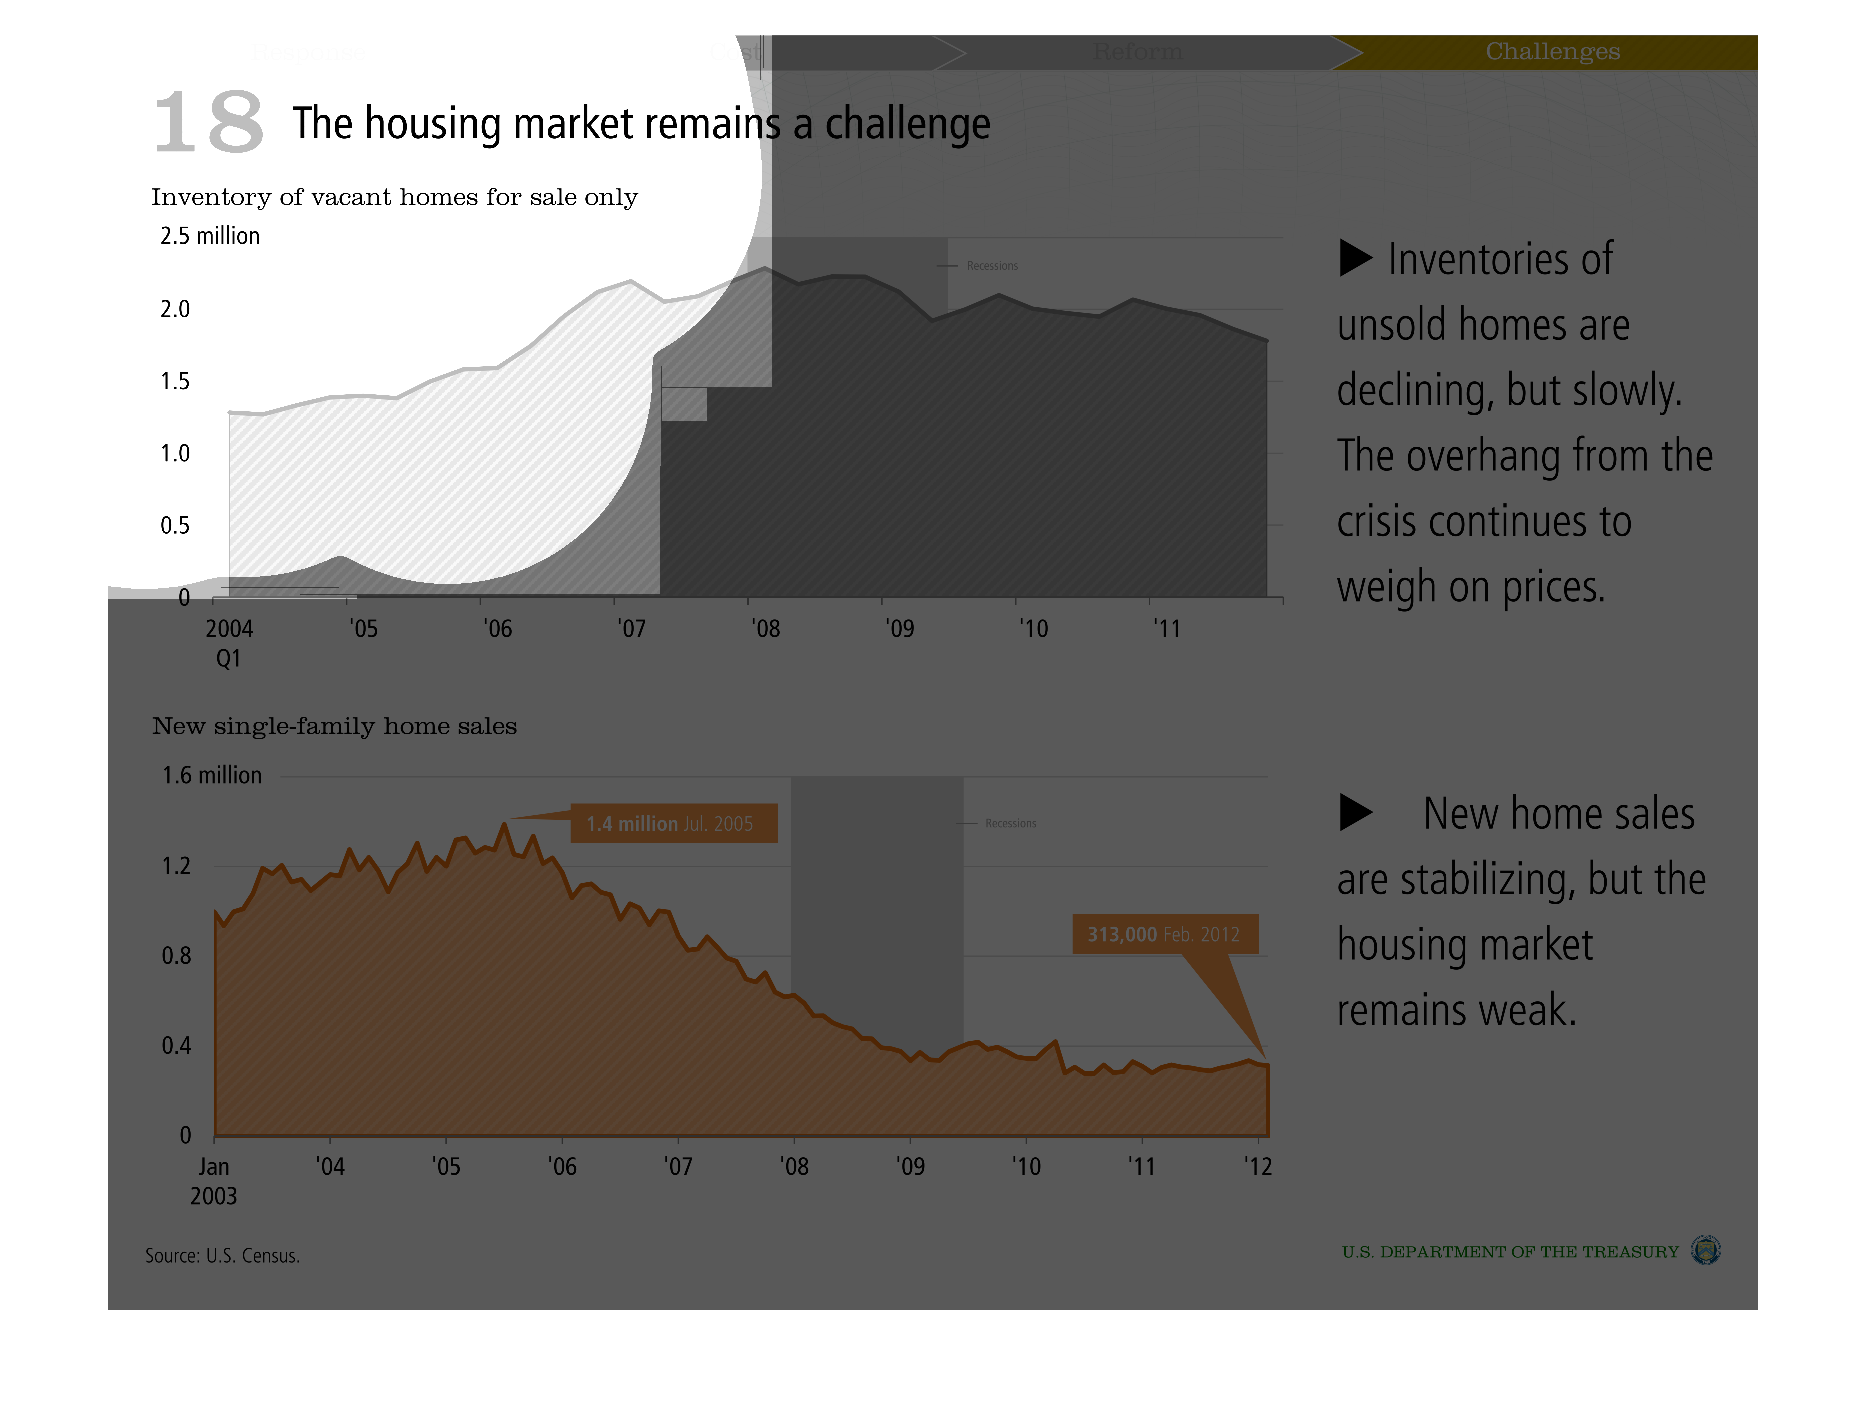
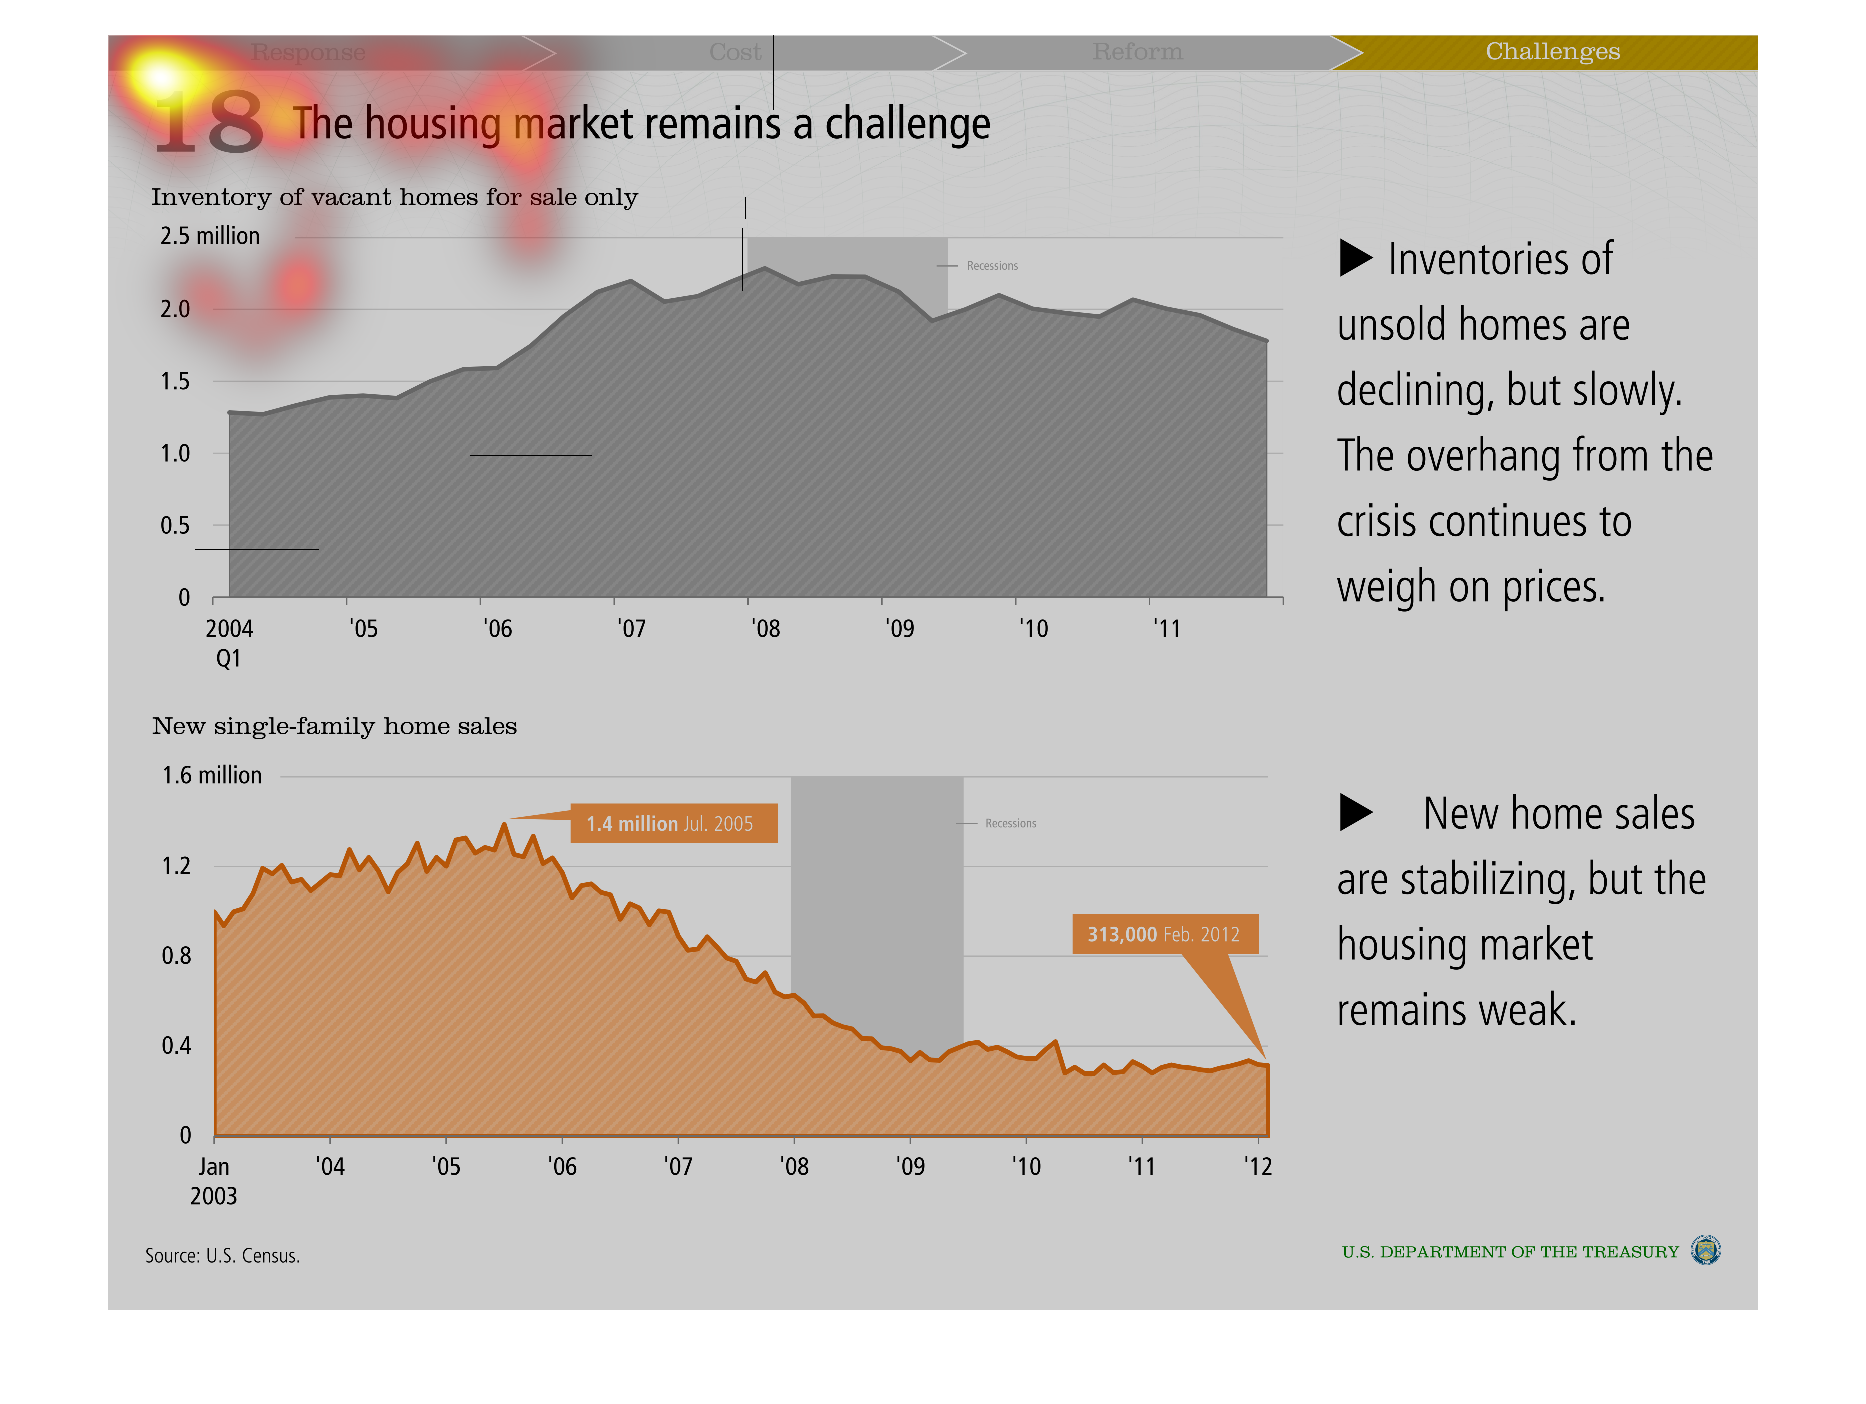
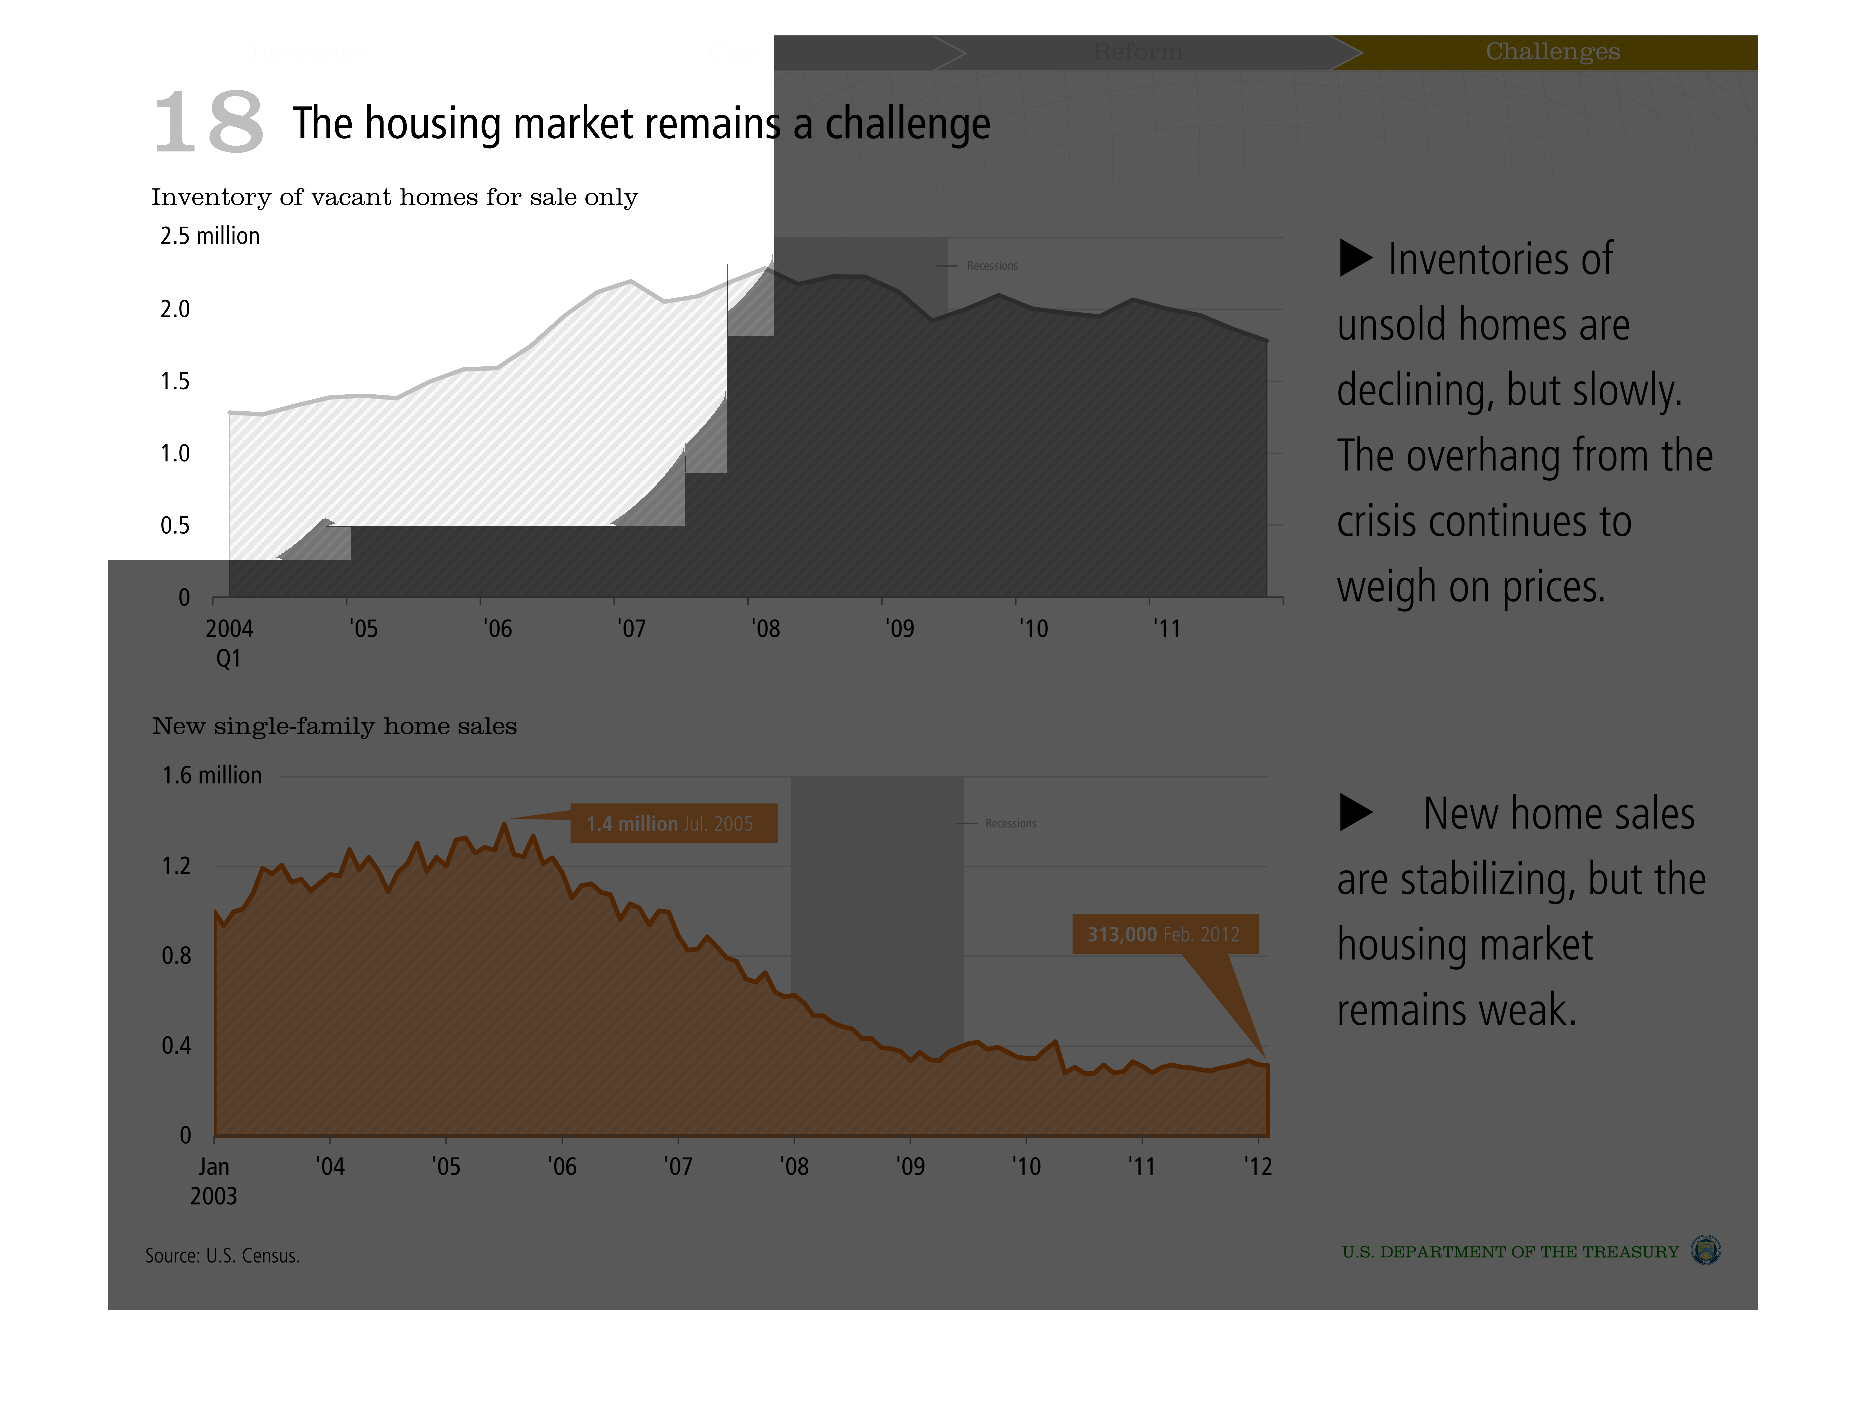
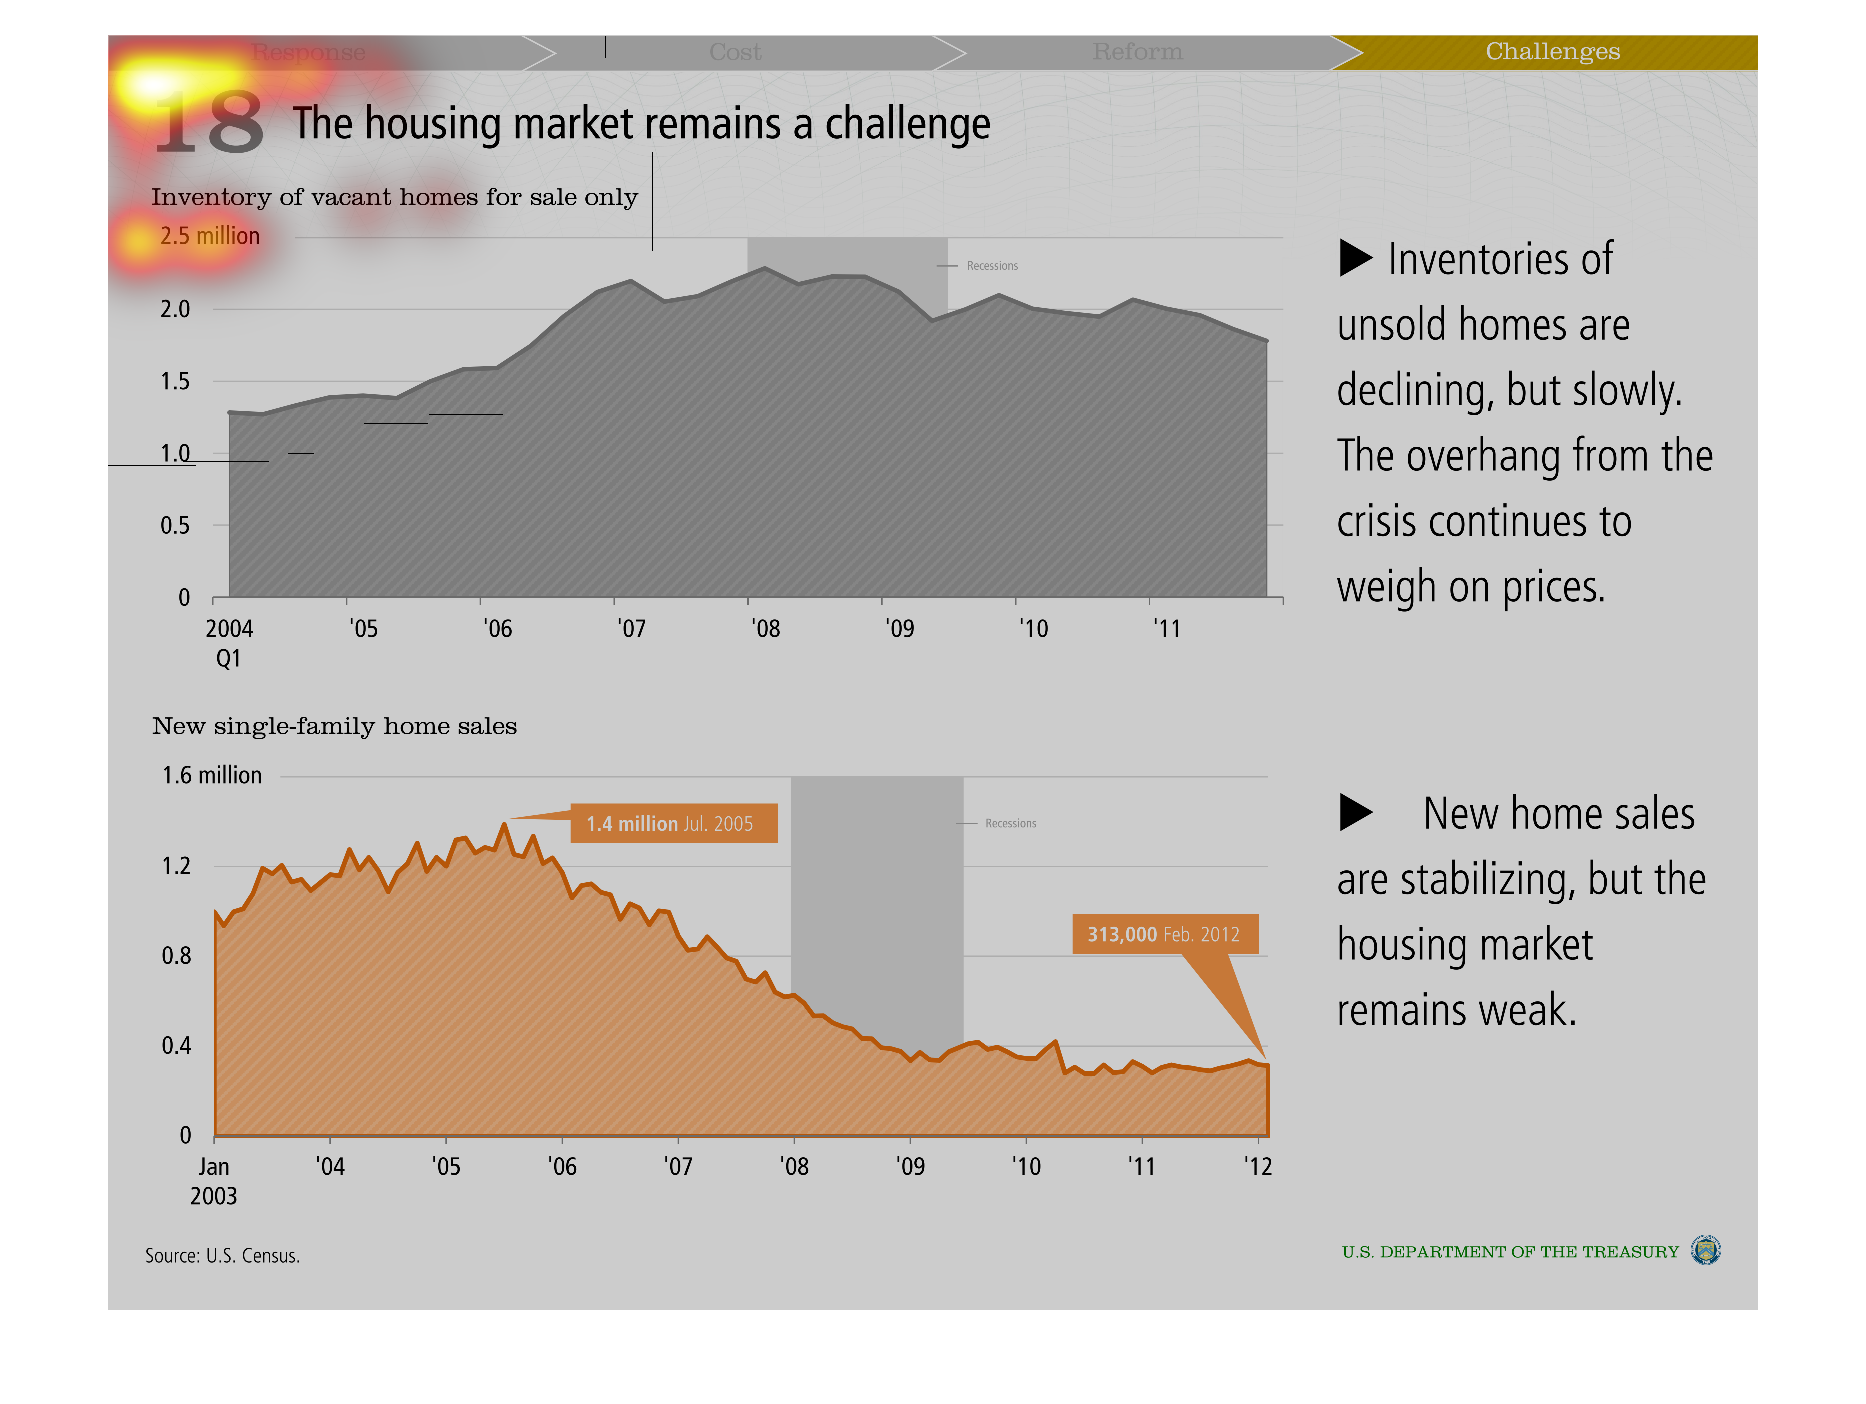
This chart is showing vacant homes for sale. The chart states the home vacancies are declining,
however it happening slowly and there is a lot of inventory from the crash.
Warning: Image is too big to fit on screen; displaying at 50%
Warning: Image is too big to fit on screen; displaying at 50%
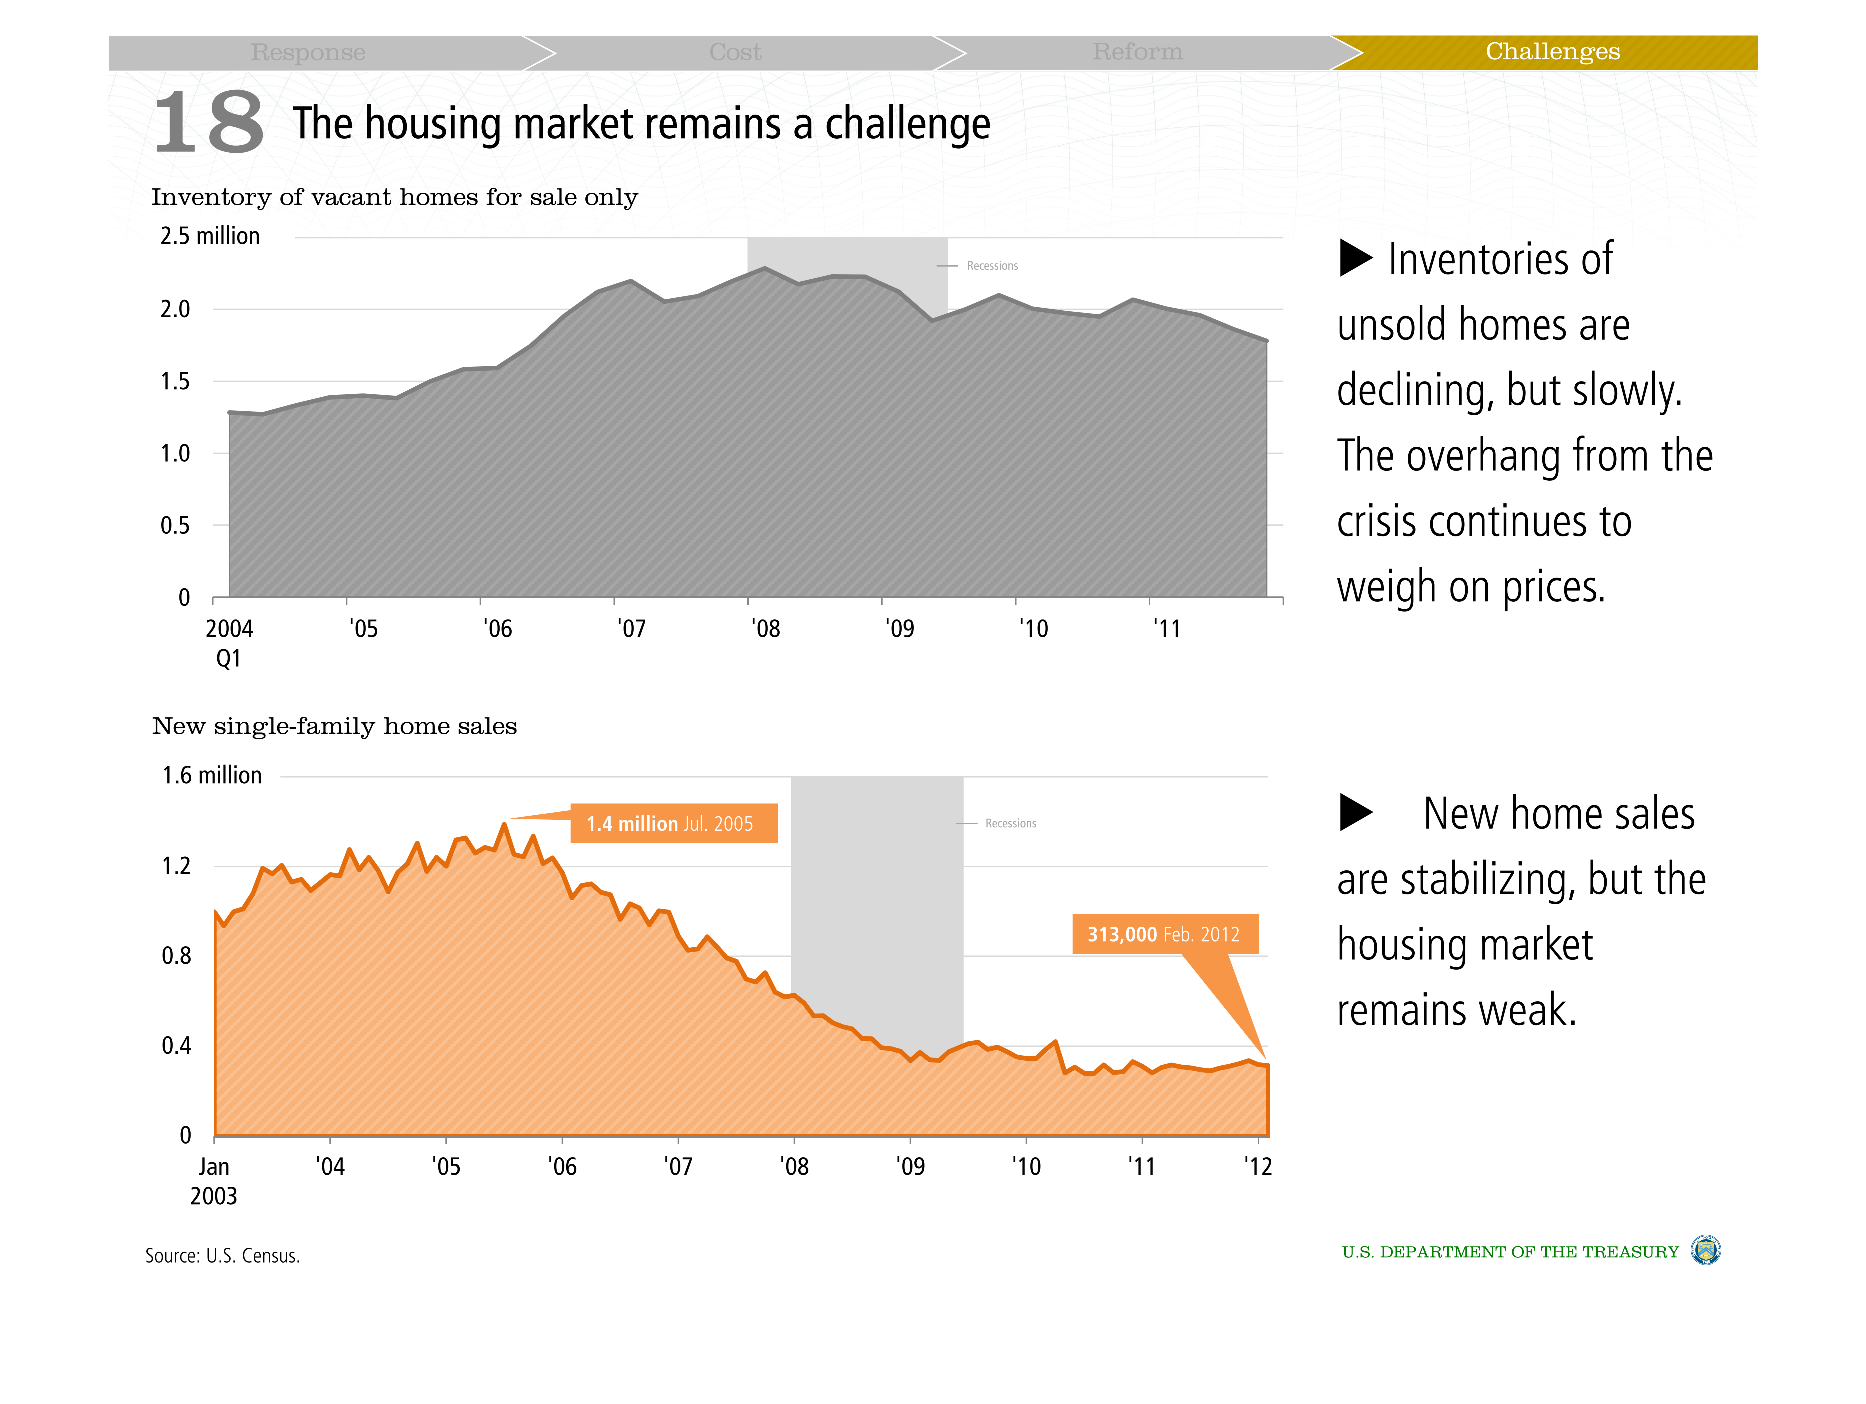
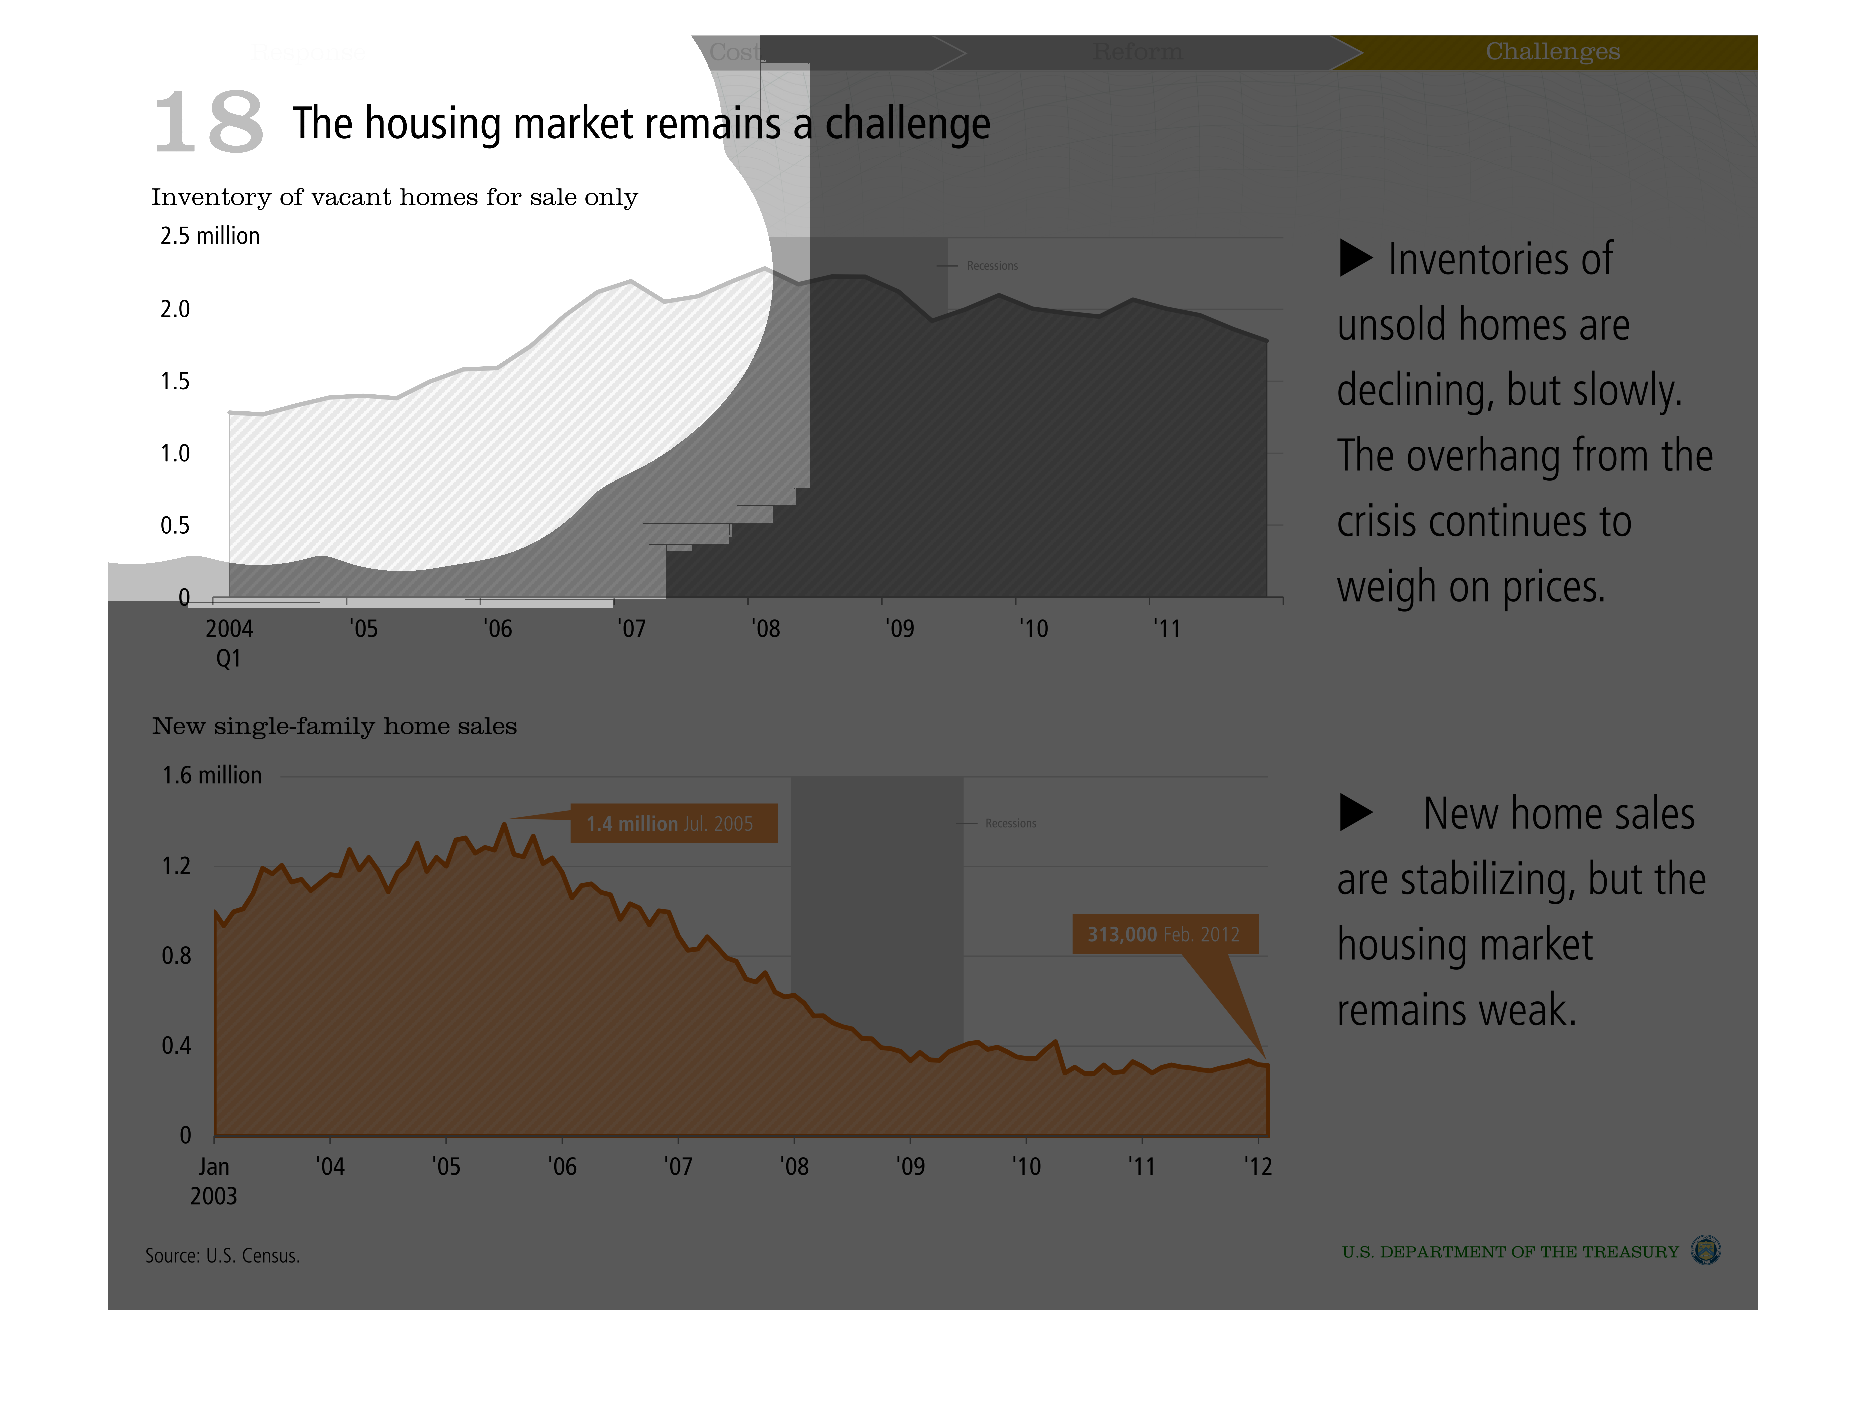
This infographic details how the housing market is still struggling, yet showing signs of
improvement. Inventory of unsold homes is slowly declining, but the crisis is still affecting
prices. While new home sales have begun to stabilize, the market is still less than a third
the size it was before the crash.
Warning: Image is too big to fit on screen; displaying at 50%
Warning: Image is too big to fit on screen; displaying at 50%

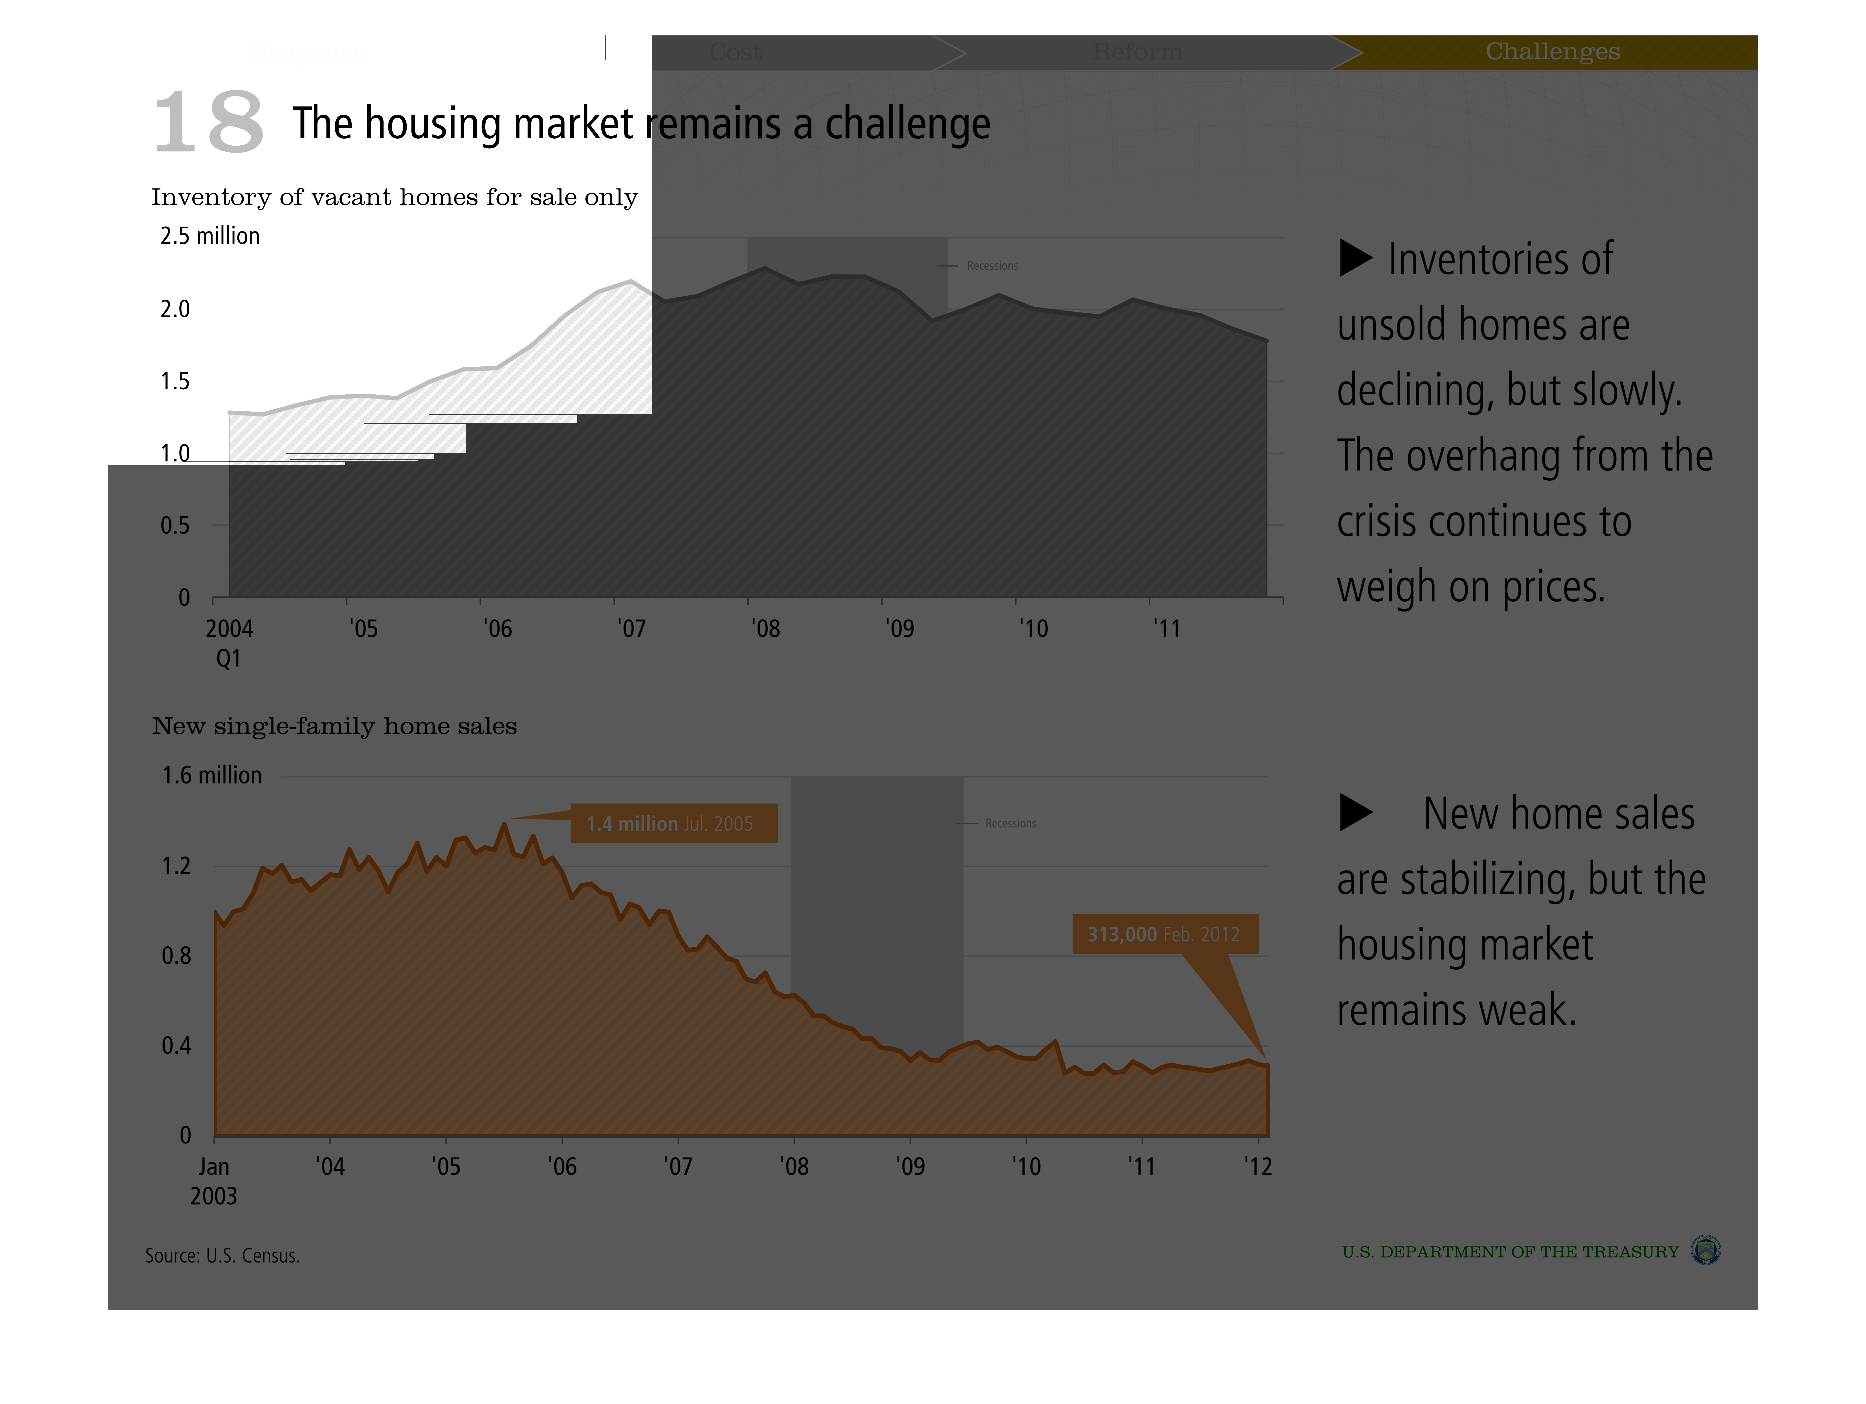
the infographic describes two factors of the housing market.  The first is the inventory of
vacant homes available with respect to the year.  The second is the amount of new single family
homes with respect to the year.
Warning: Image is too big to fit on screen; displaying at 50%
Warning: Image is too big to fit on screen; displaying at 50%

The housing market remains a challenge is the name of this graph. the two graphs are about
the state of the housing market today in the worls these days
Warning: Image is too big to fit on screen; displaying at 50%
Warning: Image is too big to fit on screen; displaying at 50%
This chart describes that the housing market remains a challenge. Specifically it describes
inventory of vacant homes for sale only. The chart also covers new single-family homes.
Warning: Image is too big to fit on screen; displaying at 50%
Warning: Image is too big to fit on screen; displaying at 50%
This image shows or depicts in statistical bar graph formats the housing market challenges
that plague the US. Covers the years from 2004 to 2011. Although new home sales are starting
to stabilize.
Warning: Image is too big to fit on screen; displaying at 50%
Warning: Image is too big to fit on screen; displaying at 50%

THESE GRAPHS SHOW HOUSING STOCK TRENDS IN THE YEARS AFTER THE GREAT RECESSION. ON TOP IS THE
STOCK OF VACANT HOMES, AND ON THE BOTTOM IS THE AMOUNT OF NEW HOMES BEING BUILT.
Warning: Image is too big to fit on screen; displaying at 50%
Warning: Image is too big to fit on screen; displaying at 50%
This chart depicts key parameters in measuring the health of the housing market.  Both the
inventory of vacant homes, and new single family homes are shown vs. time.
Warning: Image is too big to fit on screen; displaying at 50%
Warning: Image is too big to fit on screen; displaying at 50%
This is two graphs comparing the housing market, and the numbers of unsold homes is decreasing
slowly, and new ho!e sales are stabilizing.  The housing market still remains weak
Warning: Image is too big to fit on screen; displaying at 50%
Warning: Image is too big to fit on screen; displaying at 50%
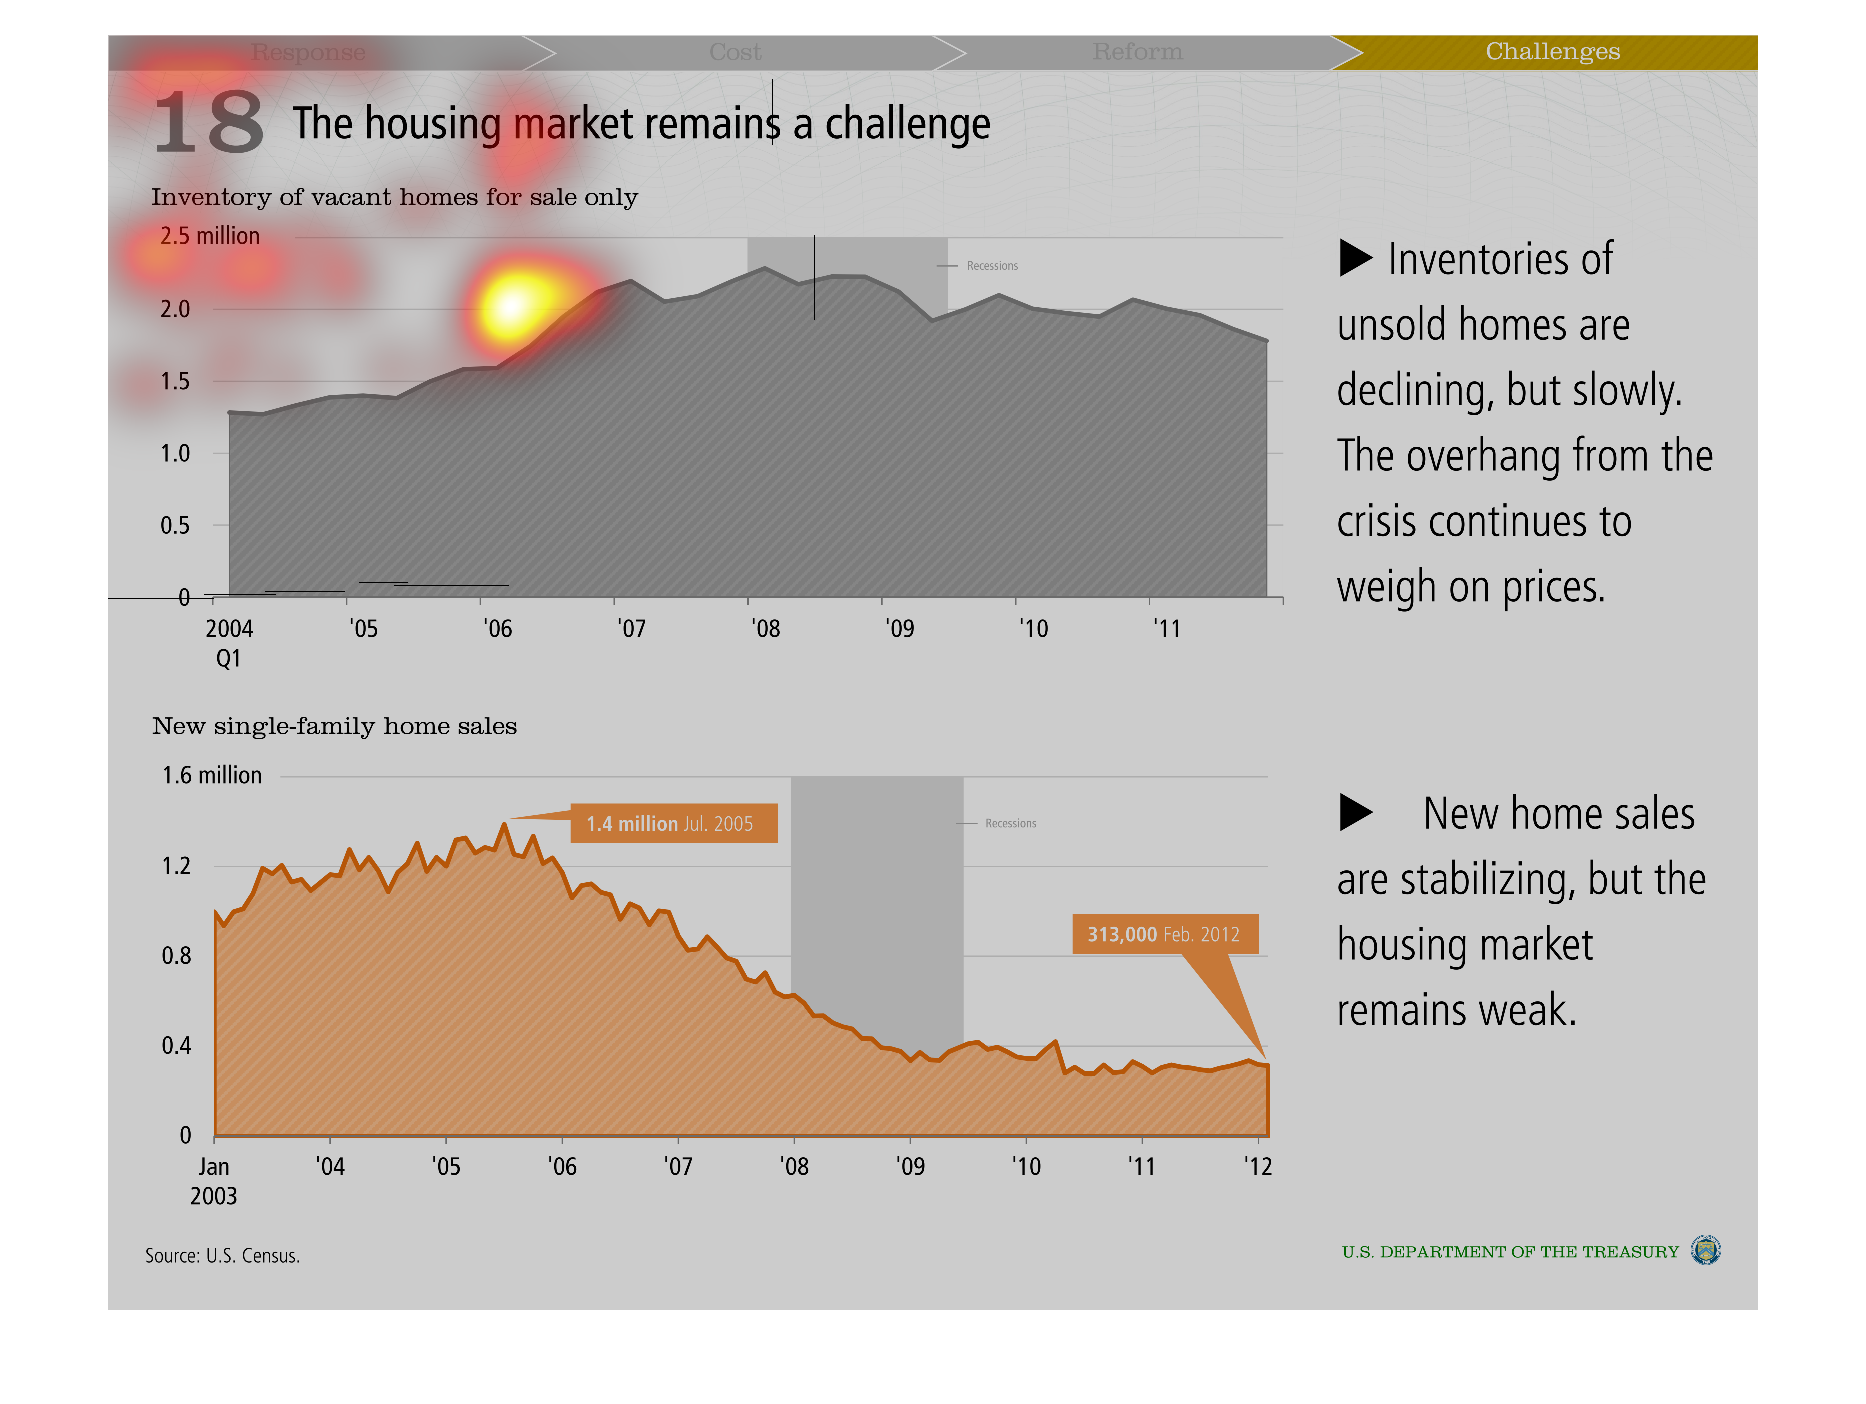

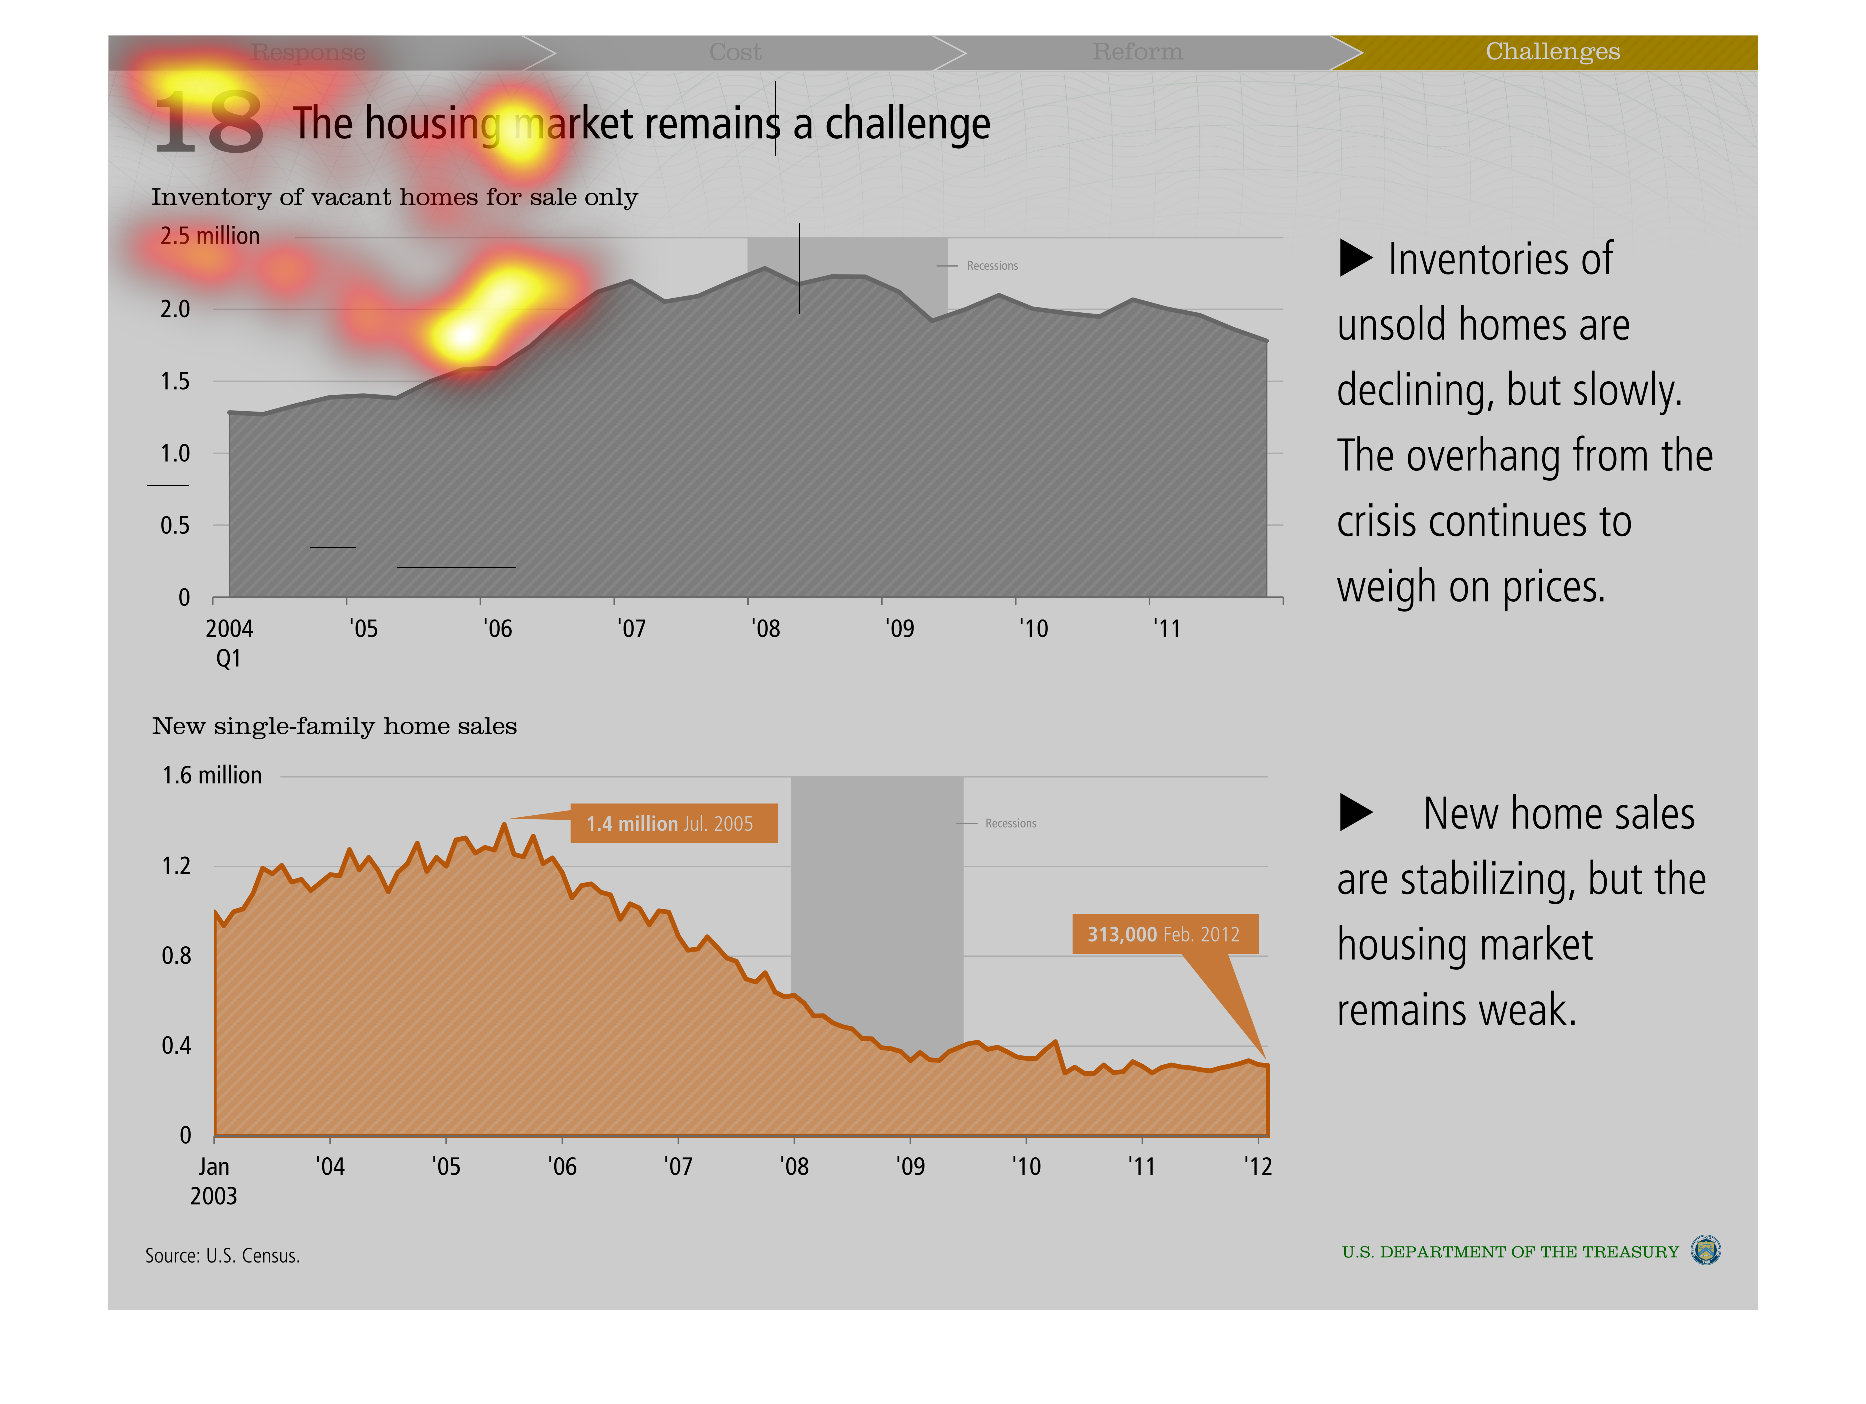
This page shows two graphs depicting fluctuations in the housing market between 2003 and 2012.
  The first line graph shows inventory of vacant homes for sale from 2004 -2012. Inventory
was at it's lowest in 2004 at 1.3 million; it grew to 2.5 million in 2008 at 2.5 million.
Inventory decreases to 2 million in 2009 and trends downward to 1.7 million by 2012.  The
second line graph shows new single-family home sales from 2003-2012 which peak at 1.4 million
in July 2005 and drops to 313.,000 in Feb 2012.  Blurbs to the right of the graphs tell how
inventory is declining slowly as the recent crisis still overhangs the housing market. Also,
that new home sales are stabilizing but the market remains weak.
Warning: Image is too big to fit on screen; displaying at 50%
Warning: Image is too big to fit on screen; displaying at 50%

the housing market remains a challenge, inventory of vacant homes rises, while purchases of
new homes declined but are stabalizing for single families
Warning: Image is too big to fit on screen; displaying at 50%
Warning: Image is too big to fit on screen; displaying at 50%
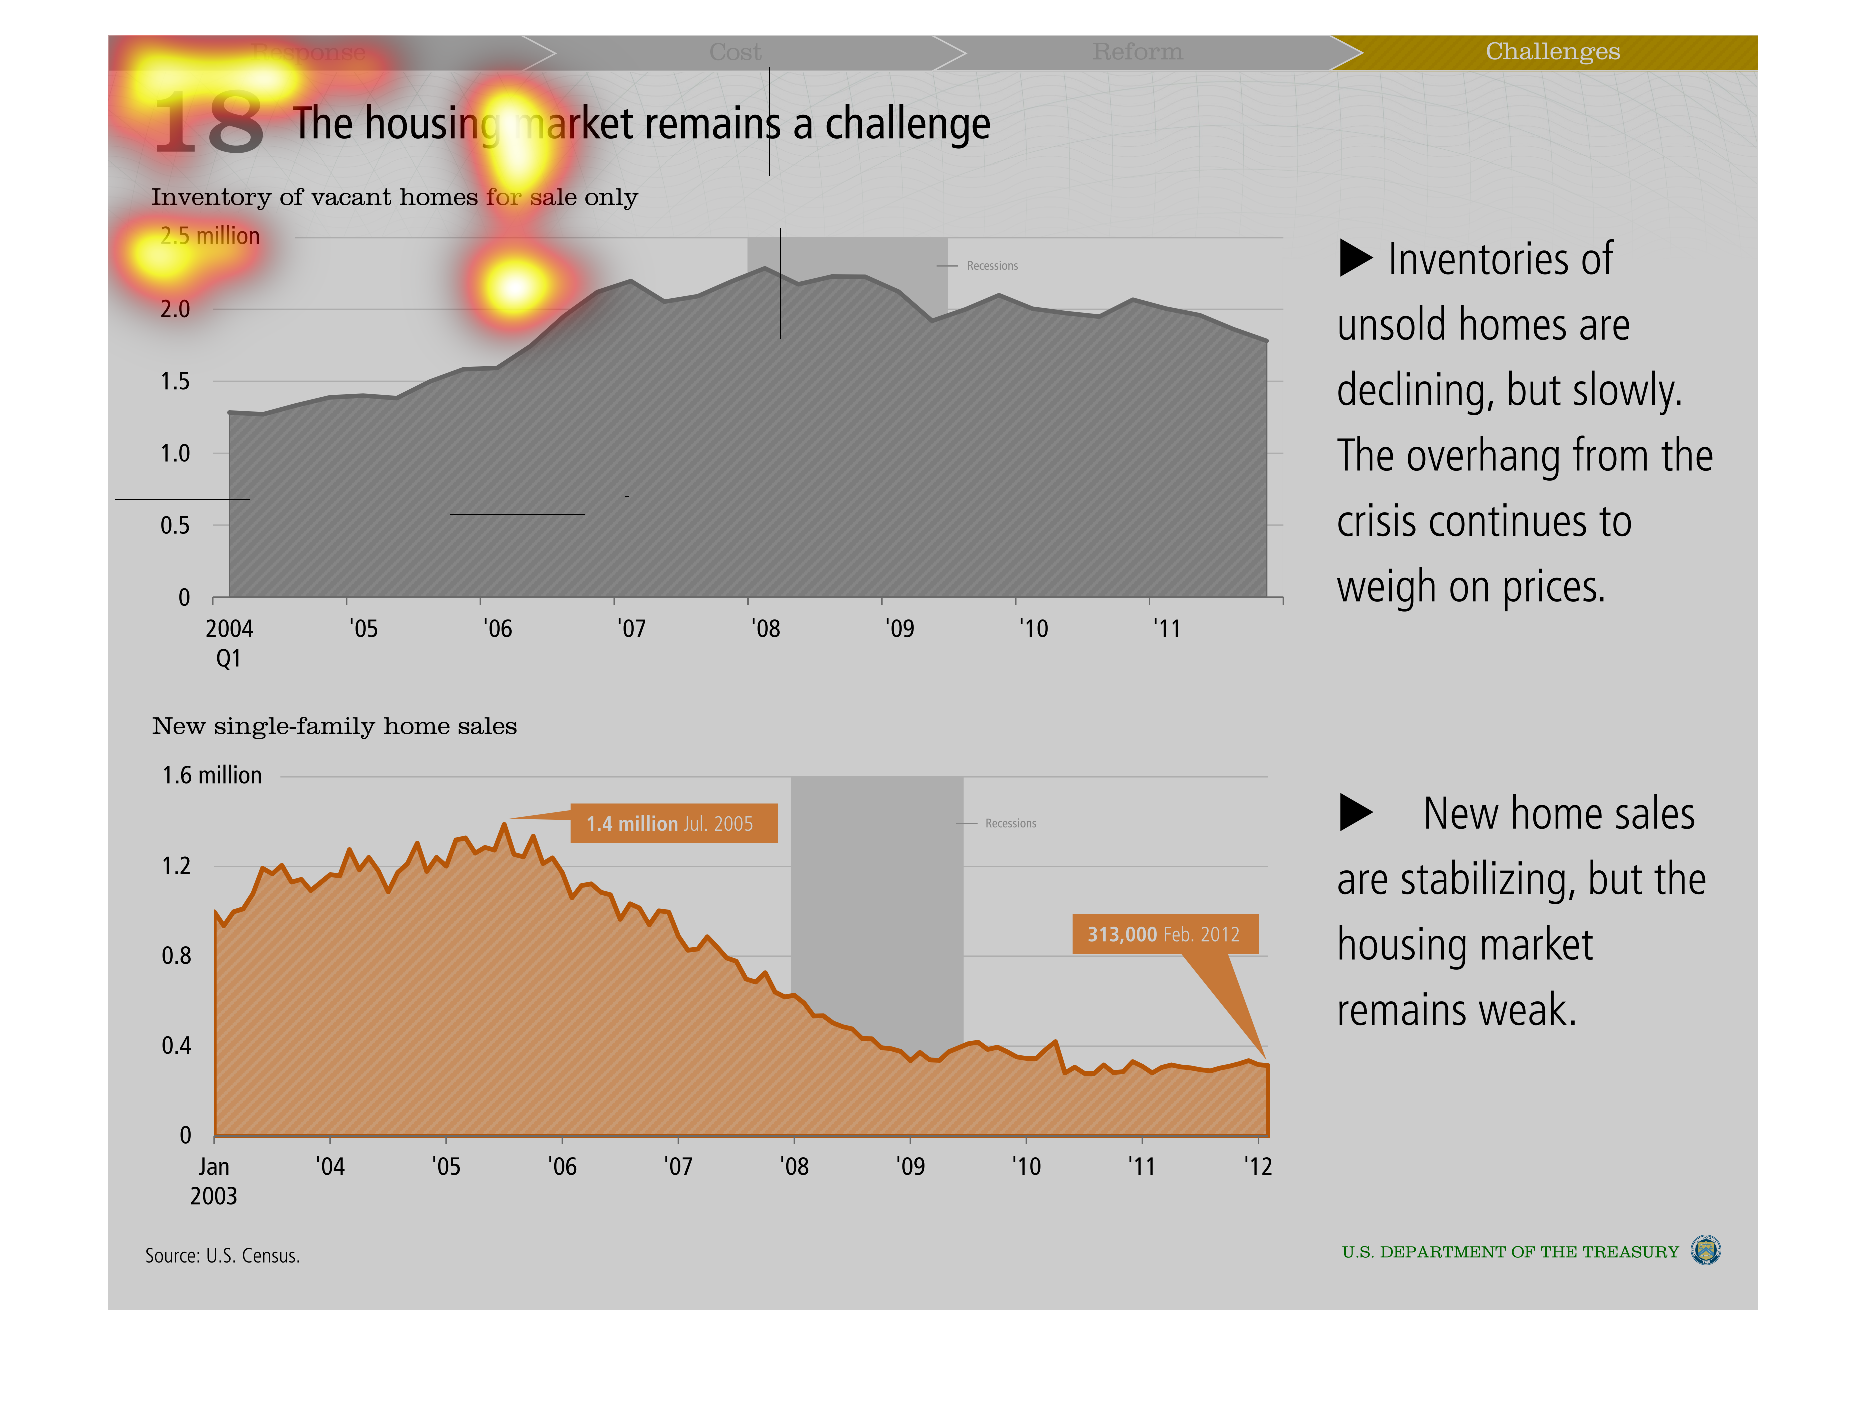

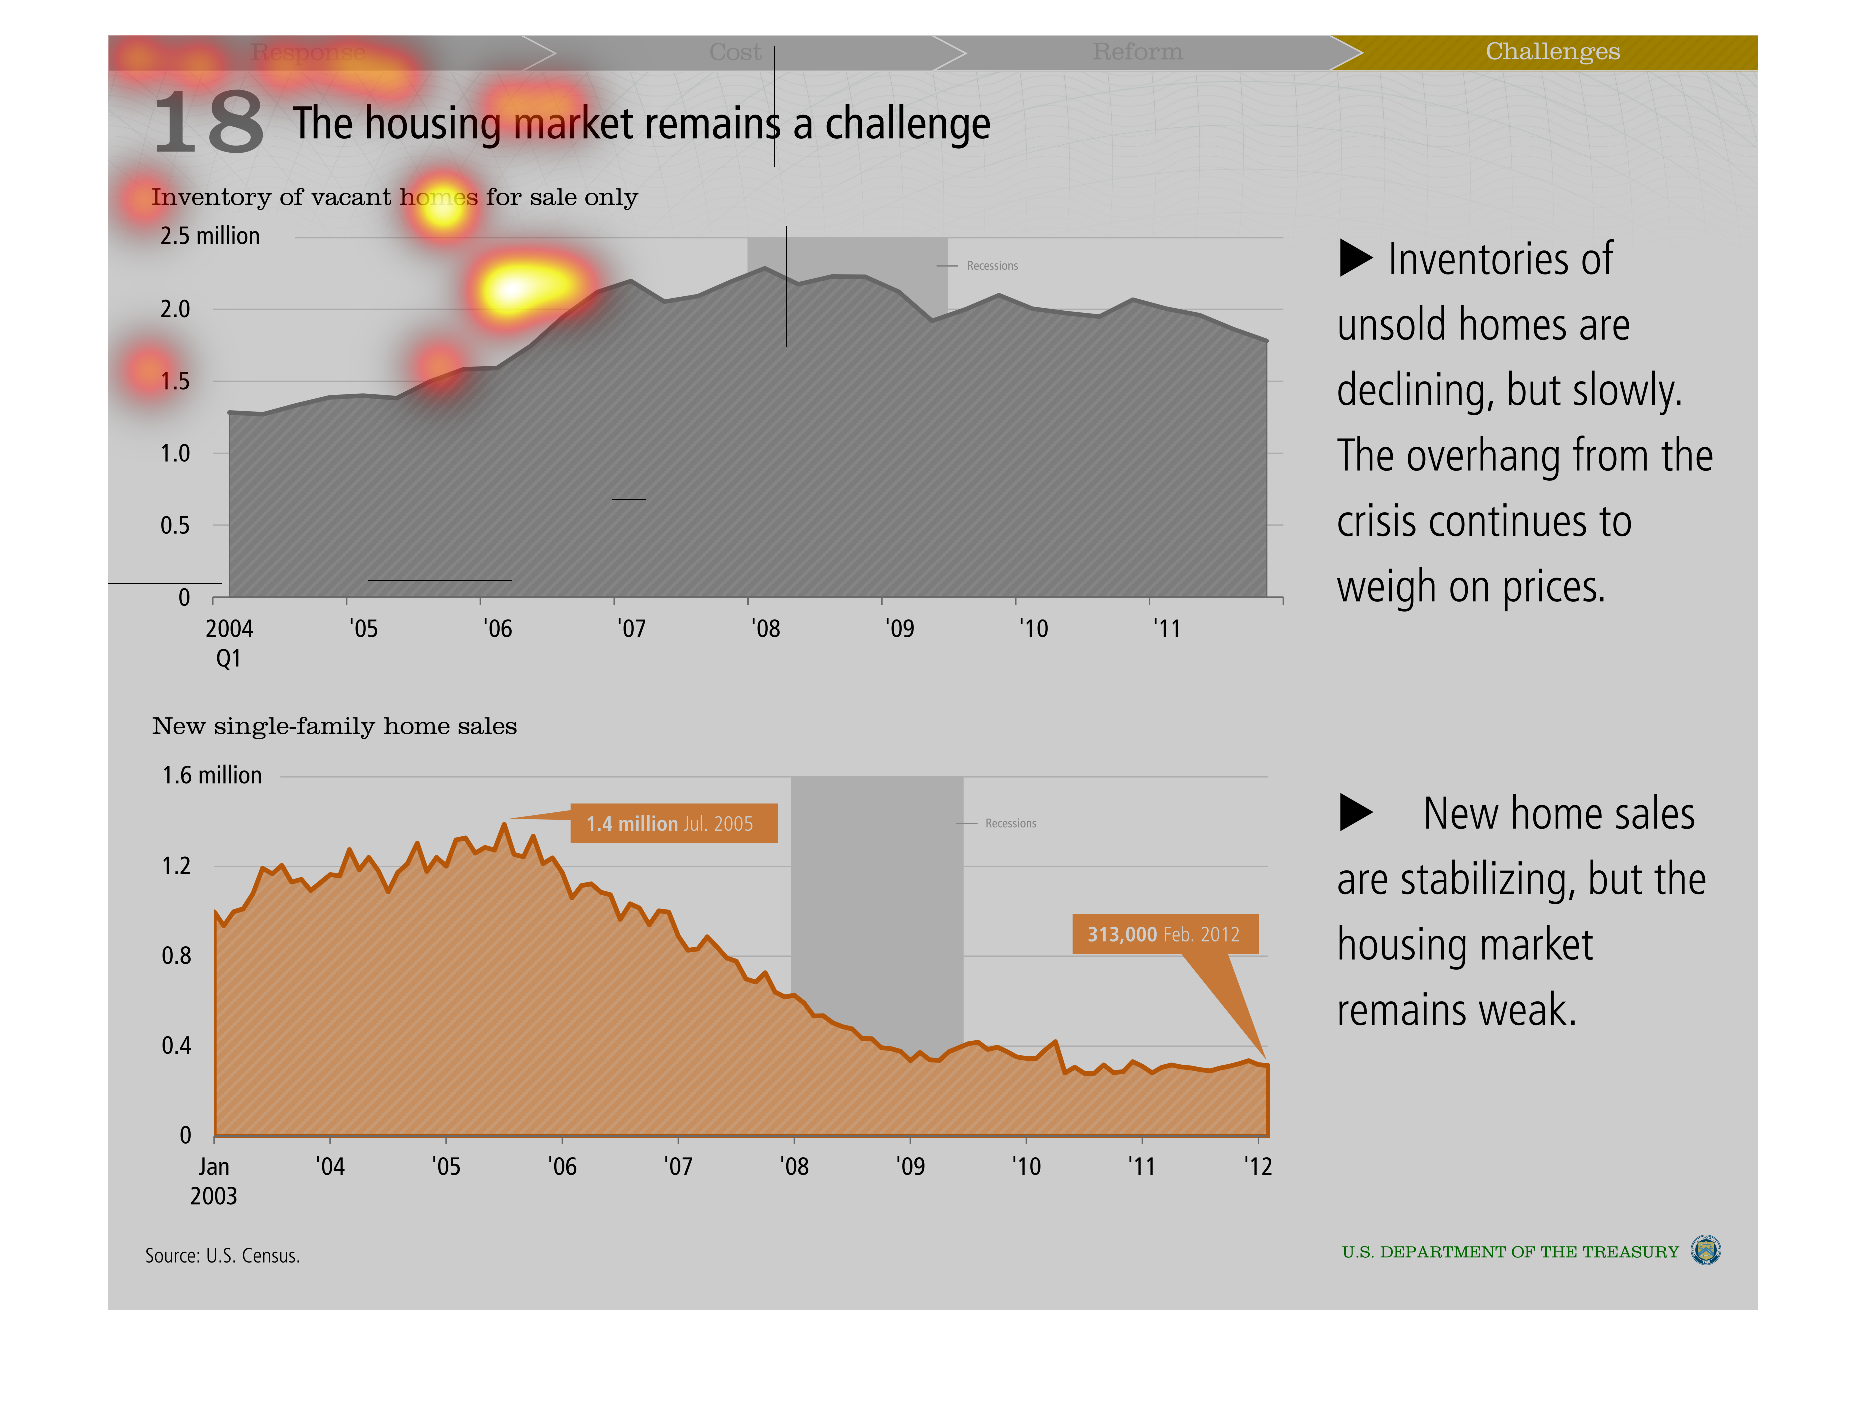
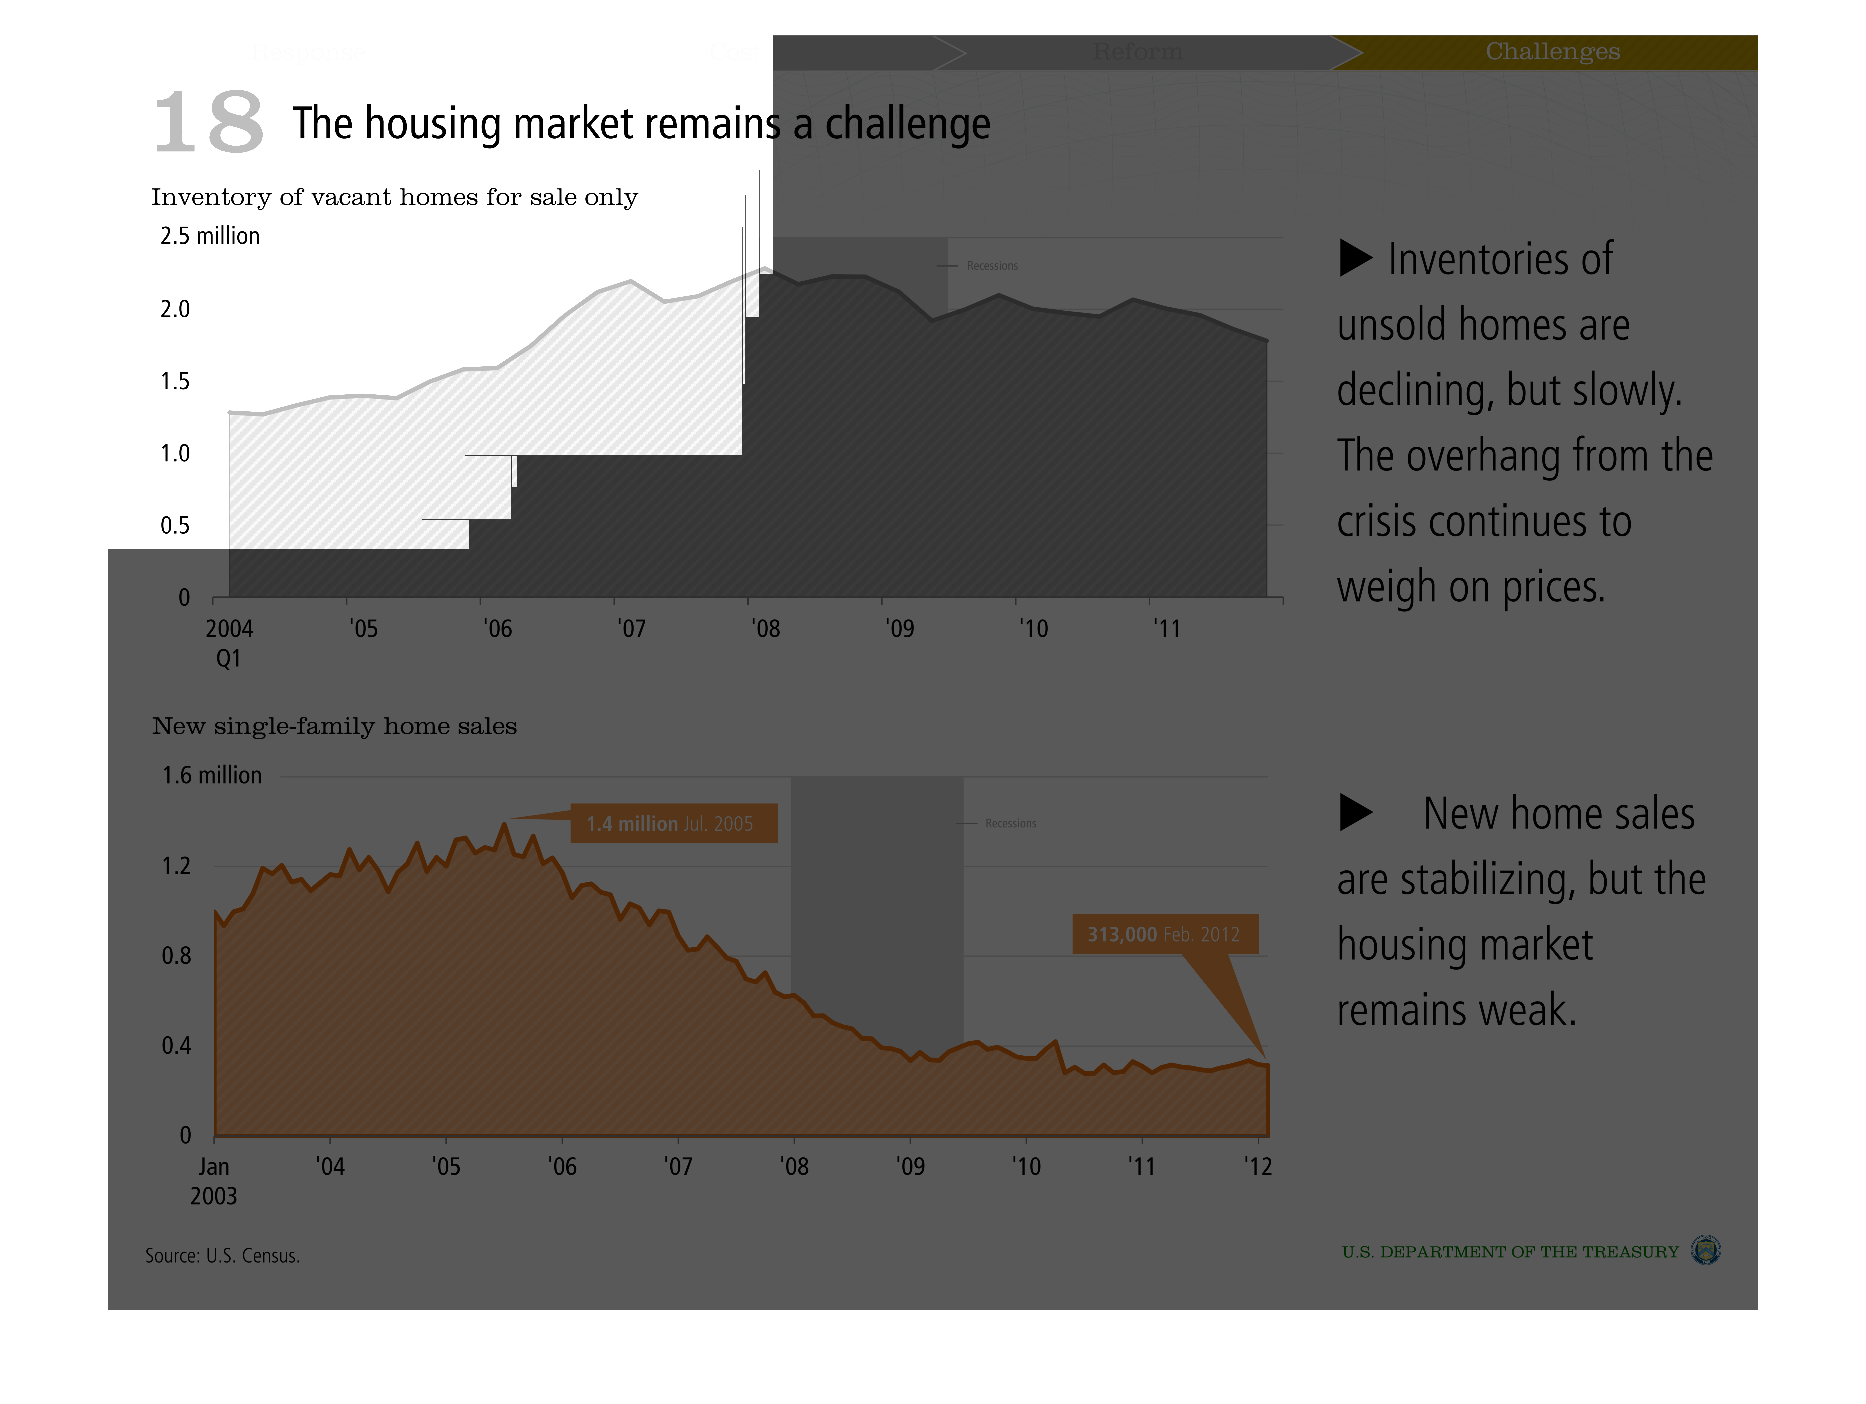
The top chart displays inventory of vacant homes for sale, which has been holding relatively
steady since a small periord of decline after a rapid increase from 2006-2008.  The bottom
chart shows new single family home sales, which seems to be bottoming out after a period of
steady decline since 2006.
Warning: Image is too big to fit on screen; displaying at 50%
Warning: Image is too big to fit on screen; displaying at 50%