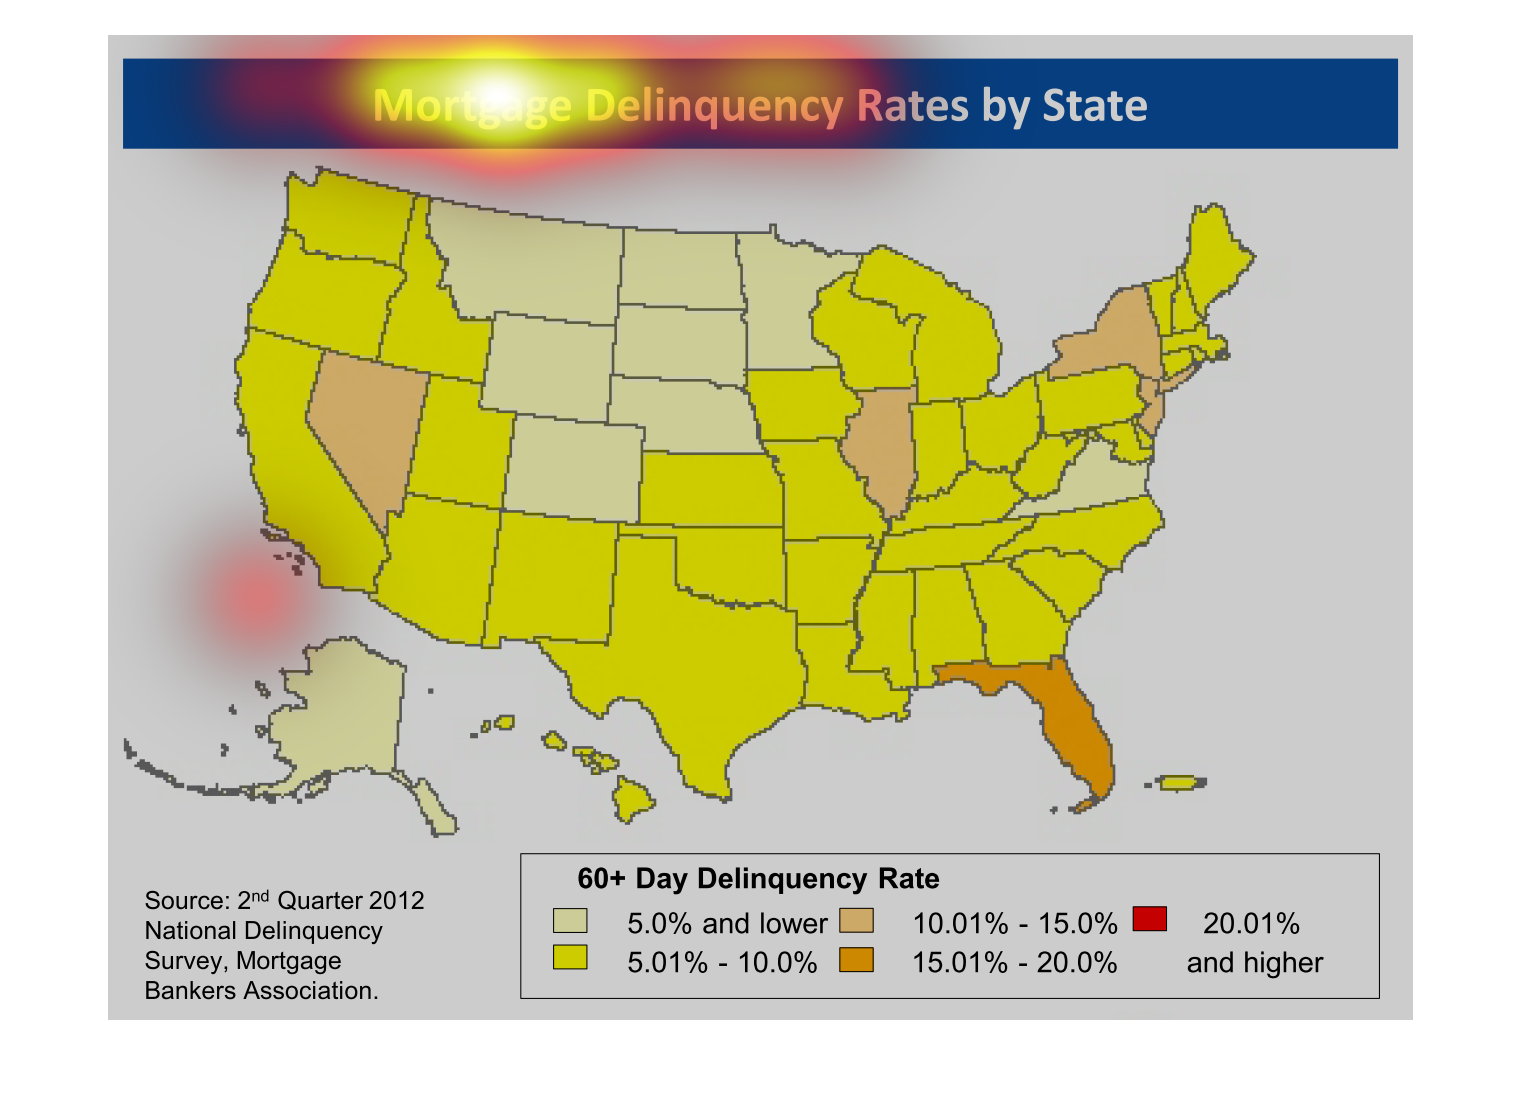
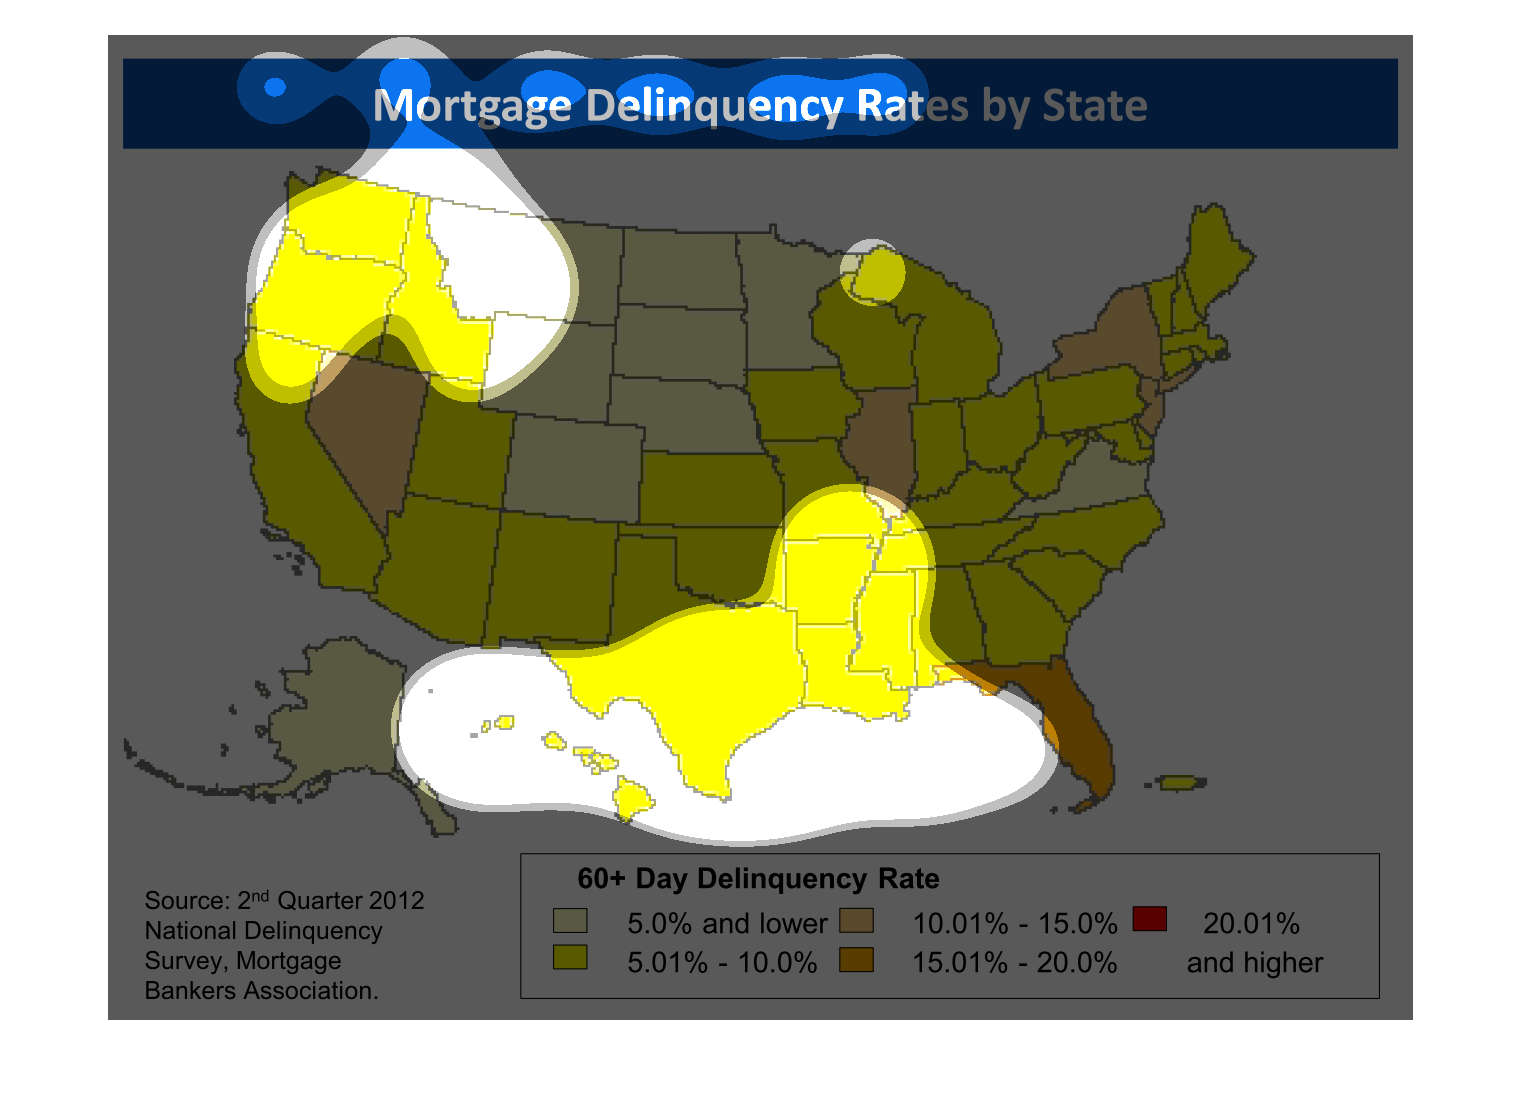
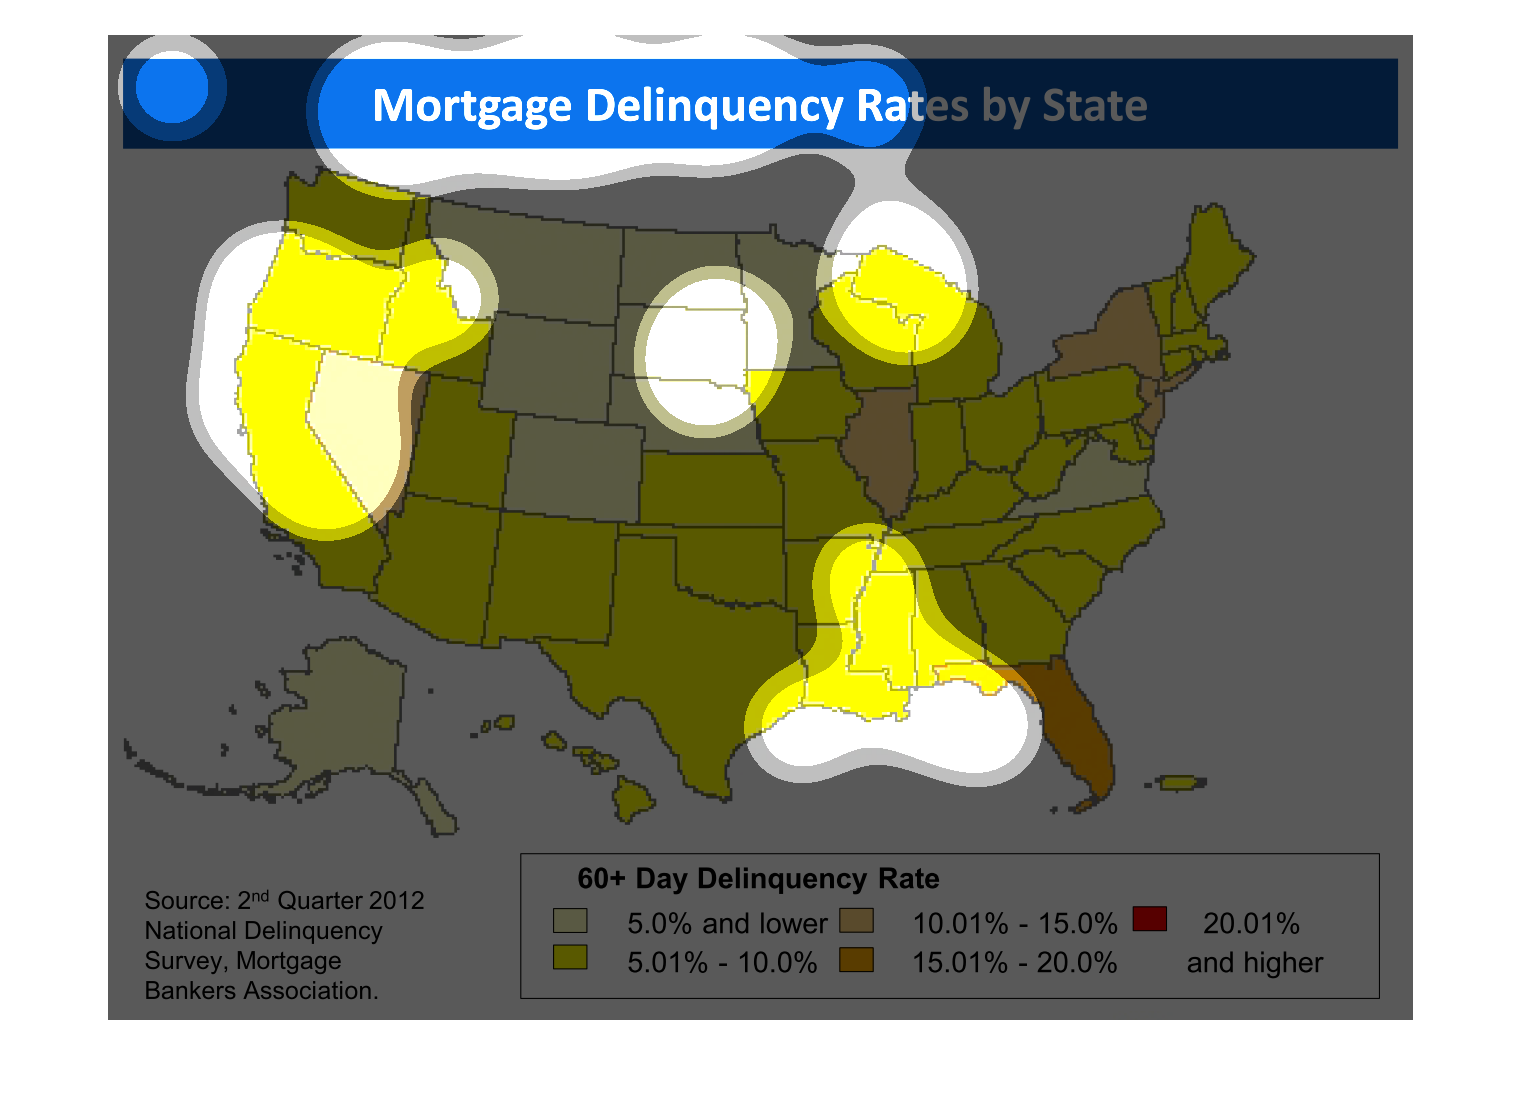
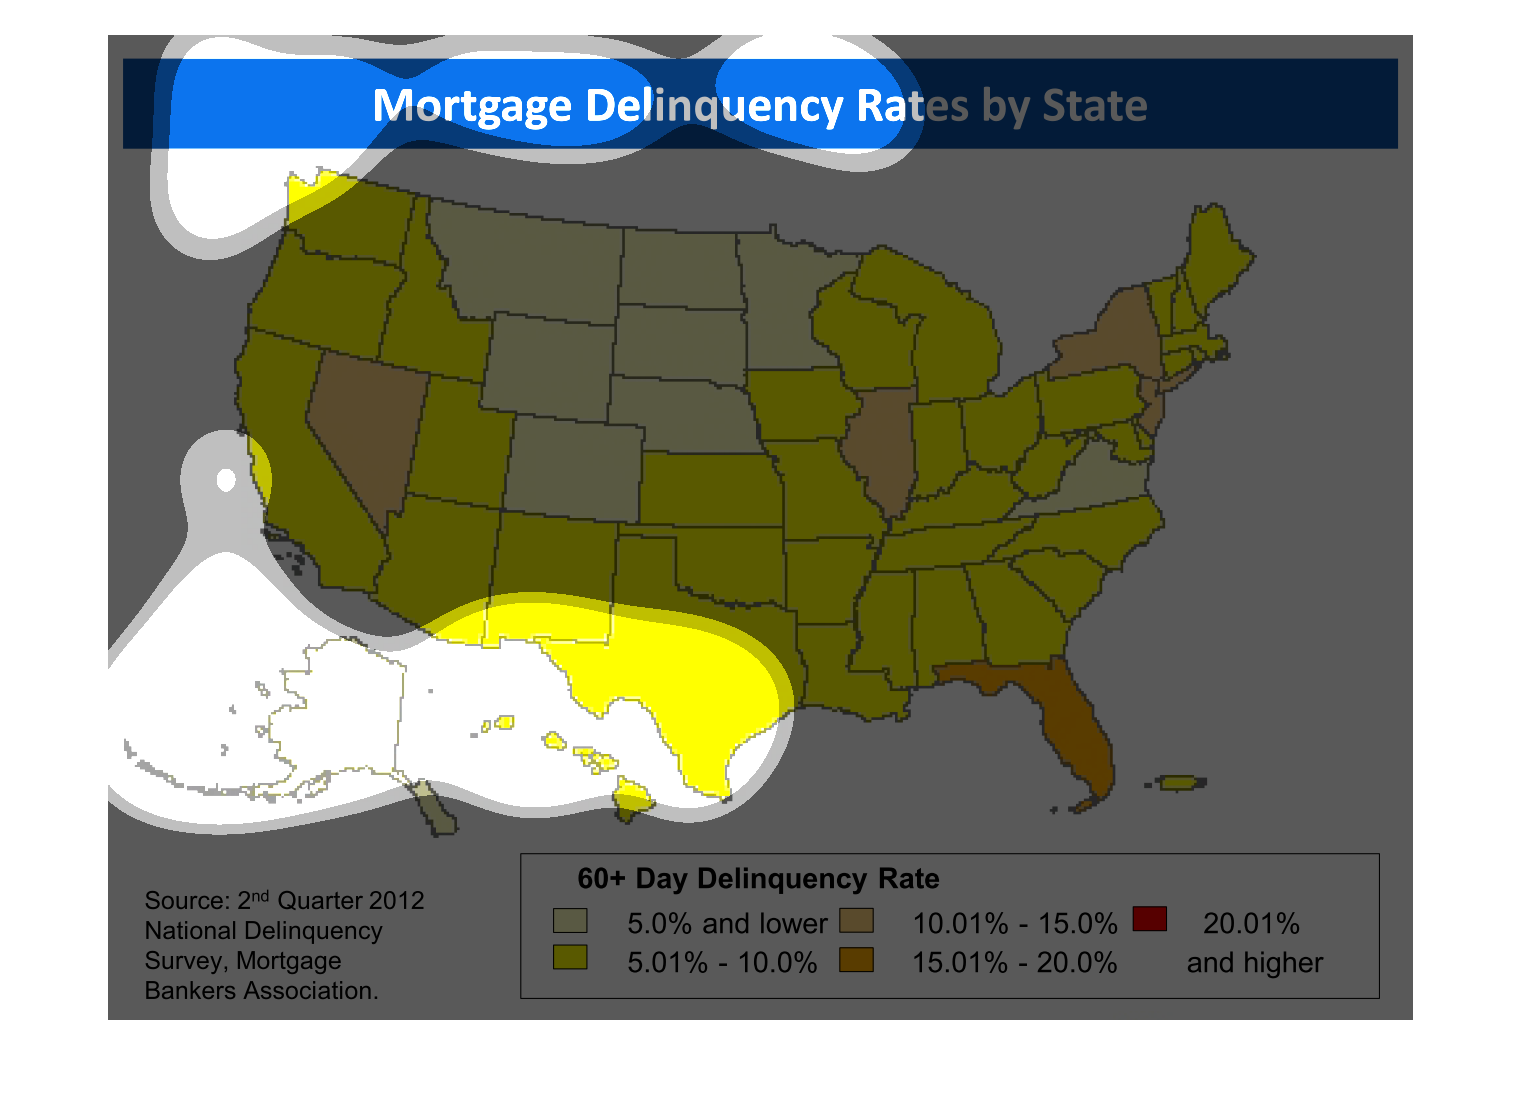
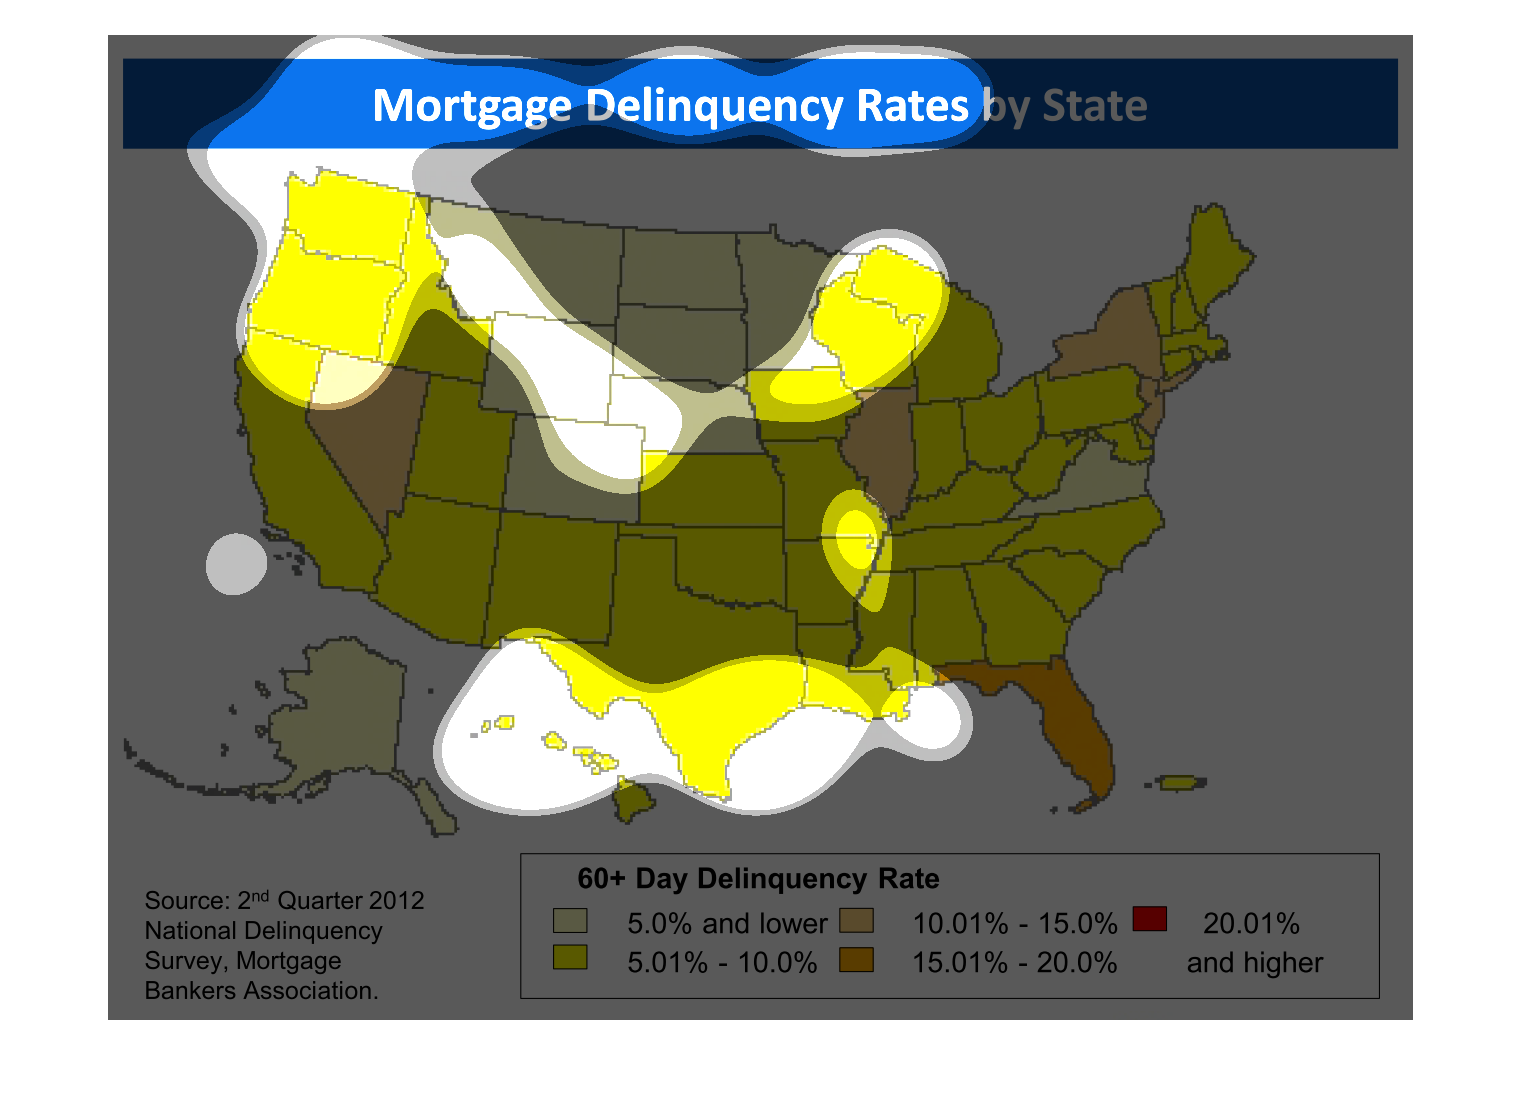
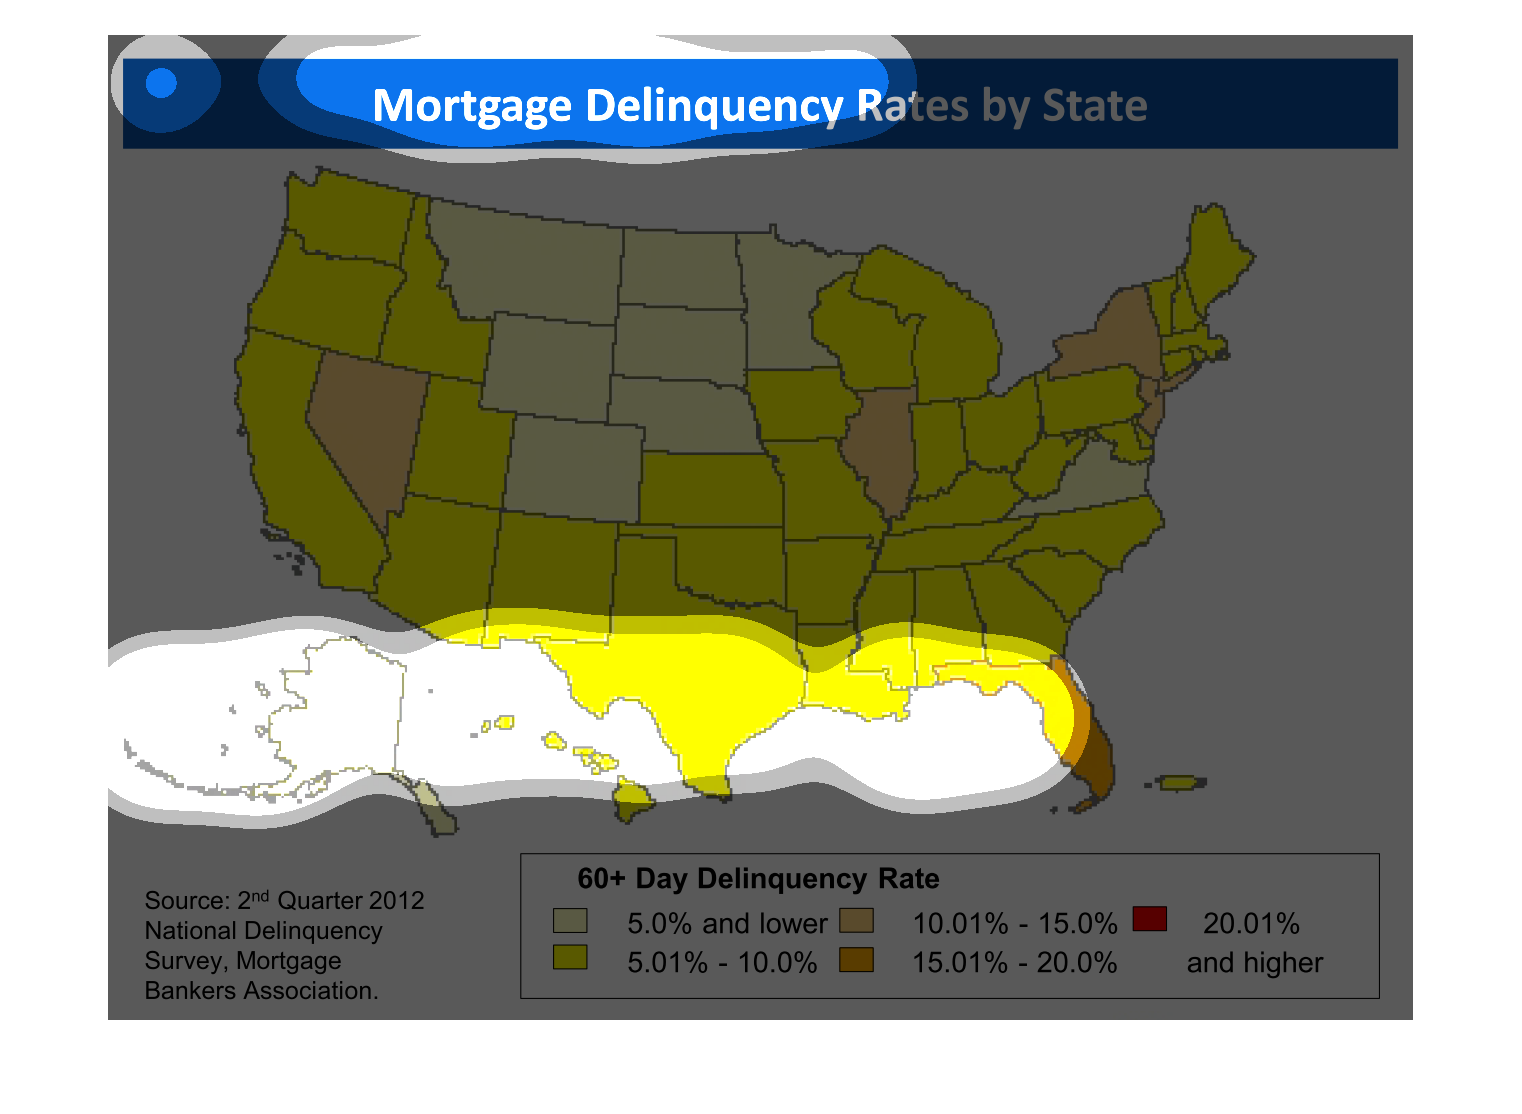
This graph shows mortgage delinquency by US state.  Rates are represented by different colors
ranging from yellow (low) to red (high).  Montana is in the lowest group of 5% or less, while
Florida is in the second highest percentage group of 15-20%. No states have higher than 20%.
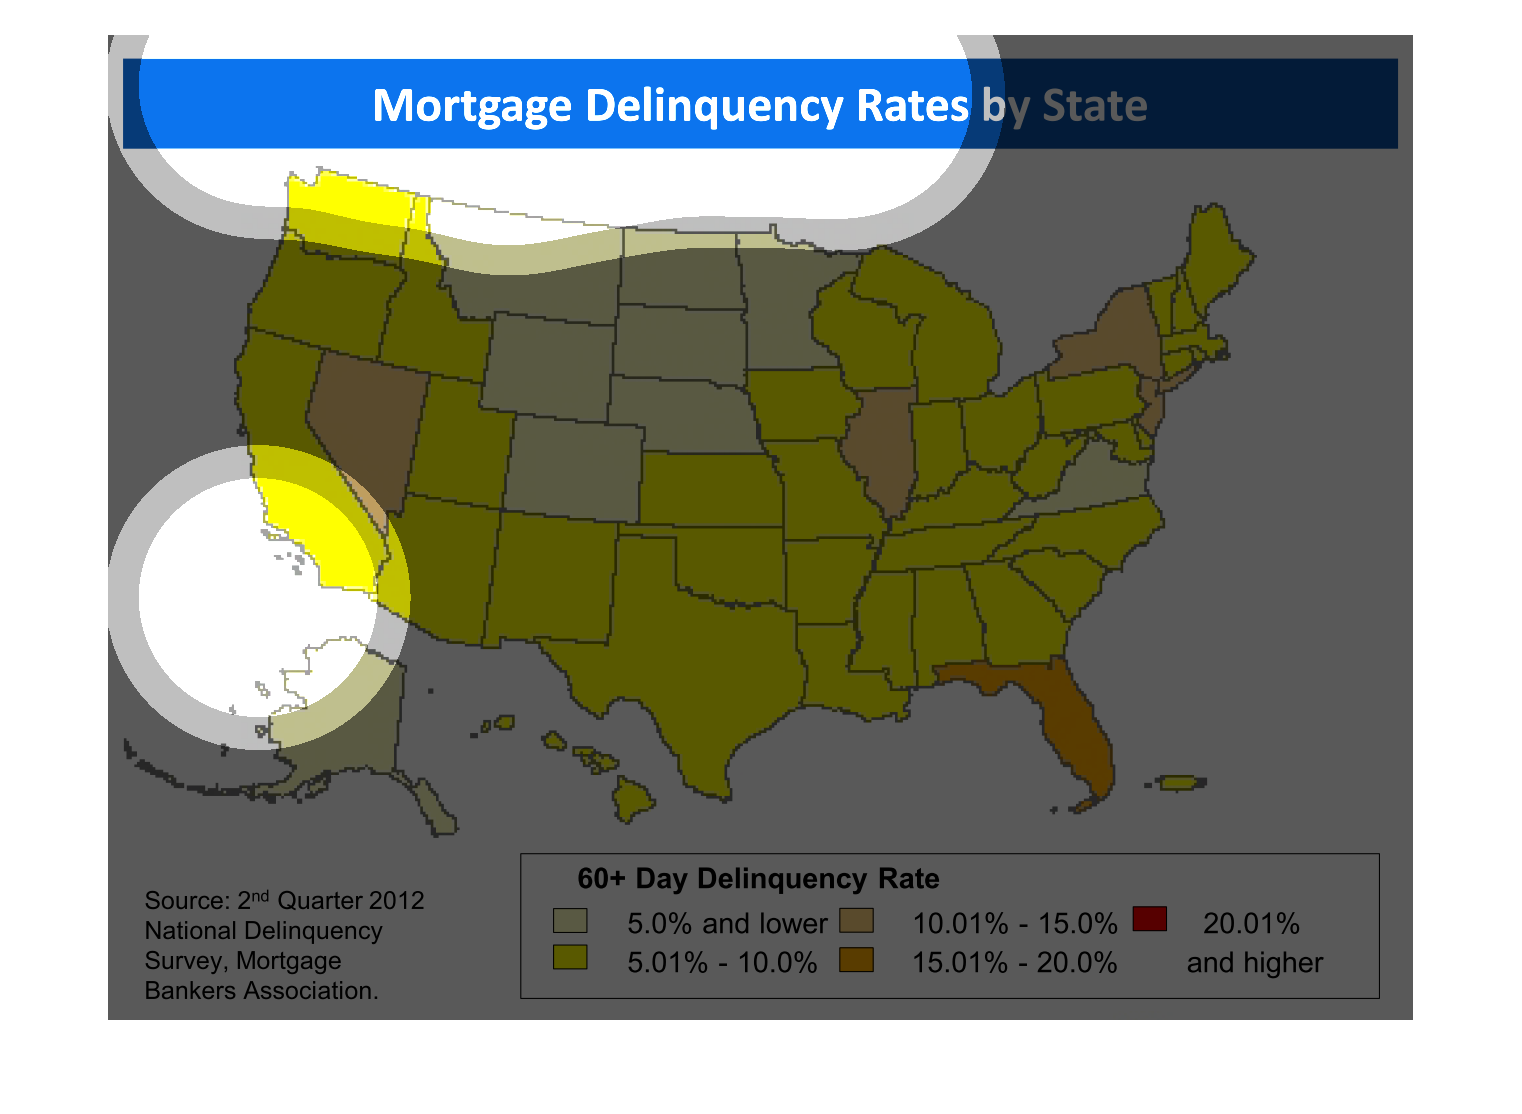
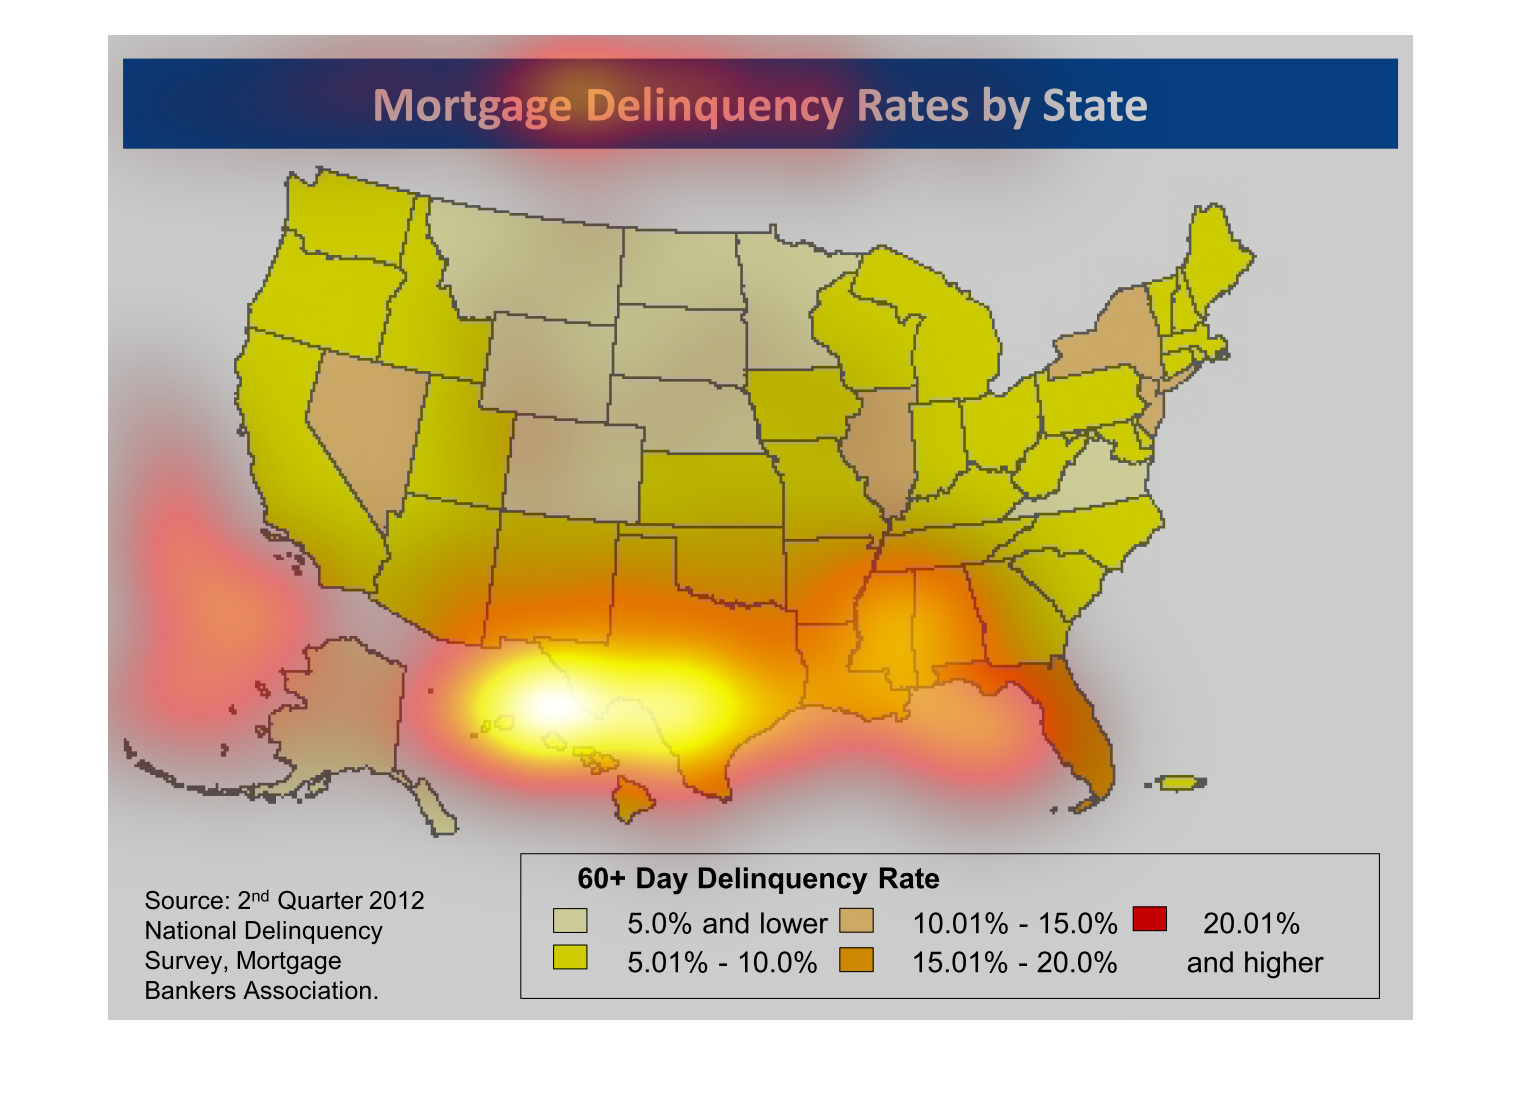
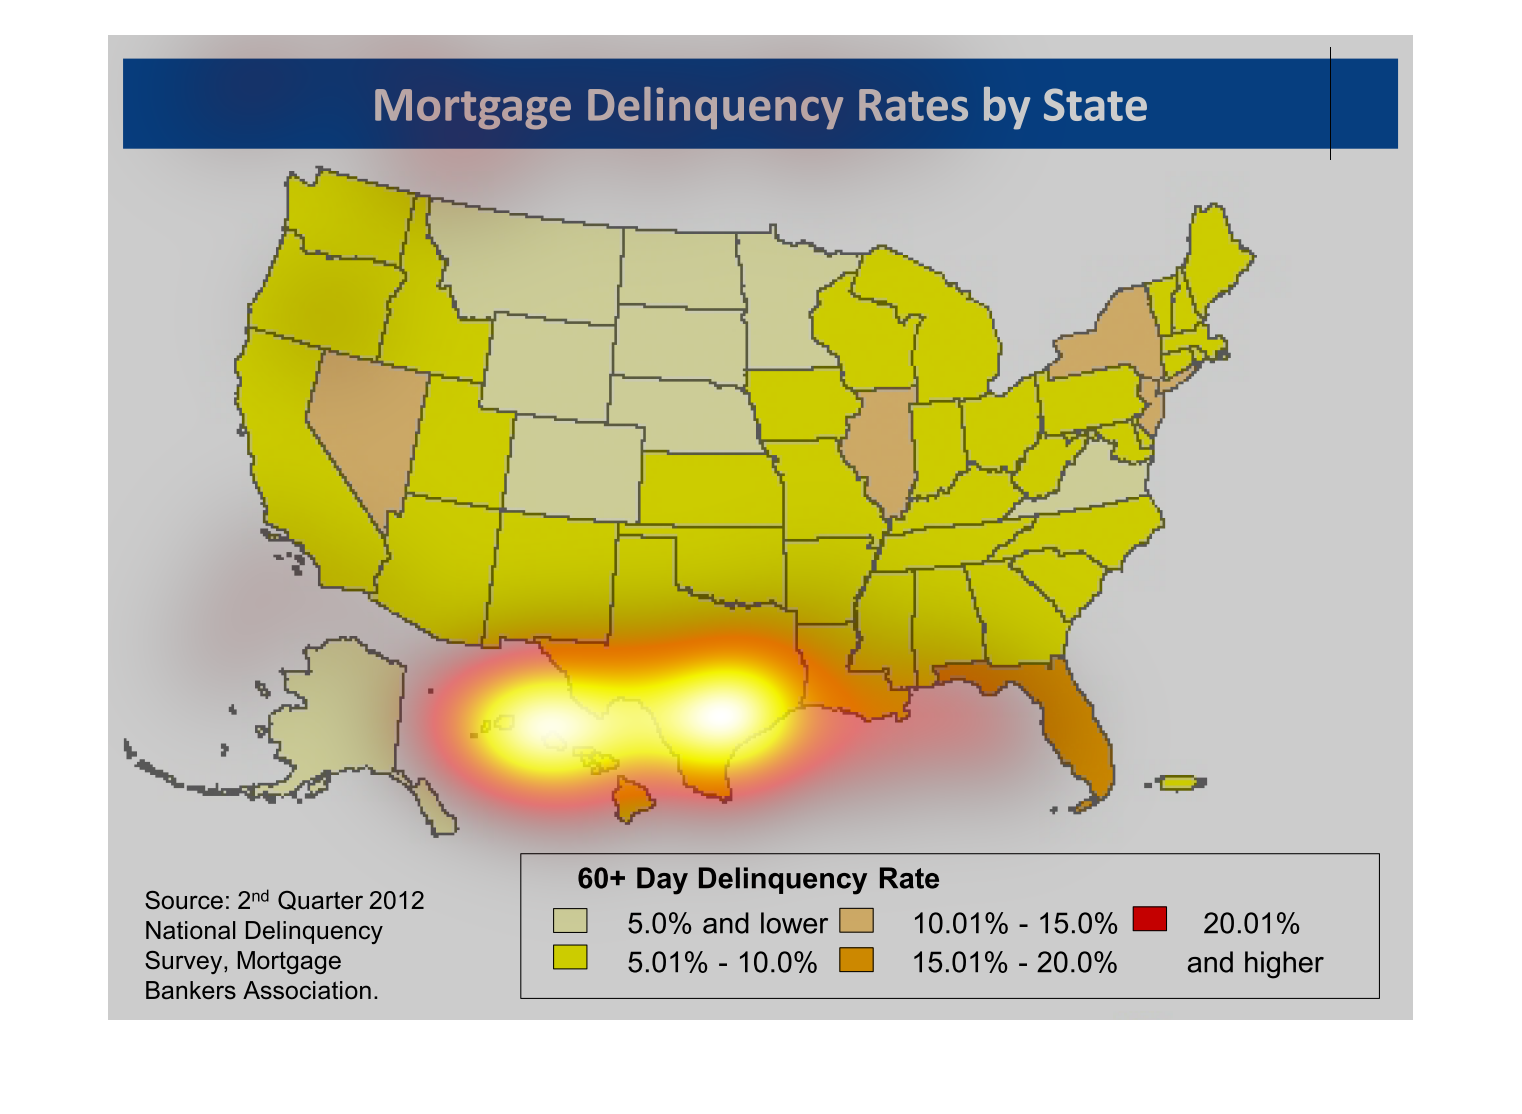
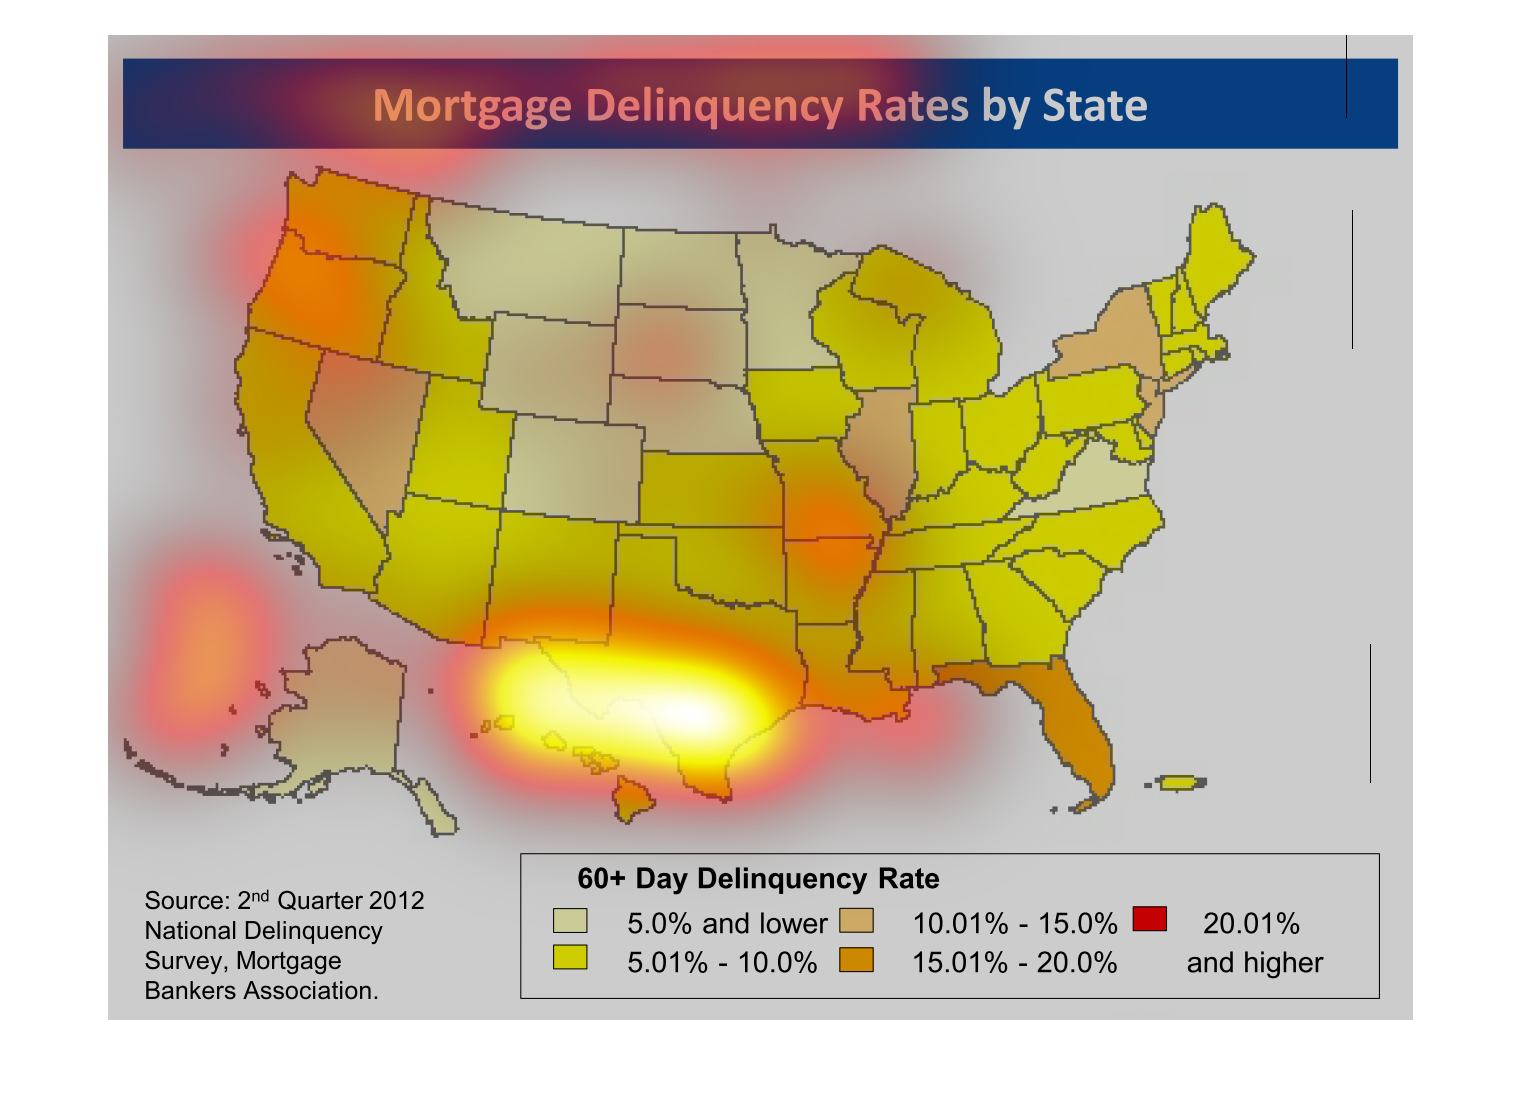
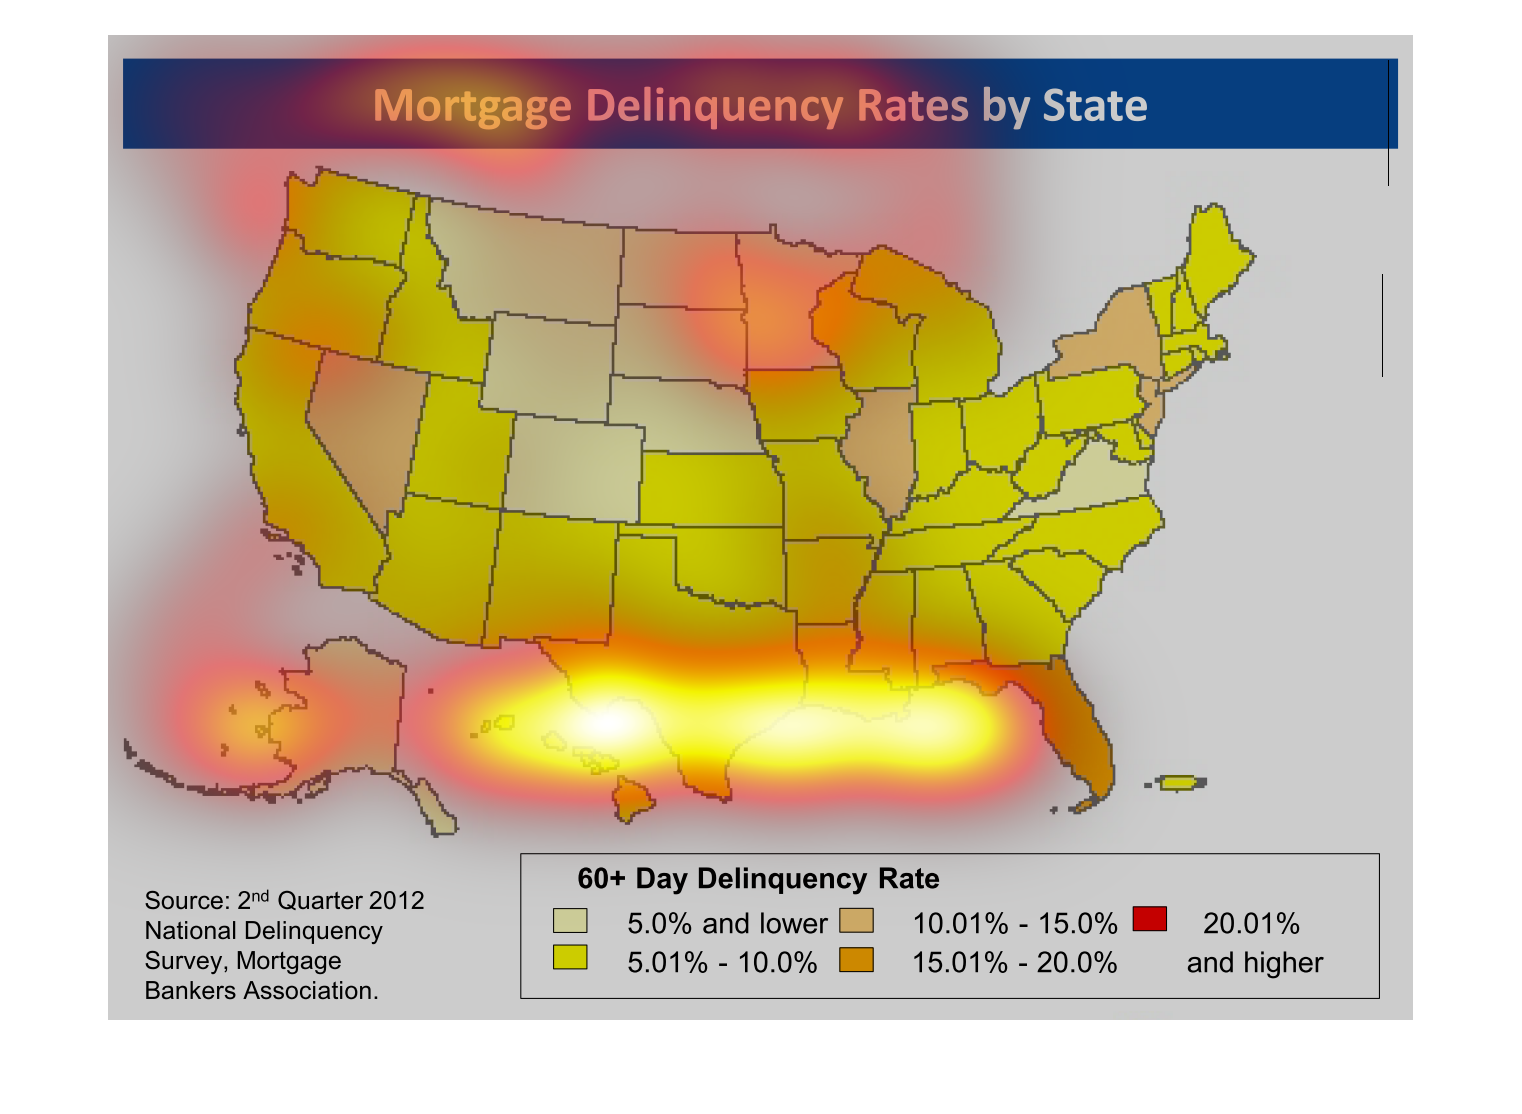
This image describes the number of mortgage delinquents by state. Florida and Nevada are two
states that are particularly high. The midwest states are lower than the rest of the nation.
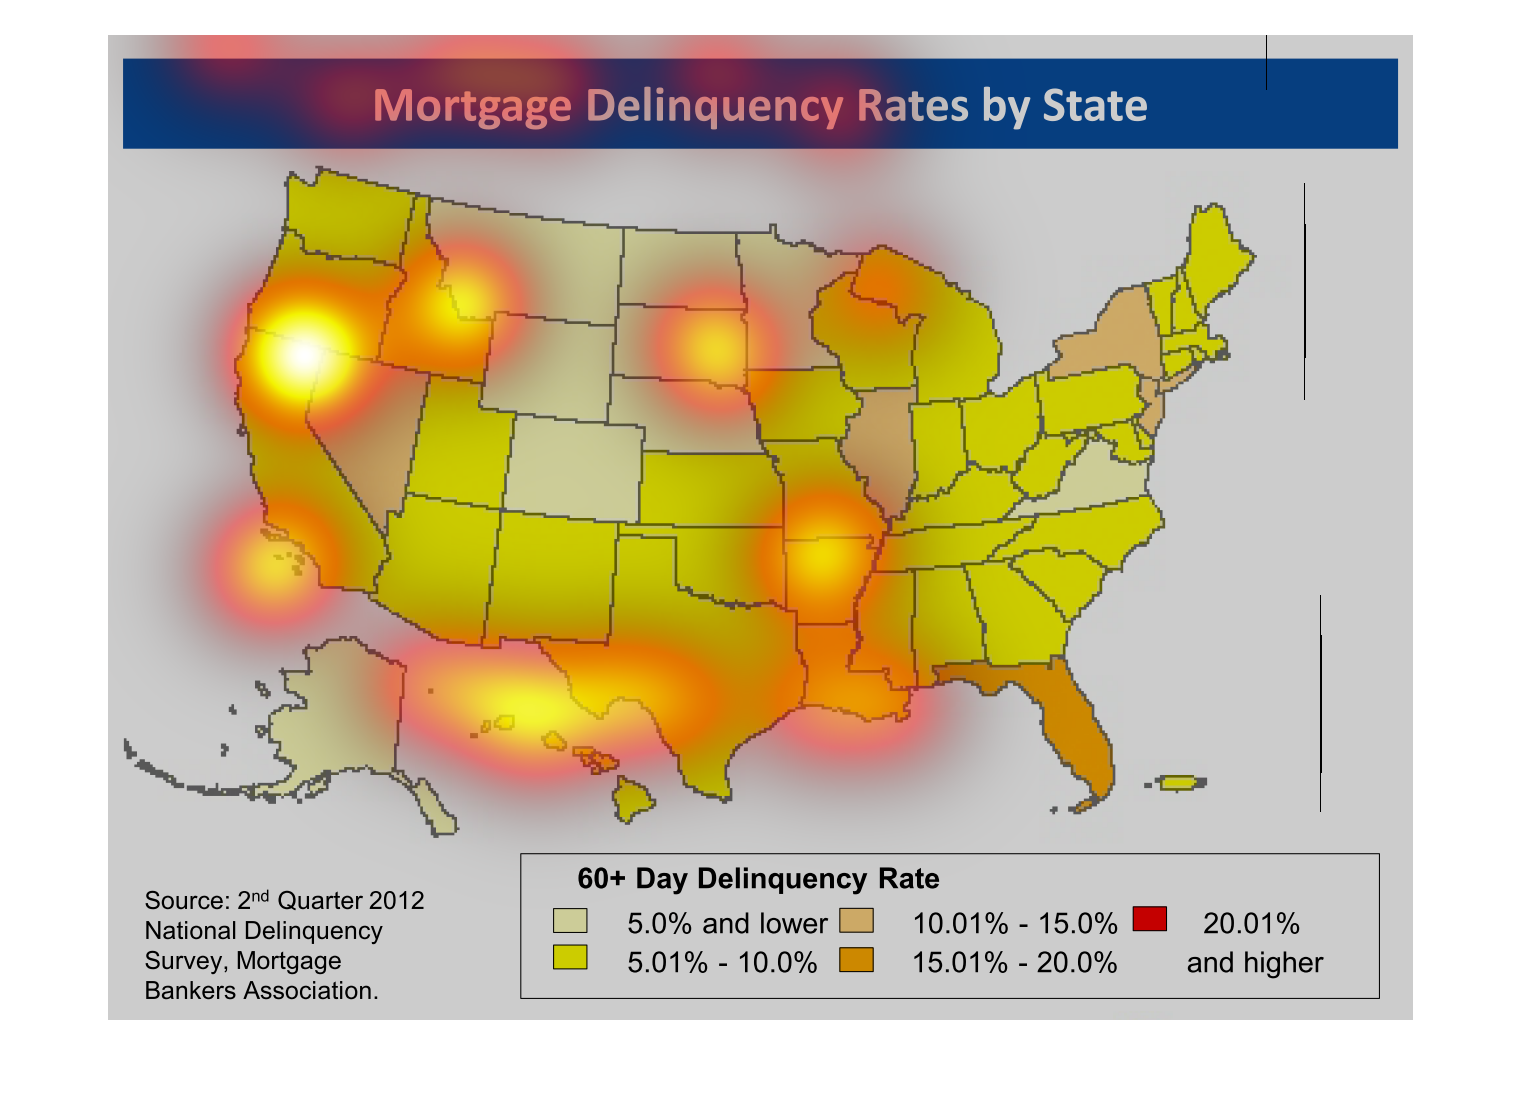
This is a graphical color-coded map showing the mortgage delinquency rates by state. The states
with higher than average rates are shown to be Florida and Nevada.
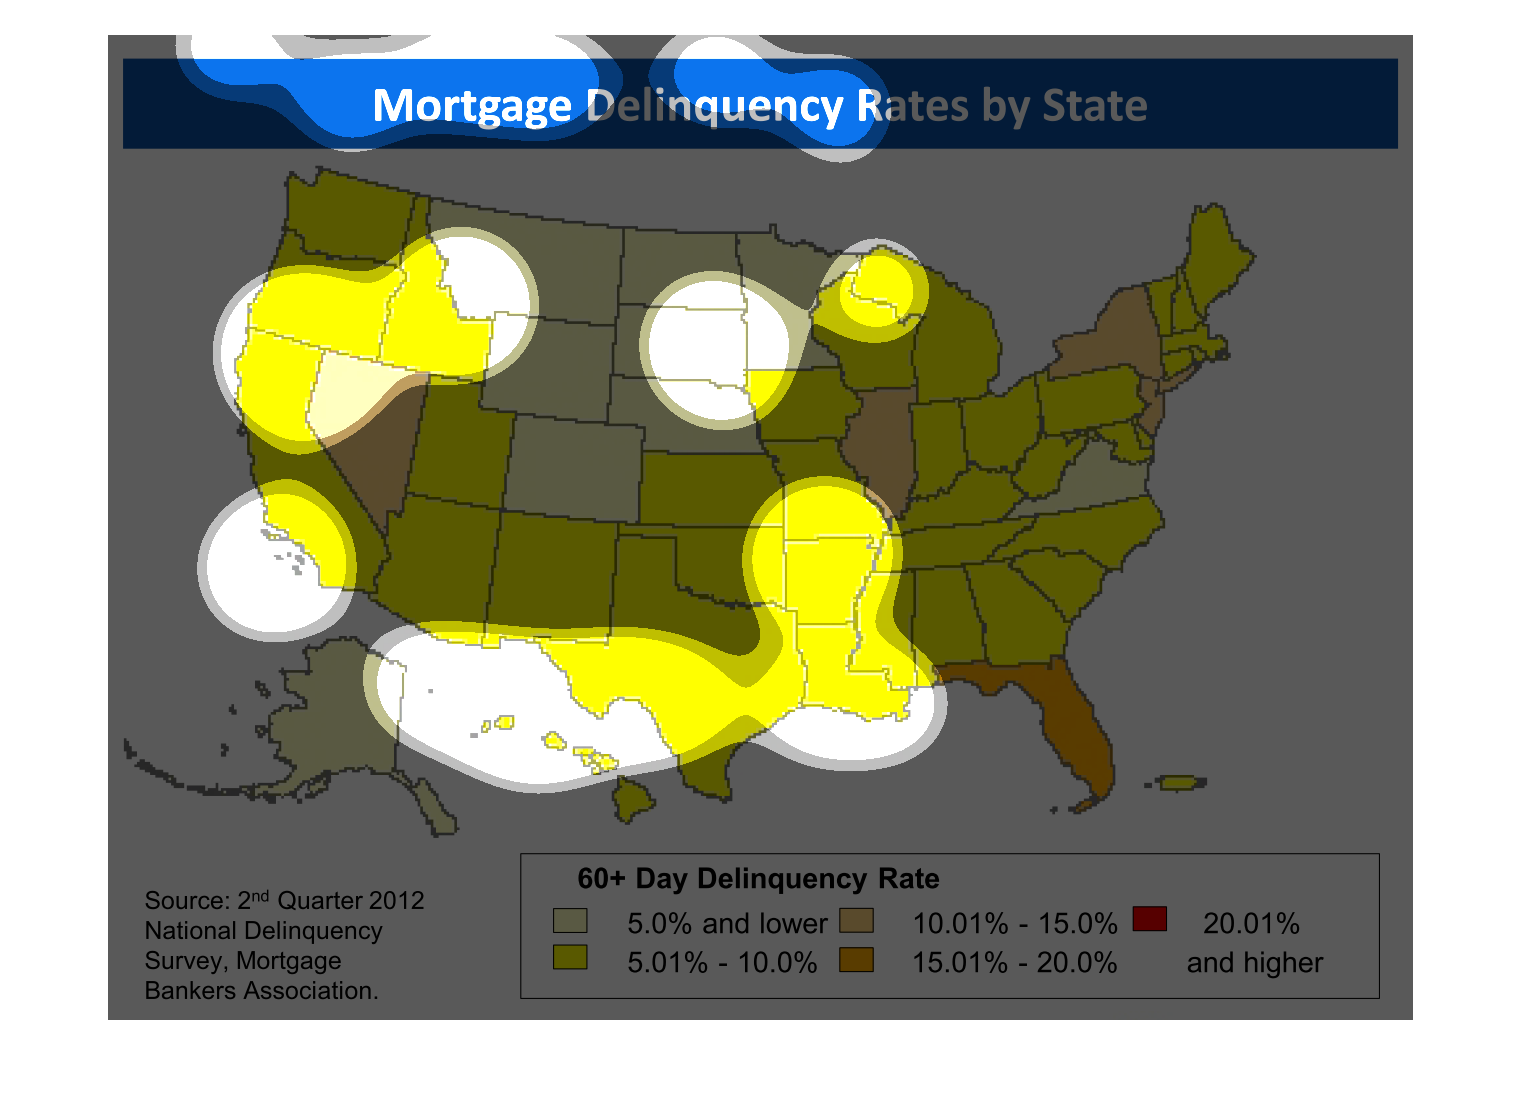
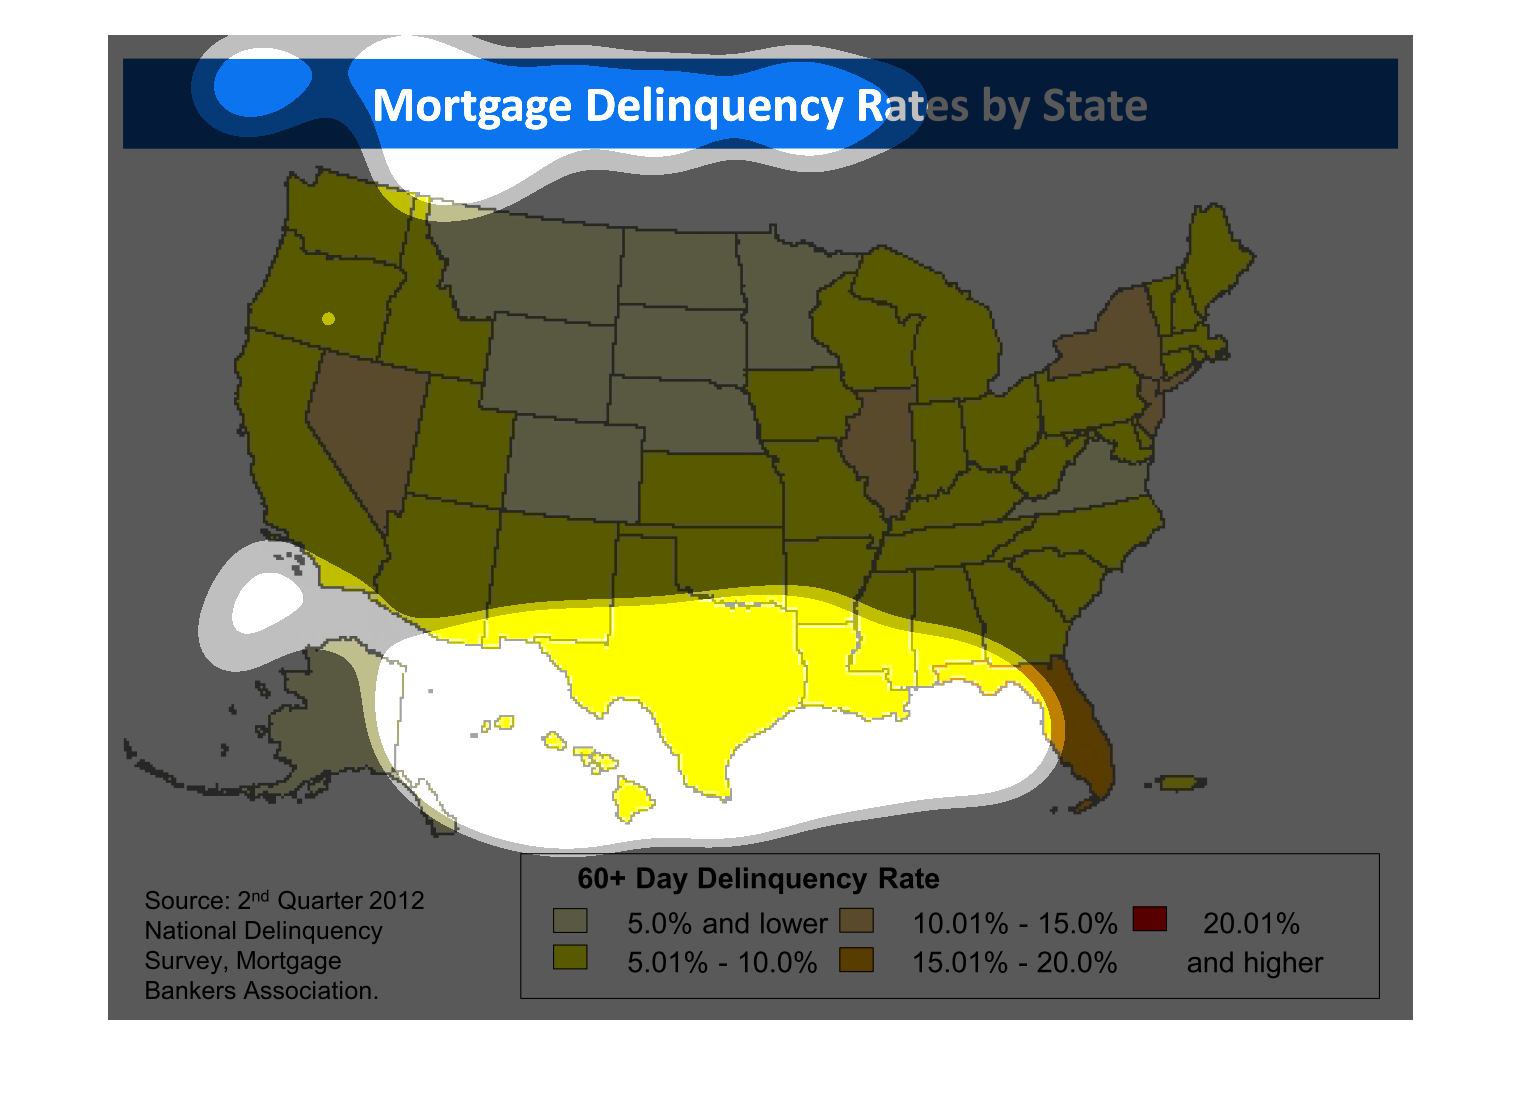
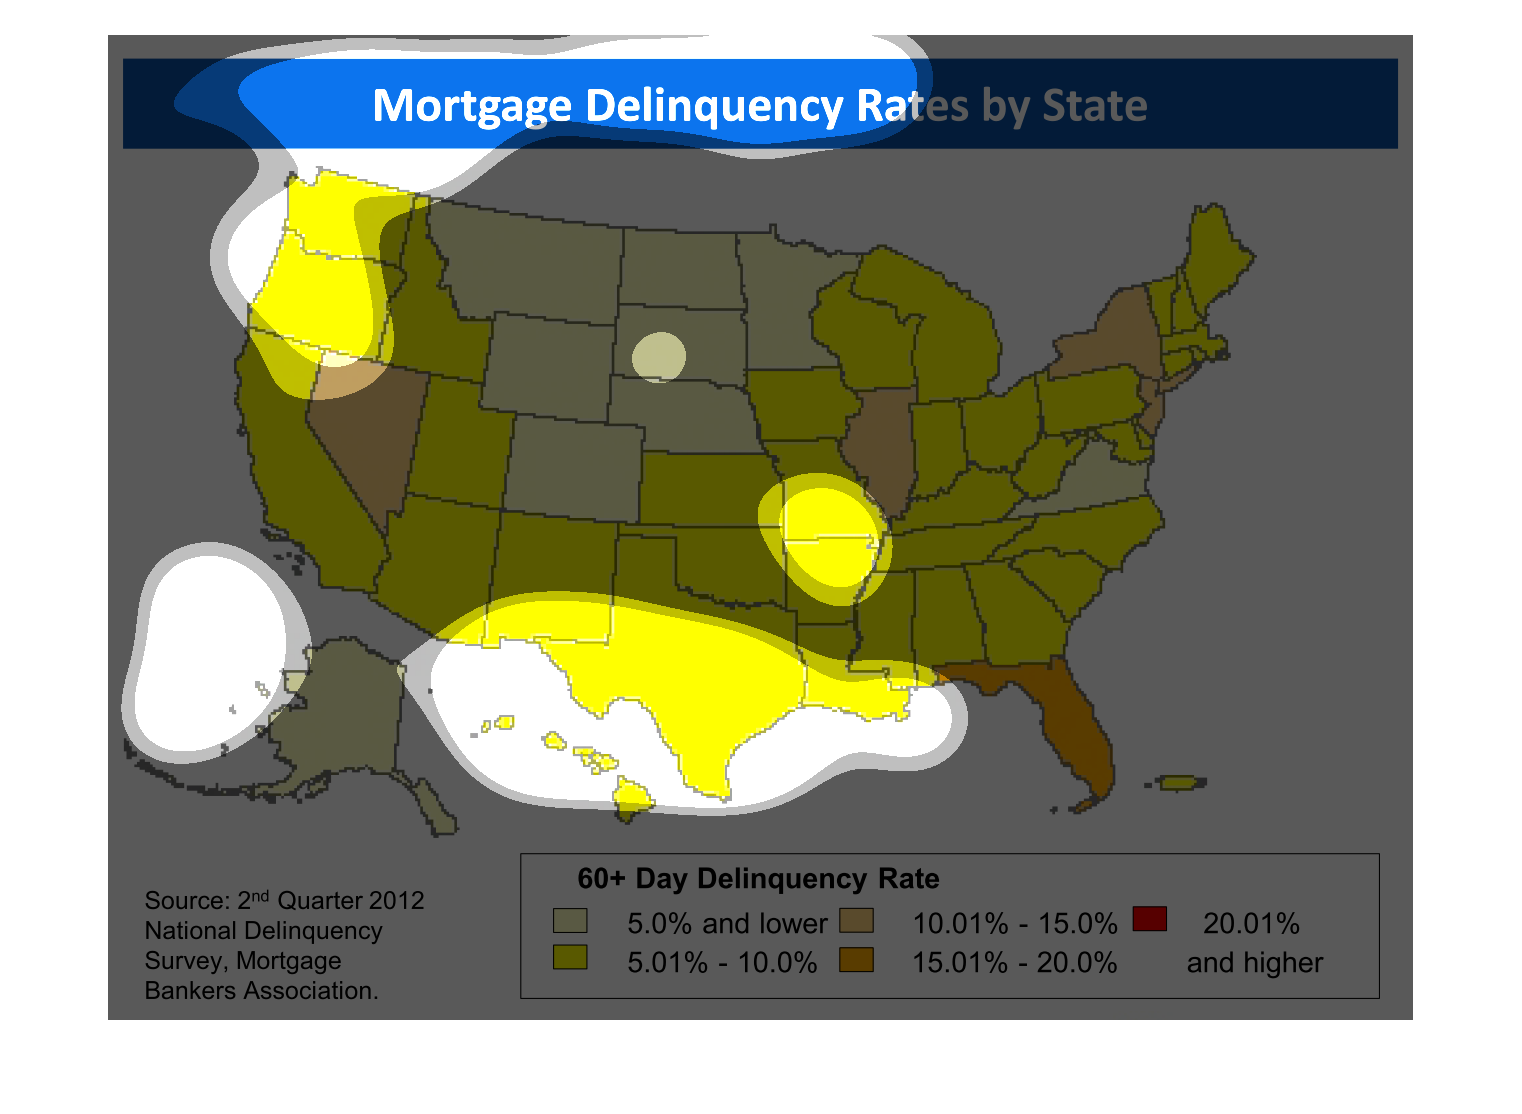
The title of this graph is, 'Mortgage Delinquency Rates by State'.  The graph displays a map
of the United States, Hawaii, Alaska and Puerto Rico.  The map is color coordinated to reflect
60+ days delinquency.
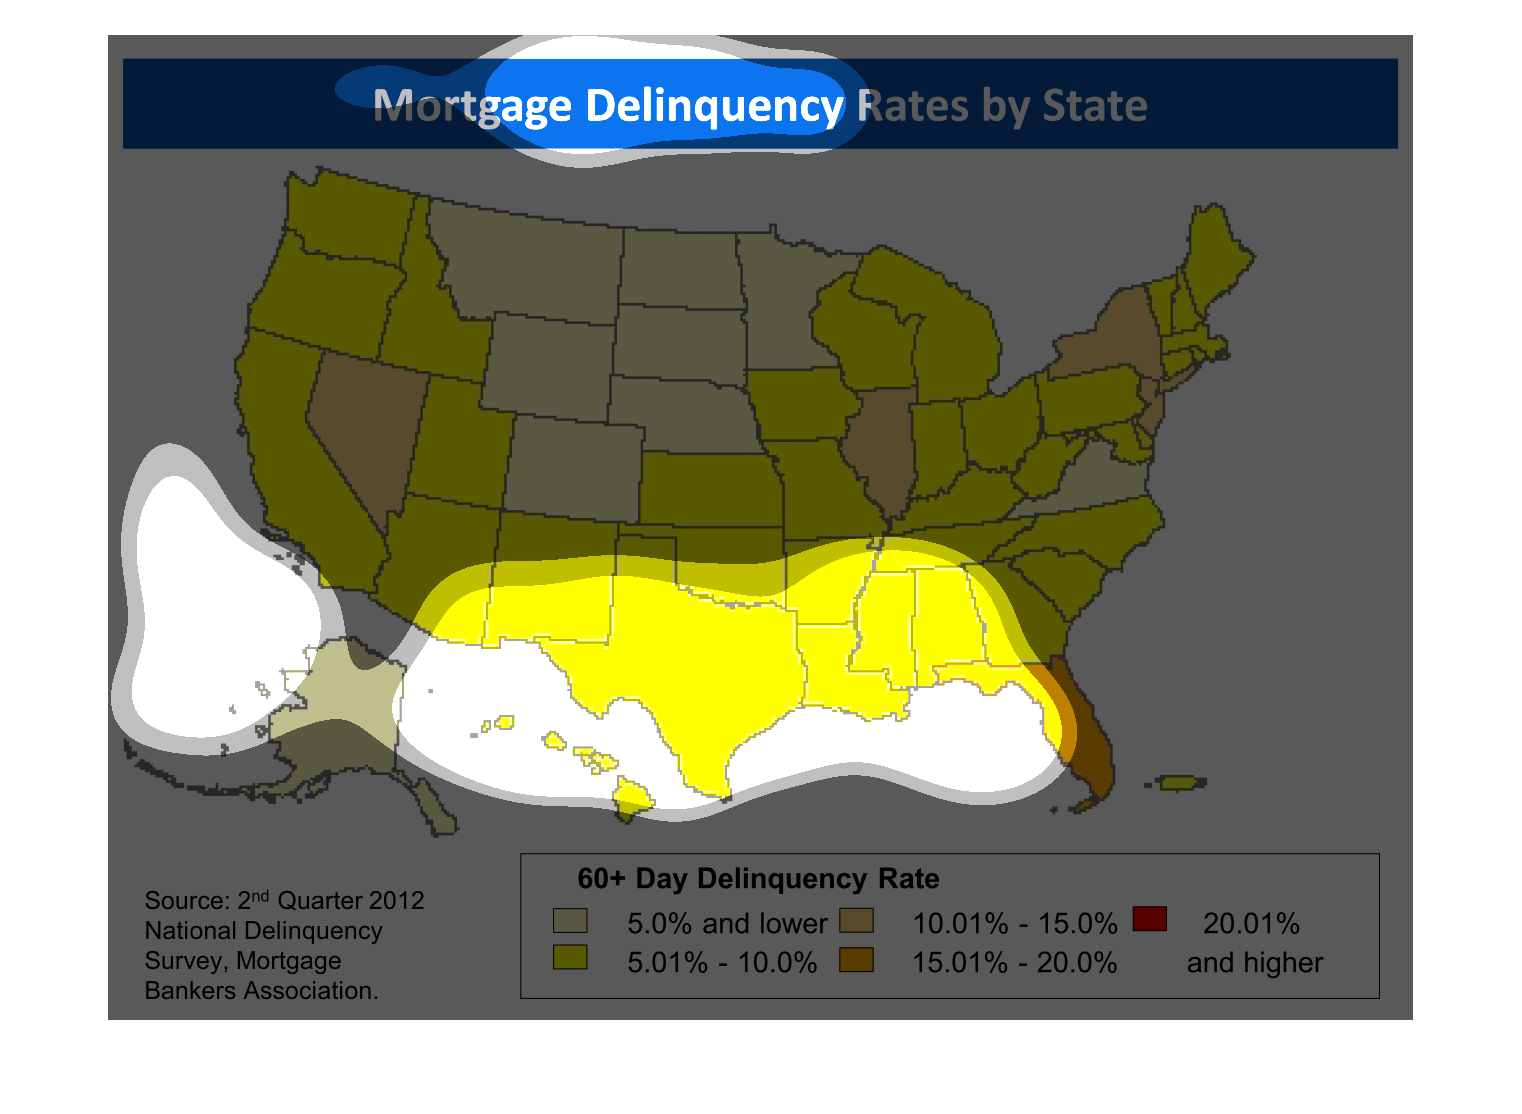
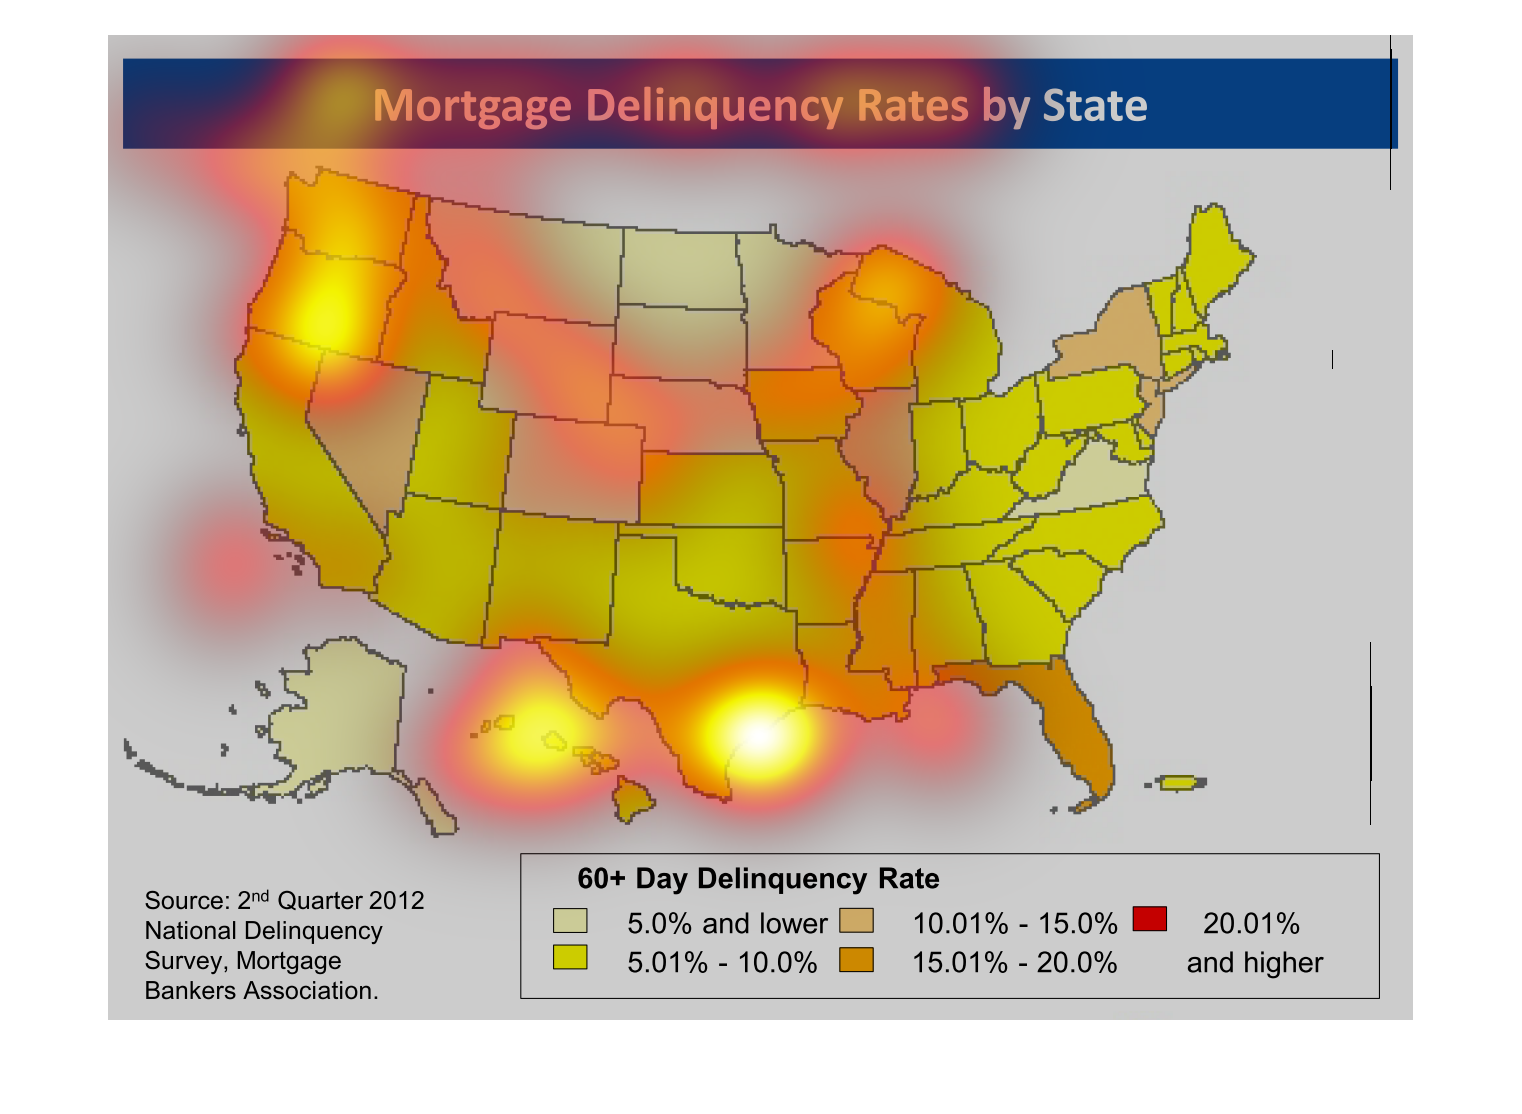
This chart describes mortgage delinquency rates by state for the second quarter of 2012. The
chart covers 60 plus day delinquency rate. Different percentages are represented by different
colors.
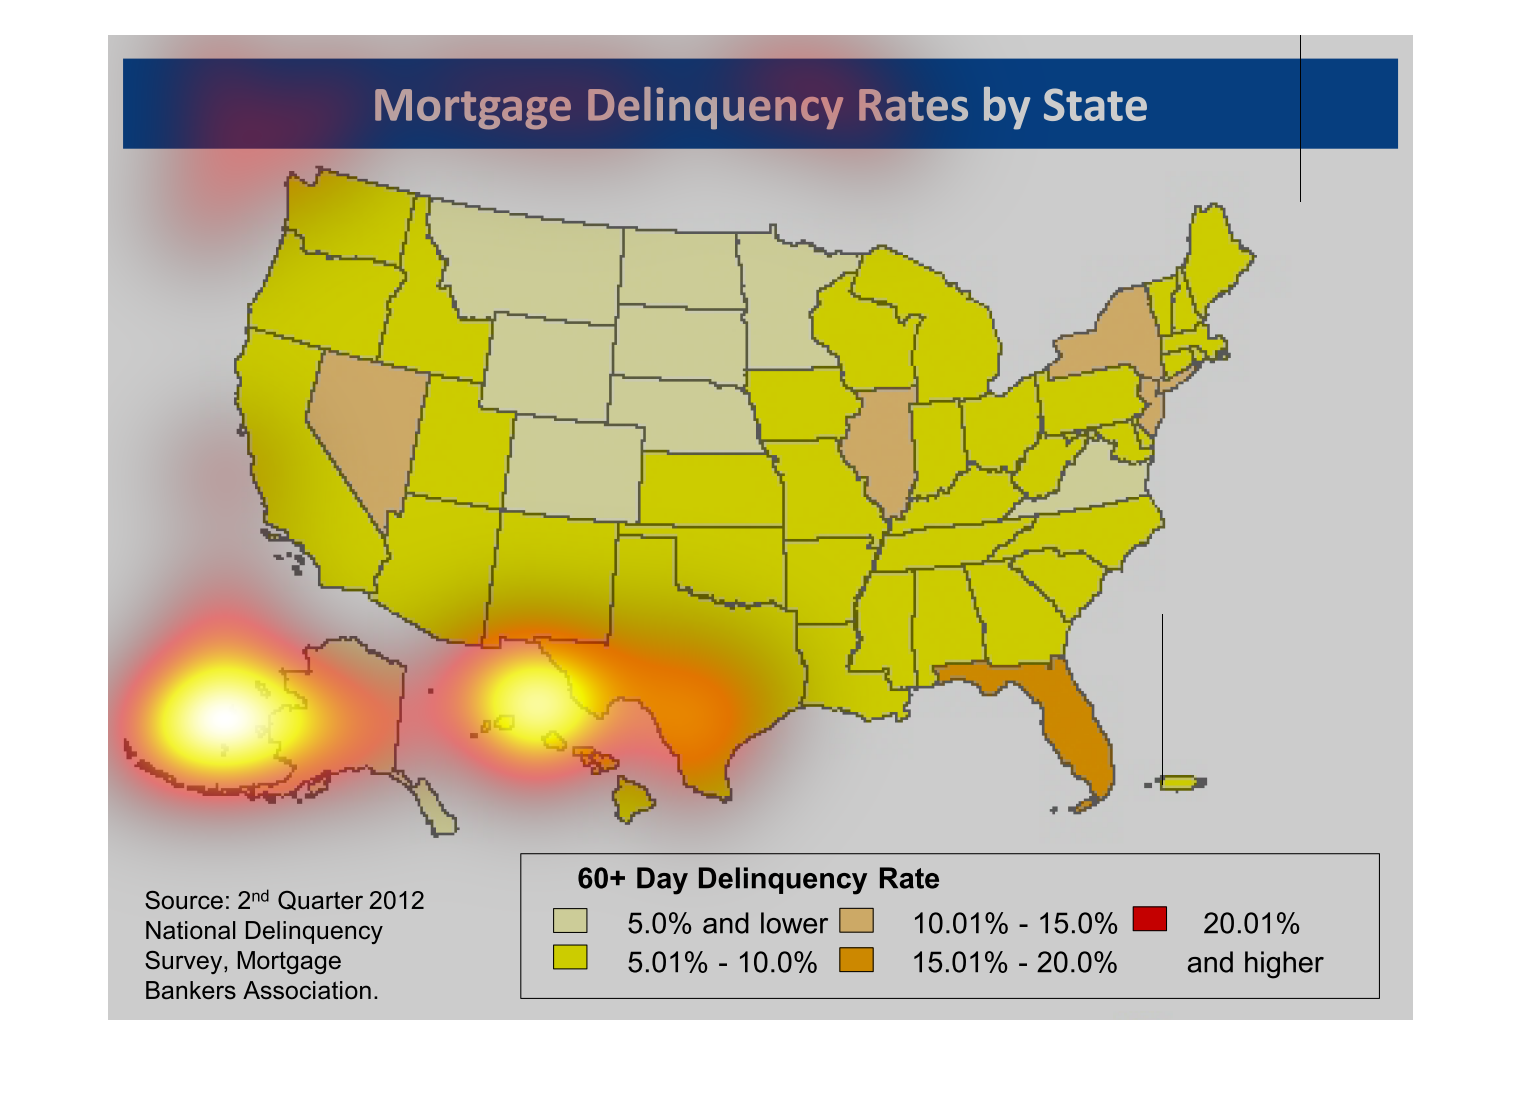
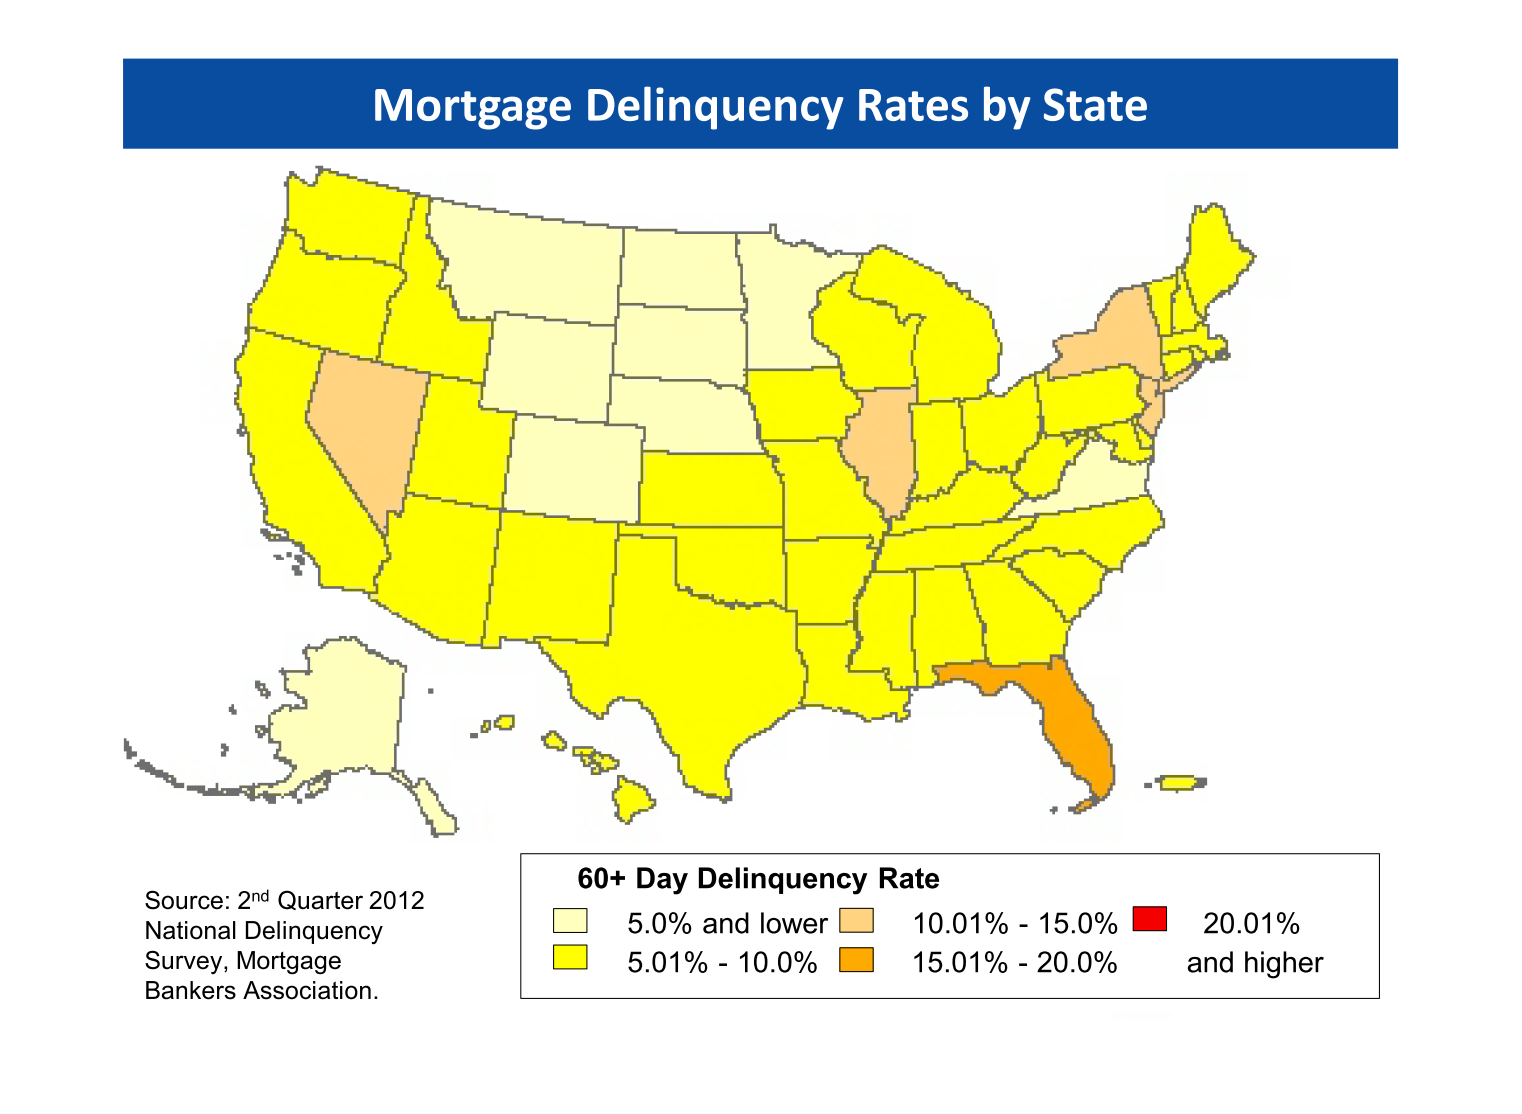
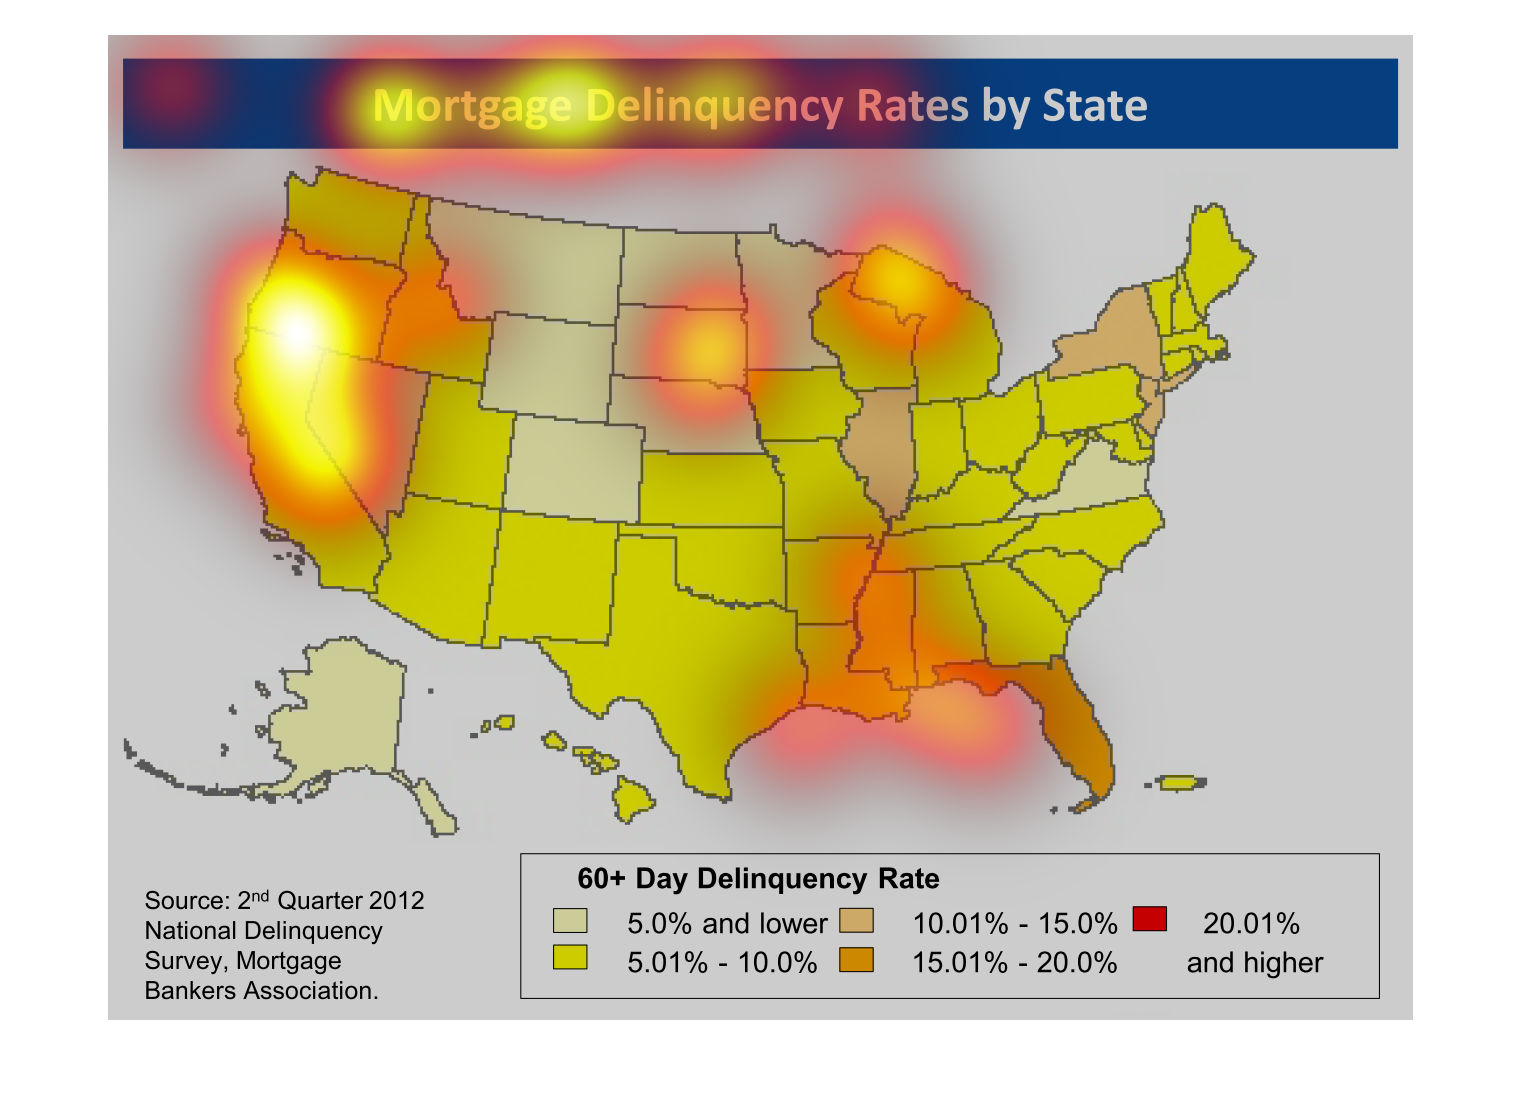
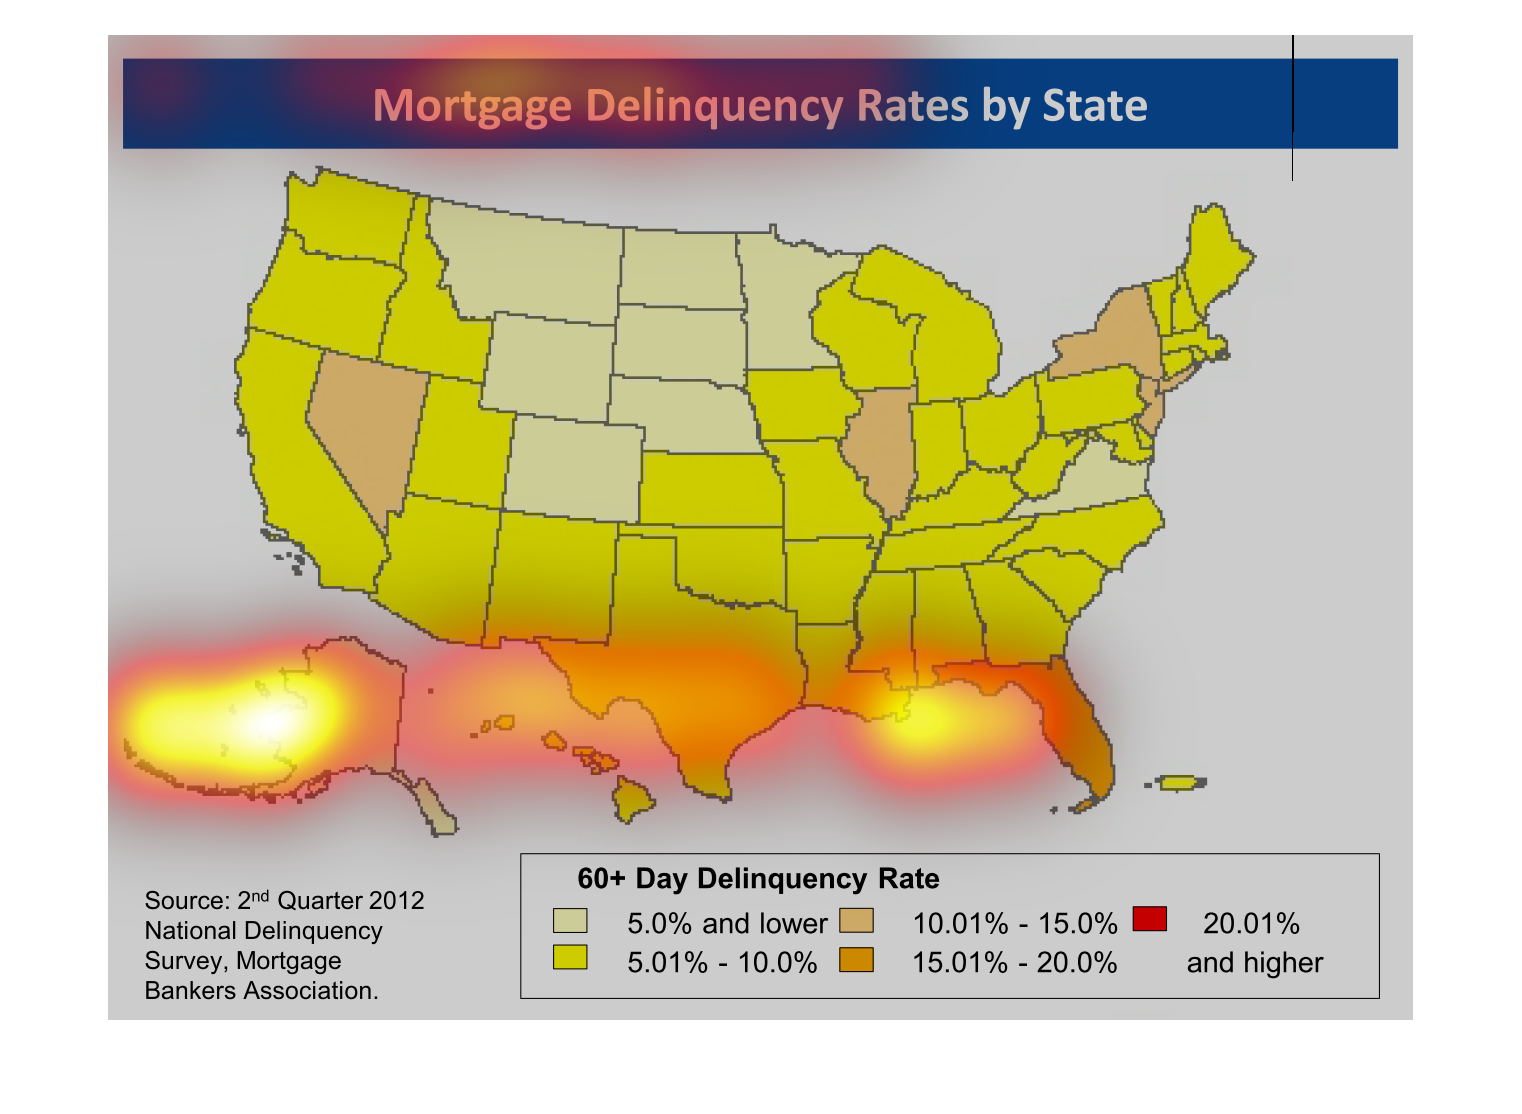
This graph shows "Mortgage Delinquency Rates By State. 60 day delinquency rate.". In the image
shows the United States, and the icons show the percent. Very light yellow indicates 5% or
lower, light yellow indicates 5.01% - 10.0%, Yellow indicates 10.01% -  15.0%, Orange indicates
15.01% - 20.0%, and red indicates 20.01% and higher.
An map infographic showing Mortgage Delinquency Rates by State. It show most states are equal
in a less than 5 to 10 percent delinquency with states like Florida and Nevada as standouts.
This is a chart showing mortgage delinquency rates by state. The chart shows most of the country
has a 60 day delinquency rate at 5 to 10%, and Florida at a much higher 15%.
This image depicts mortgage delinquency rates by state. Light yellow represents low delinquency
rates and red represents high rates. Information is from the second quarter of 2012.
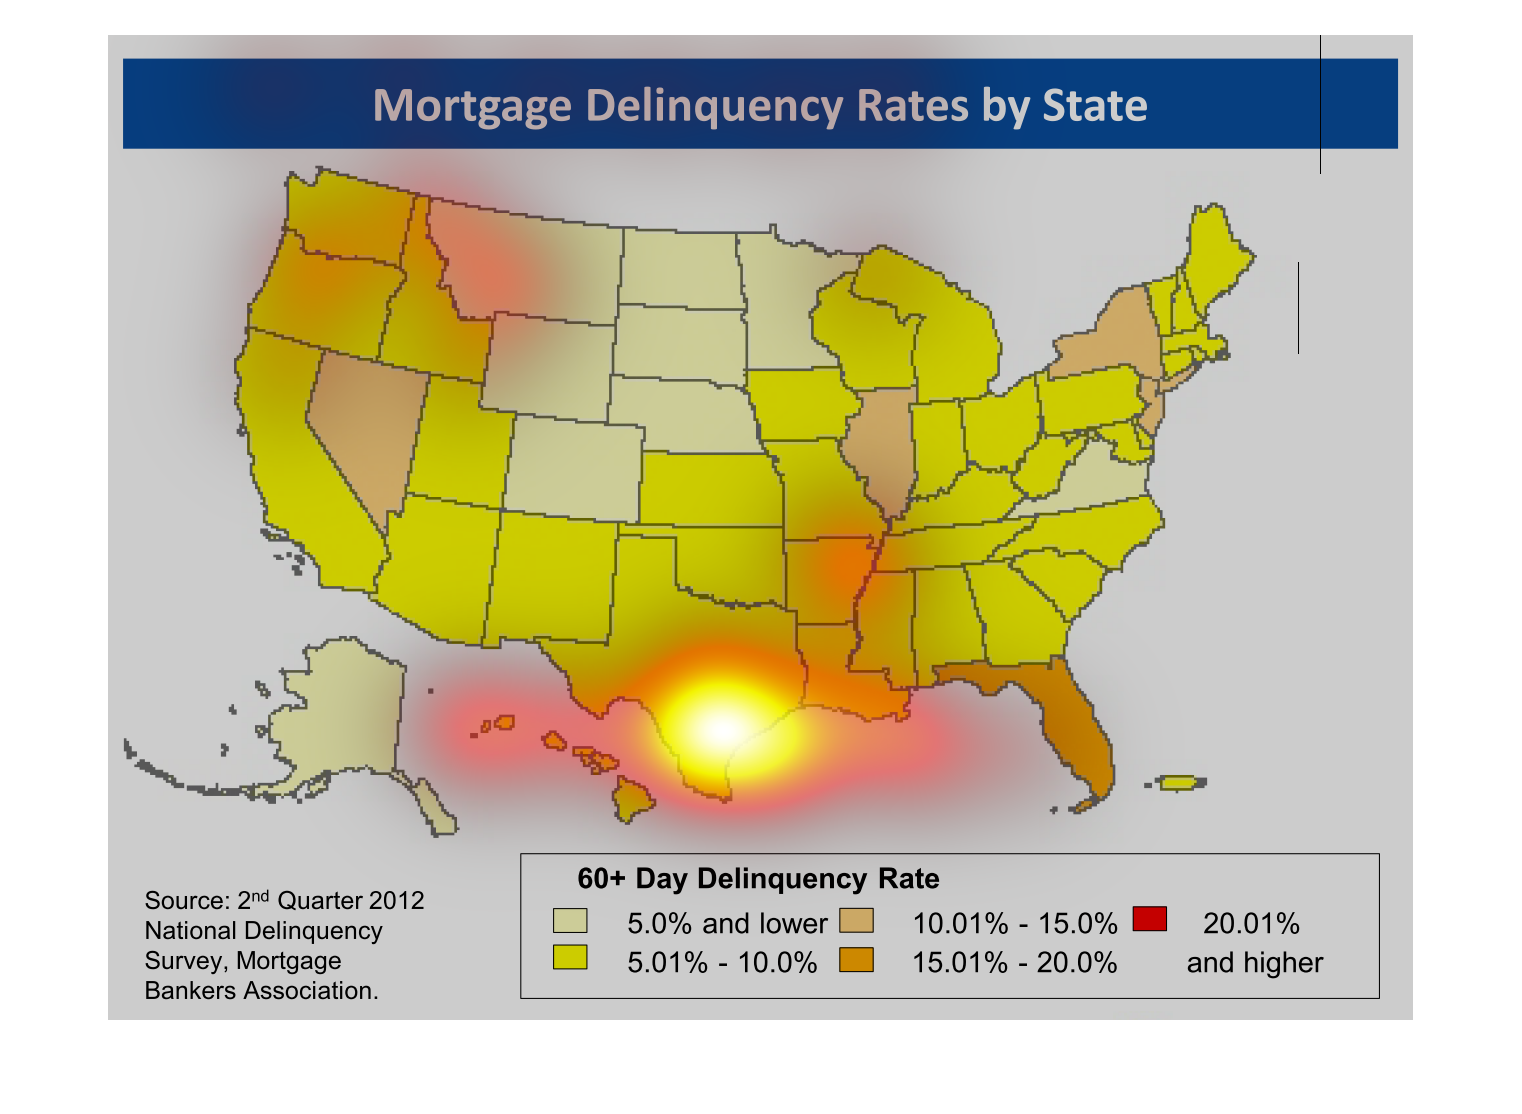
The graph illustrates the national Mortgage debt, state by state. Though the nation as a whole
was mostly even in that regards, we can see clearly that Florida was hit harder than the rest
of the country.
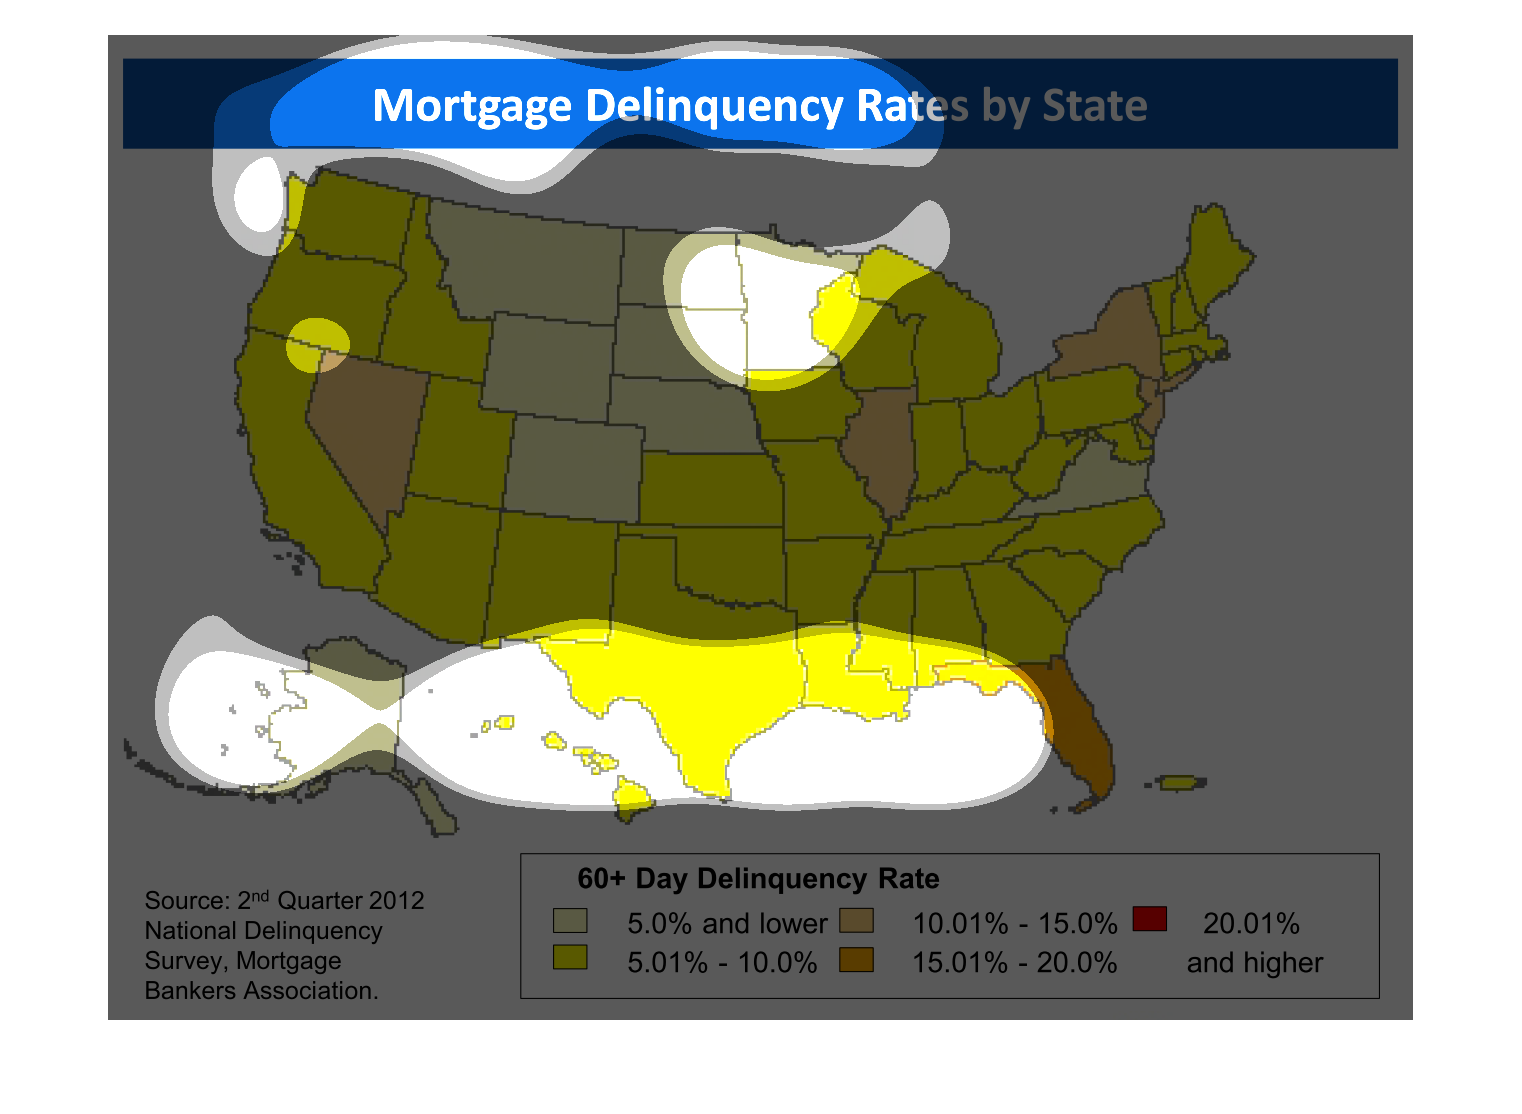
this graph is a map of the unites states of america and the map is yellow the name of this
graph is called mortgage delinquency rates by states. there only a few spots that are orange.