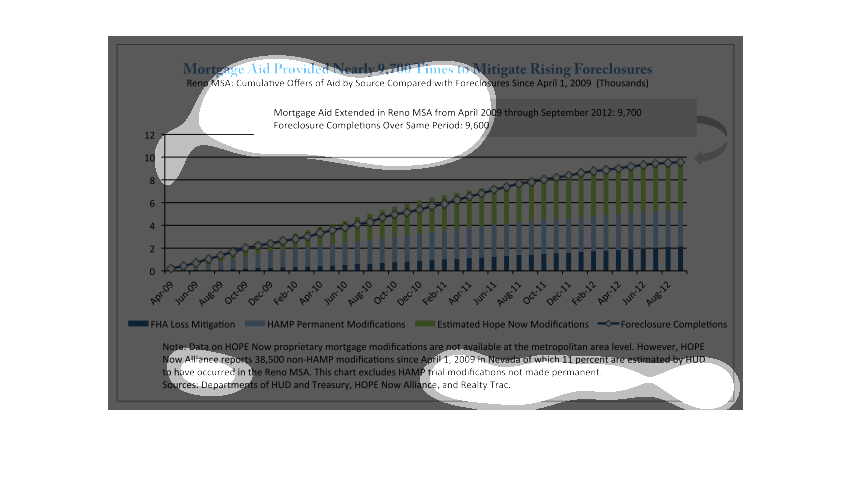
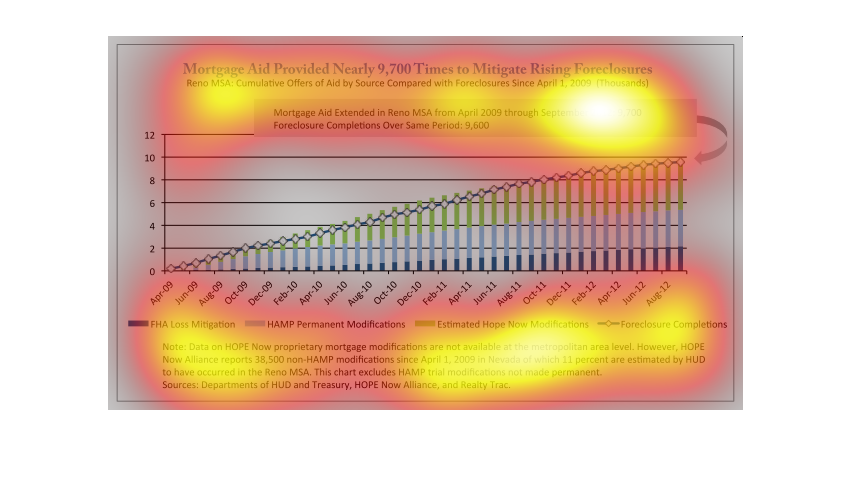
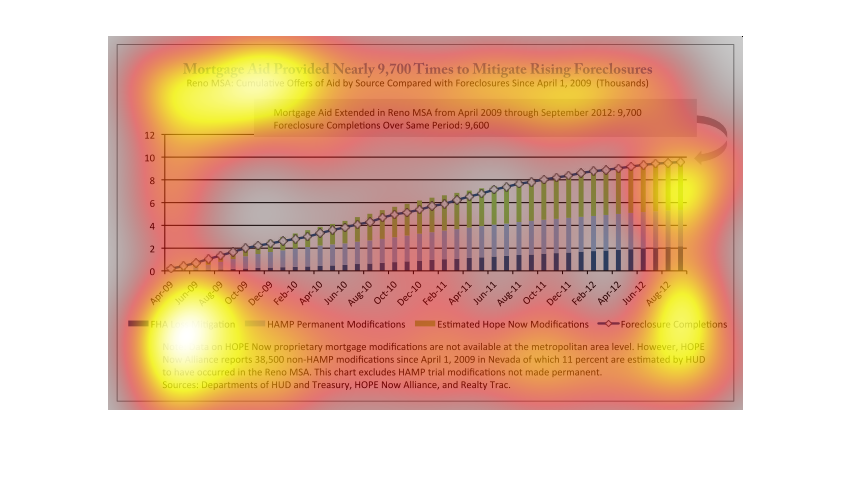
This chart shows the Mortgage Aid provided Nearly 9,700 Times to Migrate rising foreclosures.
The times shown are for April 2009 to August 2012. This chart is very interesting.
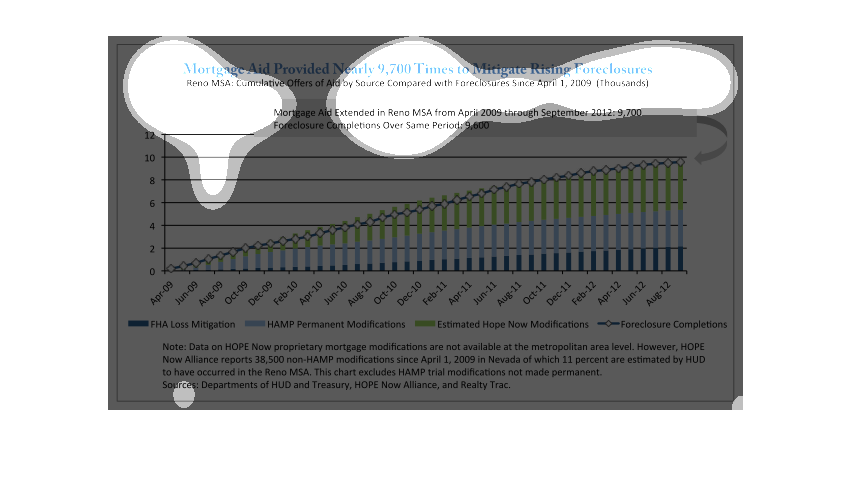
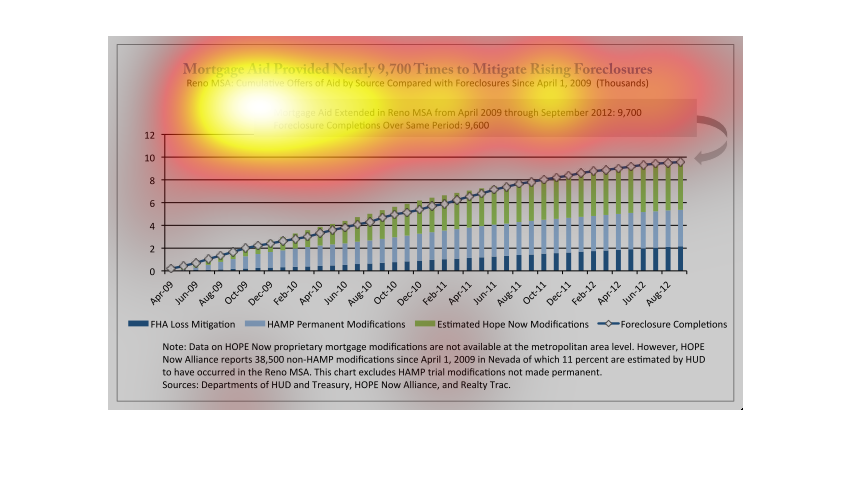
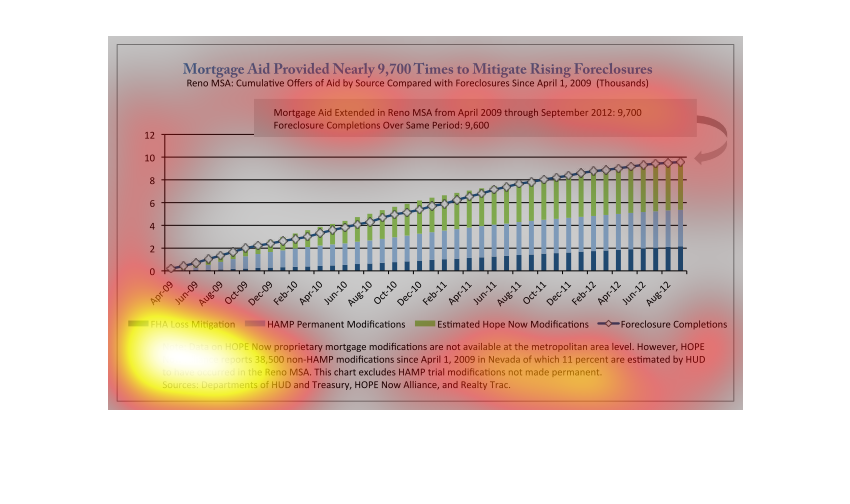
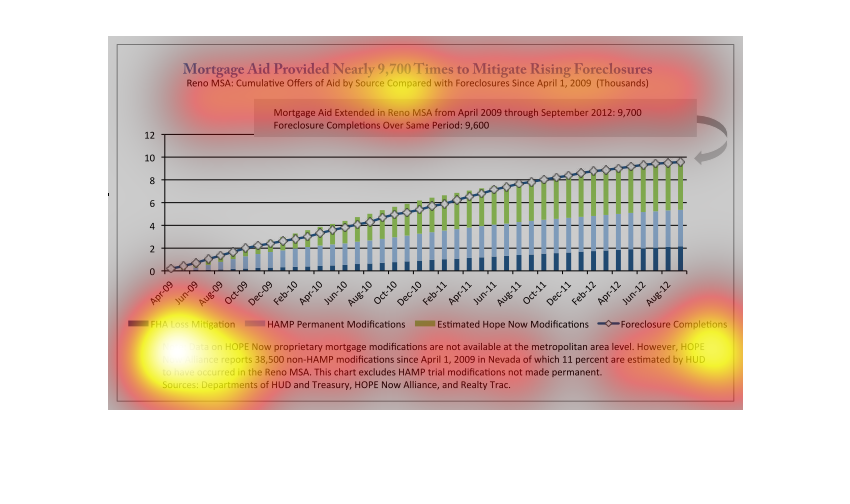
Mortgage aid provided nearly 9,700 times to mitigate rising foreclosure. April 2009 through
September 2012, I see a very steady predictable rise in the graph.
mortgage aide was provided to over 9700 people to prevent mortgage foreclosure of homes. there
loss mitigations loan modifications and foreclosure completions during this time
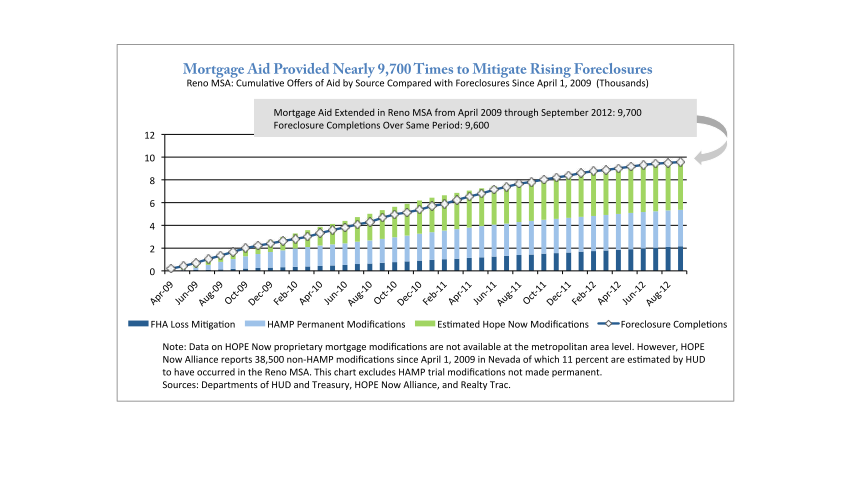
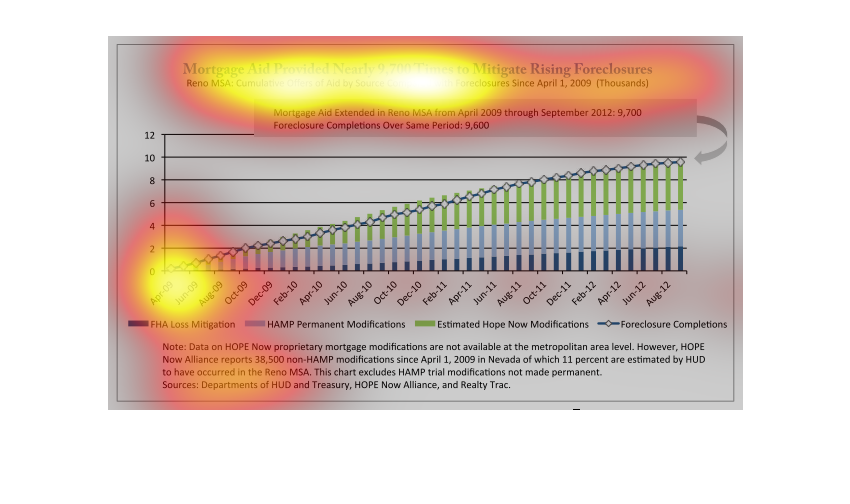
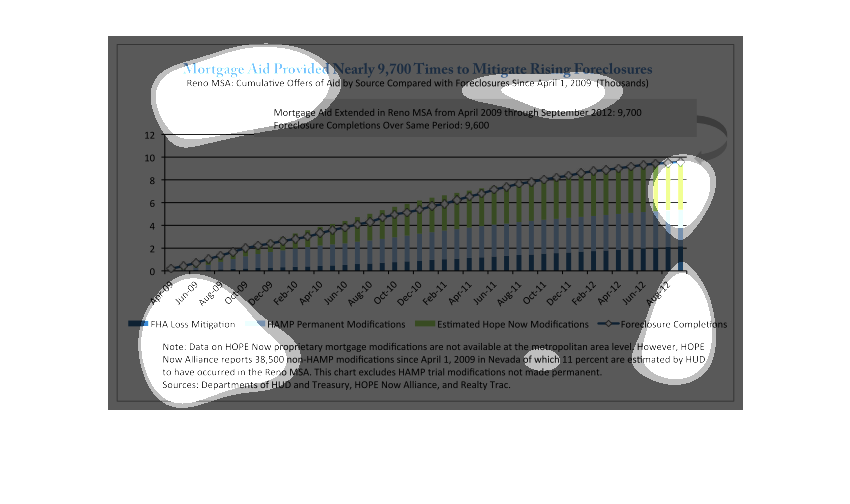
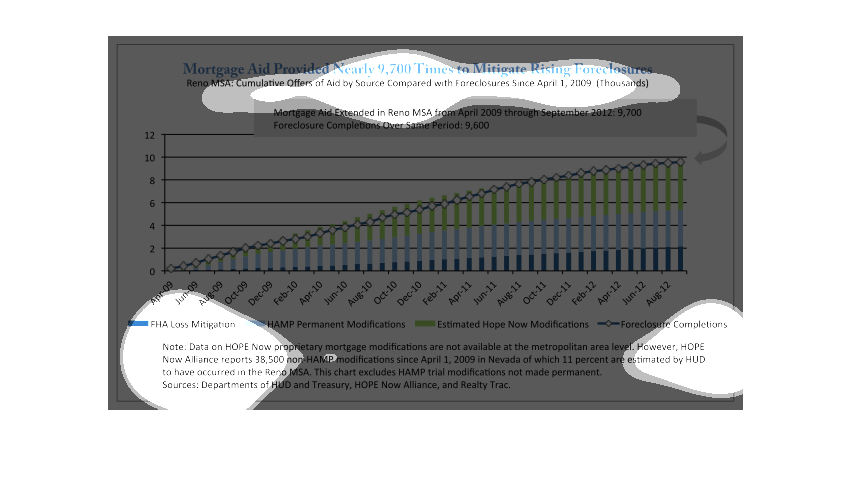
This chart describes that mortgage aid provided nearly 9,700 times to mitigate rising foreclosures.
The chart covers the years 2009 through 2012, and is sourced by the Department of HUD.
This graph shows the gradual rise of mortgage aid at nearly 9,000 times toward the mitigation
of foreclosures since April 1, 2009. This graph also shows the relationship between the FHA
Loss Mitigation, HAMP Permanent Modification, Estimated Hope Now Modifications and Foreclosure
Completions estimated by HUD.

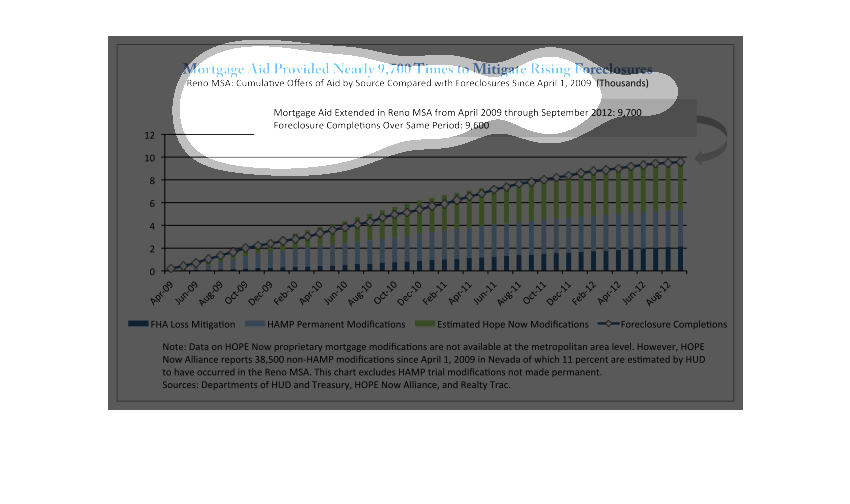
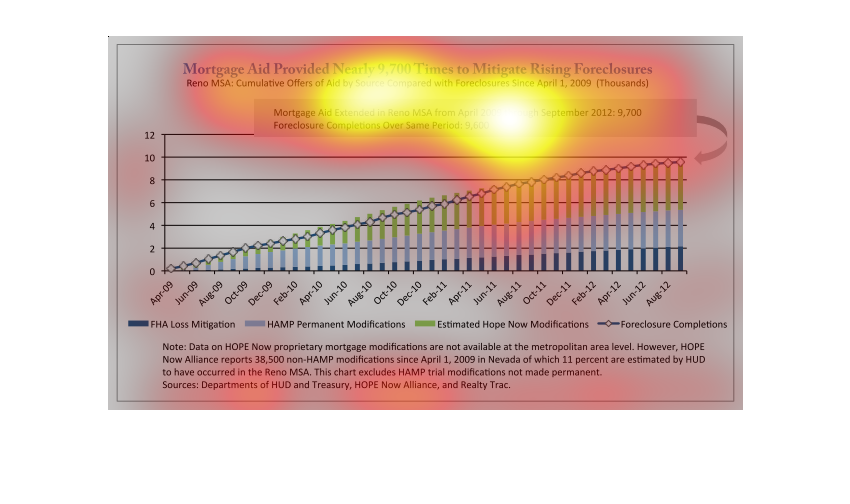
The title of this graph is, 'Mortgage Provided Nearly 9,700 Times to Mitigate Rising Foreclosures'.
 Data for this graph was taken between April 2009- September 2012.
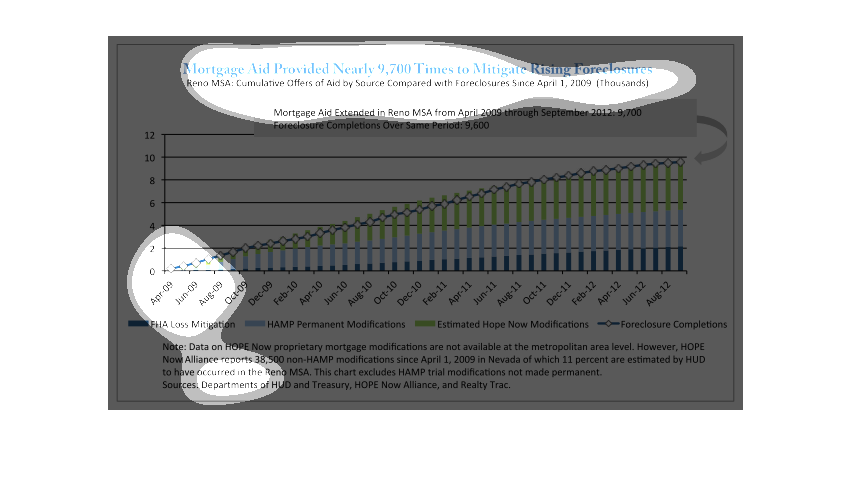
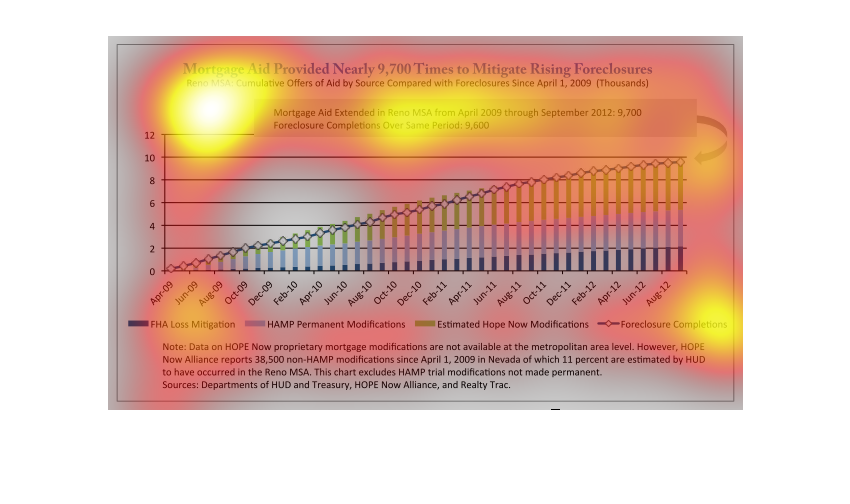
This is about mortgage foreclosure from April 2009 until September 2012. There were a significant
amount of foreclosures during this time, almost 10,000.
This is a moving average of the amount of times mortgage aid was provided to stave off foreclosures
between mid 2009 and mid 2012. Foreclosures have risen steadily since then, despite mortgage
aid.
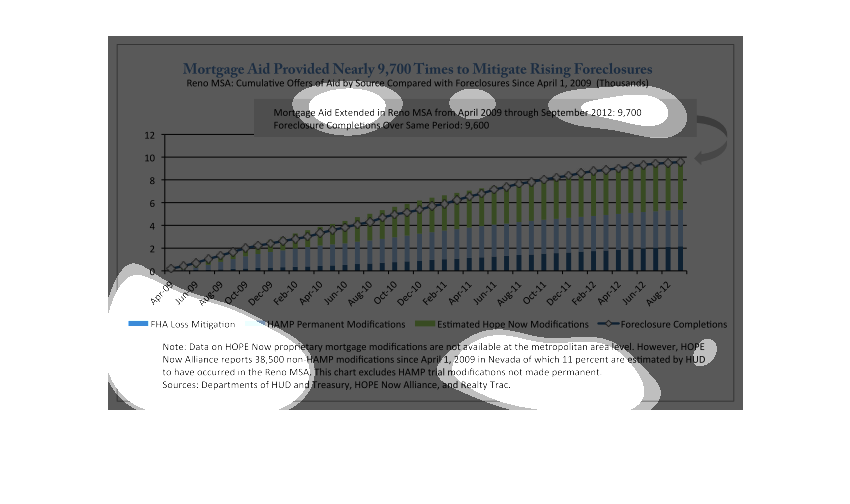
This is a chart of mortgage aid to mitigate rising foreclosures. From April of 2009 to August
2012 for four different types of aid organizations with the largest being the Estimated New
Hope Modifications.
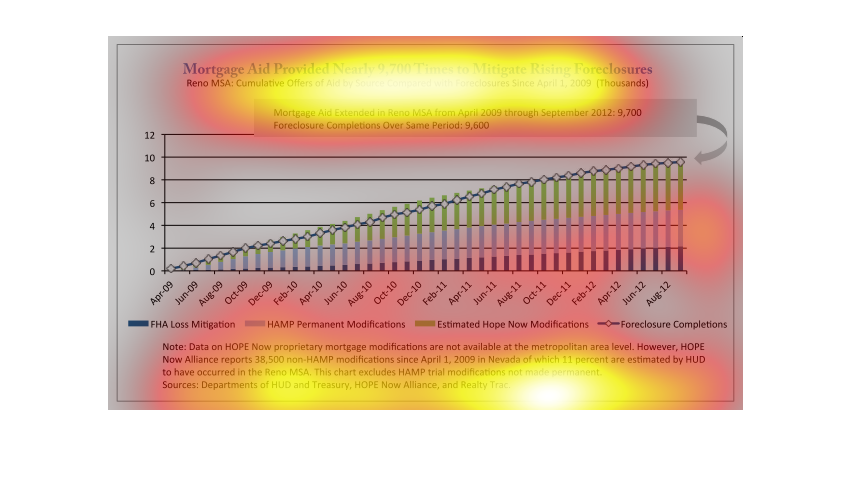
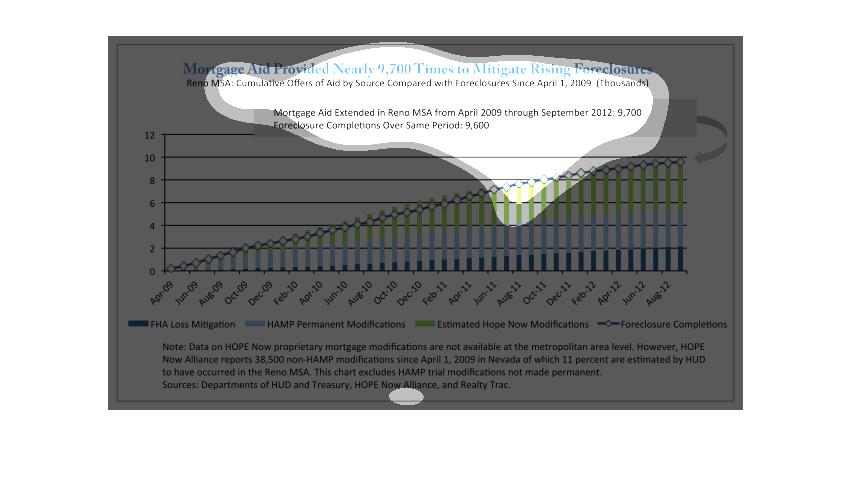
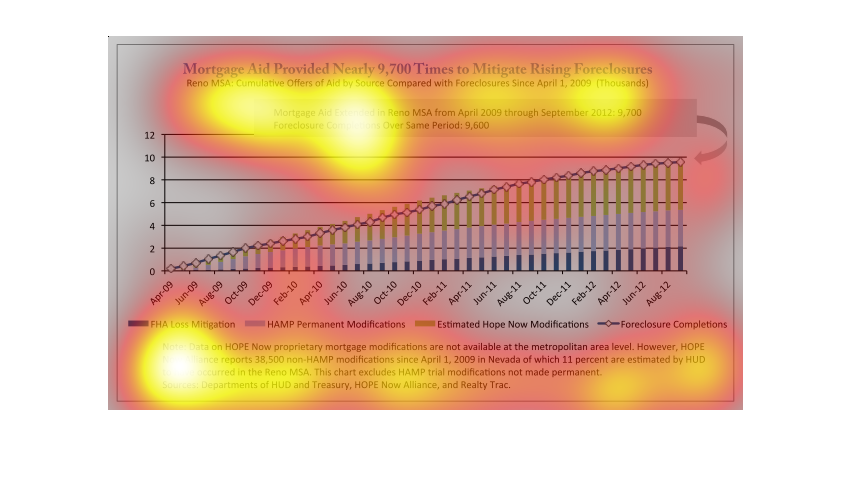
This chart describes mortgage aid provided in response to foreclosures. Since April 2009 to
August 2012, estimated Hope Now Modifications have risen more than other categories of aid.
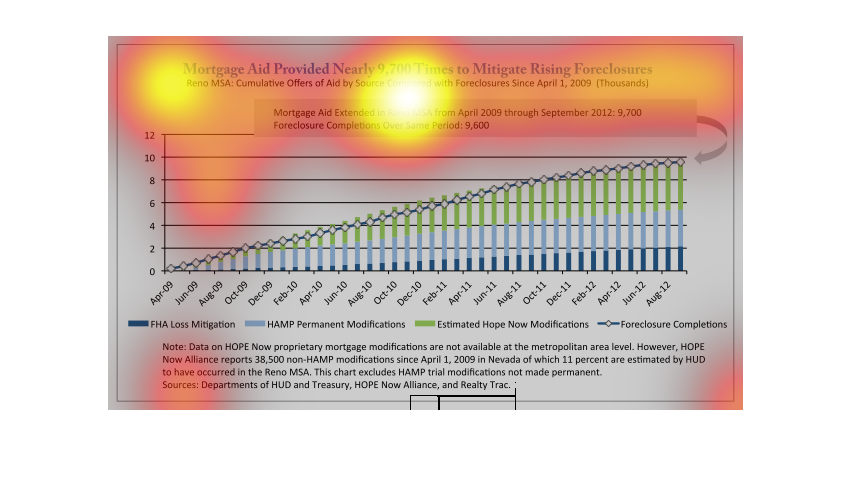
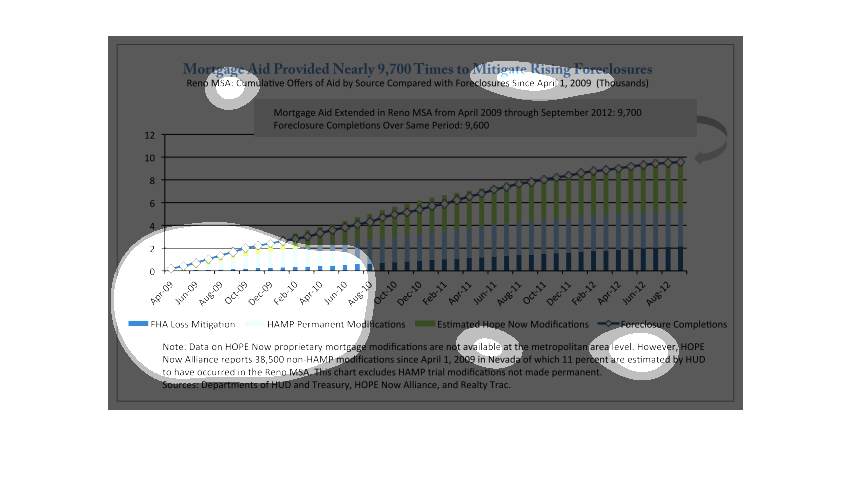
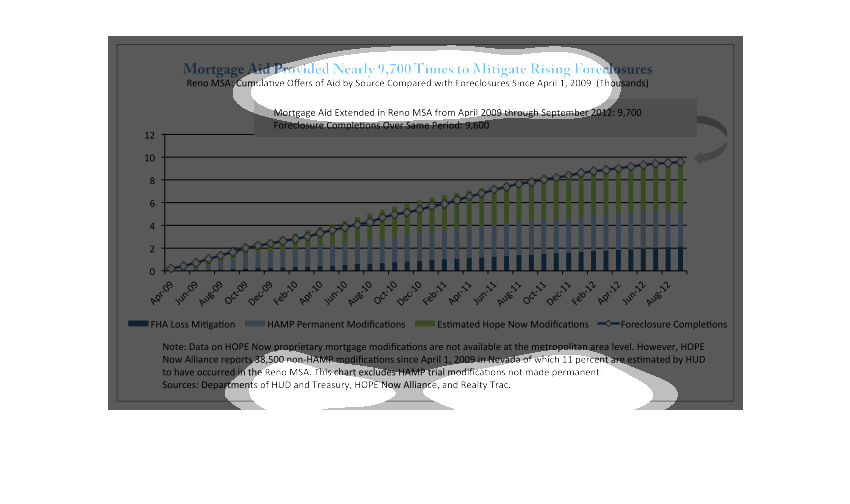
THIS GRAPH SHOWS THE AMOUNT OF ASSISTANCE PROVIDED TO HOMEOWNERS FOR MORTGAGE PAYMENT. THE
DIFFERENT BARS REPRESENT DIFFERENT MONTHS BETWEEN APR 2009 AND AUGUST 2012. OVERALL, THE AMOUNT
OF ASSISTANCE HAS BEEN INCREASING.
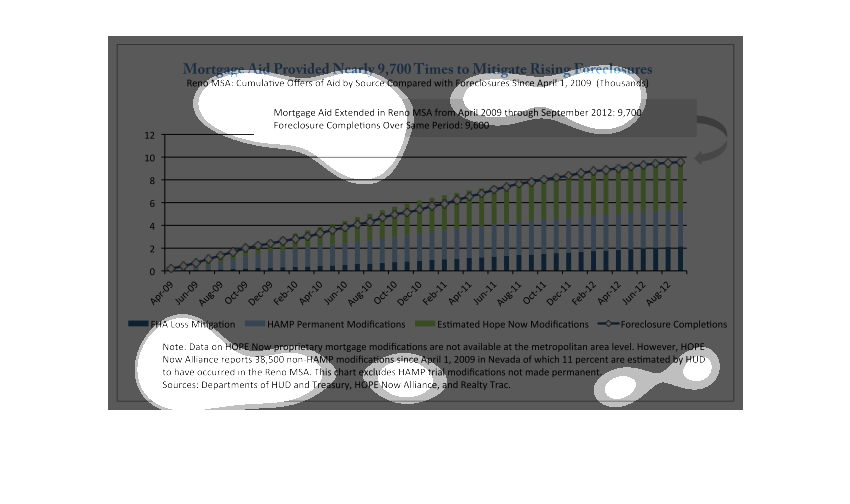
This graph displays mortgage aid provided to mitigate rising foreclosures.  It shows a period
from 2009 to 2012 and an increase in loss mitigation and foreclosure completions over time.
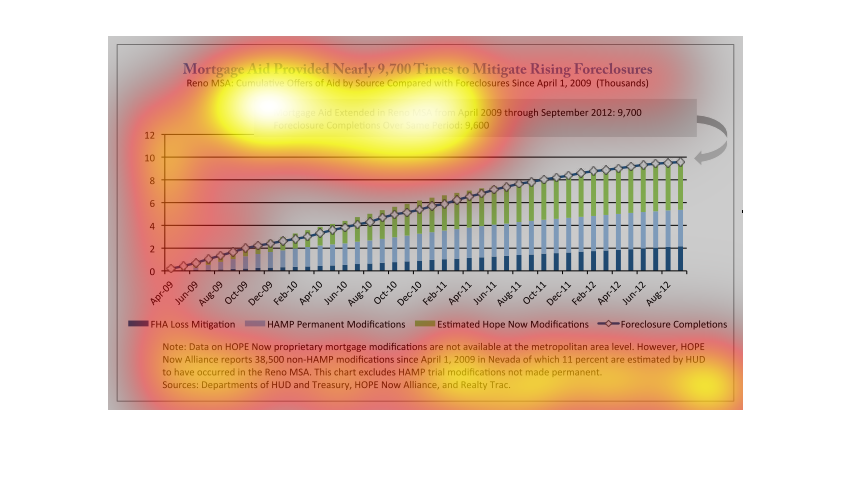
This graph shows the amount of mortgage given to homeowners in order to avoid foreclosures.
The amount has grown from 2009 to 2012 as the graph shows.
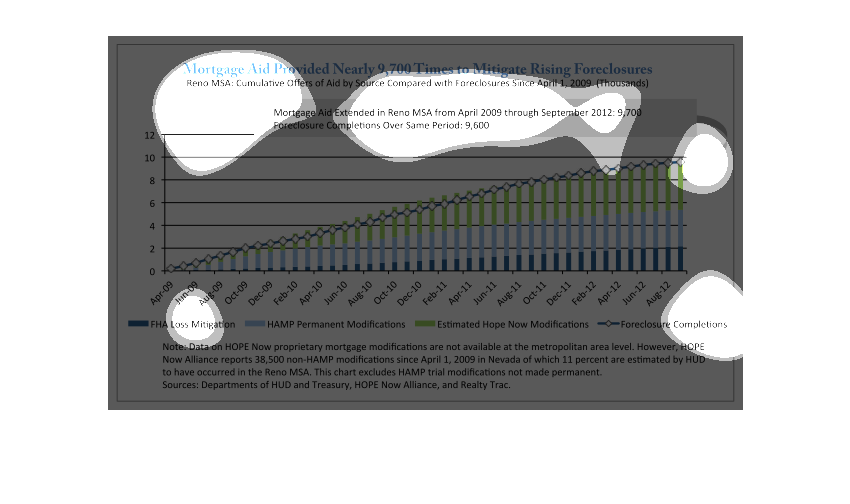
This is a graph depicting how mortgage aid was provided nearly 9700 in order to mitigate rising
foreclosures following the financial crises in Reno, NV.