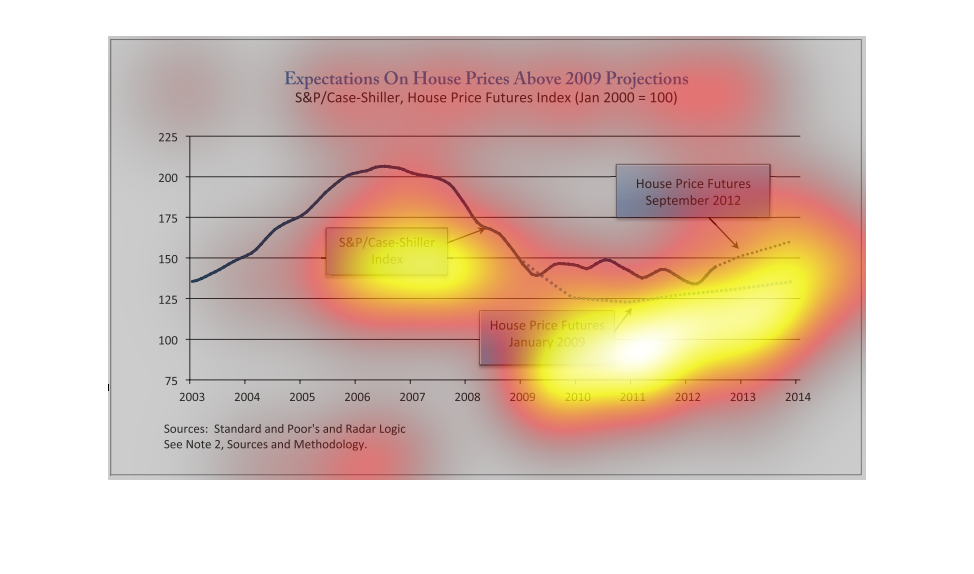
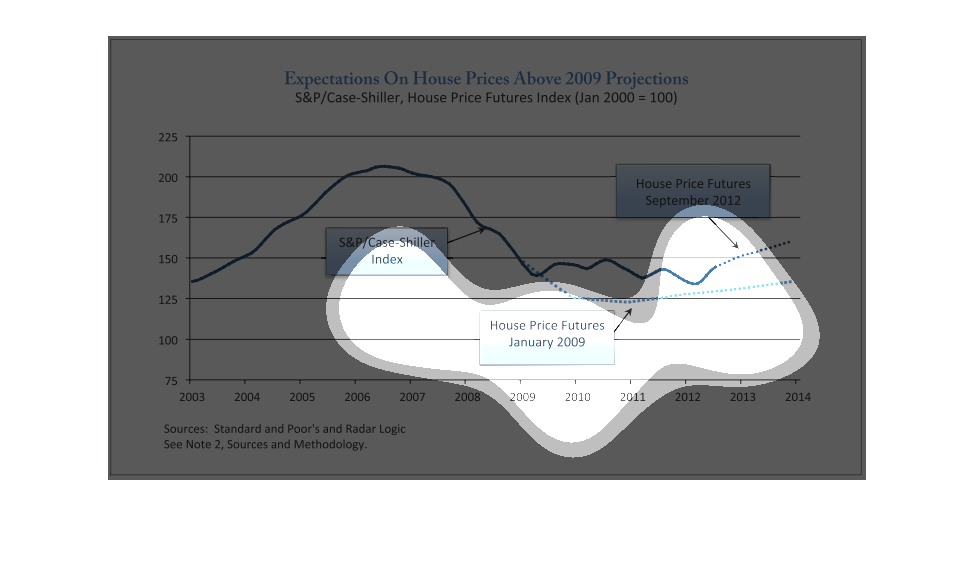
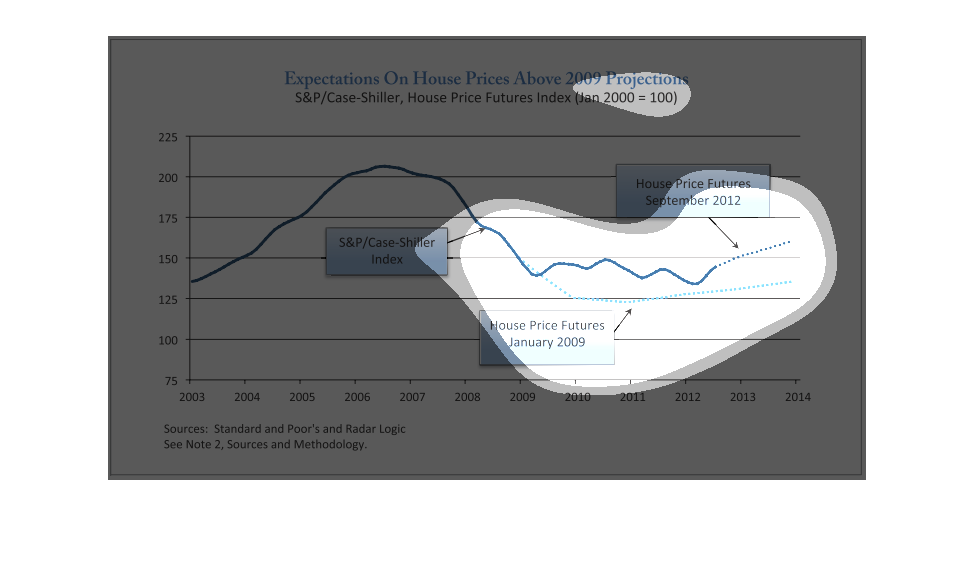
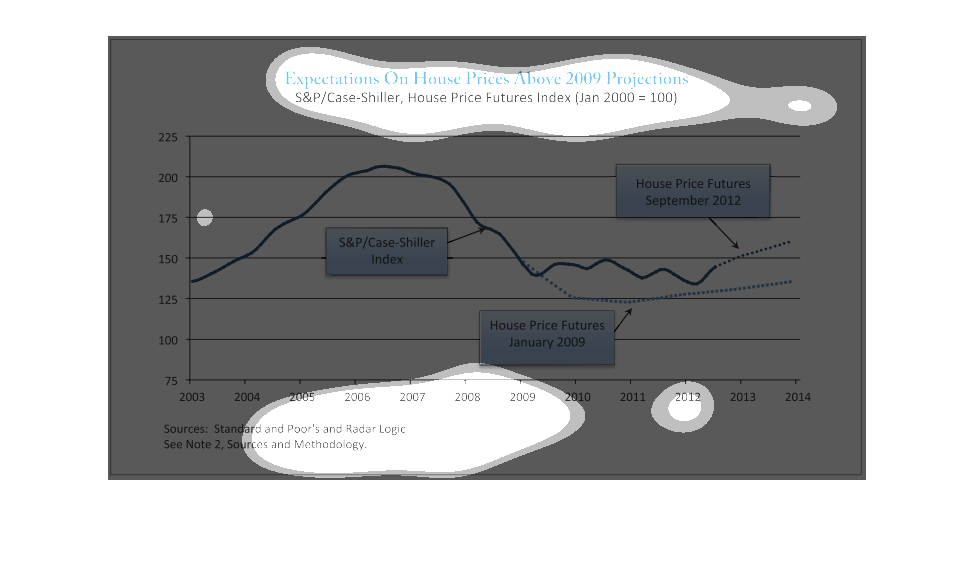
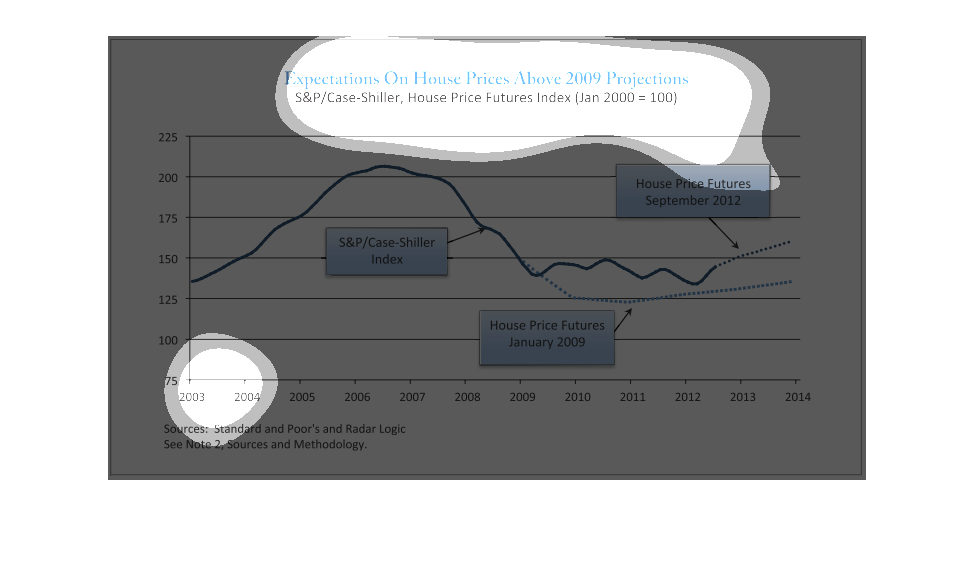
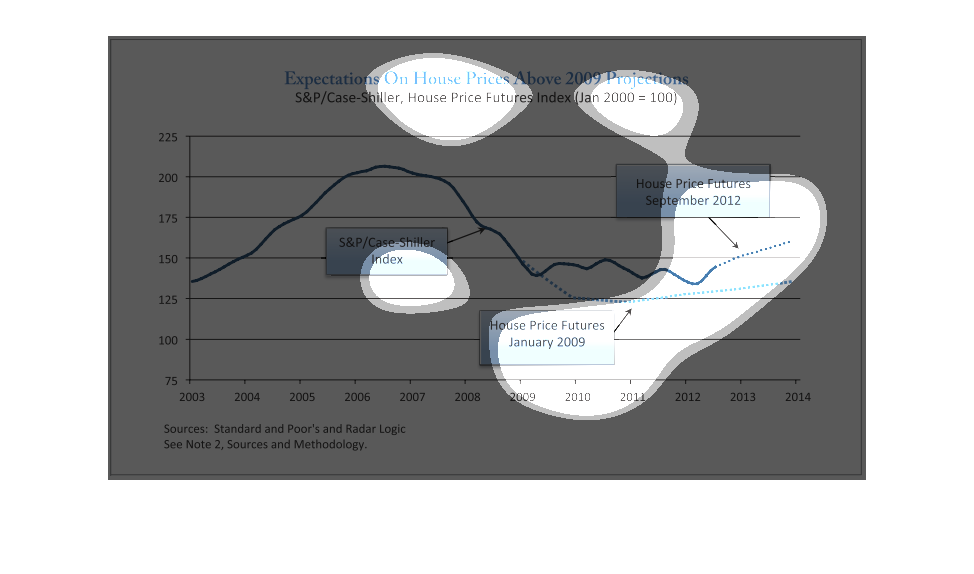
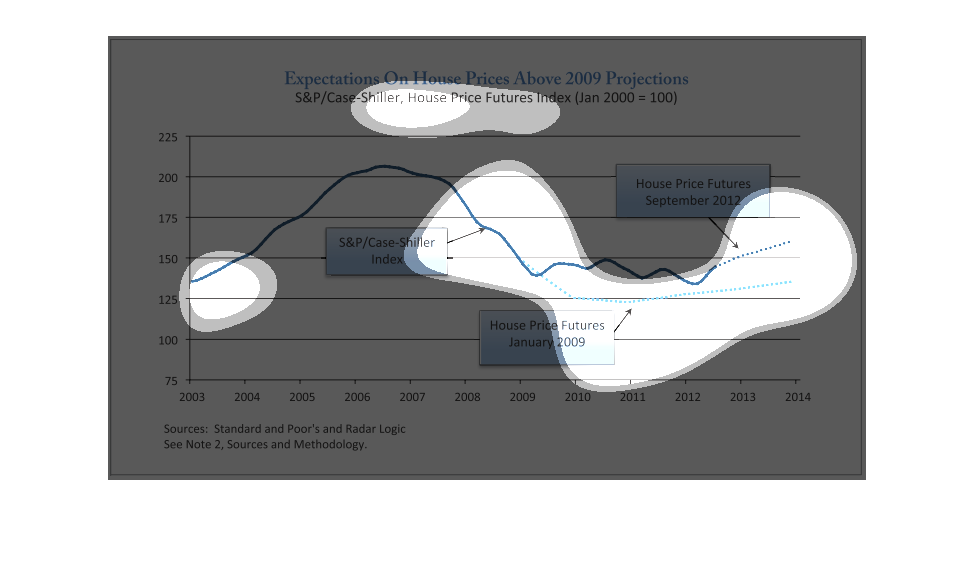
This graph displays expectations on housing prices above 2009 projections.  It displays the
years from 2003 to 2013 for the S&P Index, house price futures in 2009, and house price futures
in 2012.


The charts shows the Expectation on house price above 2009 projections. The chart showed that
the house price  futures in 2009 declined and split off until 2012. The house price futures
in September 2012 soon increased.
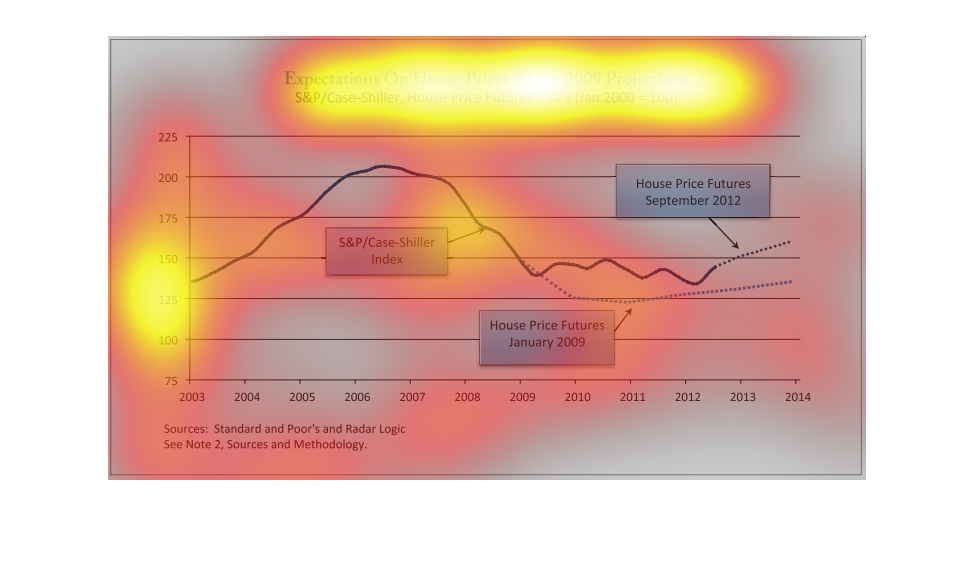
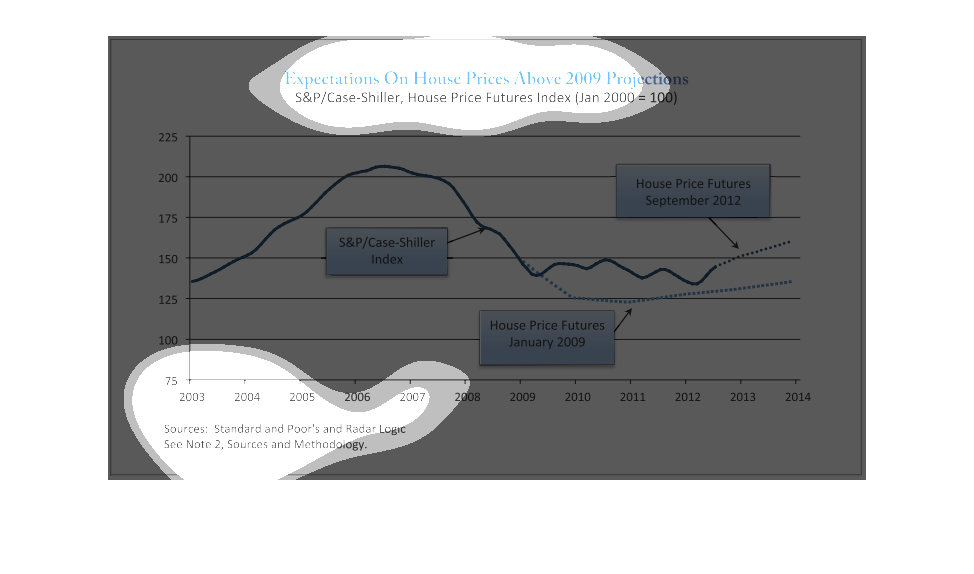
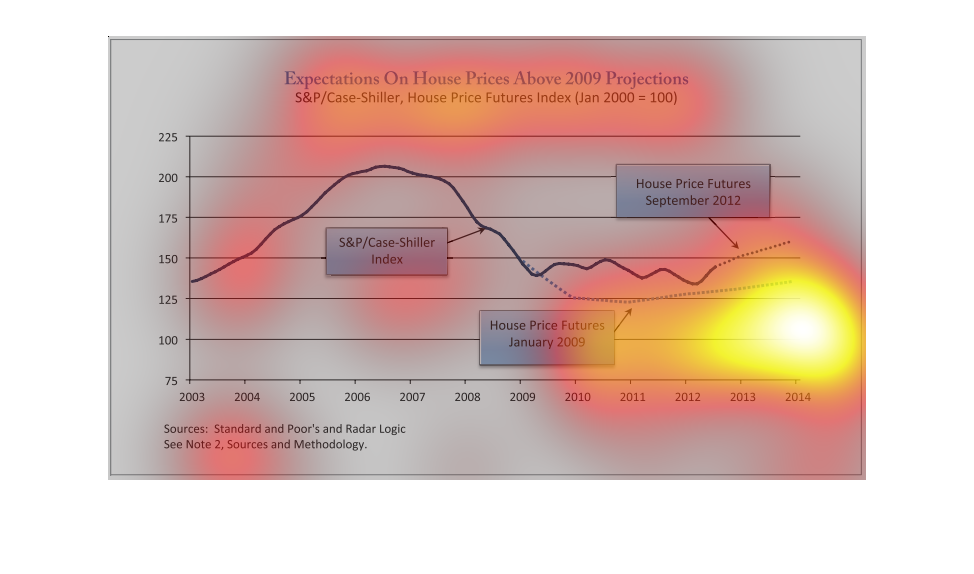
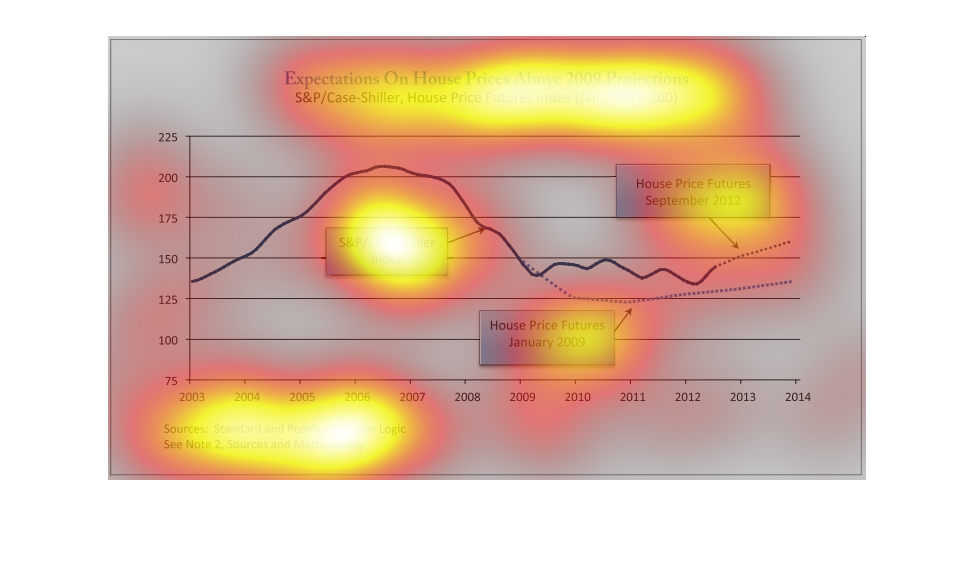
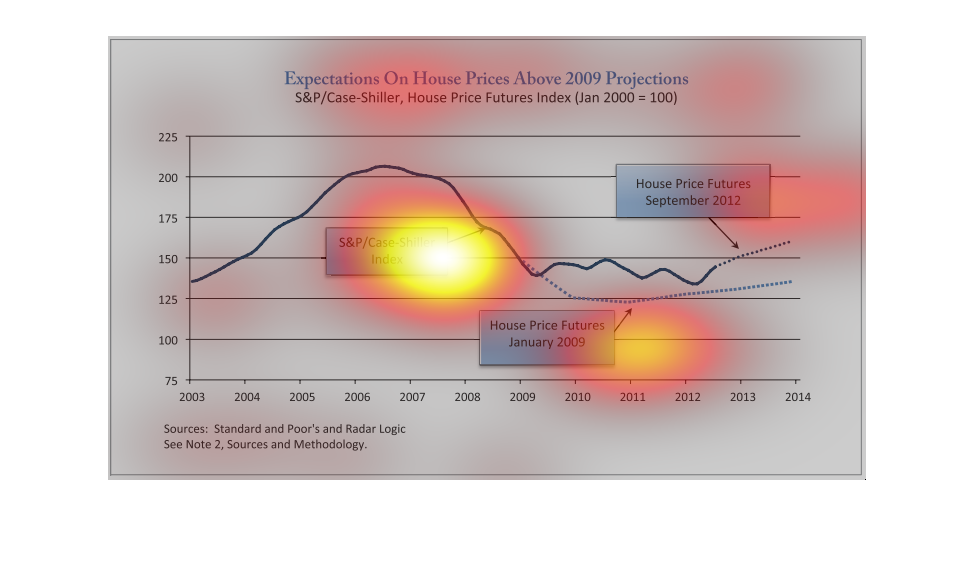
This is a chart showing house prices after 2009 projections from 2003 to 2013. the chart shows
the house prices rising around 2007 then dropping in 09 before rising again.
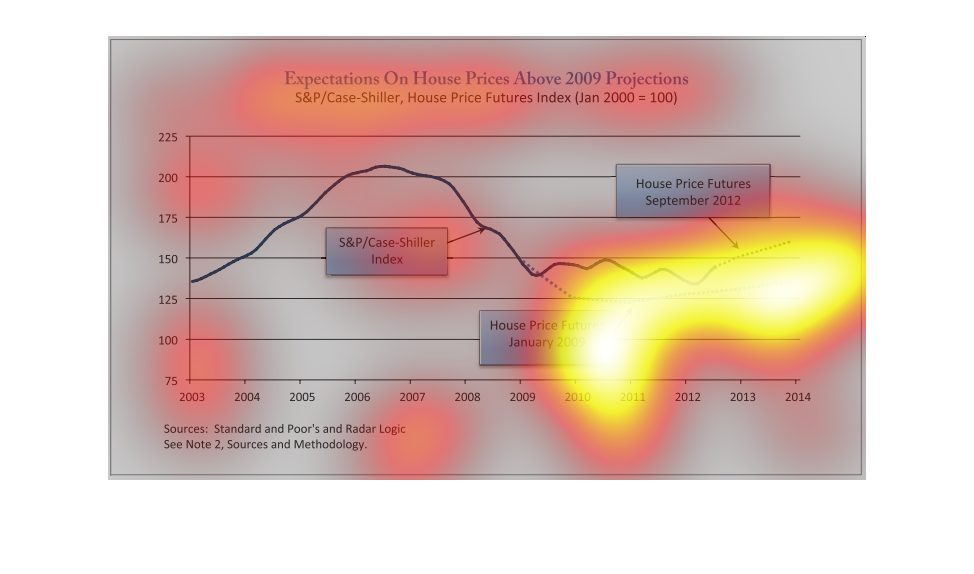
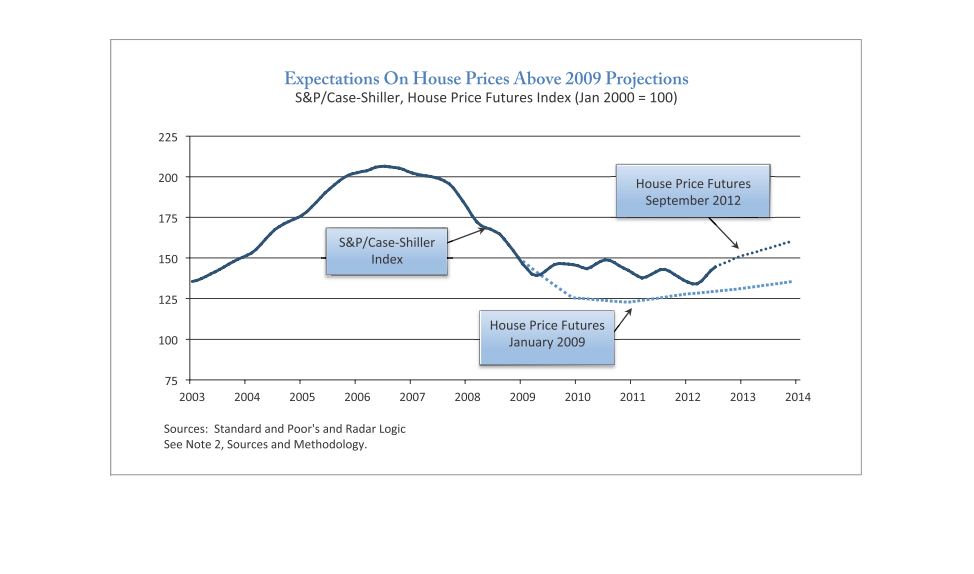
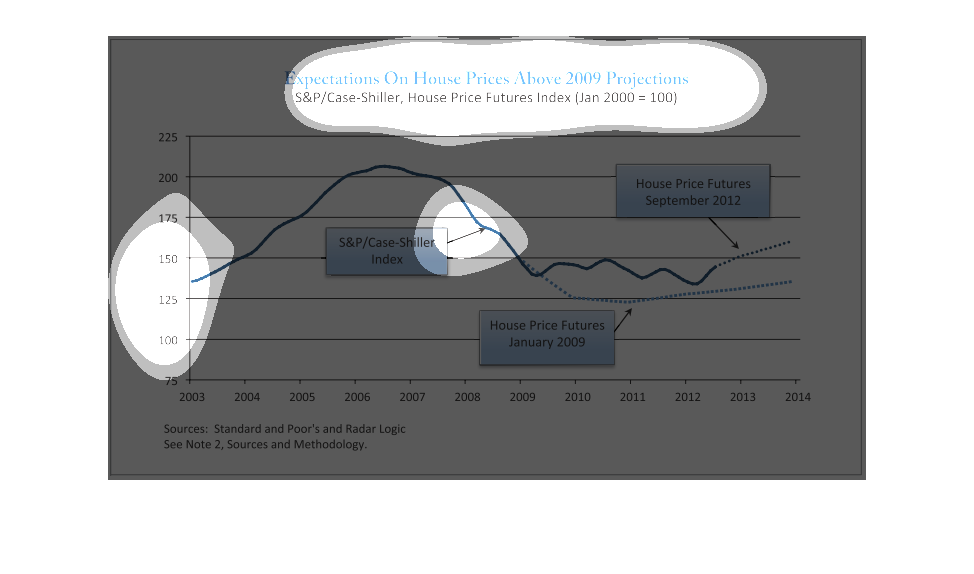
This graph is detailing how house prices are expected to change according to 2009 projections.
House price futures in January 2009 are expected to dip below 125. However, house price futures
in September 2012 are expected to exceed 150.
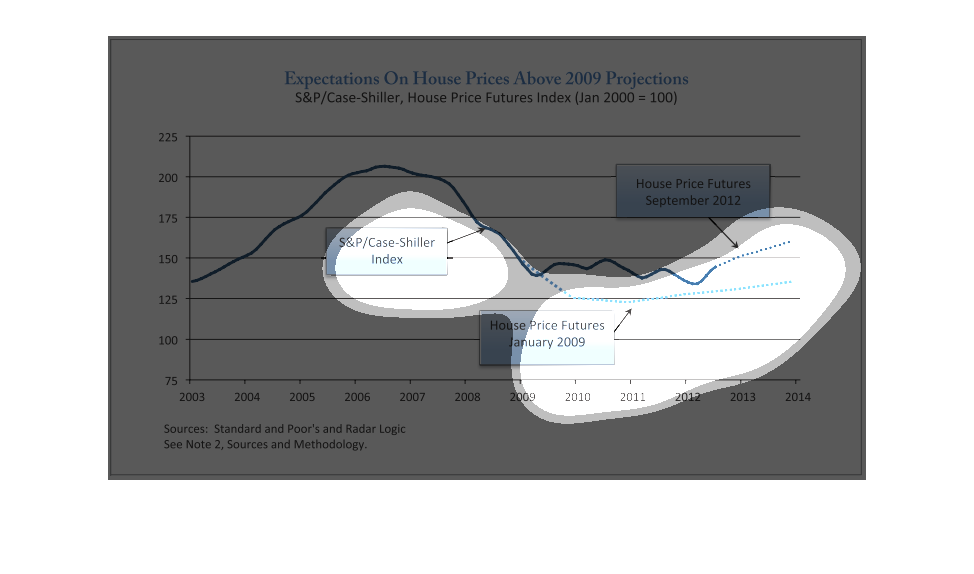
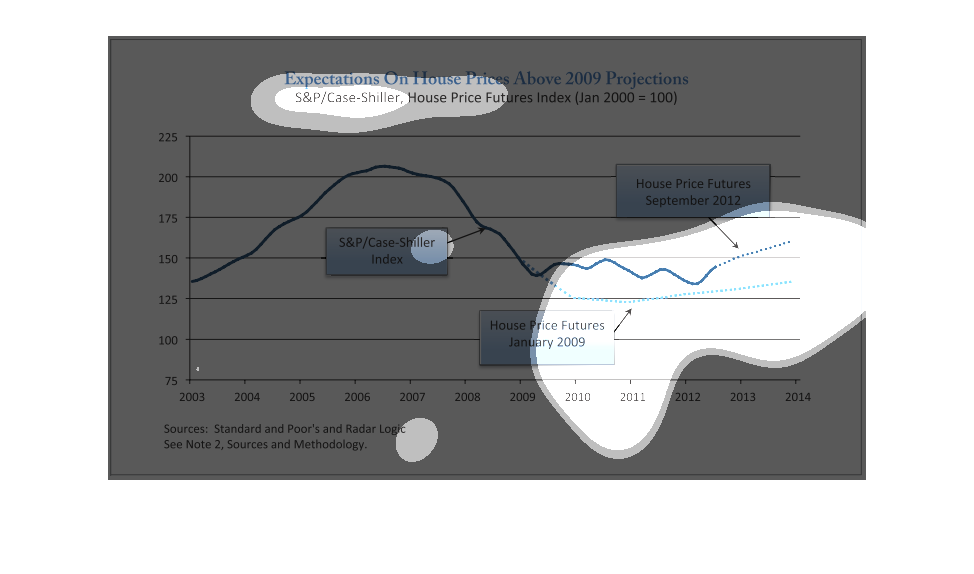
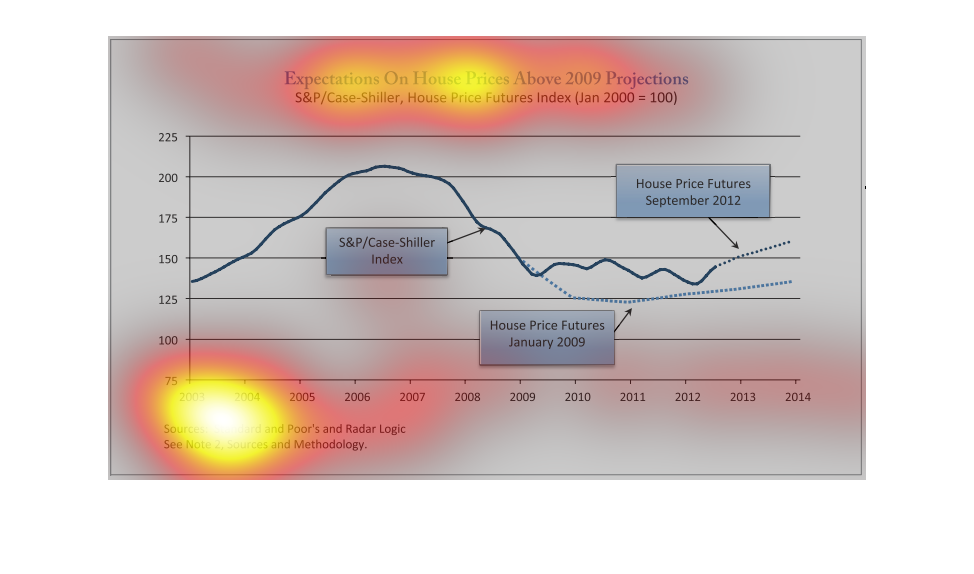
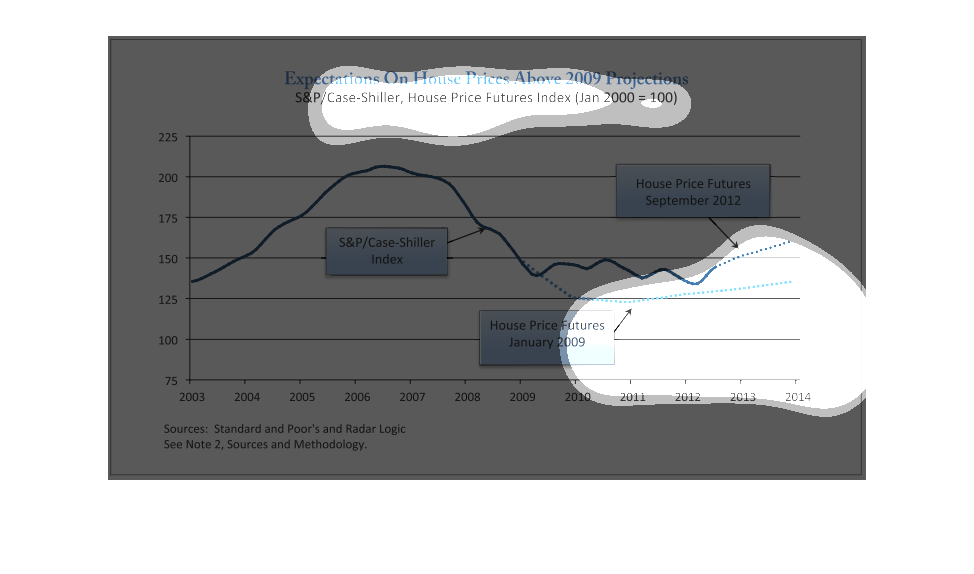
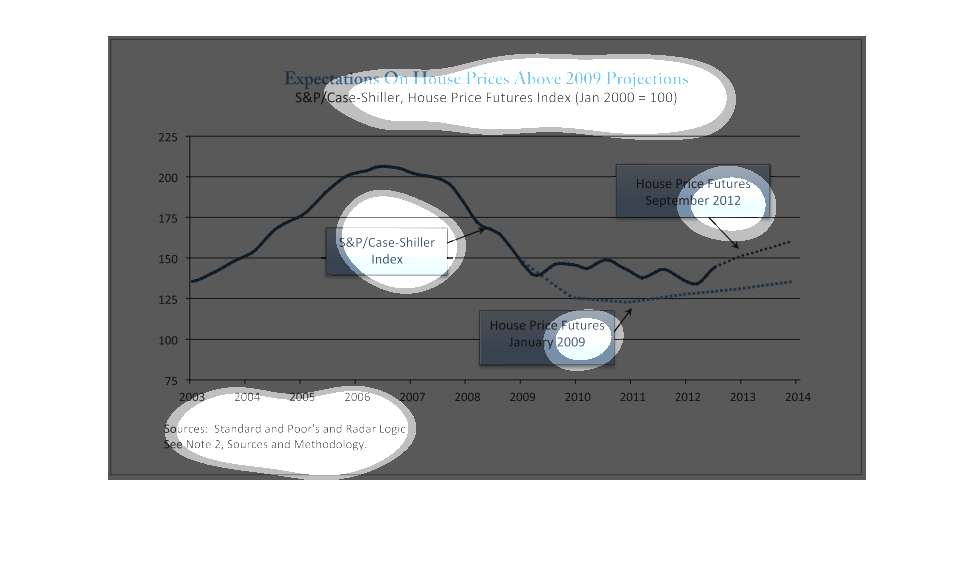
The graph shows how the expectation of house prices was above the 2009 projections.  The graph
overlays the projection, and actual values, and includes estimates of the future value.
This graph seems to be a description on the expectations of house prices for the expected
year of 2009 projections. the hear of 2005 seems to have the most
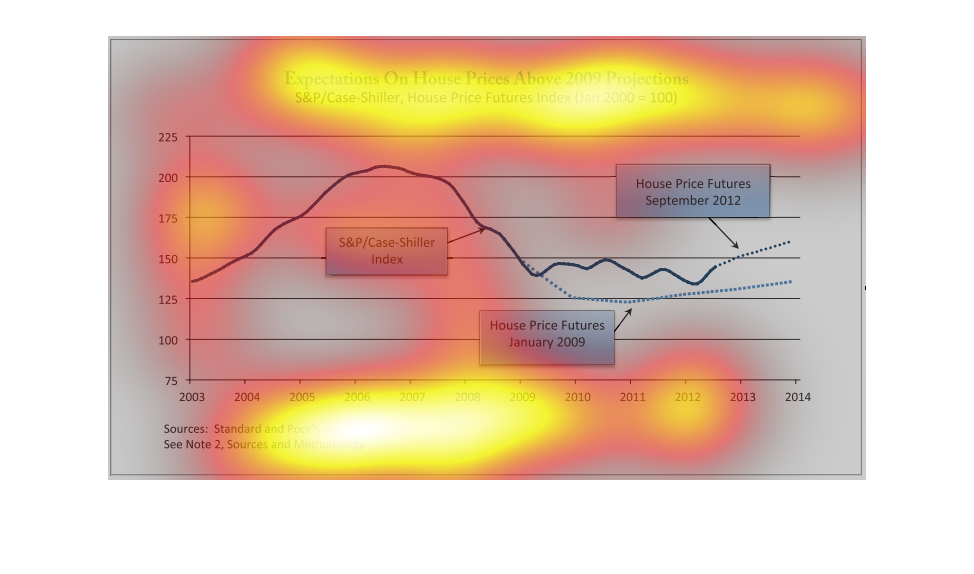
This chart describes expectations on house prices above 2009 projections. The chart covers
the years 2003 through the year 2014. The chart is source4d by Standard and Poor's and Radar
Logic.
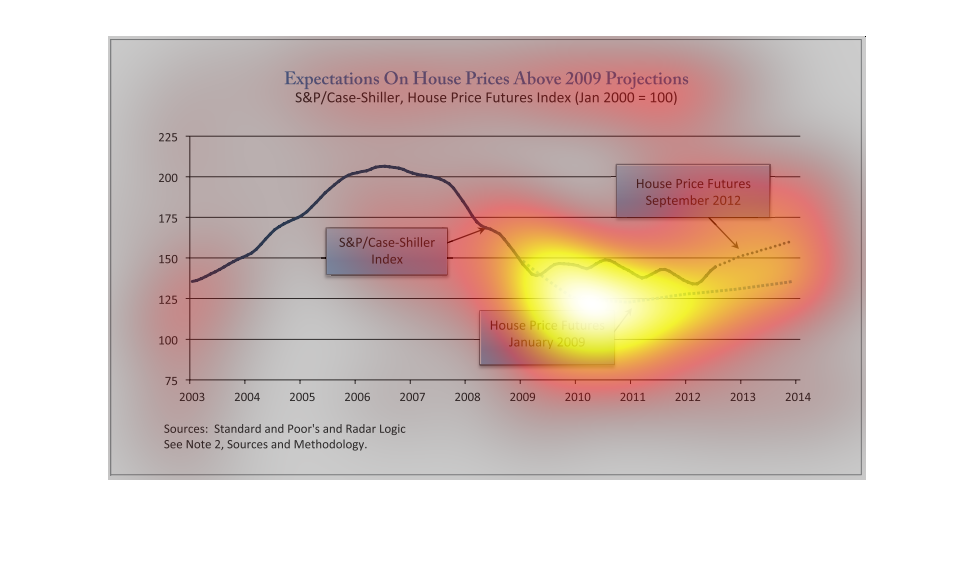
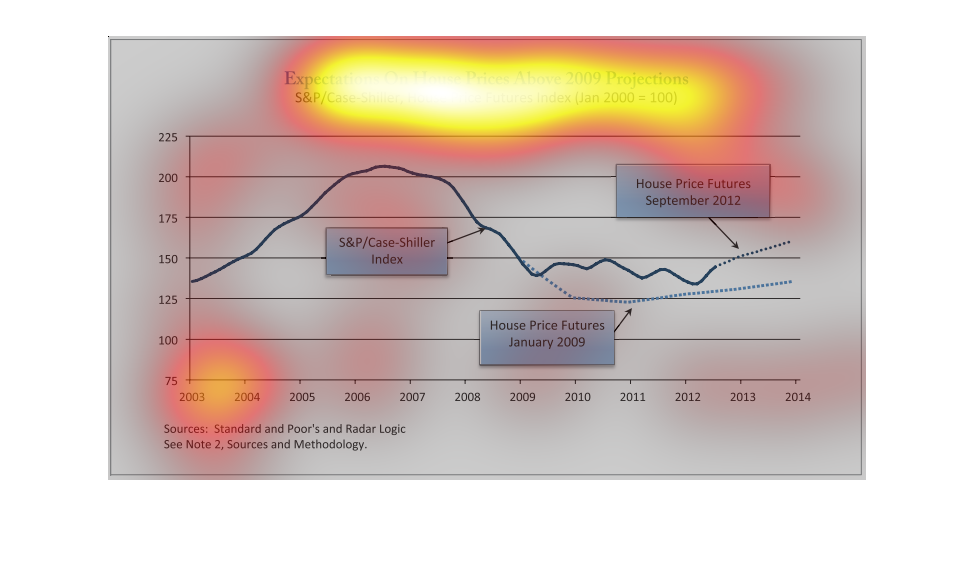
This image shows or depicts in line graph and word formats expectations on house prices above
2009 projections. The years forecasted are from 2003 to 2014.
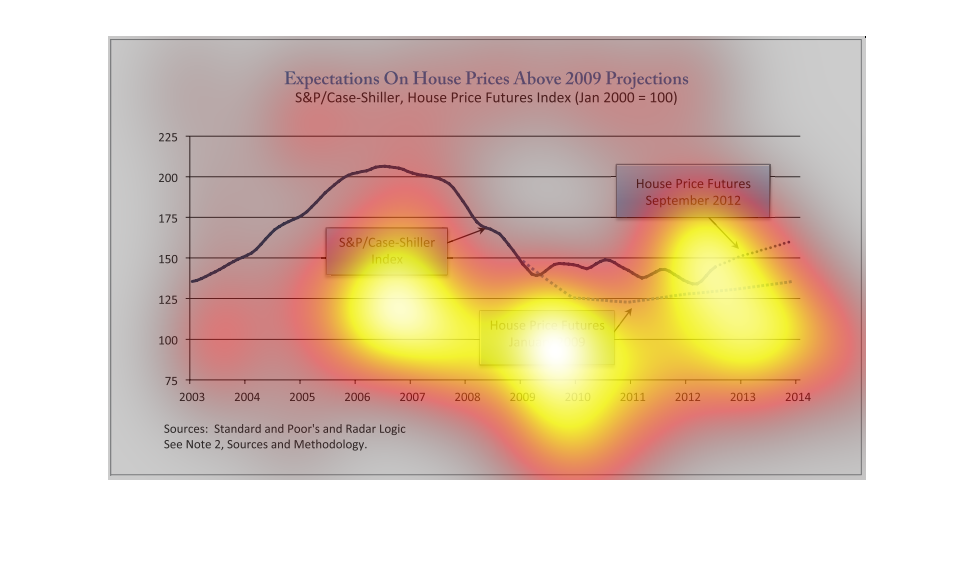
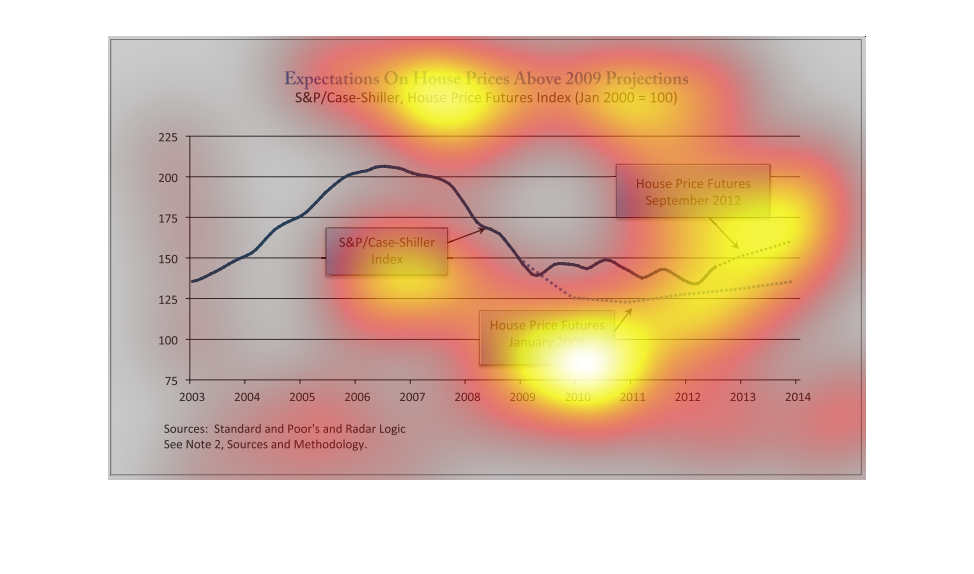
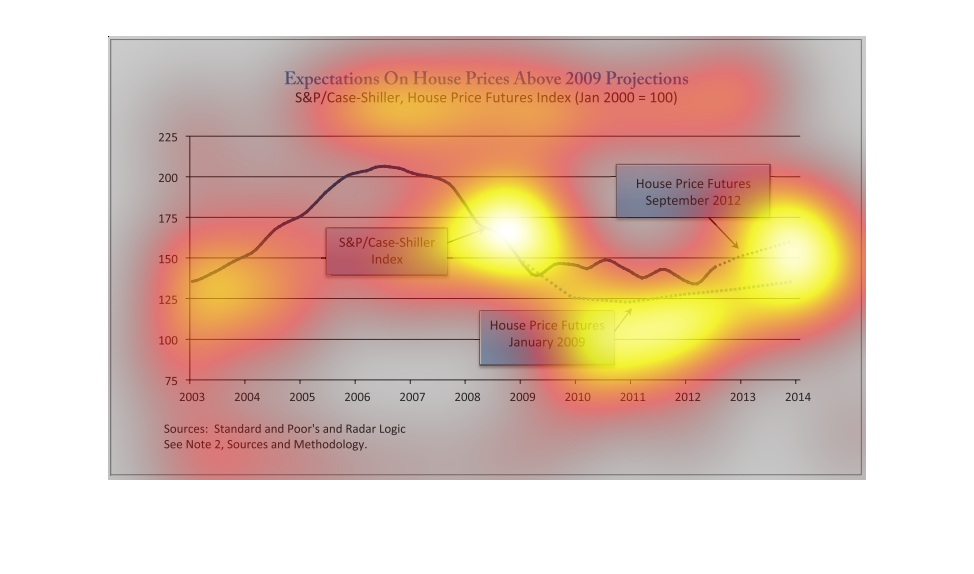
THIS GRAPH SHOWS THE HOUSE PRICE FUTURES PREDICTIONS AT VARIOUS POINTS IN TIME VERSUS THE
REAL DATA FOR YEARS SINCE 2003. DEPENDING ON WHEN THE PREDICTION WAS MADE, THOSE PREDICTIONS
WERE DIFFERENT.
This graph depicts the projected housing prices vs. 2009 price expectations.  The chart shows
that housing prices, as measured by the S&P Case Shiller Index, have exceeded 2009 expectations.
This is the expectations on house prices above 2009 projections compared to house price futures
and  S&P / Case Shiller index based on Standard and Poor's and Radar Logic.
This line graph compares housing price projections made by S&P/Case-Shiller (S&P/CS) and the
House Price Futures Index (HPFI) from 2003 to 2014. Their projections are equal until about
2008, when HPFI projection sharply decreases below S&/PCS by nearly $25,000. From 2008-2014
the HPFI projection remains lower than but trends upward with the S&P/CS.
expectations on house prices, 2009 projections, house price projections to 2012 from 2009,
sp case schiller index. I really don't understand this graph at all
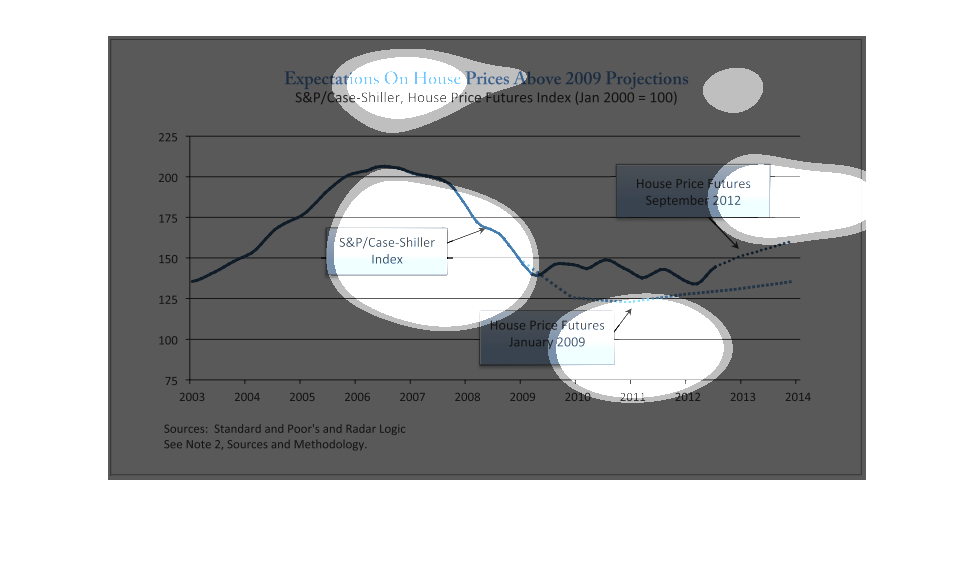
The image is a chart of projected housing prices using the S&P case shiller index and the
actual house price futures.  After topping out in 2006, housing prices were in steady decline
until 2012, when they appeared to bottom.