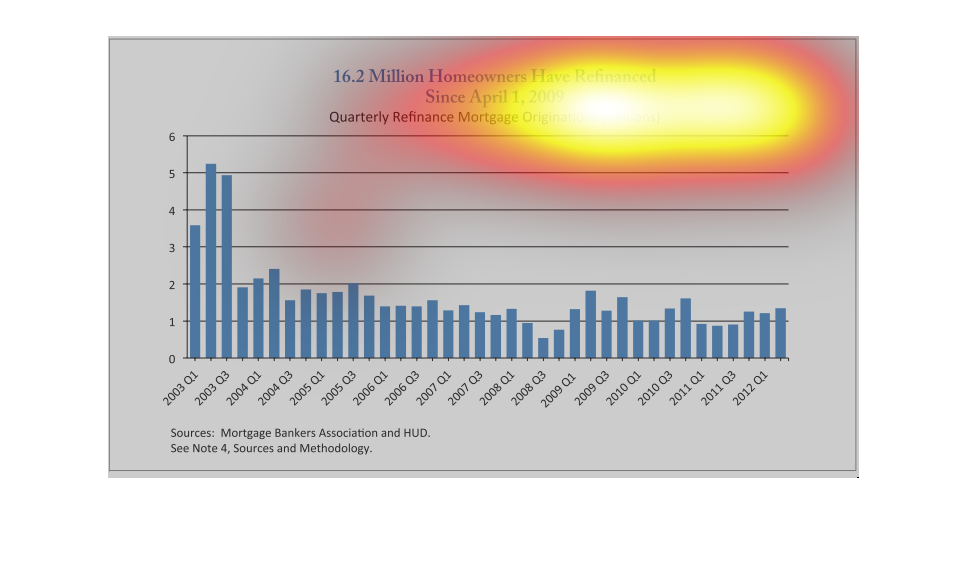
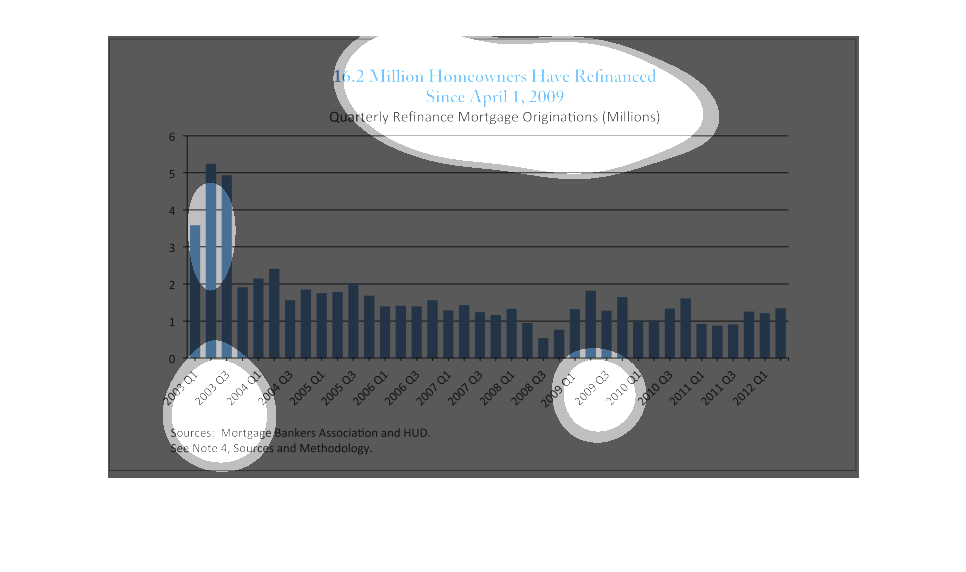
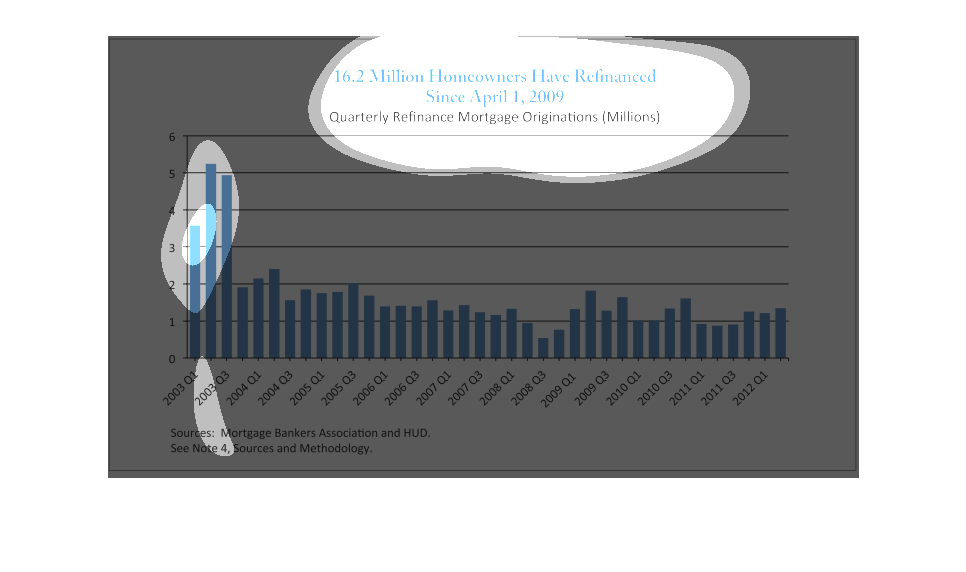
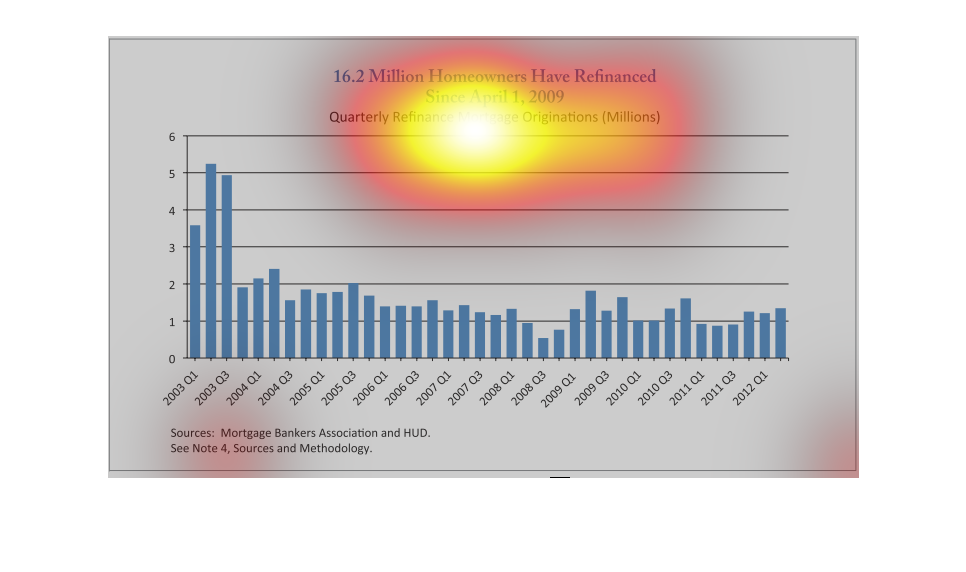
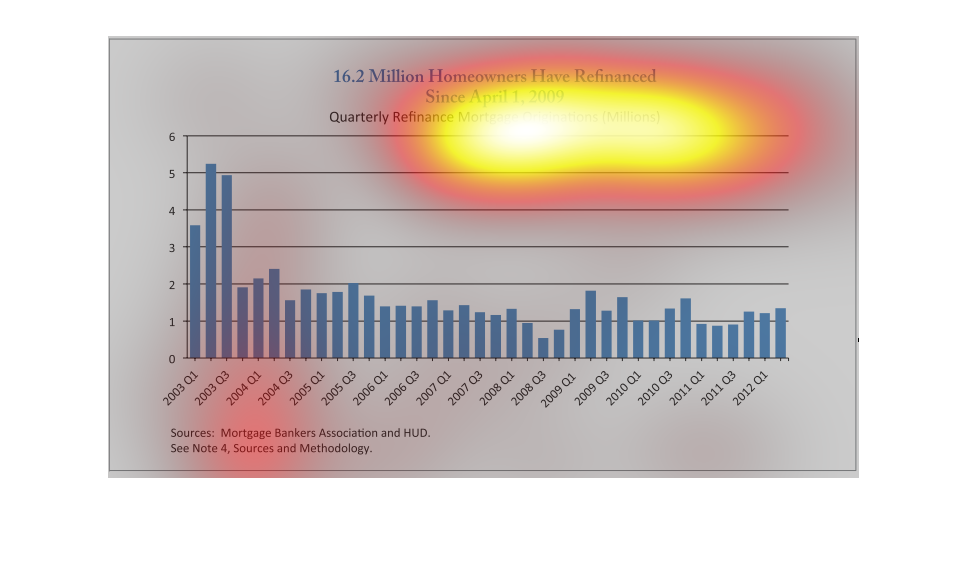
This breaks down the 16.9 million homeowners who have refinanced since 2009 from 2003. in
each quarter. After an initial peak in 2003, it immediately dropped off and remained relatively
stable since. By far the lowest was in 2008, third quarter.
The alarming number of yesteryear of people refinancing their homes just before the housing
stumble has been curbed quite effectively over the years because of new regulations, as this
graph clearly shows
THIS PLOT SHOWS HOW MANY HOMEOWNERS HAVE REFINANCED SINCE 2003. EACH BAR REPRESENTS ONE QUARTER
OF A YEAR, AND THE SIZE GROWS WITH A LARGER NUMBER OF REFINANCES.
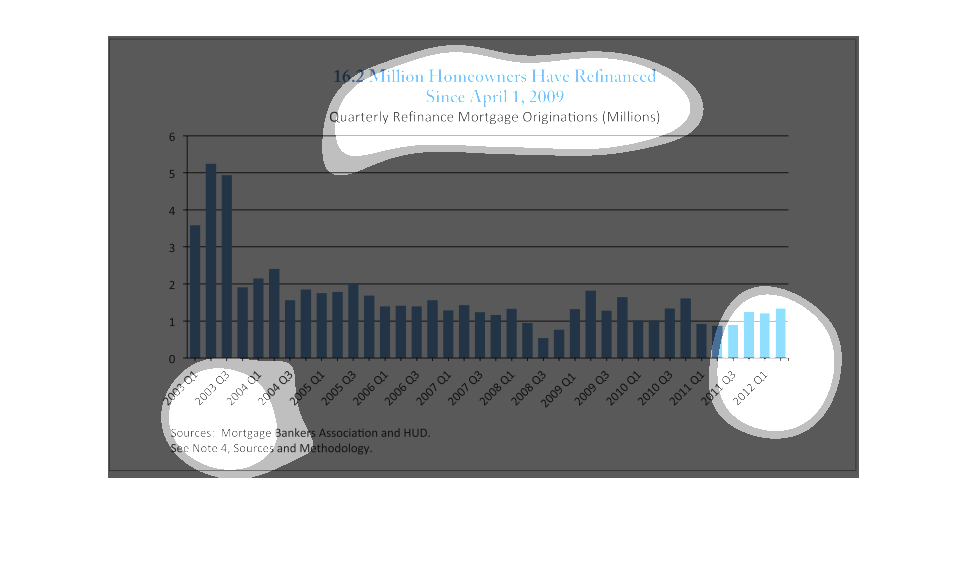
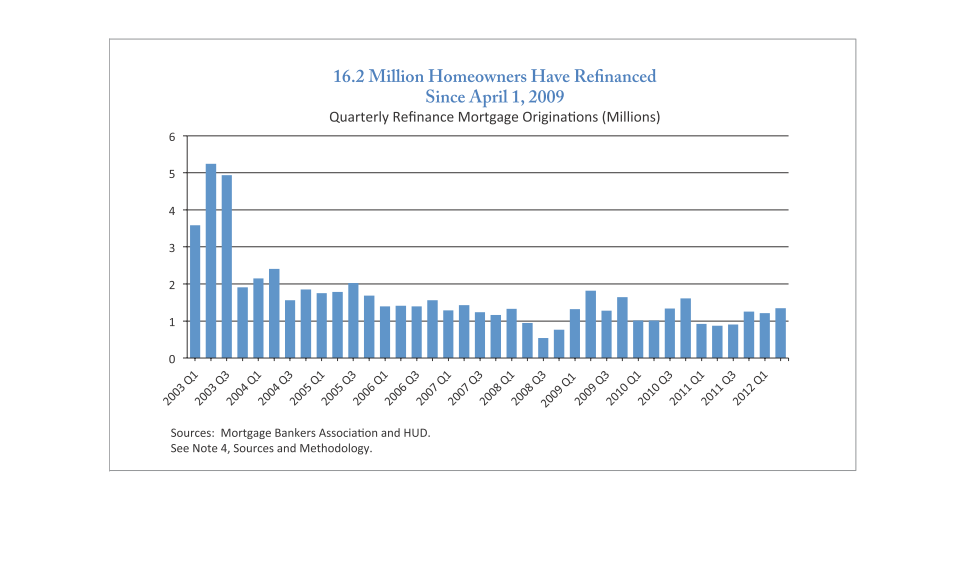
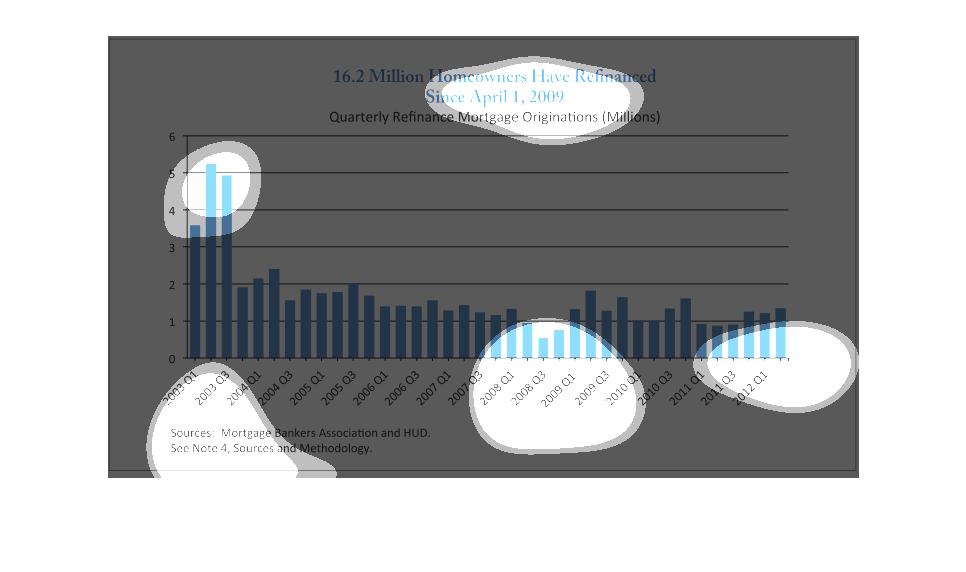
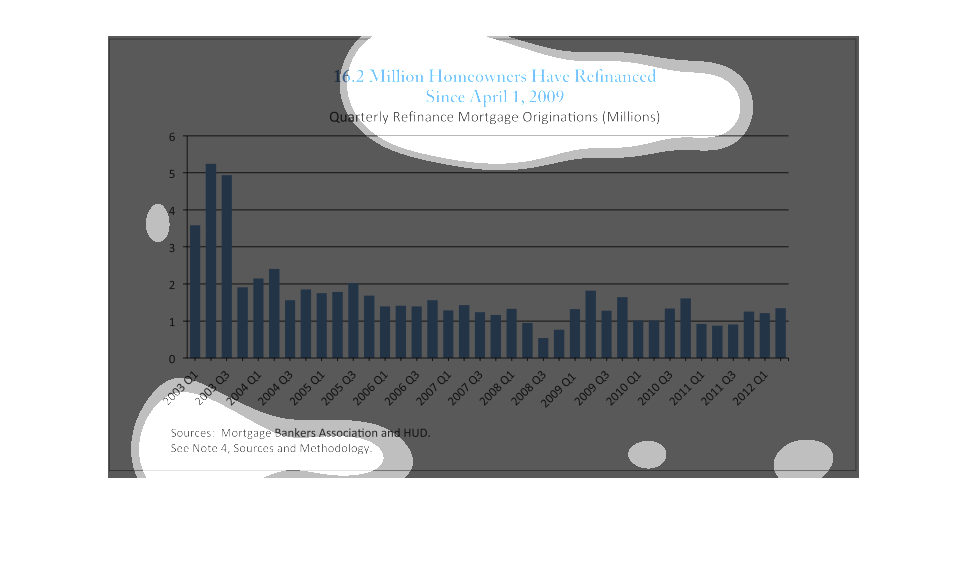
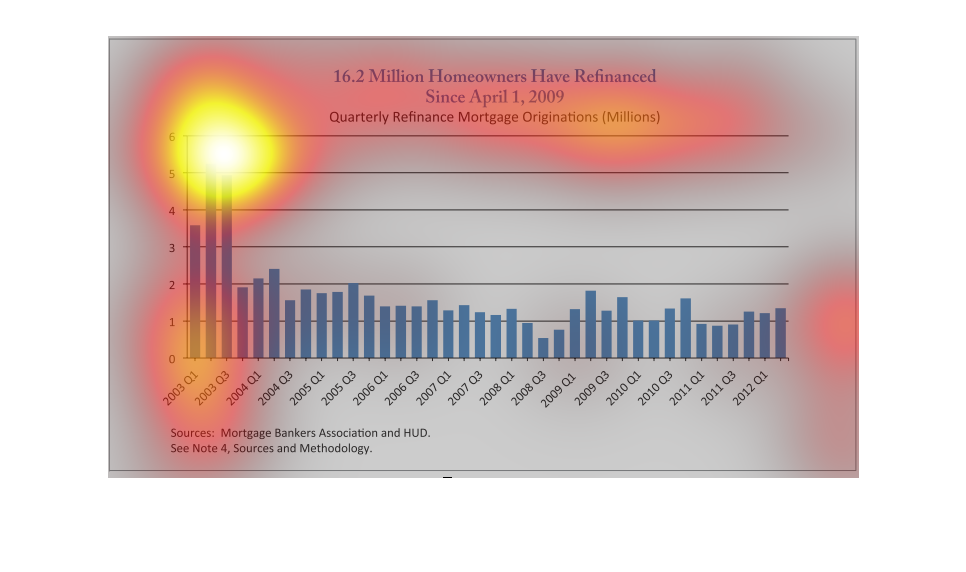
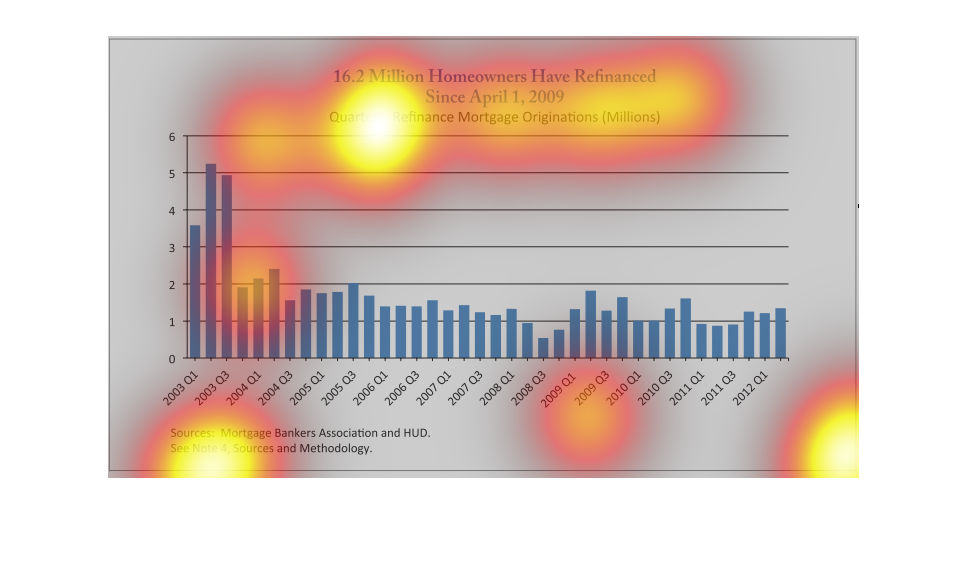
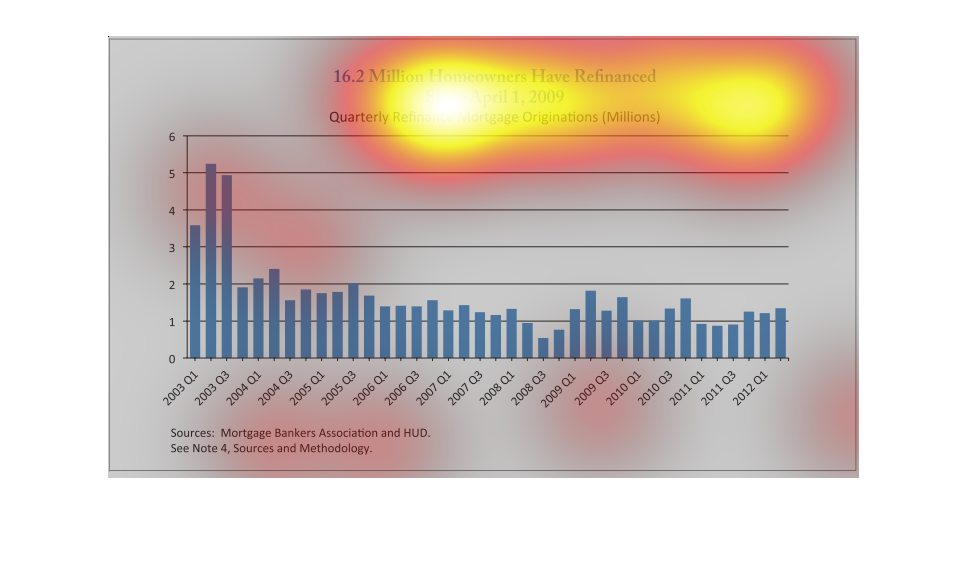
This chart is showing data on 16.2 million homeowners that have refinanced since April 1,
2009. Overall it shows that the most homeowners refinanced  in the second quarter of 2003.
The least amount of homeowners to refinance was in the third quarter of 2008.
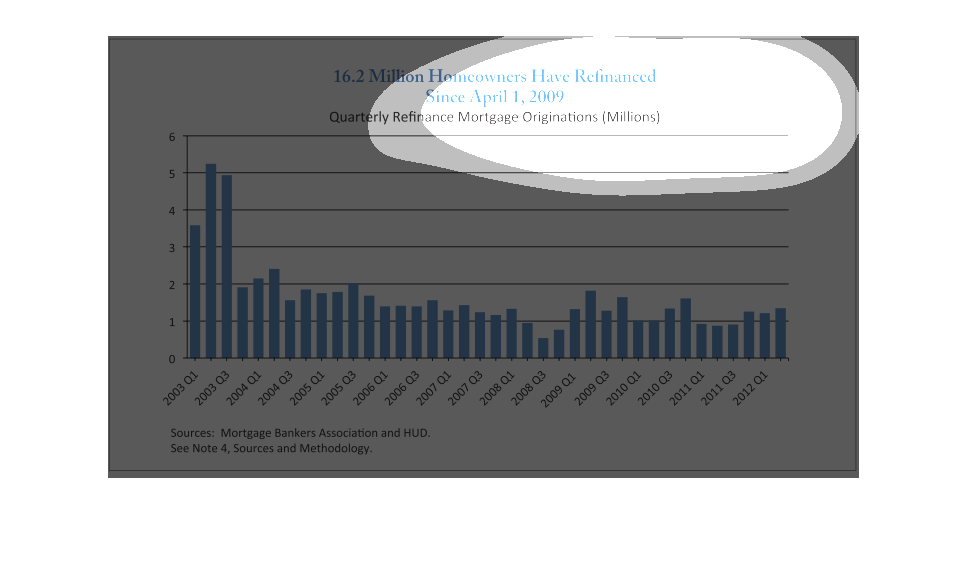
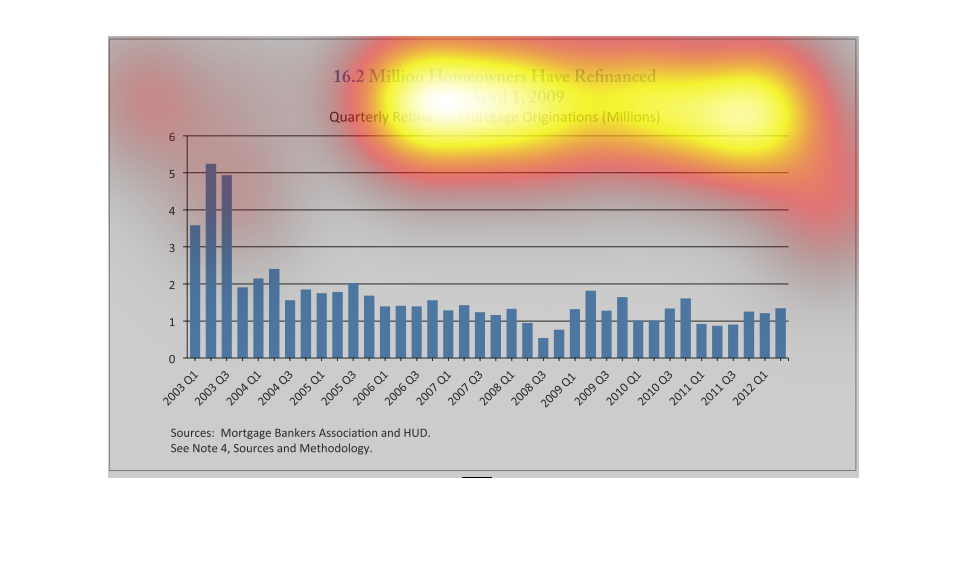
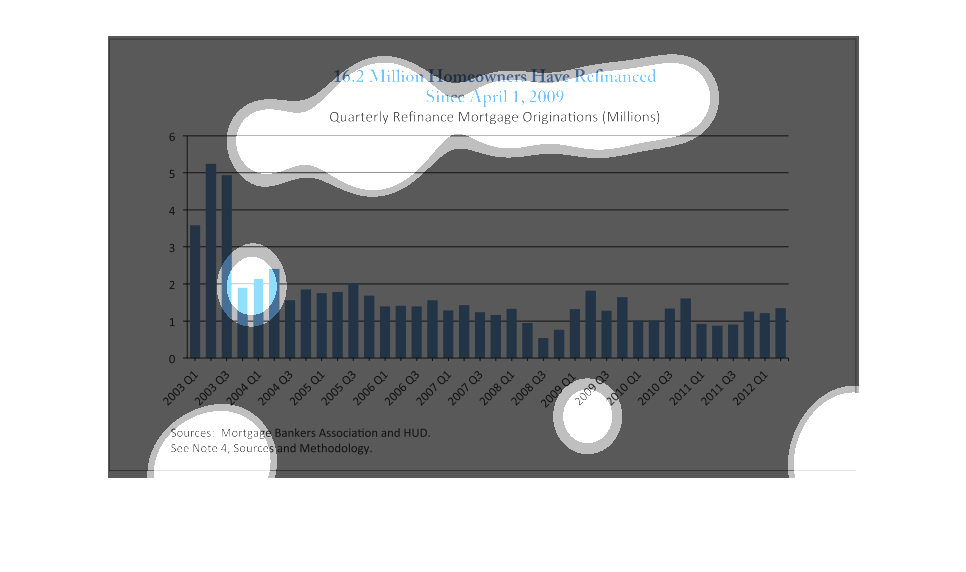
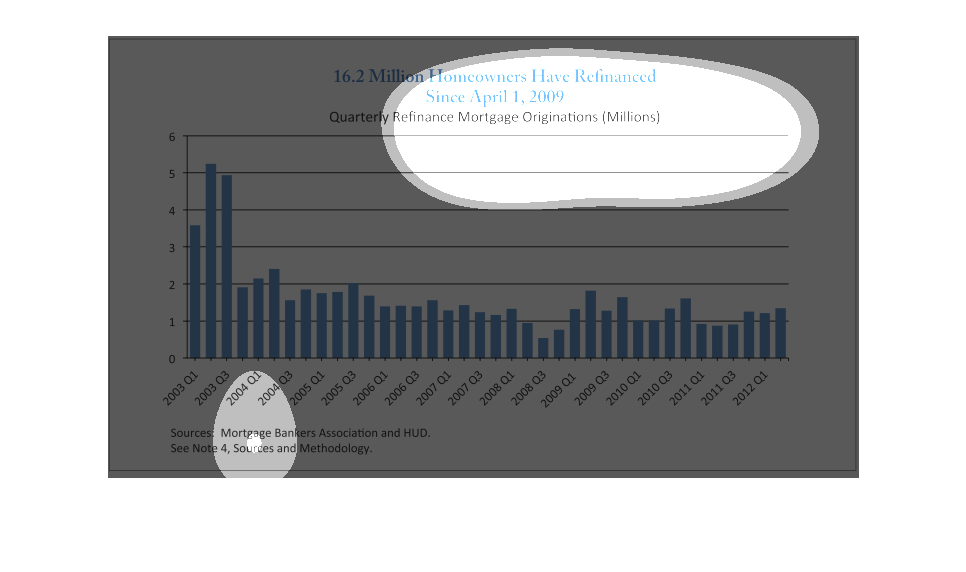
This graph is a quarterly breakdown showing how many households have refinanced their mortgage
between the 2003 first quarter and 2012 first quarter. Overall, 16.2 million households have
refinanced.
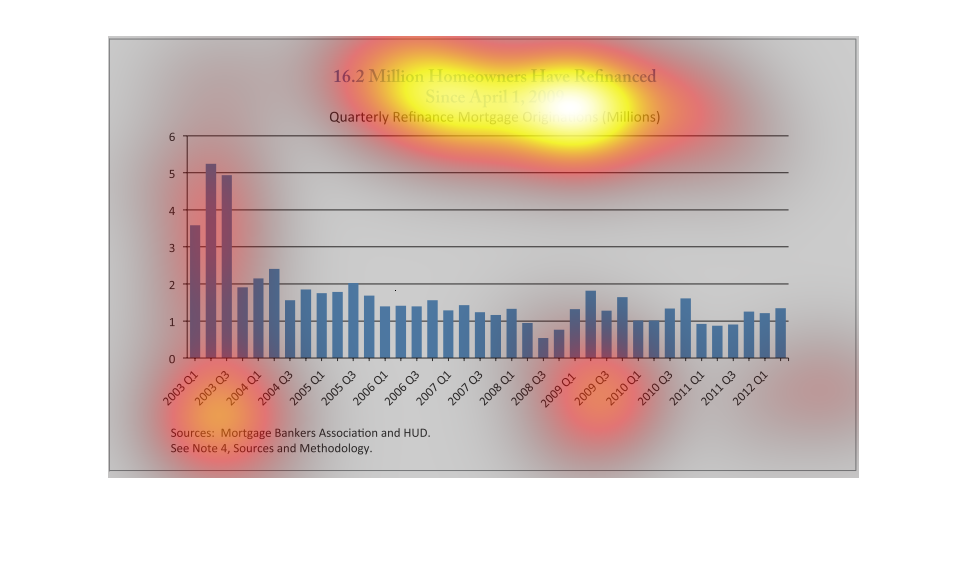
This chart describes 16.2 homeowners have refinanced since April 1st, 2009. Specifically quarterly
refinance mortgage originators in the millions of dollars.
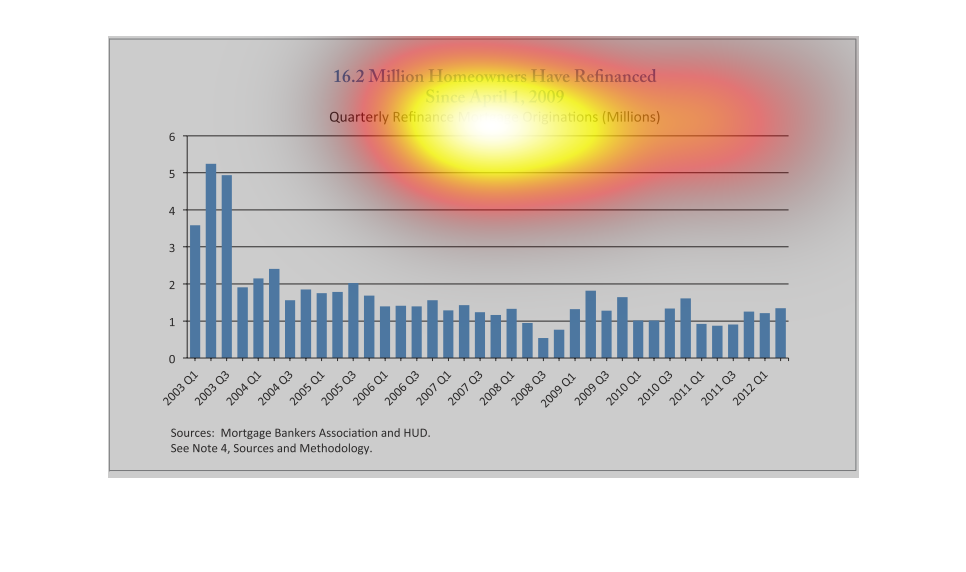

This is a chart of Quarterly Refinance Mortgage Origination's (Millions).  The Chart is showing
the yearly Home Owner Have Refinanced since April, 2009.
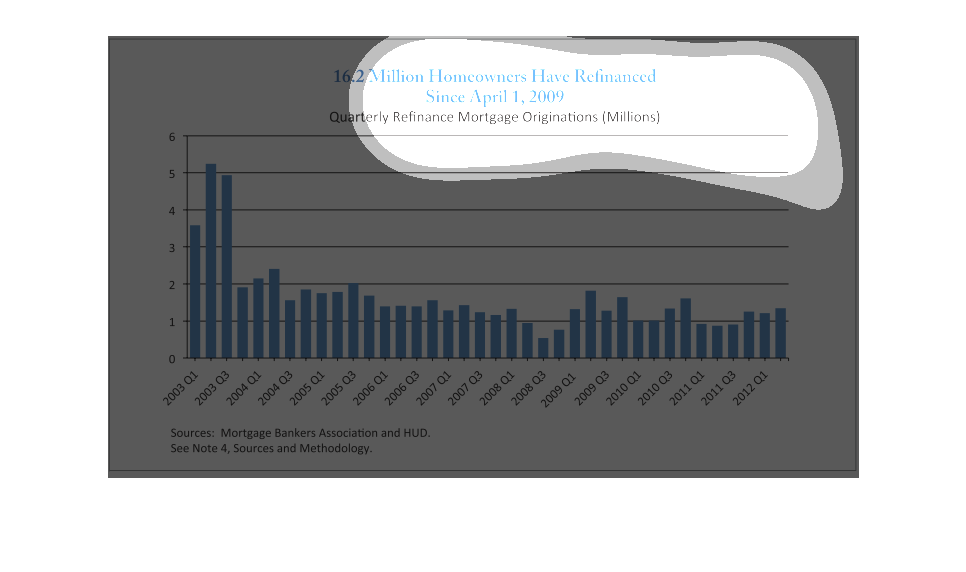
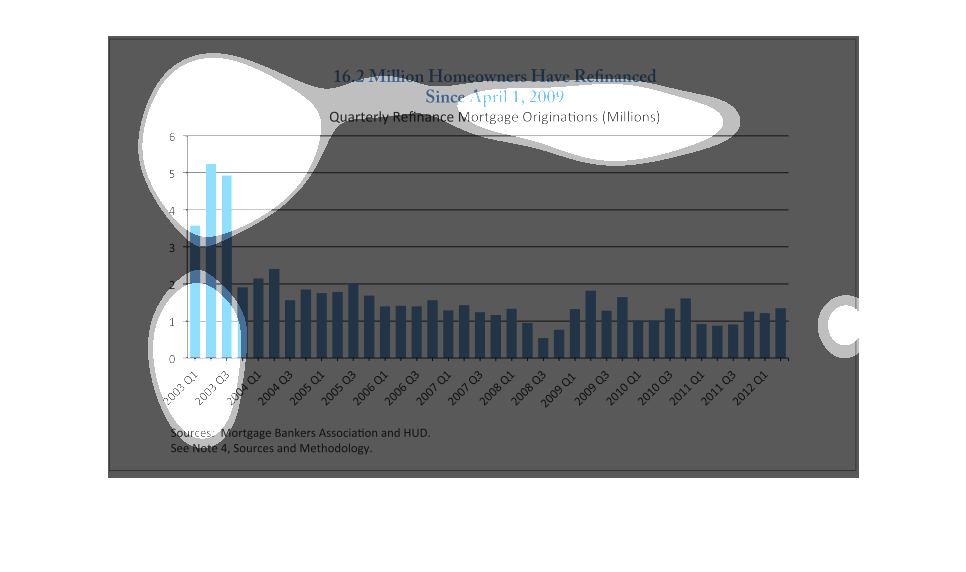
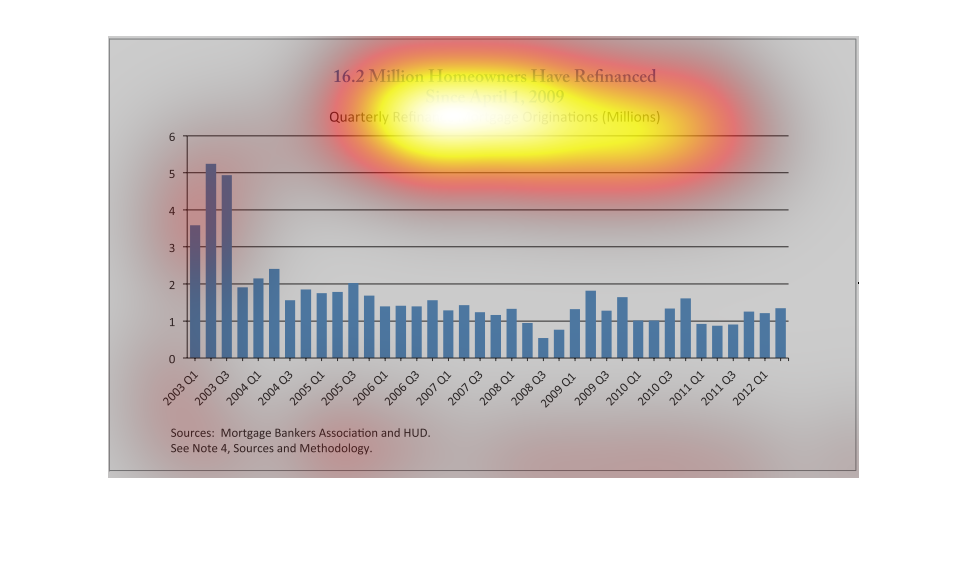
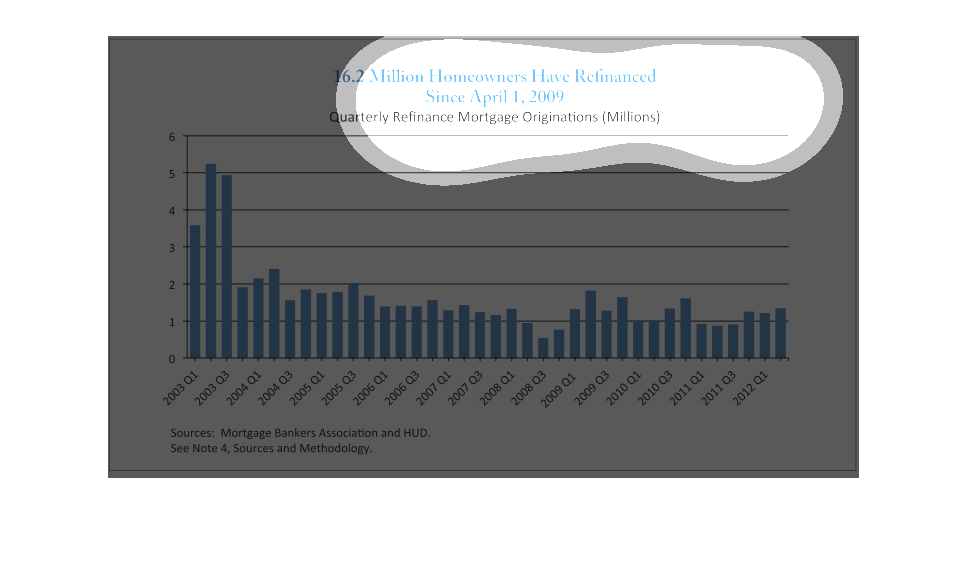
The following chart describes the Quarterly Refinanced Mortgage Origination from 2003 until
2012. It shows that 16.2 million homeowners have refinanced their home ever since April 2009.
The highest number began in 2003, where a little over 5 million people refinanced. In 2012,
the numbers show that over a little more than one million people refinanced.
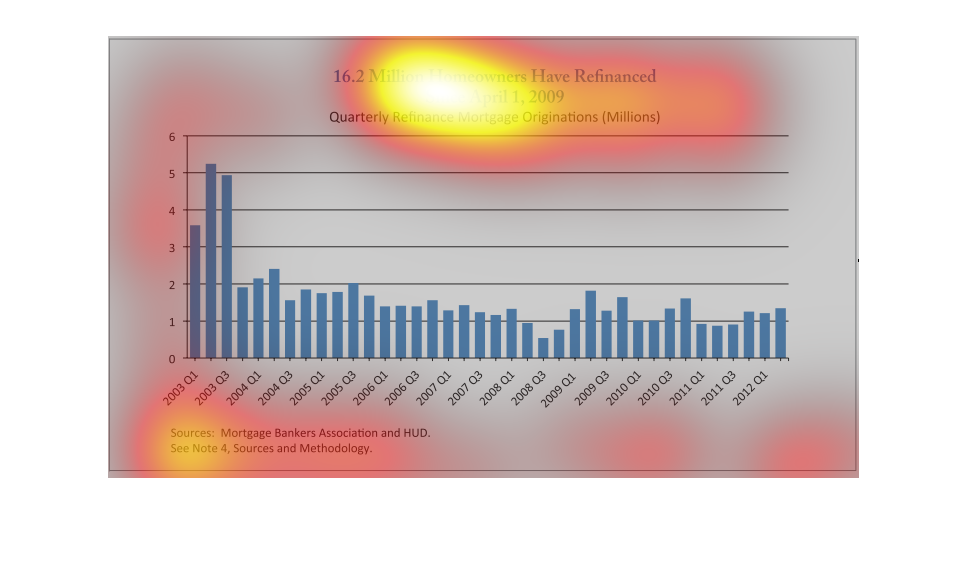
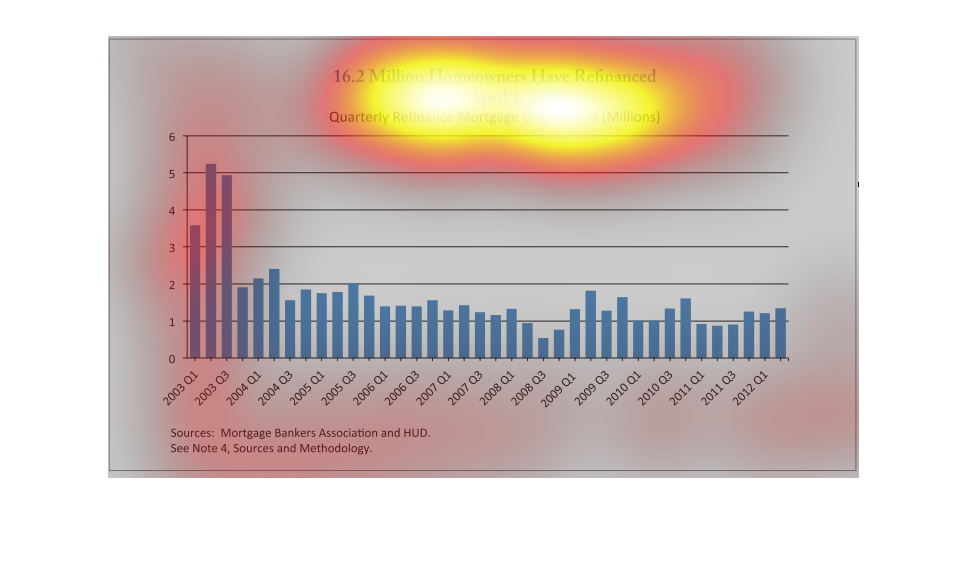
This graph illustrates the number of homeowners that have a refinance since 2009 based on
quarterly mortgage refinance qualifications.  The amount has decreased over time.
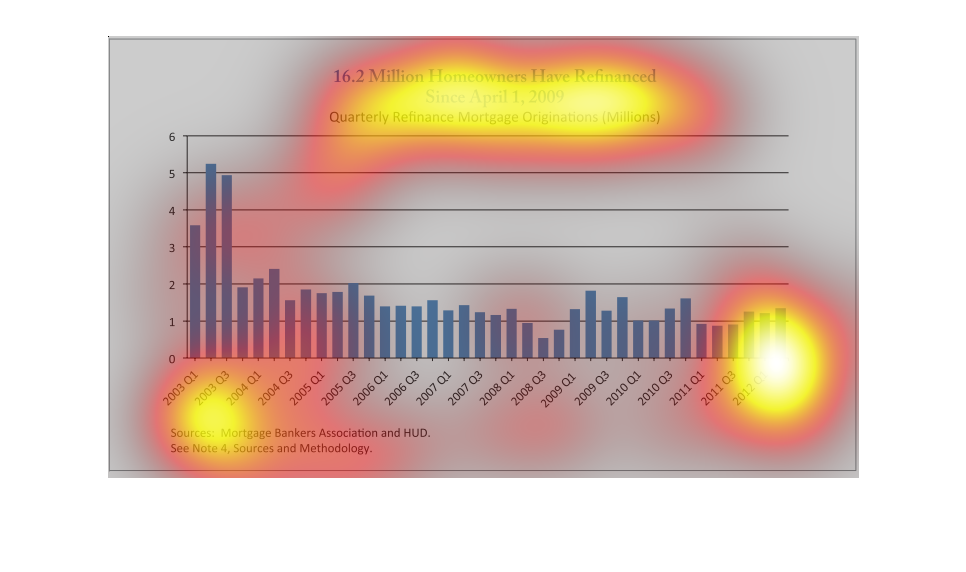
this is a graph of people who have refinanced on their homes between 2003 and 2012 showing
that a vast majority of people refinanced in 2003 with the lowest being in 2008
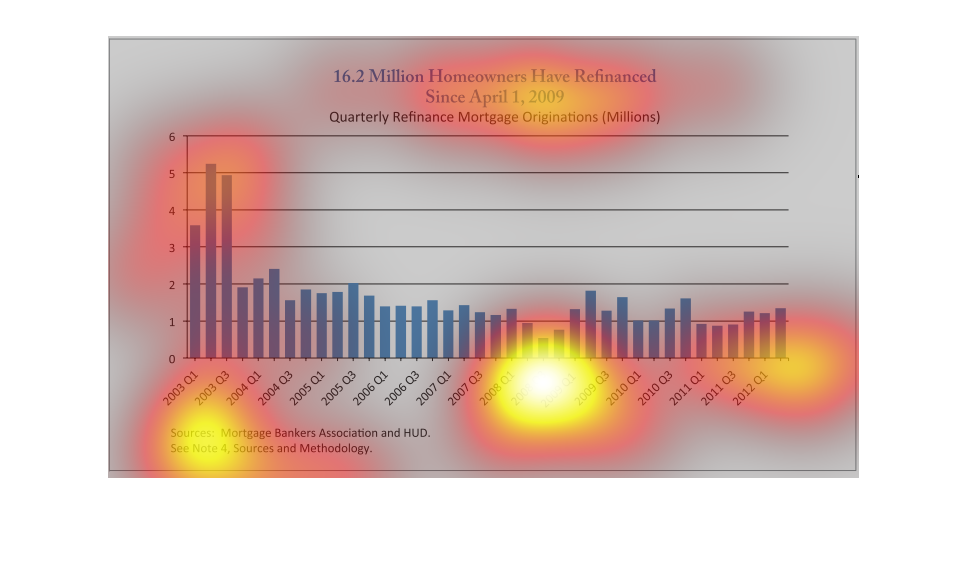
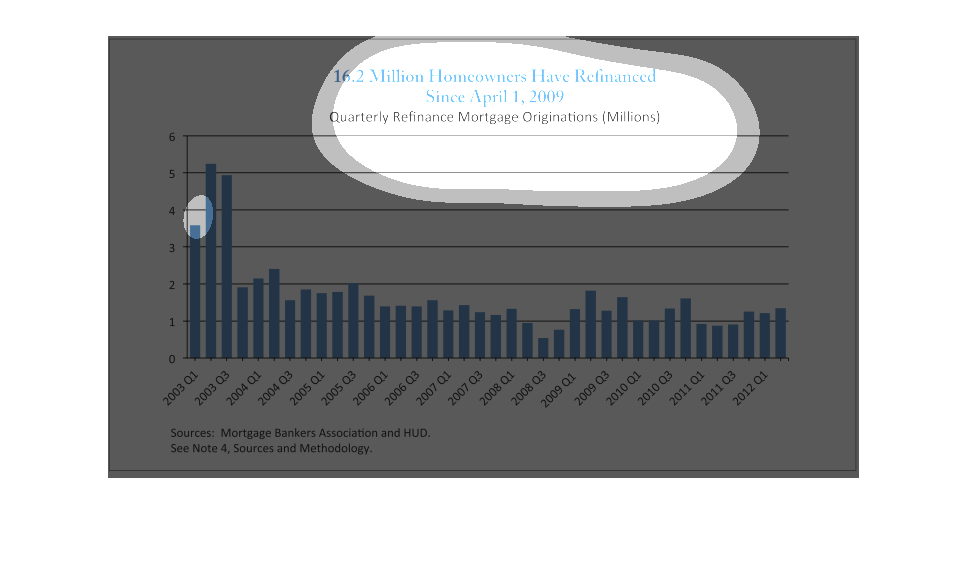
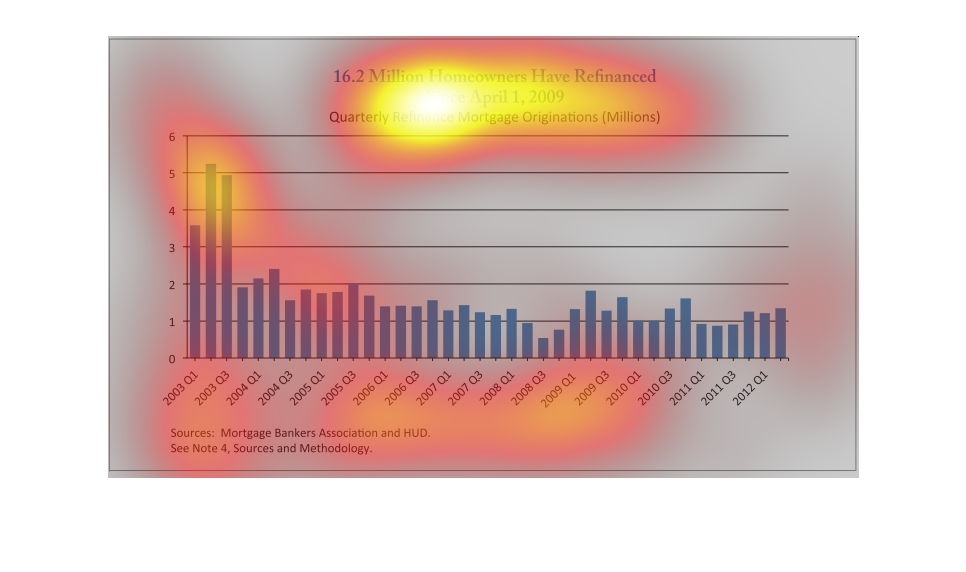
The graph to the left is depicted the number of mortgage refinances that have taken place
from 2003-2012.  As you can tell by the graph there was a big spike in refinances at the very
start of this period that the graph in indicated, then it slowly trickles down and one can
even see a decrease in refinances during the heart of the recession.
This is an image showing the distribution of how many homeowners have refinanced their homes
since April 2009. It is a decreasing trend but the overall number is extremely high at 16.2
million.
The following chart shows how many people have refinanced there homes in the last 10 years.
With over 26 million Americans refinancing there homes with lower rates.
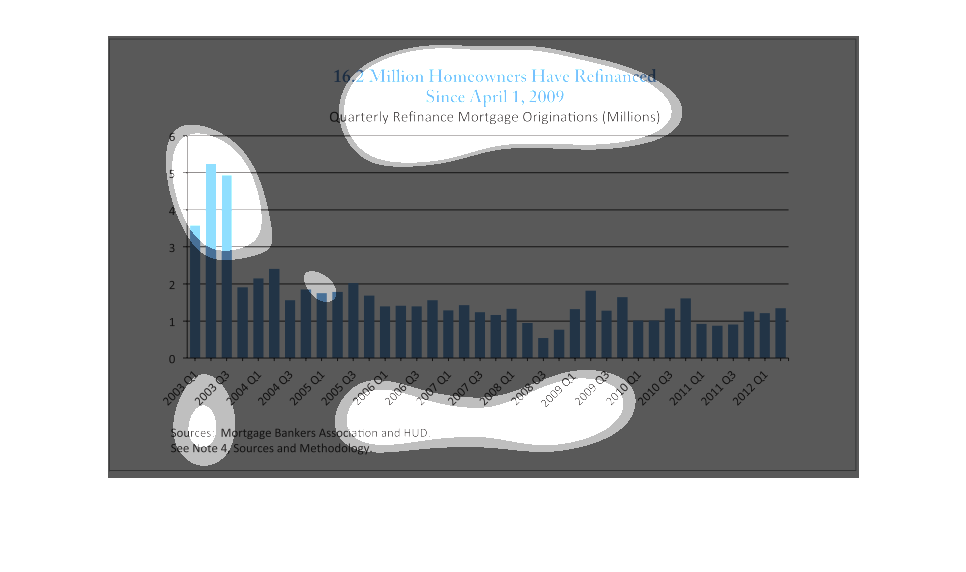
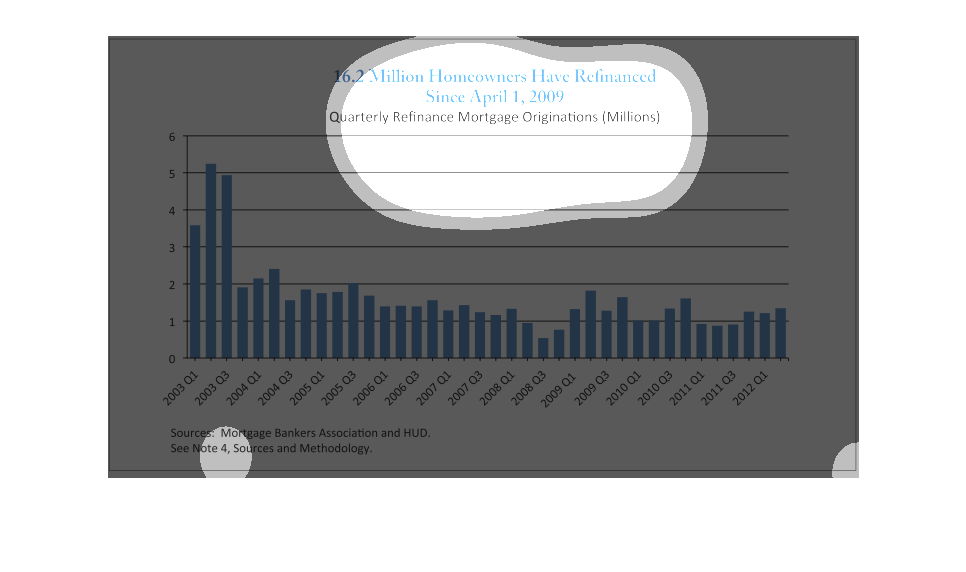
This chart shows that 16.2 million homeowners have refinanced since April 1, 2009. The graph
shows the quarterly refinance mortgage originiations. There is a peak in 2003 and then a steep
decline by the next year.
it a chart showing how home owner have refinanced there homes by the millions over the past
few years.it a chart showing how home owner have refinanced there homes by the millions over
the past few years.