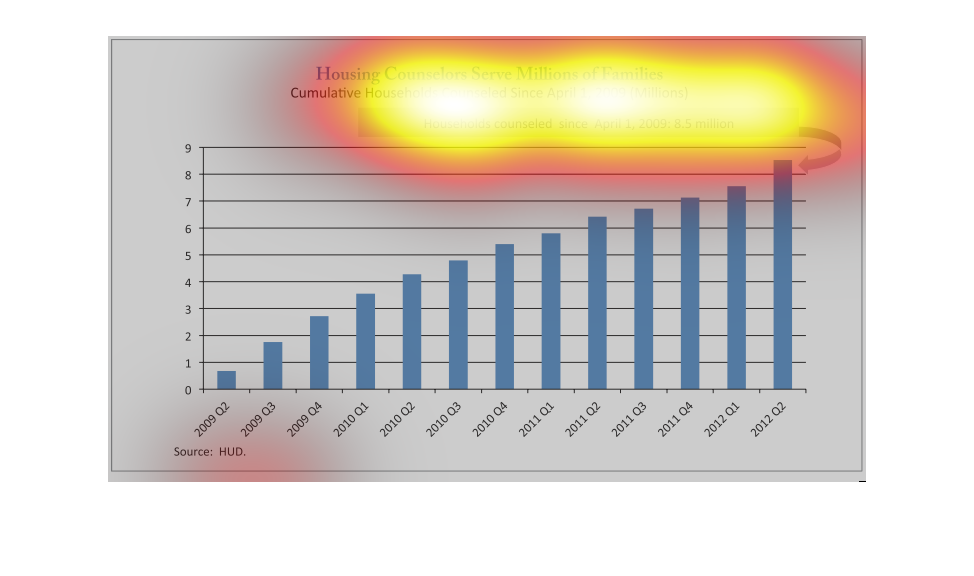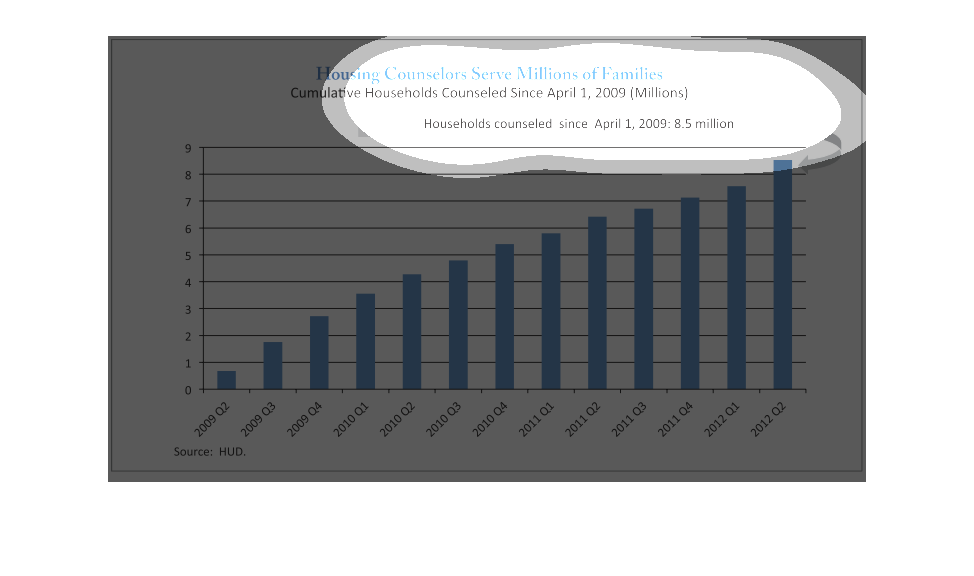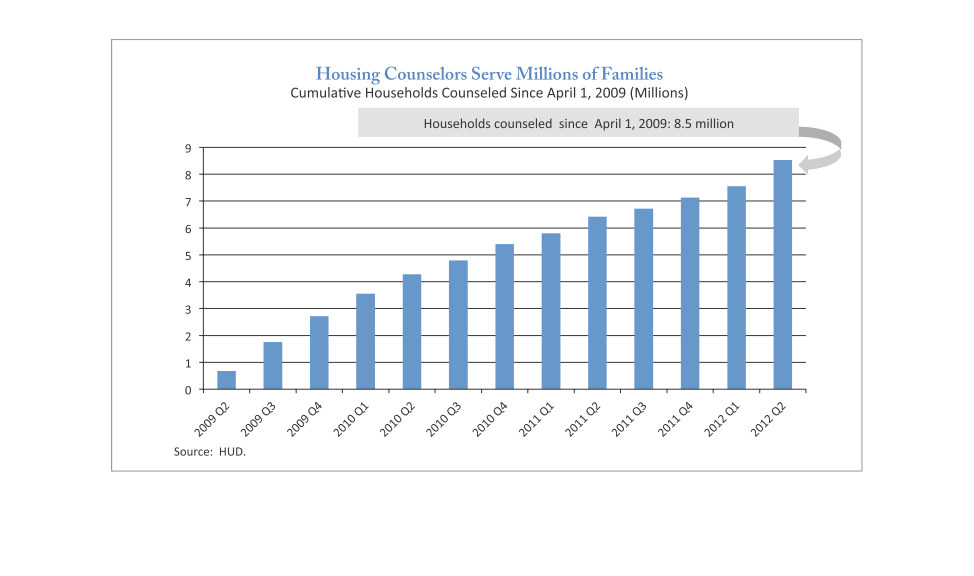
The image depicts a bar graph of housing counselors, and cumulative households counseled (in
the millions) since April 2009. The image depicts the number of counseled households as increasing
year over year during the time frame included in the graph, ending in 2012 with a total of
8.5million that year.
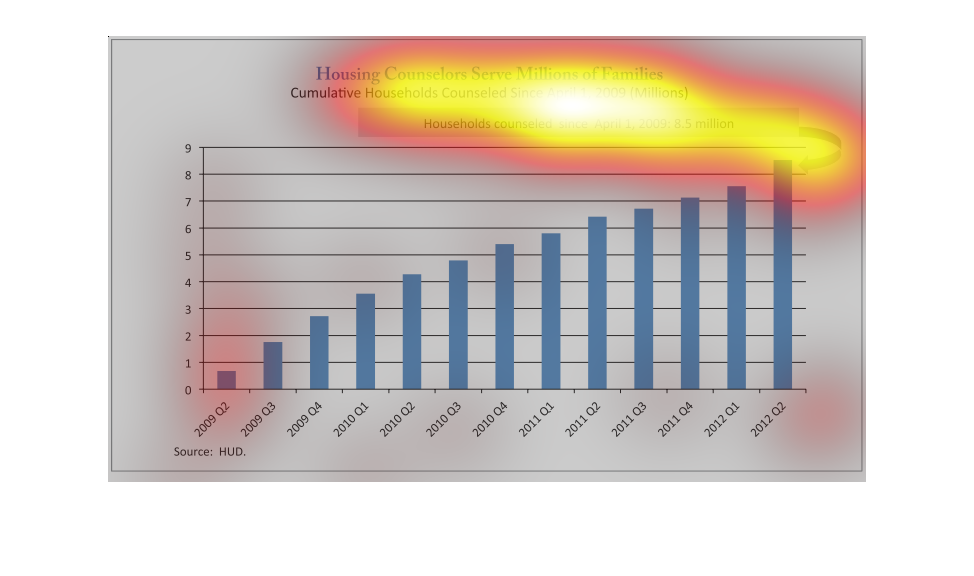
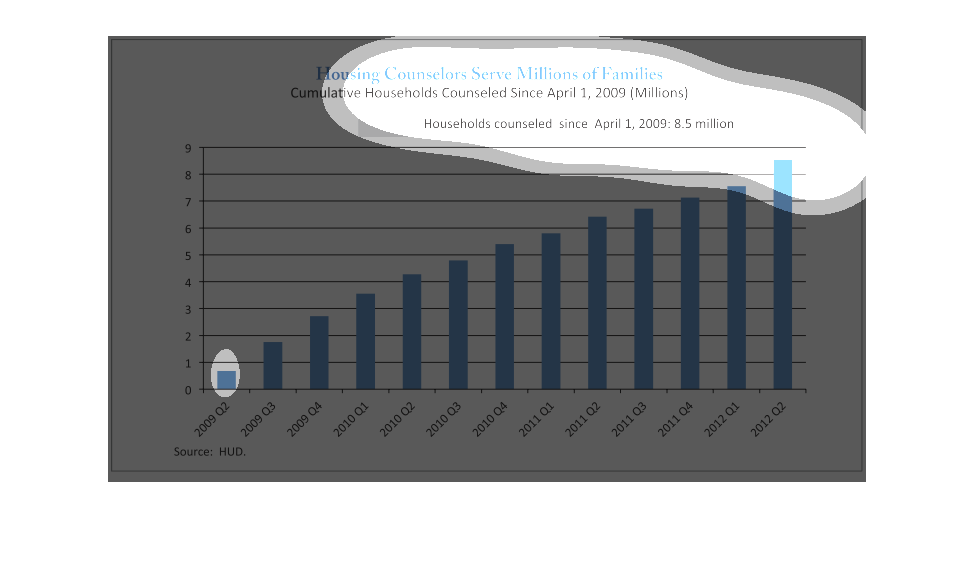
This graph illustrates how housing coordinators are serving billions of families.  It has
the number of cumulative households counseled since 2009 until the year 2012.
This chart describes and depicts the cumulative   households that were counseled by household
  counselors since the year of two thousand and  eleven.
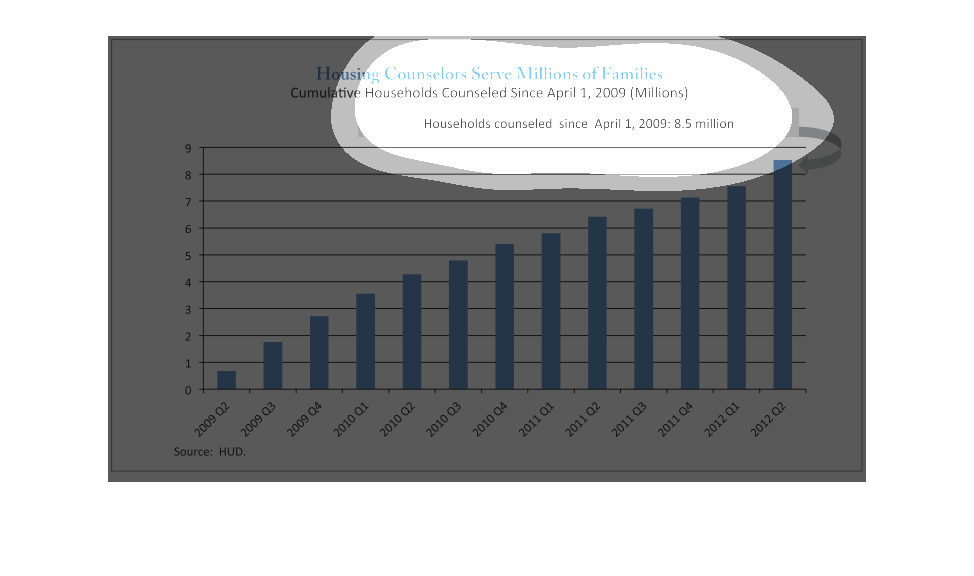
In the graph to the left it is showing the steady increase in housing counselors per the United
States over the last several years.  At the end of this data collection it is showing in the
2011-2012 year, 8.5 million new coucelsors have been added since the second quarter of 2009.
This graph shows the number of households counseled from April 1, 2009 to February of 2012.
HUD statistics show that household counseling increased almost ten fold between 2009 and 2012,
from less than 1 million to more than 8 million.
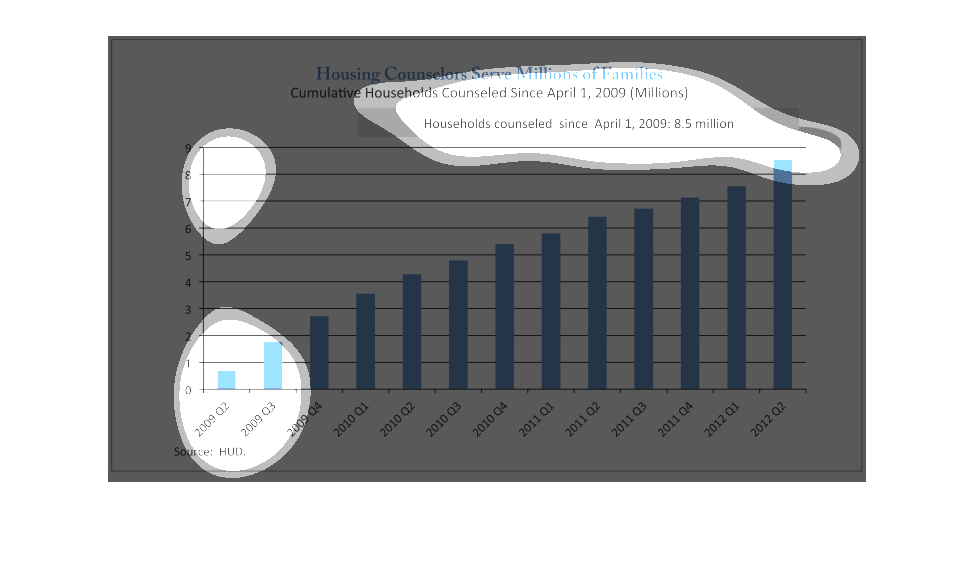
This image is showing the rapid increase in household counseling based on yearly quarterly
averages.  It's basically suggesting that household counseling is on the rise nation wide
and these jobs are becoming increasingly needed.
The graph is named "Housing Counselors Serve Millions of Families." The graph tracks the households
counseled since April 1, 2009. The number of households counseled steadily increases from
less than 1 million to almost 9 million.
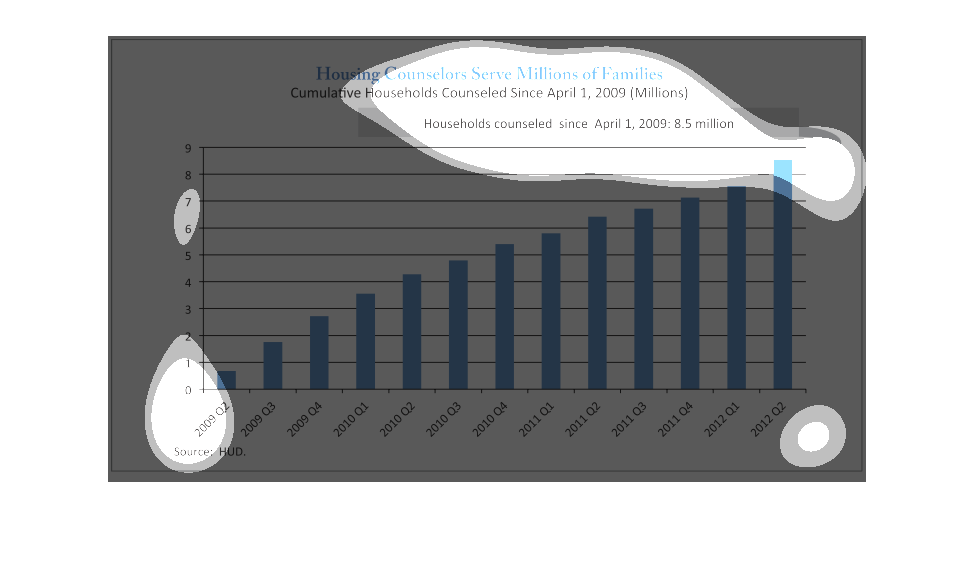
This is a bar graph that represents how many households have been served by housing counseling
in April 2009 through 2012., which totals 8.5 million.
This graph is titled Housing Counselors Serve Millions of Families.  The graph is a representation
of the number of households counseled since April, 1 2009.
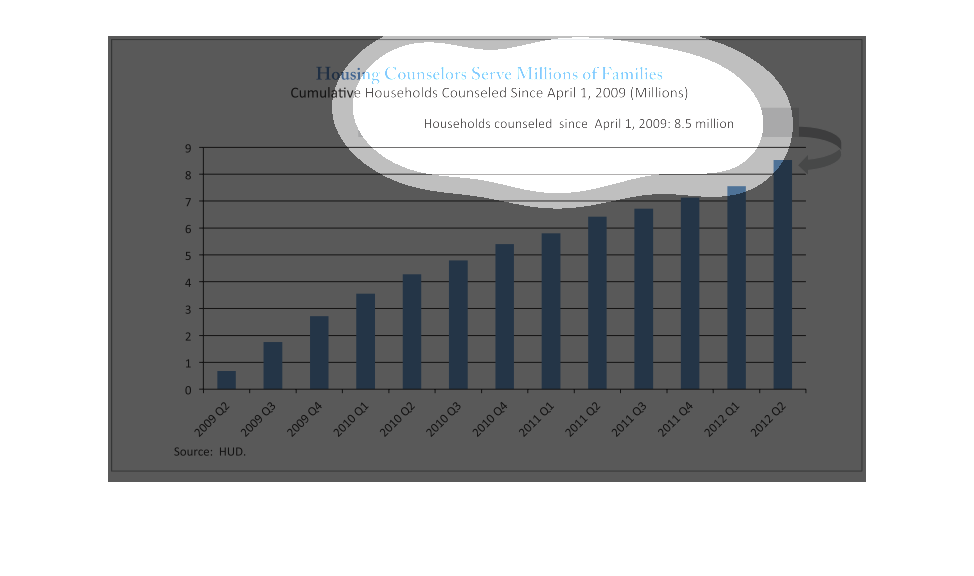
This chart describes that housing counselors serve millions of families. Specifically, cumulative
household counseled since April 1st 2009: 8.5 million.
This chart demonstrates the increase in the need for Housing Councilors among the back end
of 2009 to 2012. They provide invaluable information and confidence for families across the
nation.
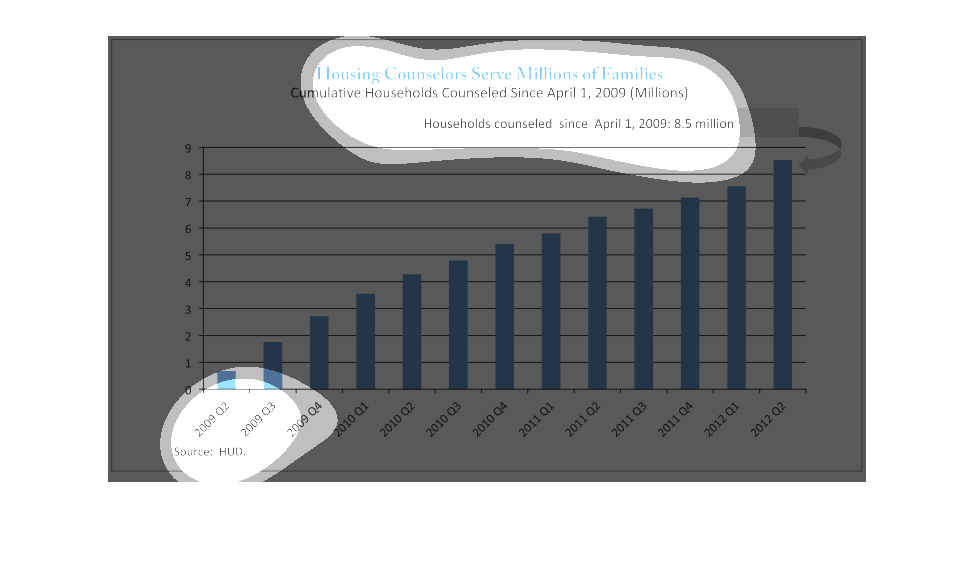
The following chart shows the total number of people that have been counsled about housing
from APR 2009 TO second quarter of 2012. The information from the chart was provided by HUD.
This bar graph describes the cumulative number of households counseled since April 1, 2009
through 2012 Q2, about 8.5 million. The number increases each year.
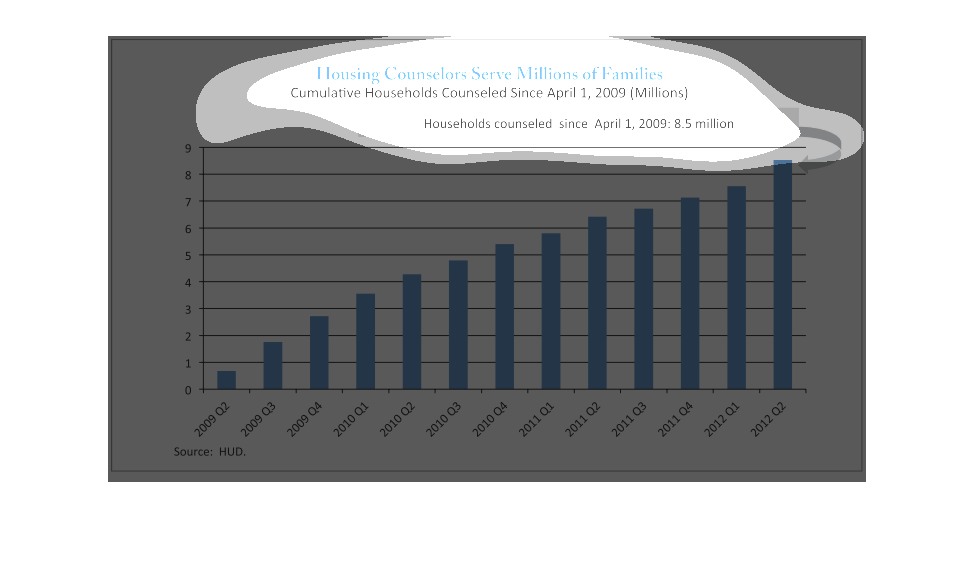
Housing counselors serving millions of families is the heading of this chart. The source of
this chart is HUD. The chart starts in 2009 and ends in 2012. A large increase from the start
of 2009 to the end of 2012.
This graph depicts the cumulative number of families who have been counseled by housing counselors
since early 2009.  The graph shows a roughly constant number of families over time, i.e.,
the cumulative number increases linearly.