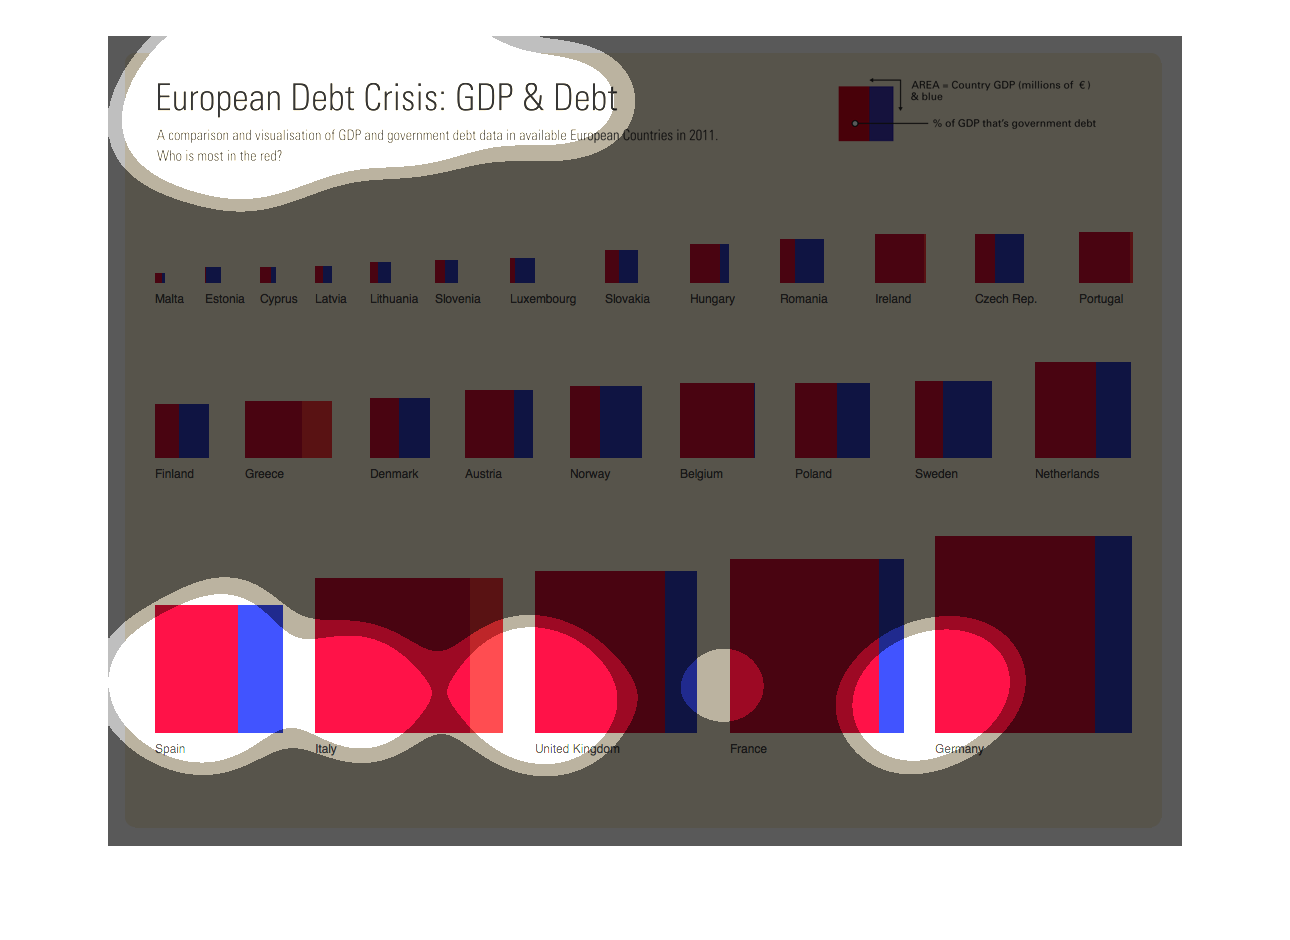
Just as the media bombards us with reminders of the recession and the housing crisis that
nearly bankrupted the United States, people also should take into account that Europe was
also affected, as this graph clearly shows.
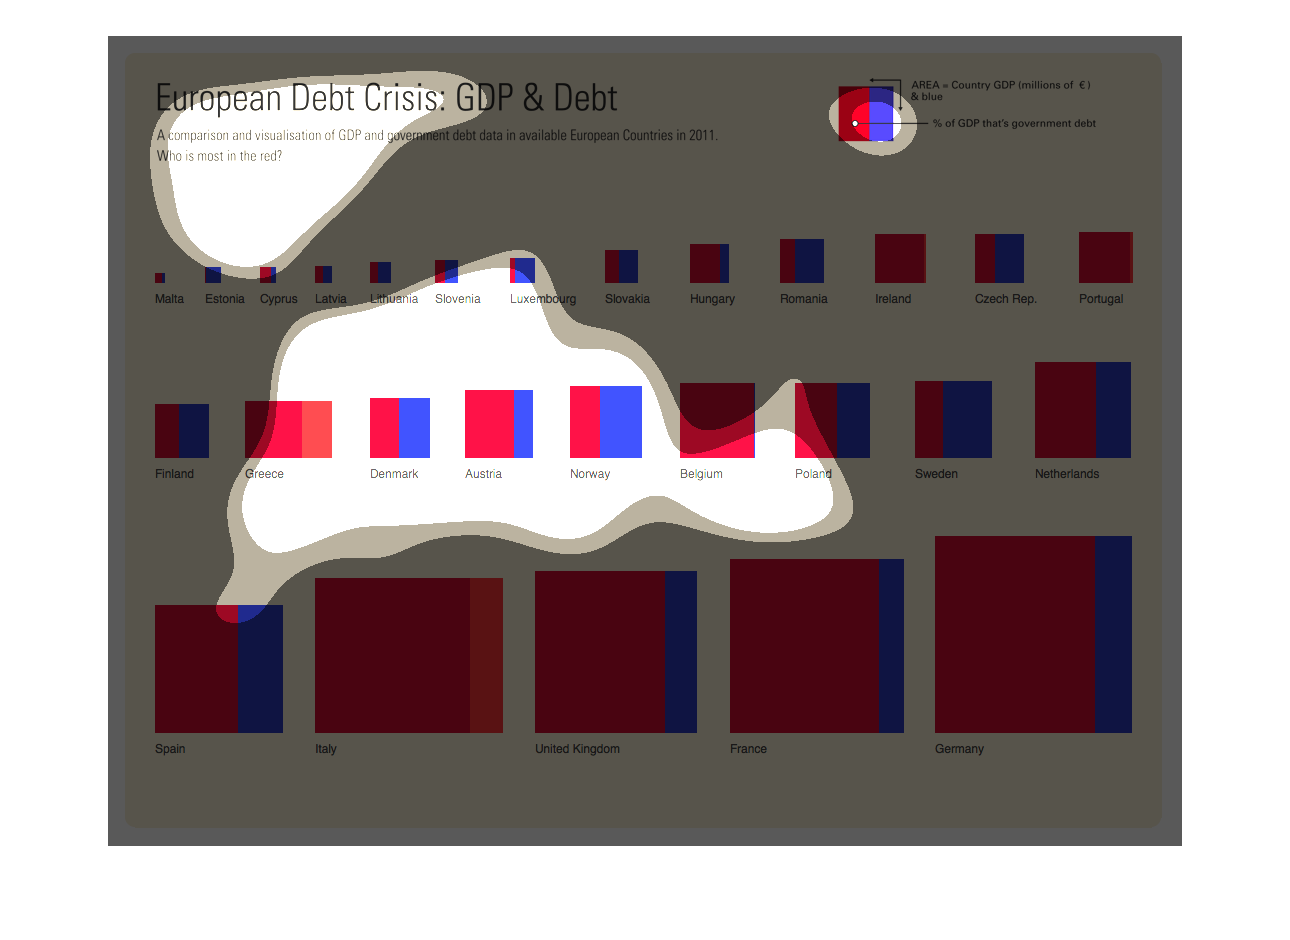
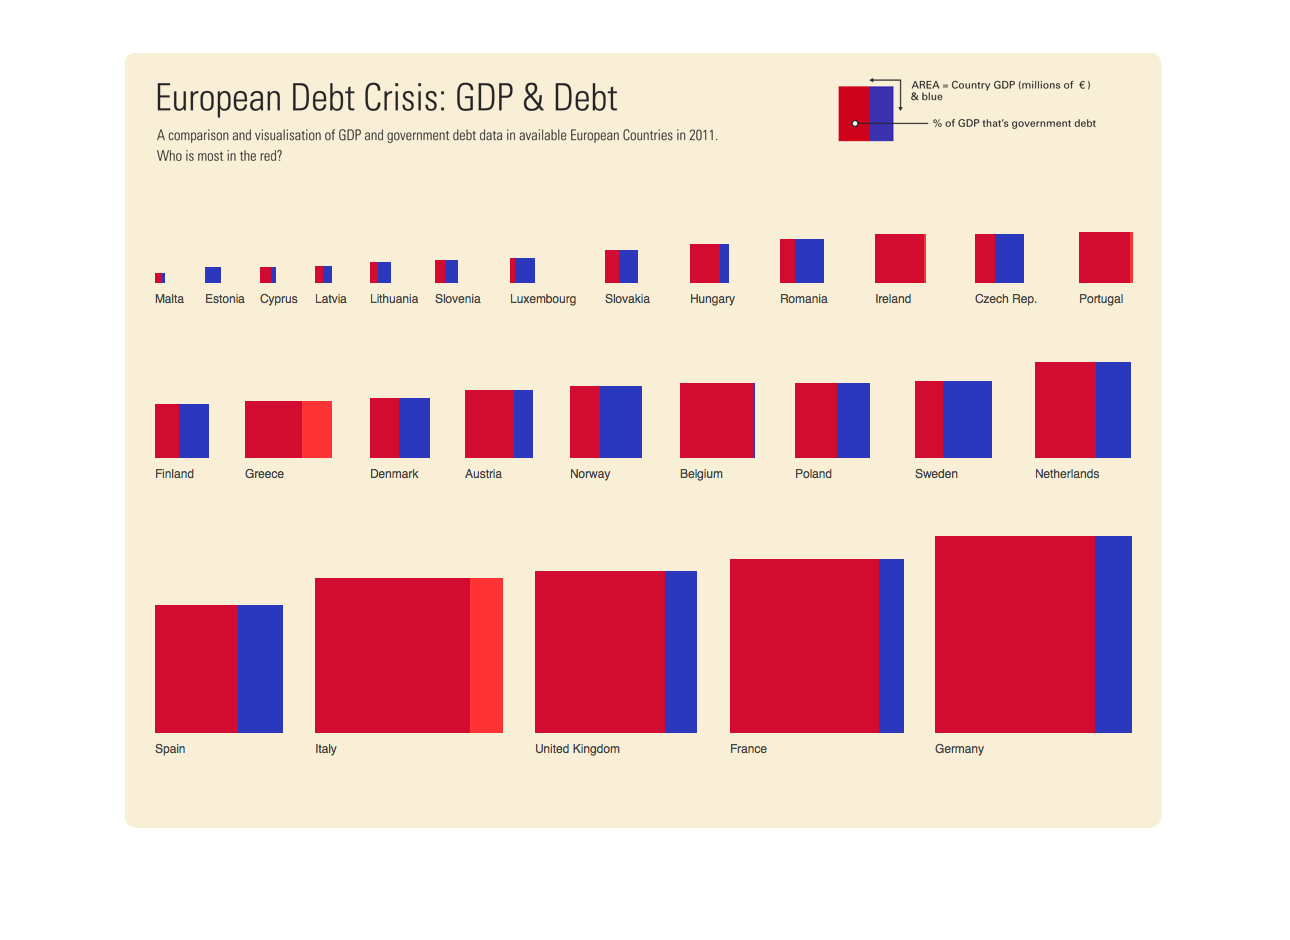
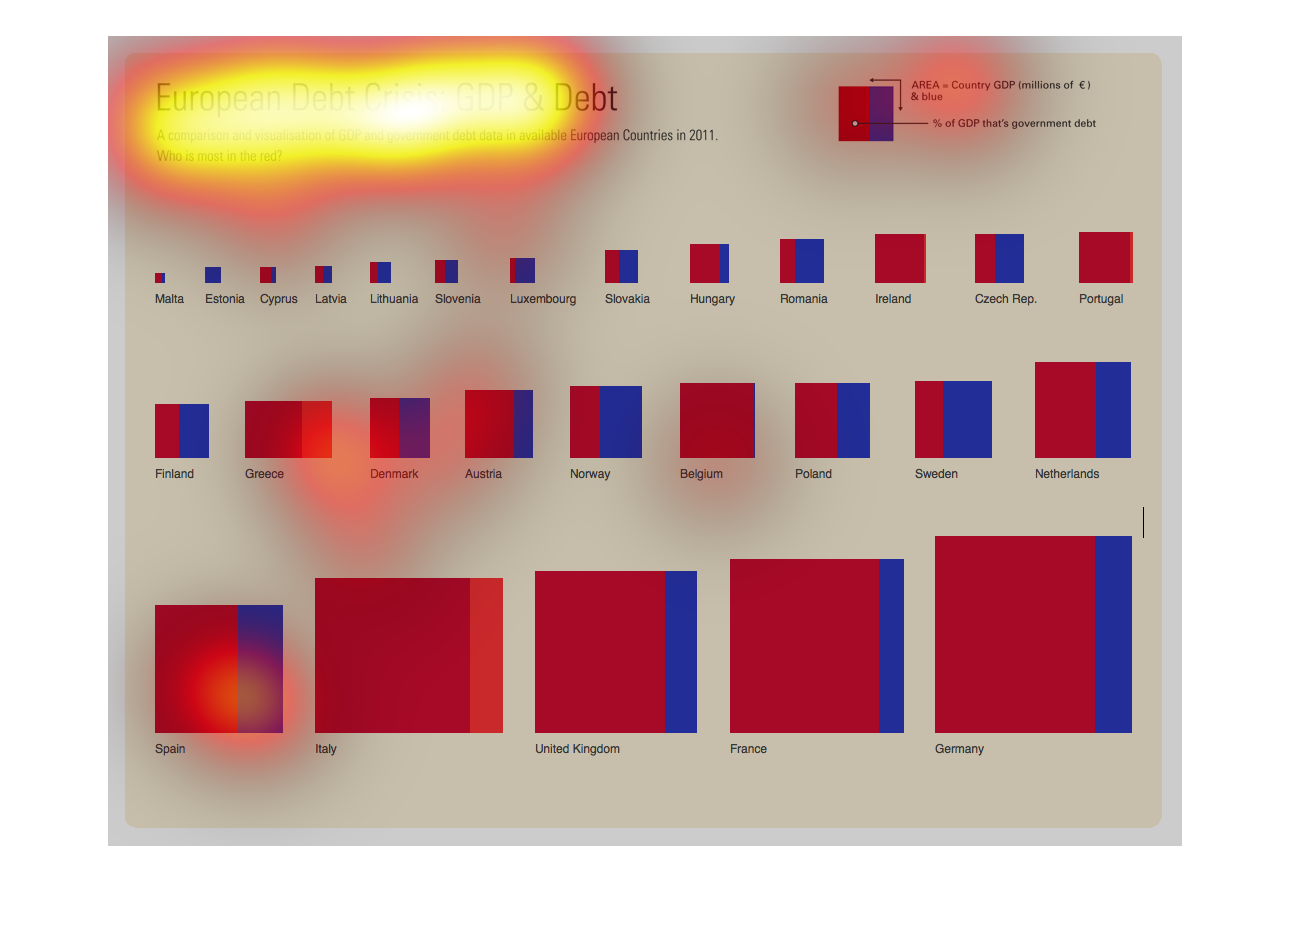
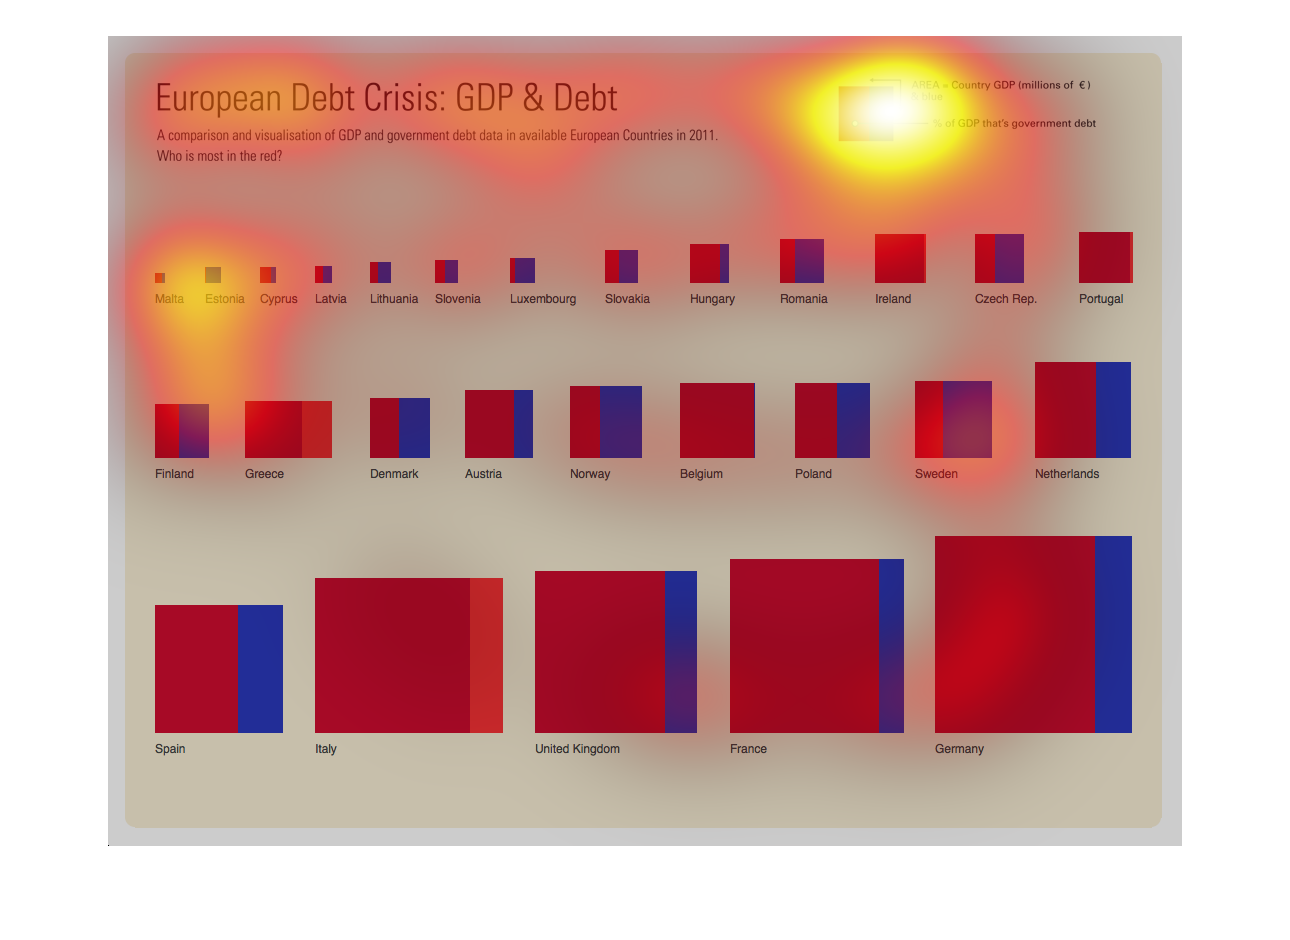
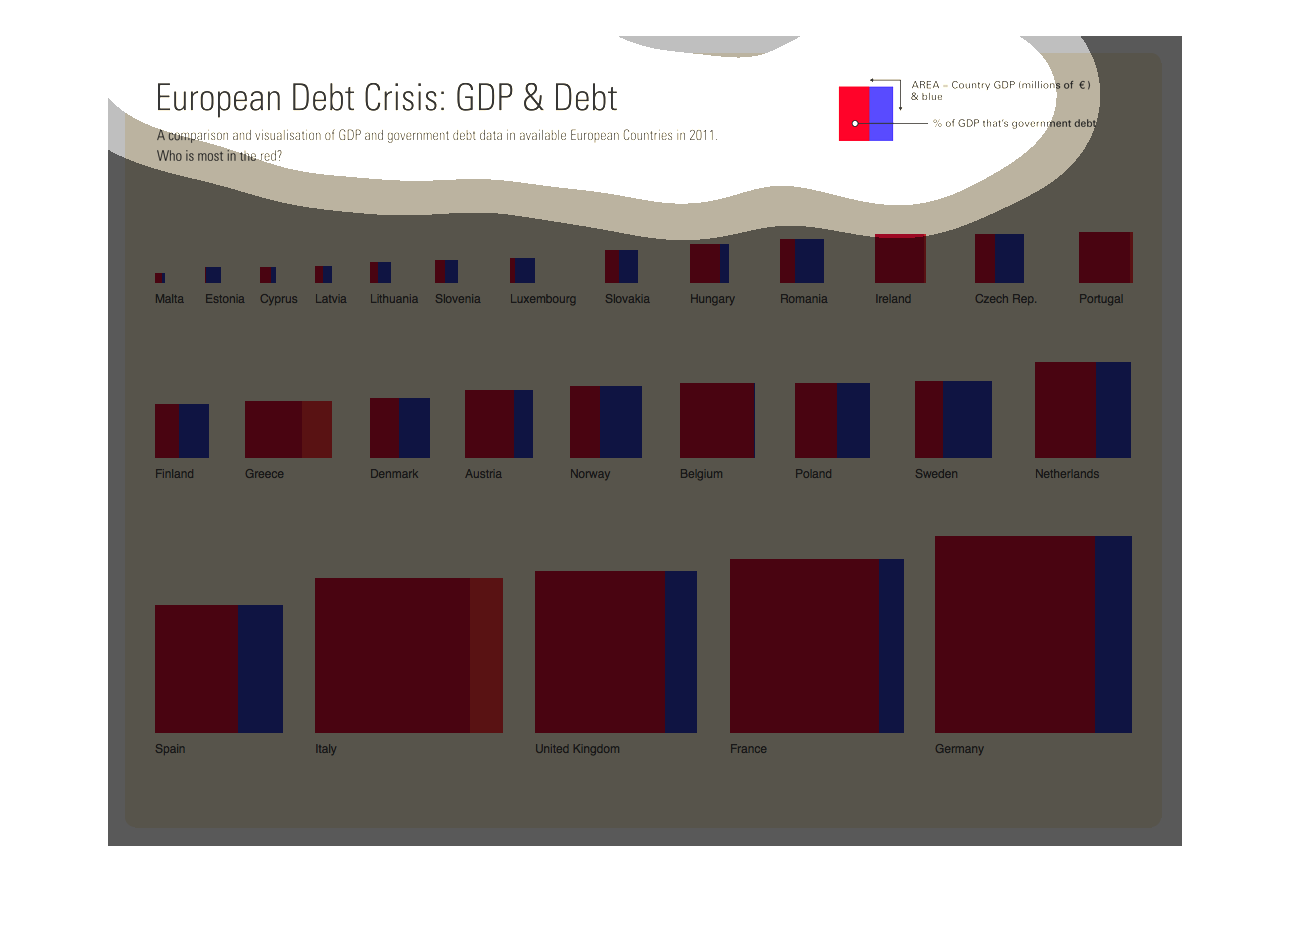
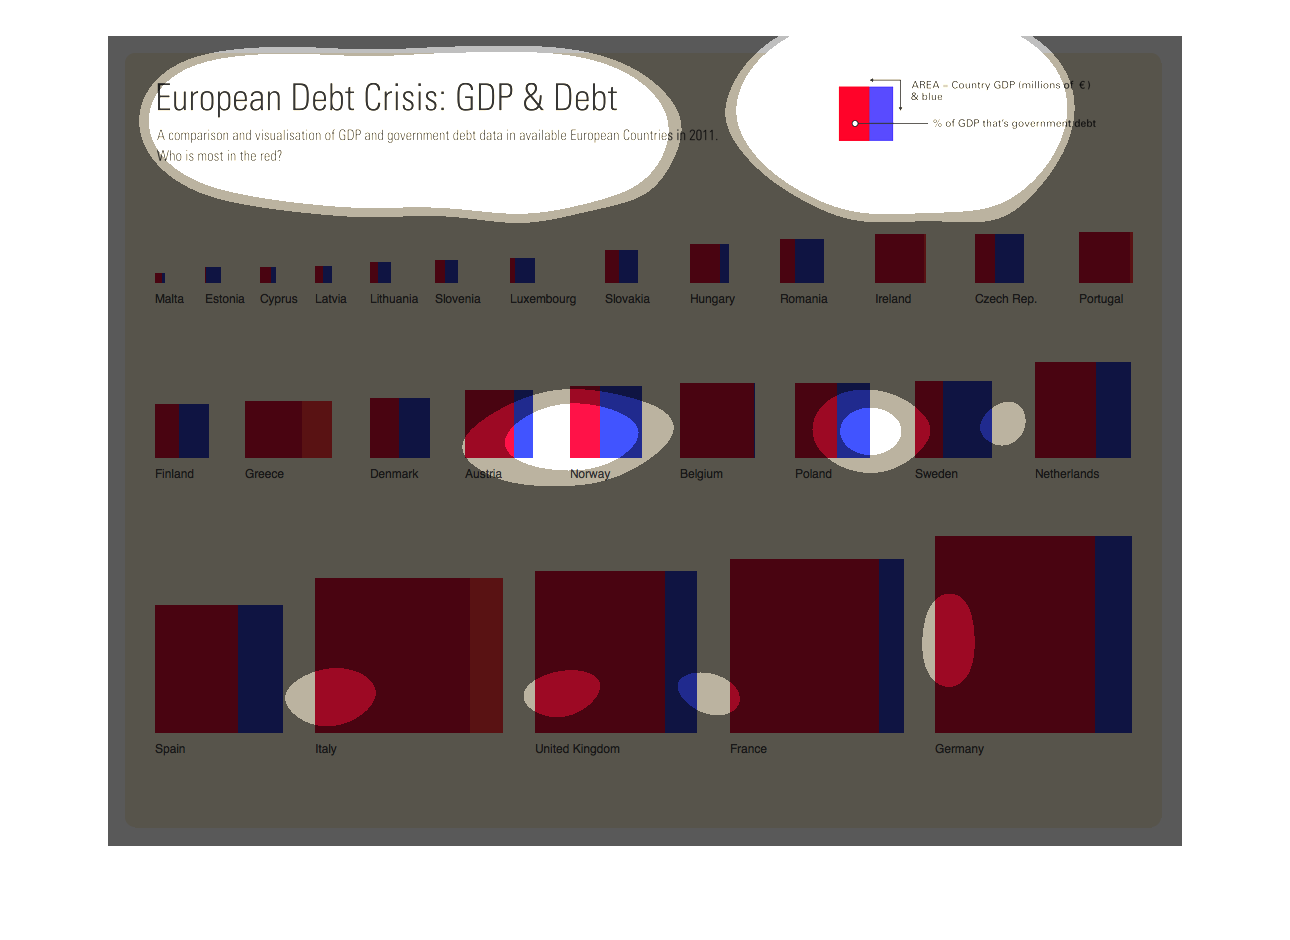
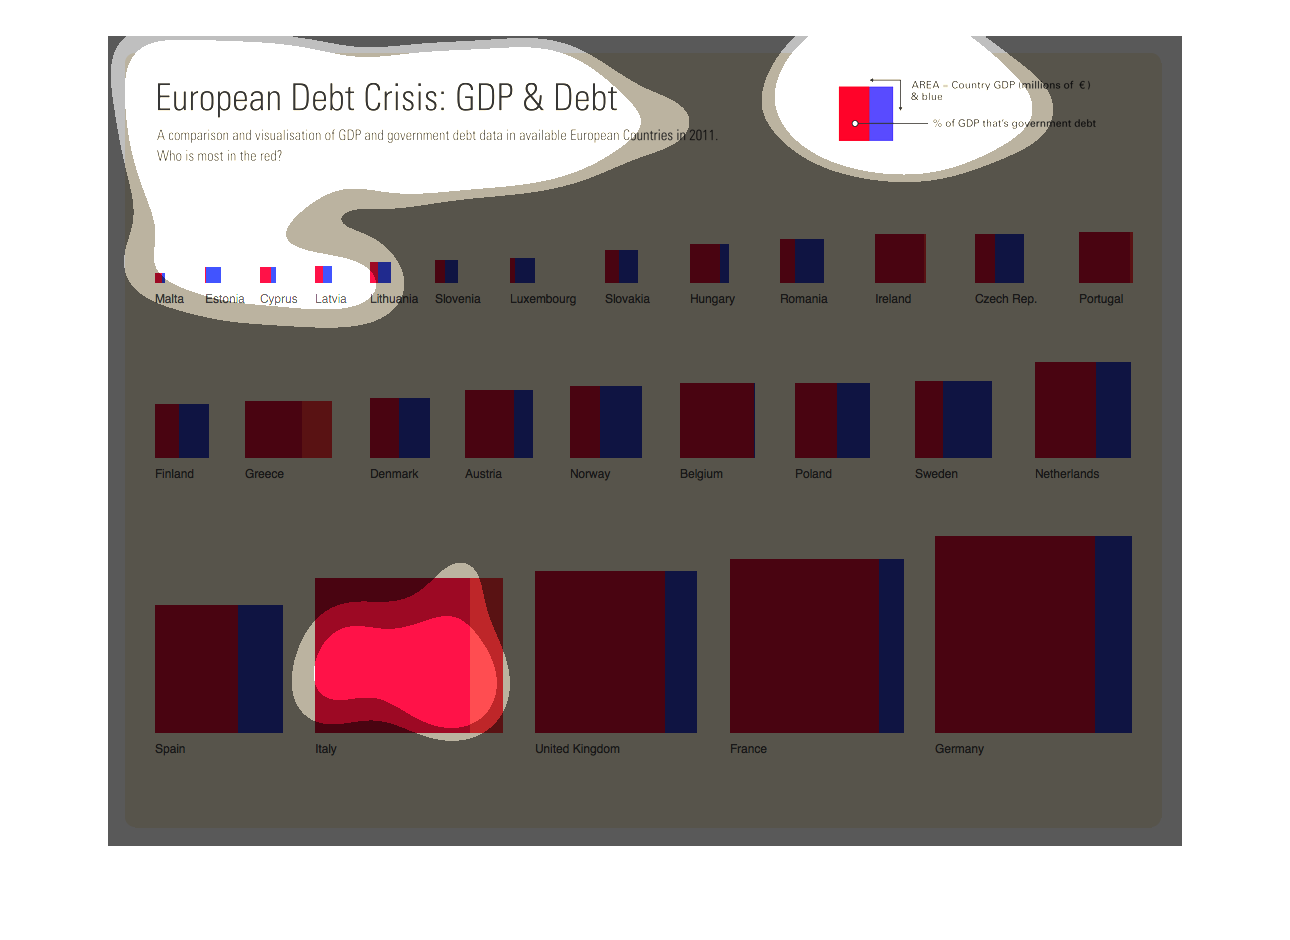
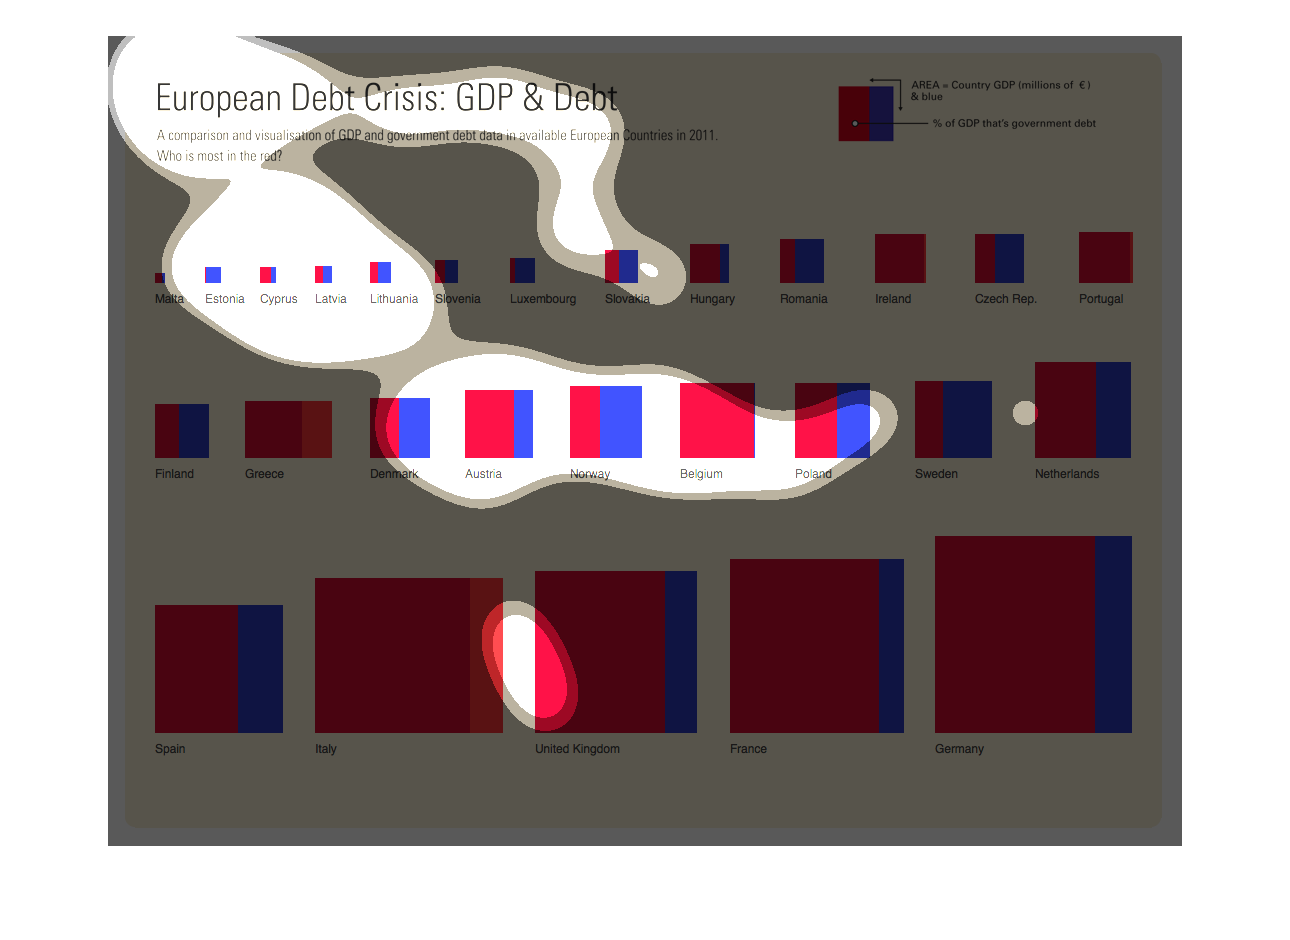
The chart is about Global GDP and debt in Europe. The blue blocks represent a country's GDP
and the red portion is the percentage of GDP that is debt. Countries such as Italy, Belgium,
and Greece meet or exceed their GDP value in debt.
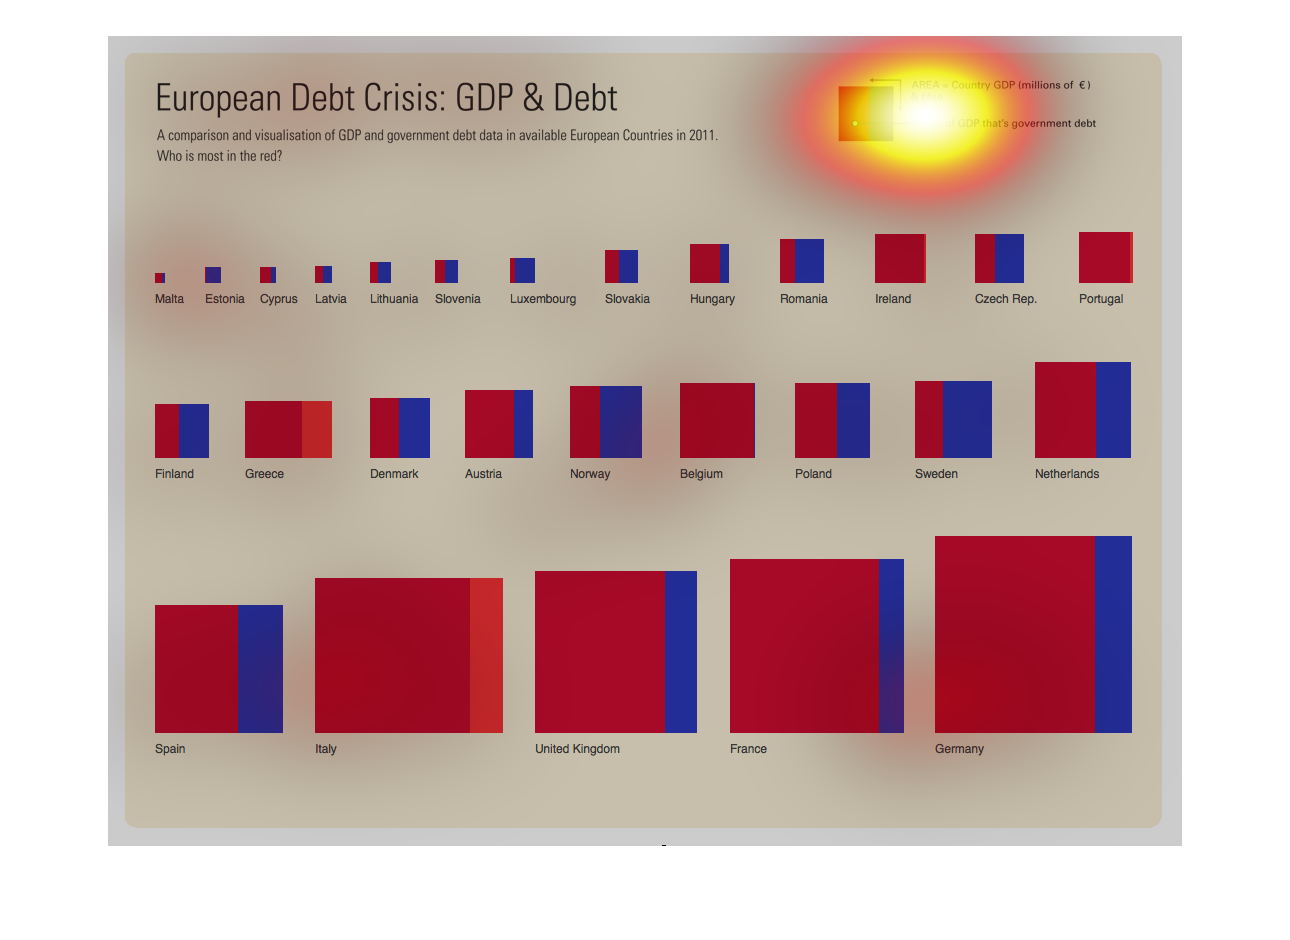
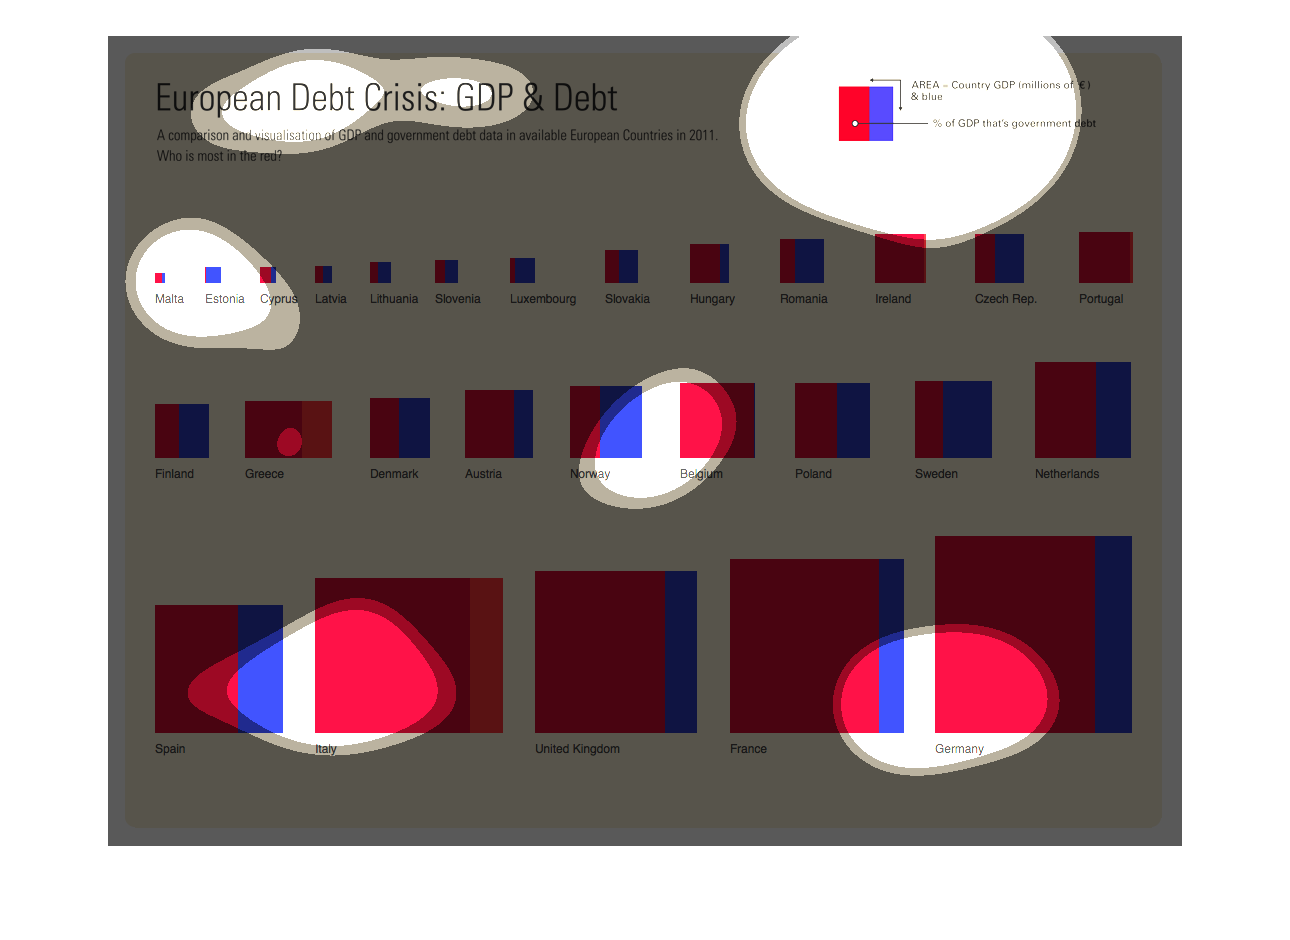
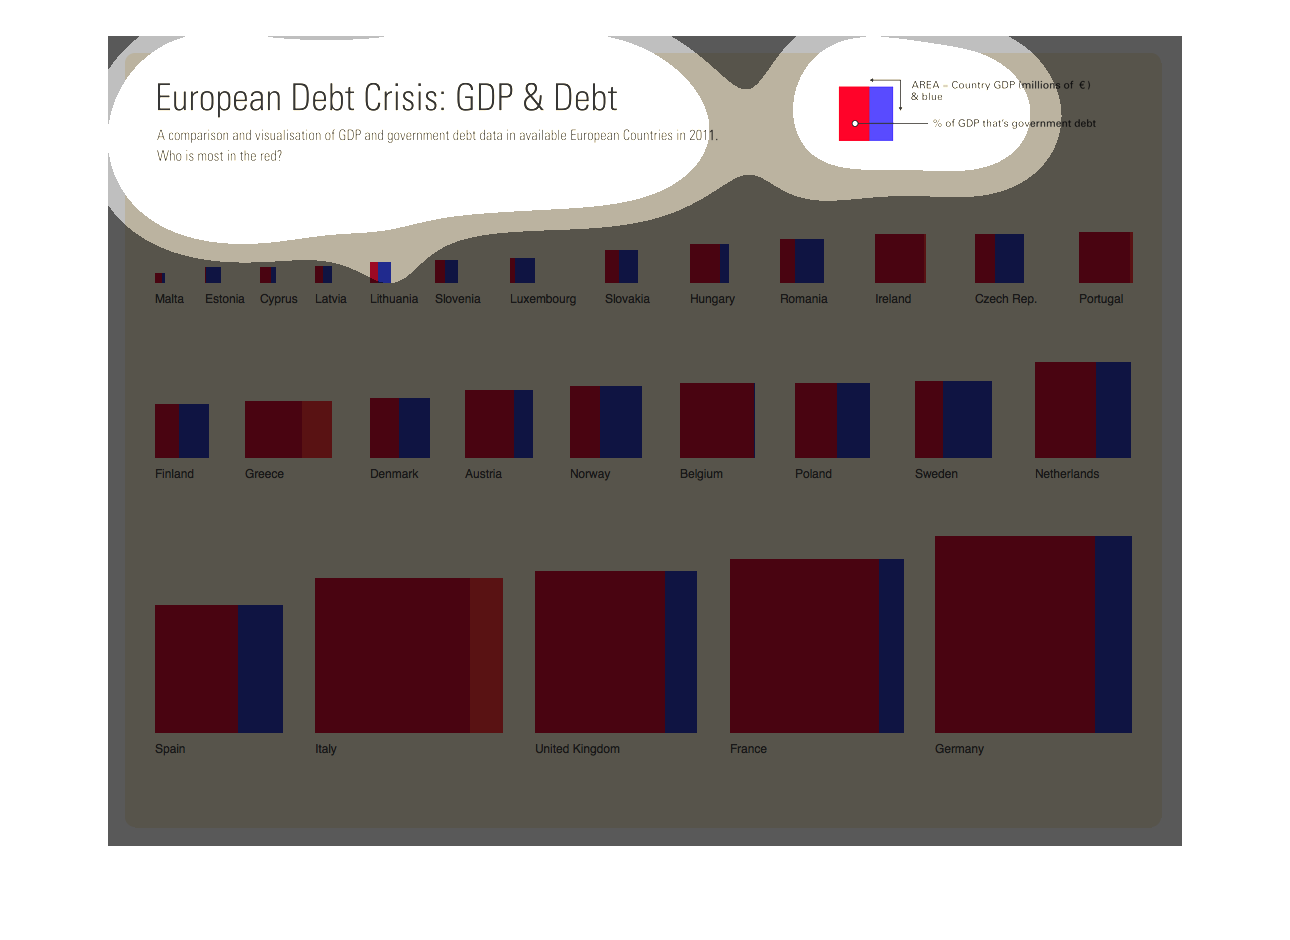
This chart describes and depicts the European debt   crisis, the GDP as well as the debt
for a multitude of   different countries located in Europe.
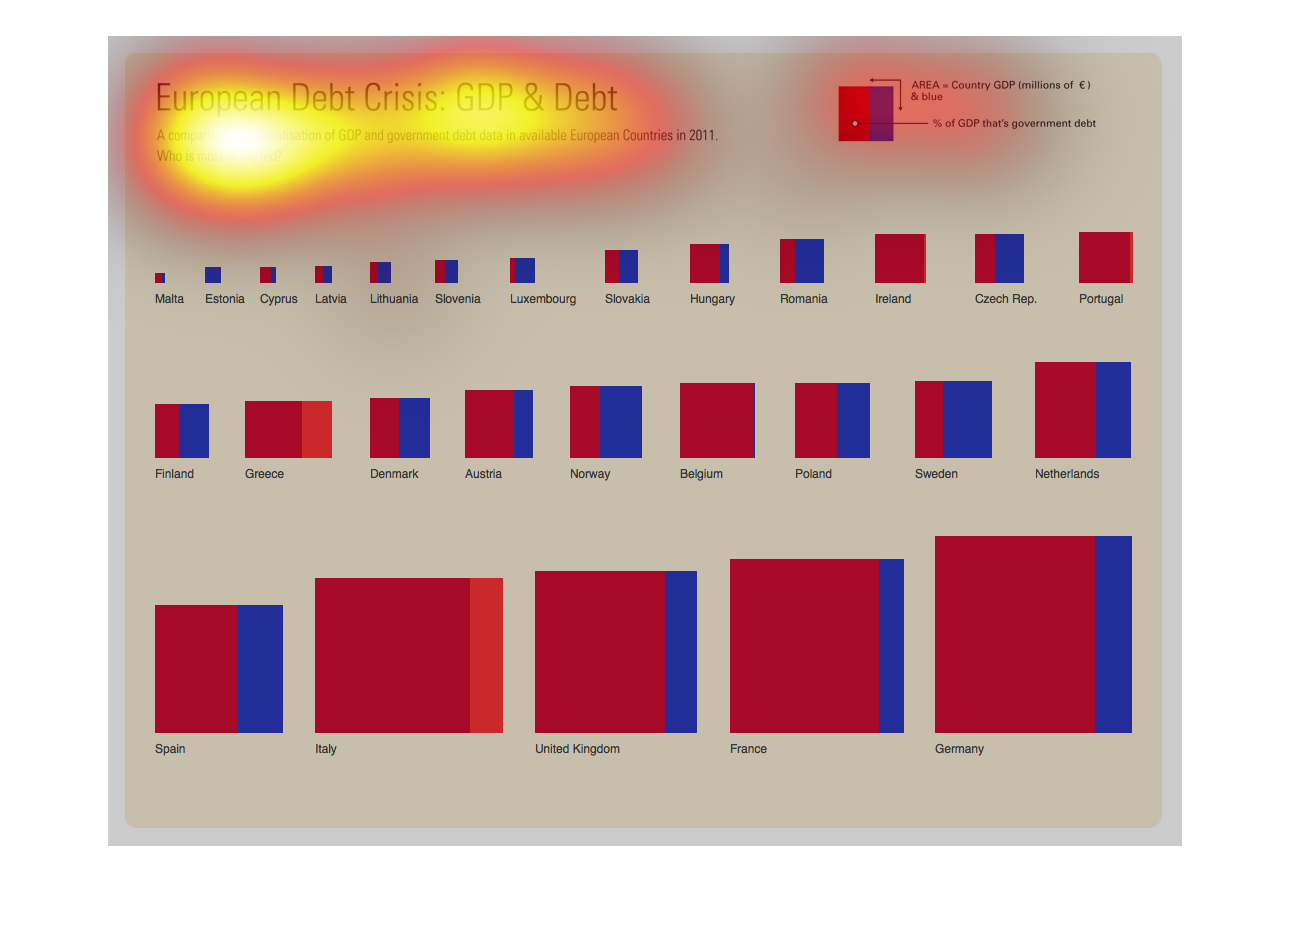
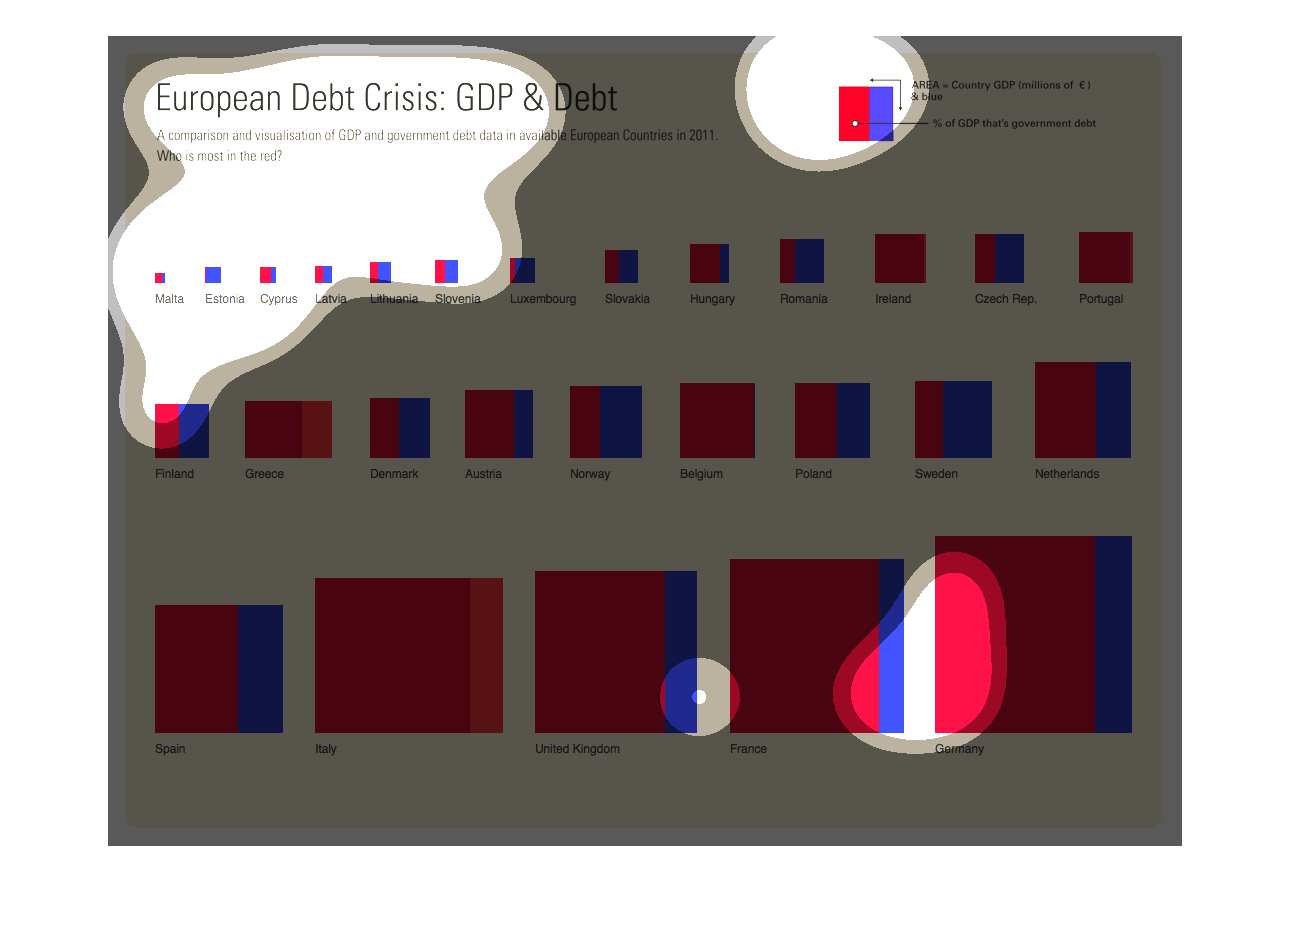
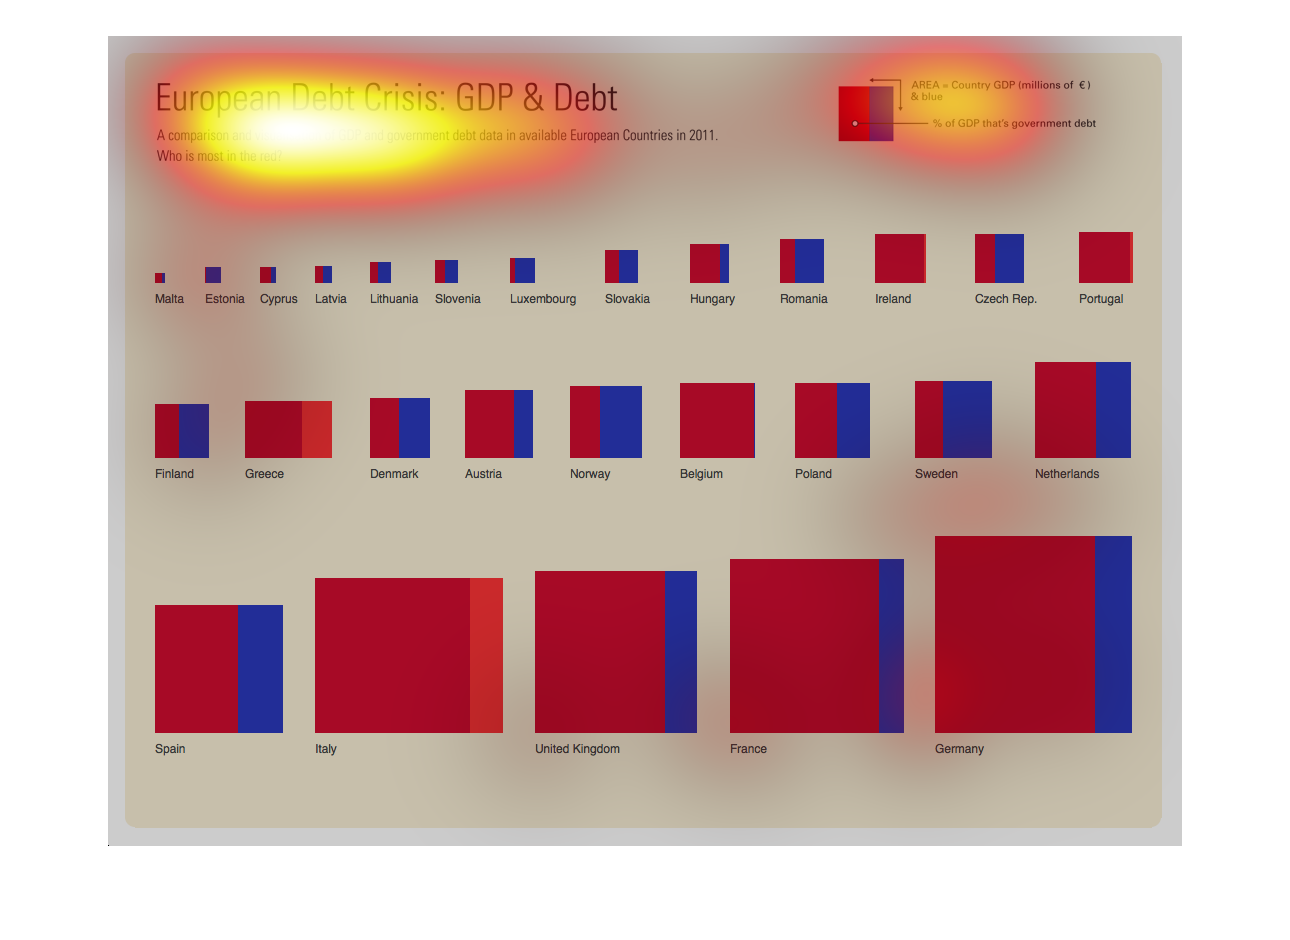
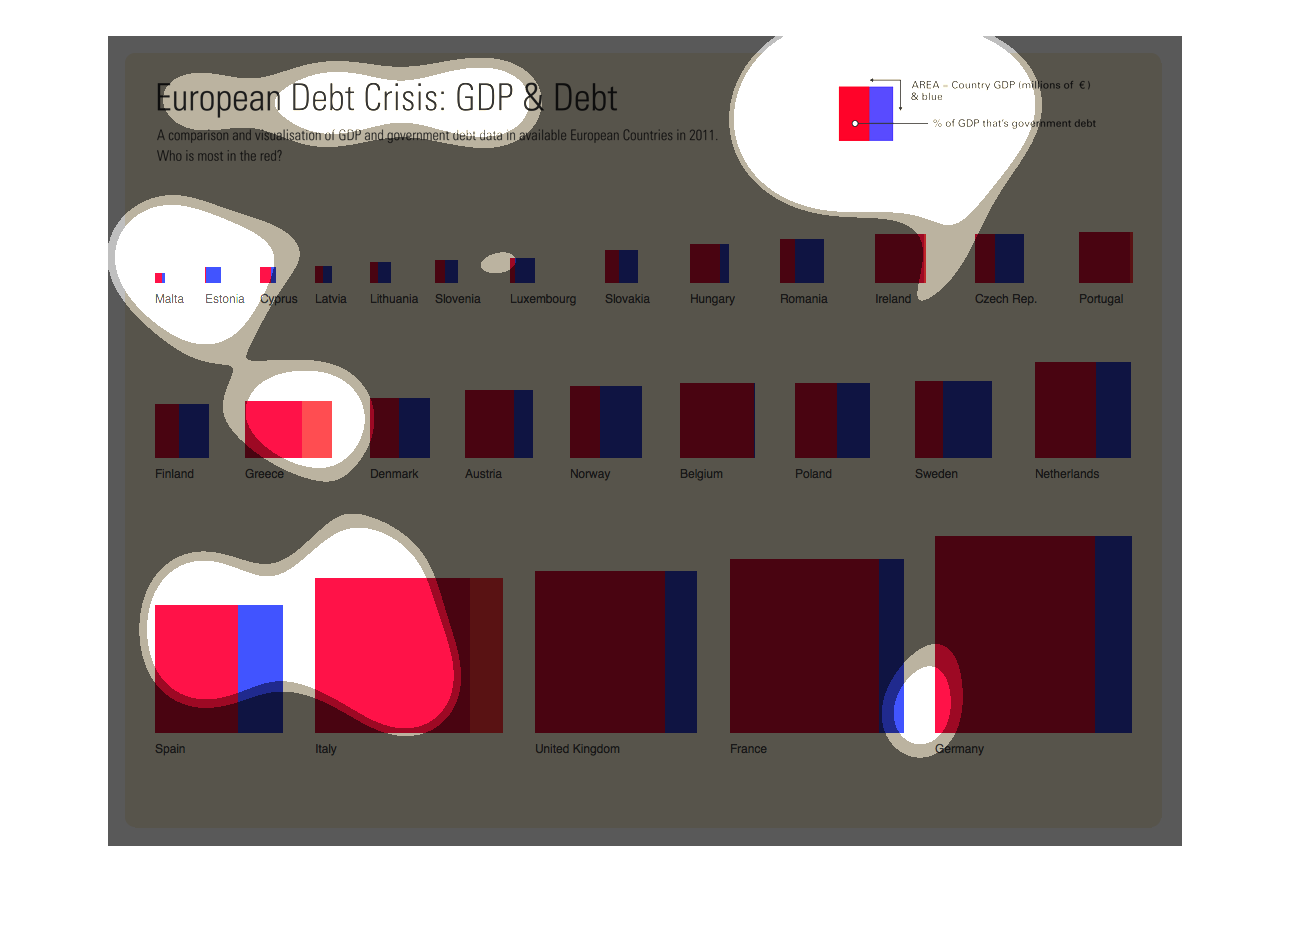
The following chart breaks down the European debt crisis. It labels the countries from most
debt to small debt. The bigger the square the more debt of a country. The debt Is broken down
by government debt and personal debt.
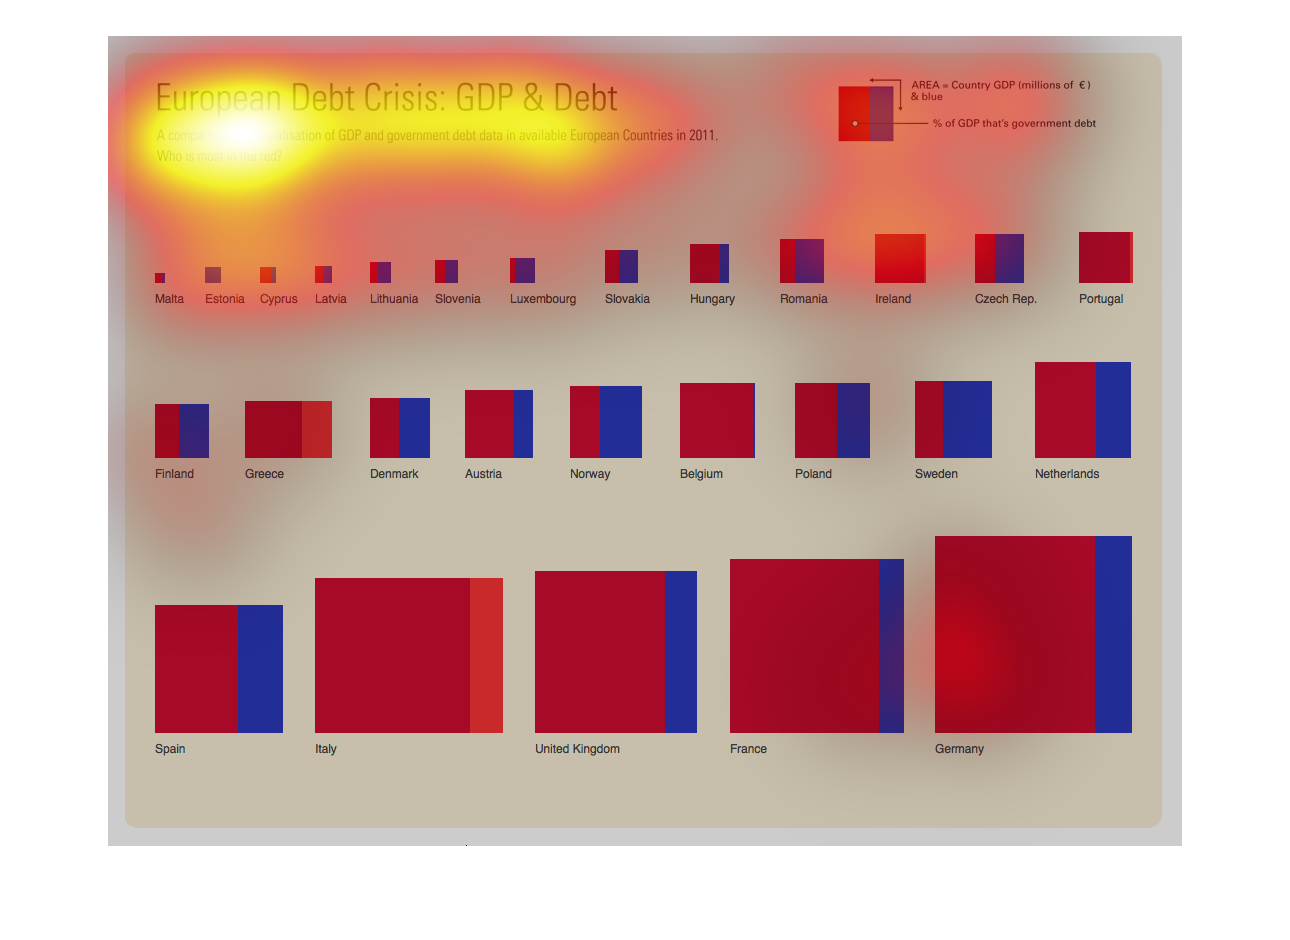
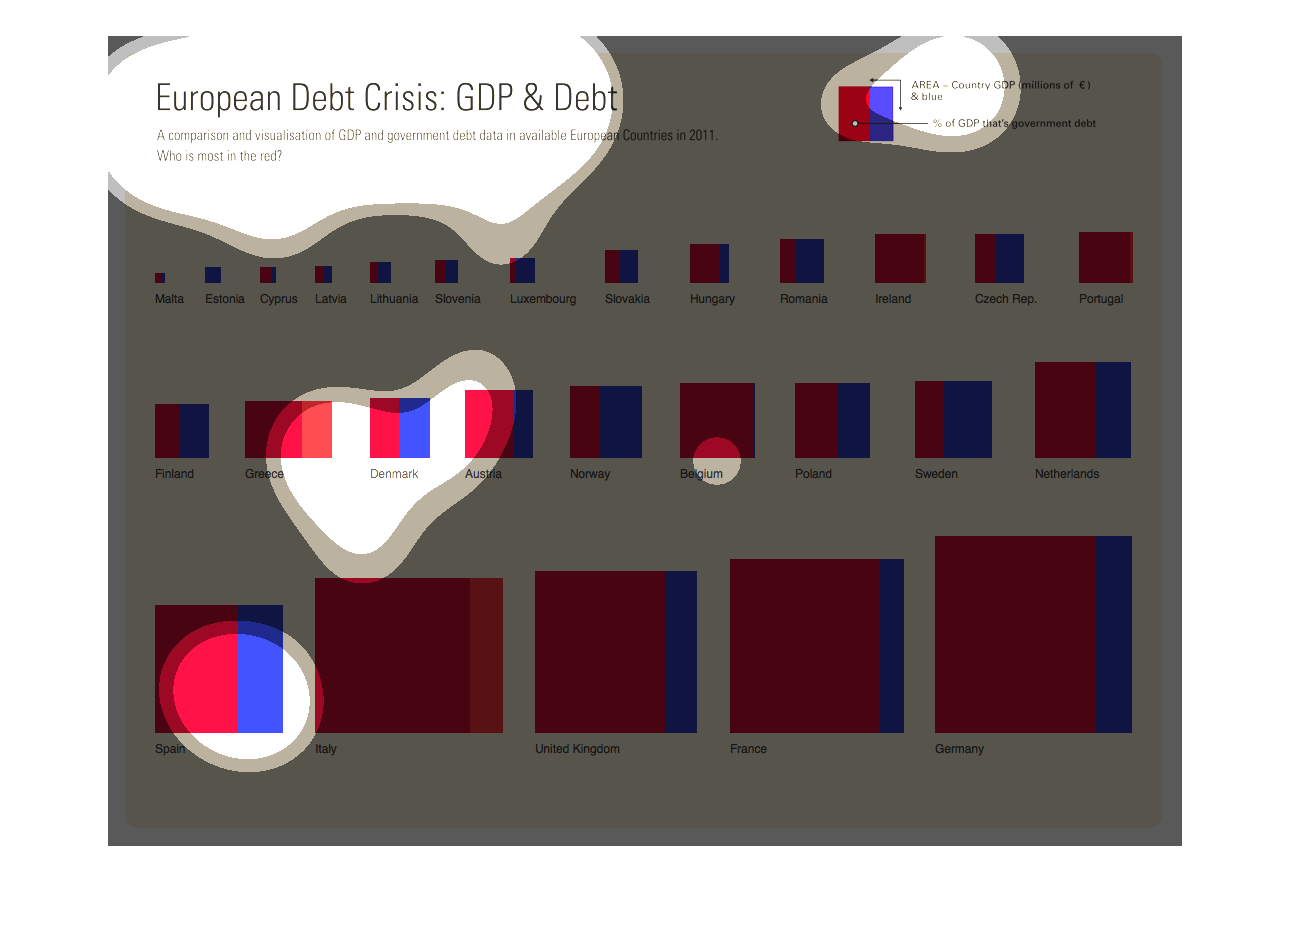
This chart covers the European debt crisis, GDP and debt. It shows a comparison and visualization
of GDP and government debt from data available in 2011 for European countries. The aim of
this chart is to show which countries are in the red.
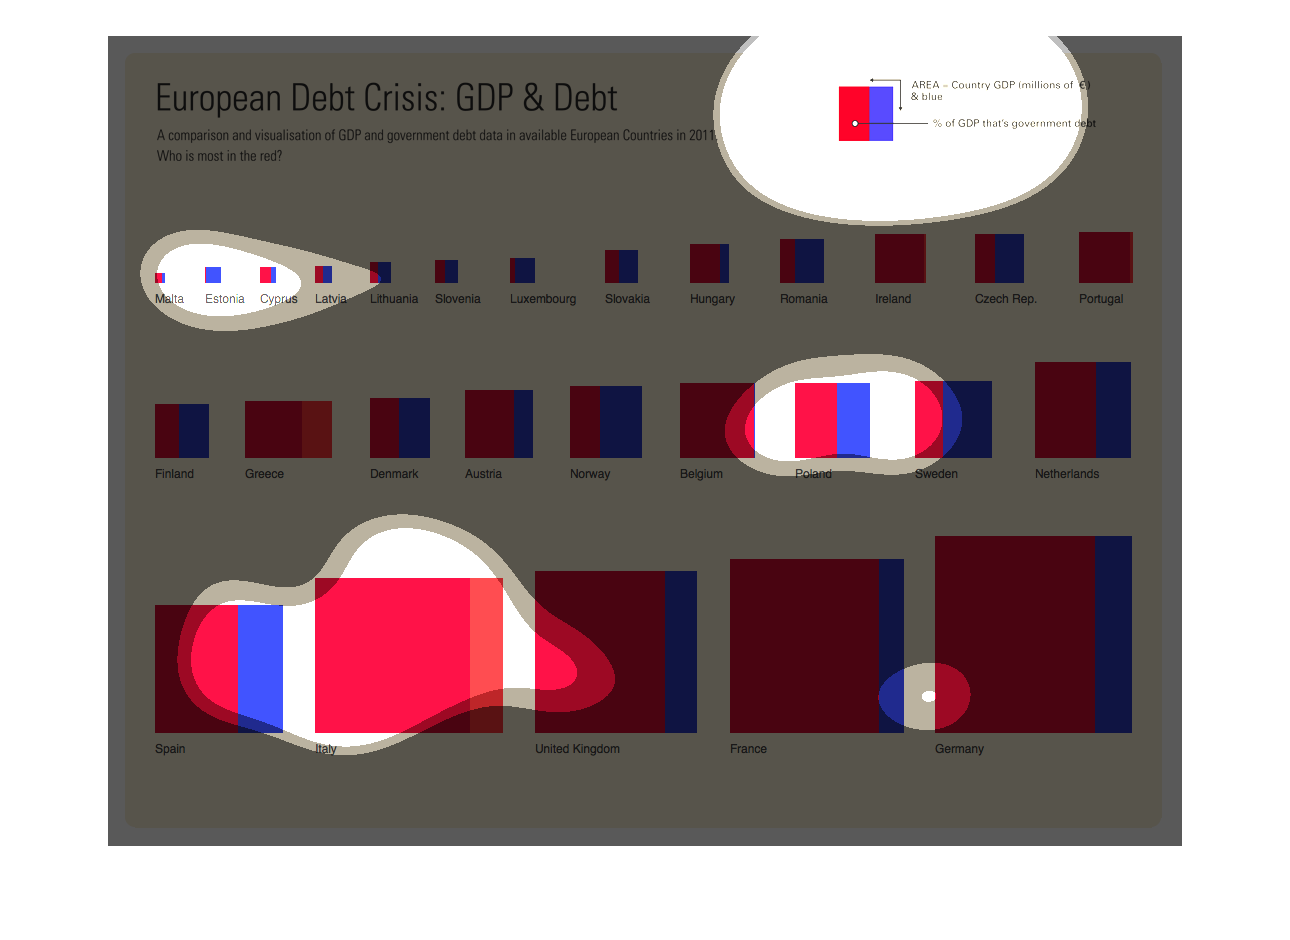
This chart is titled European debt crisis: GDP & debt. Some of the countries listed are: Italy,
The UK,  France, and Spain. This was a very educational chart.
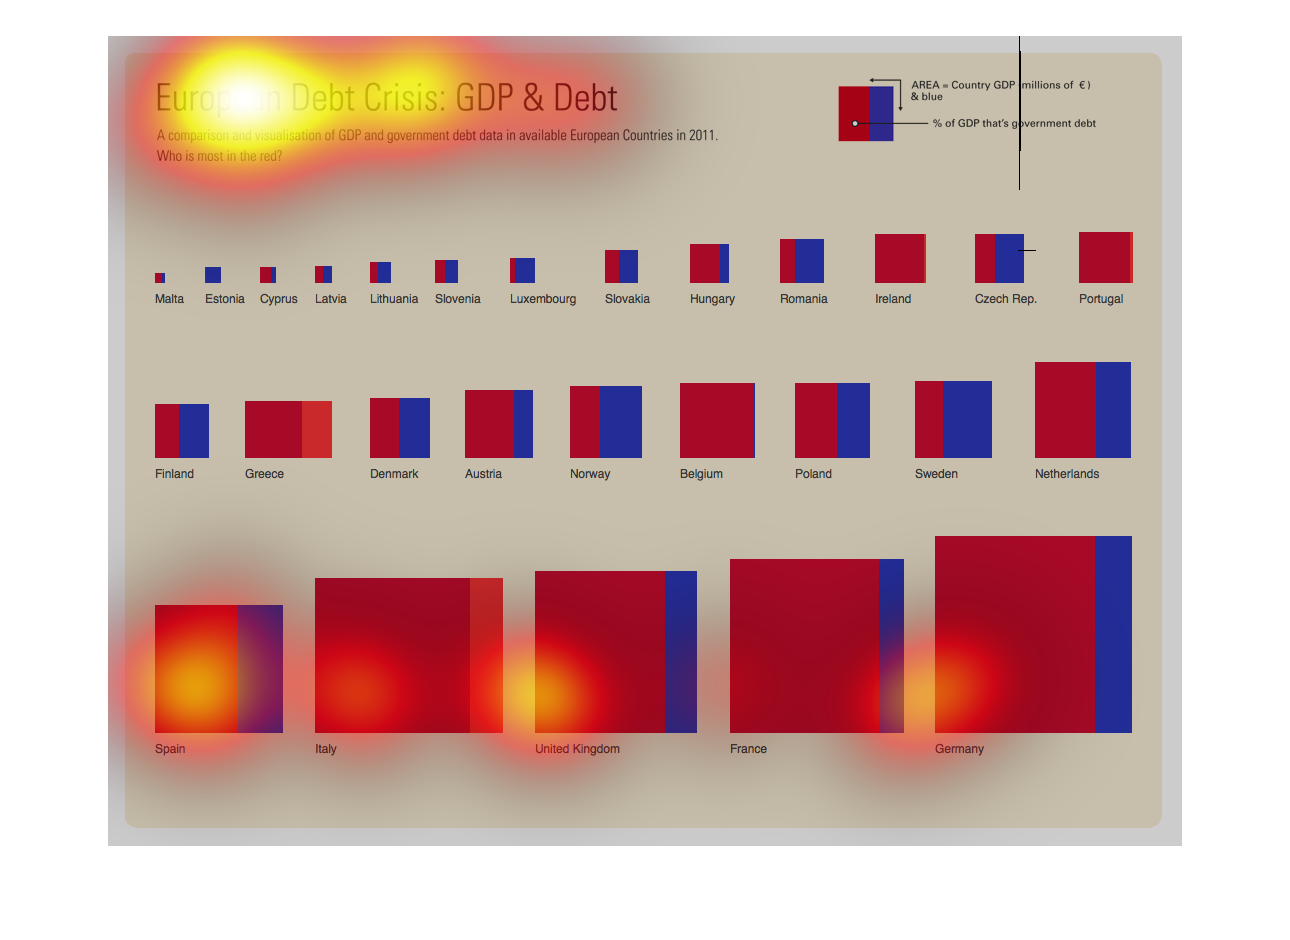
This chart describes the ongoing European Debt Crisis during the year 2011. It depicts the
GDP of each country by billions of European dollars and compares the percent of debt by country..
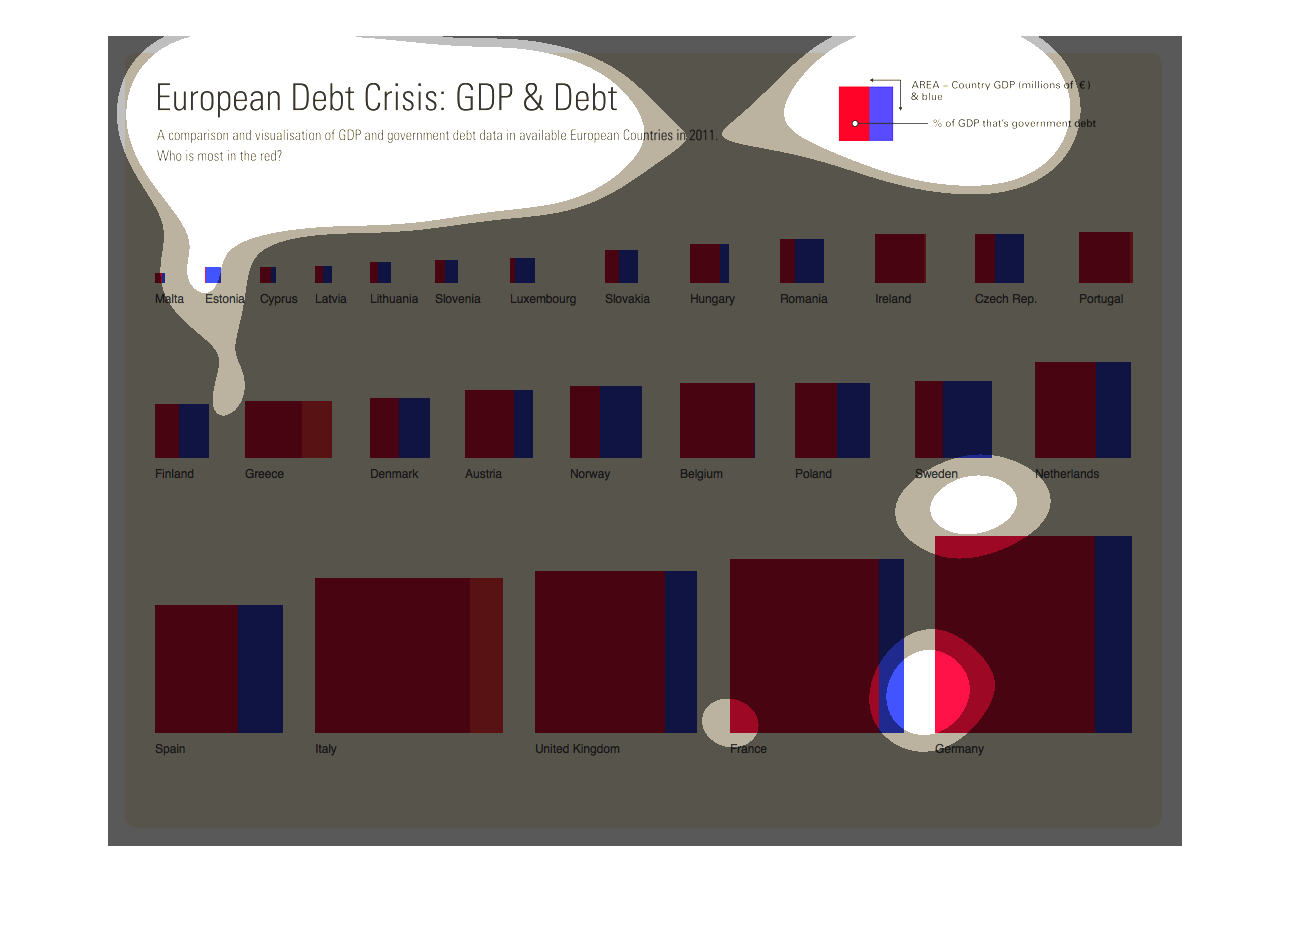
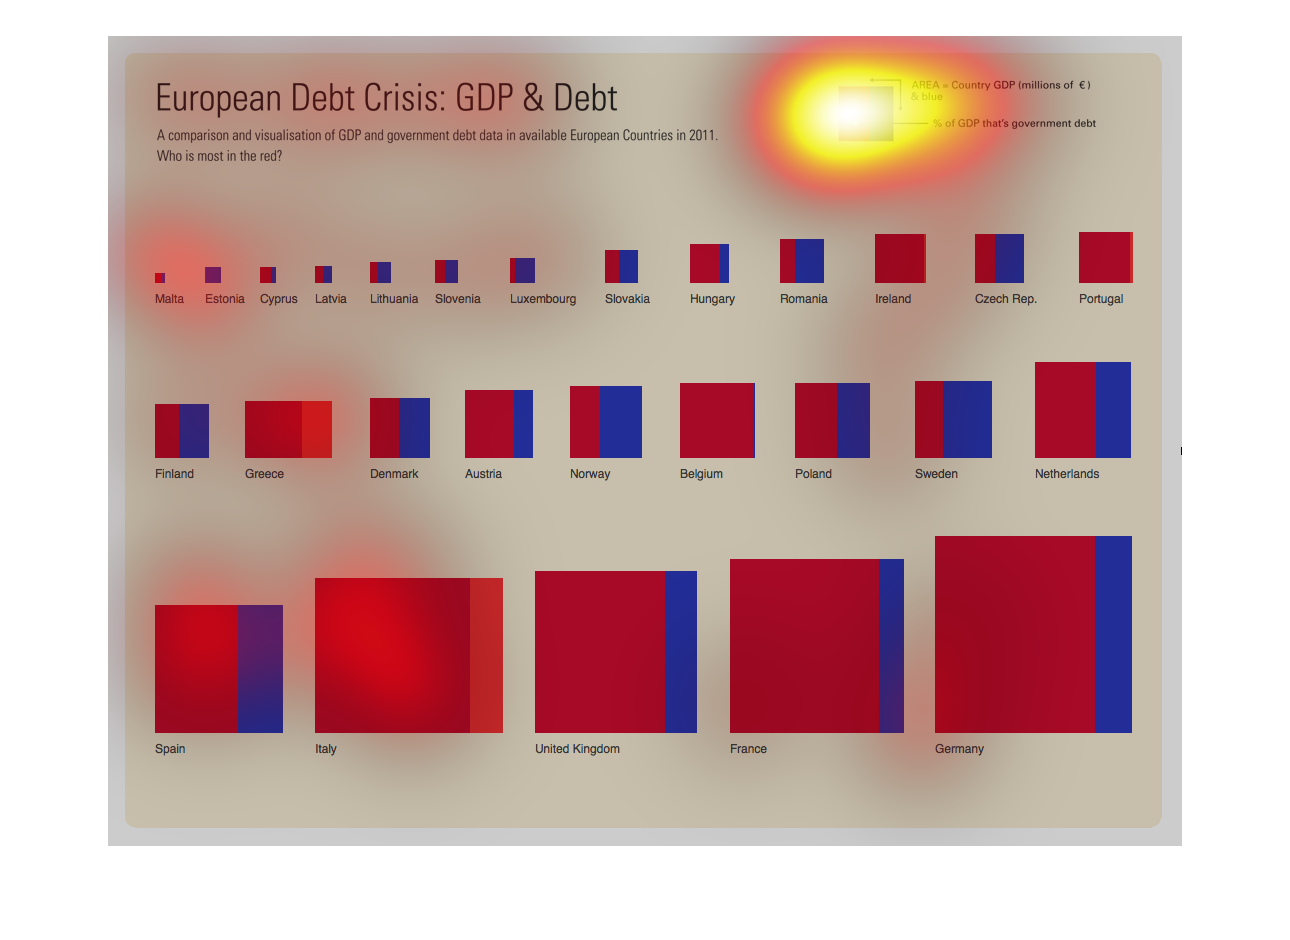
This graph illustrates the European debt crisis - GDP and debt.  France and Germany have the
highest figures and Estonia has one of the lowest figures.
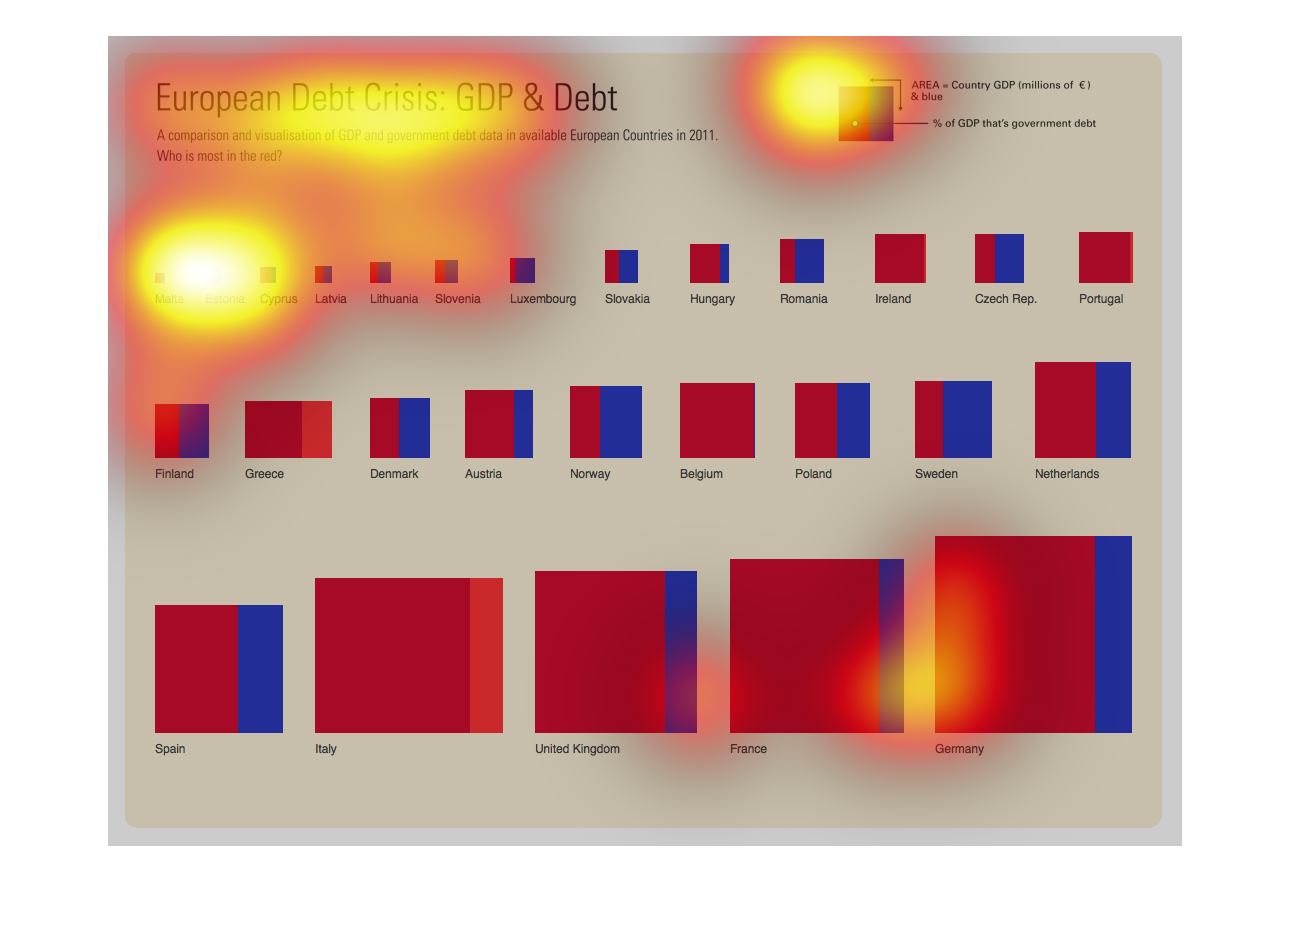
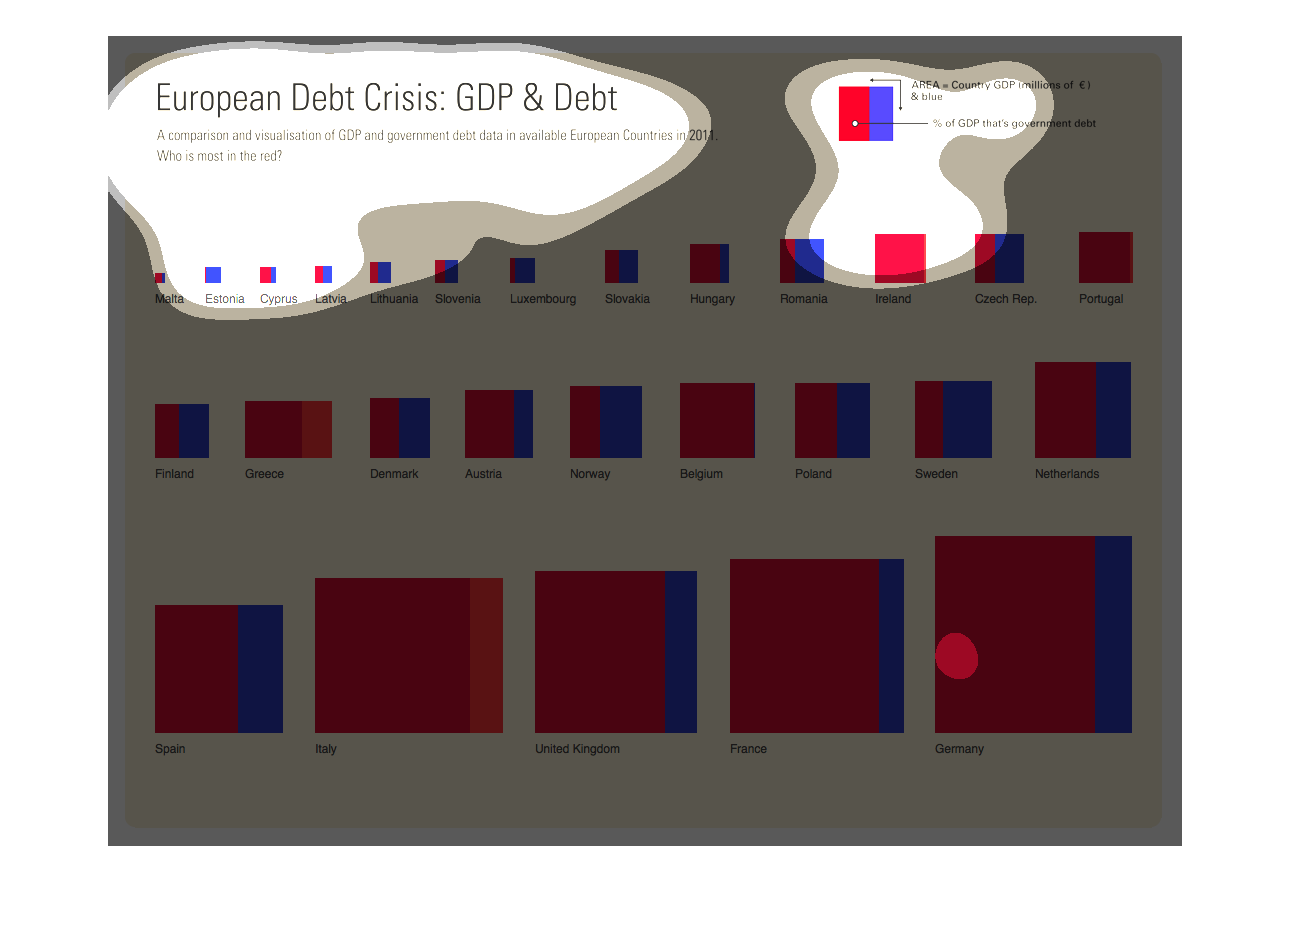
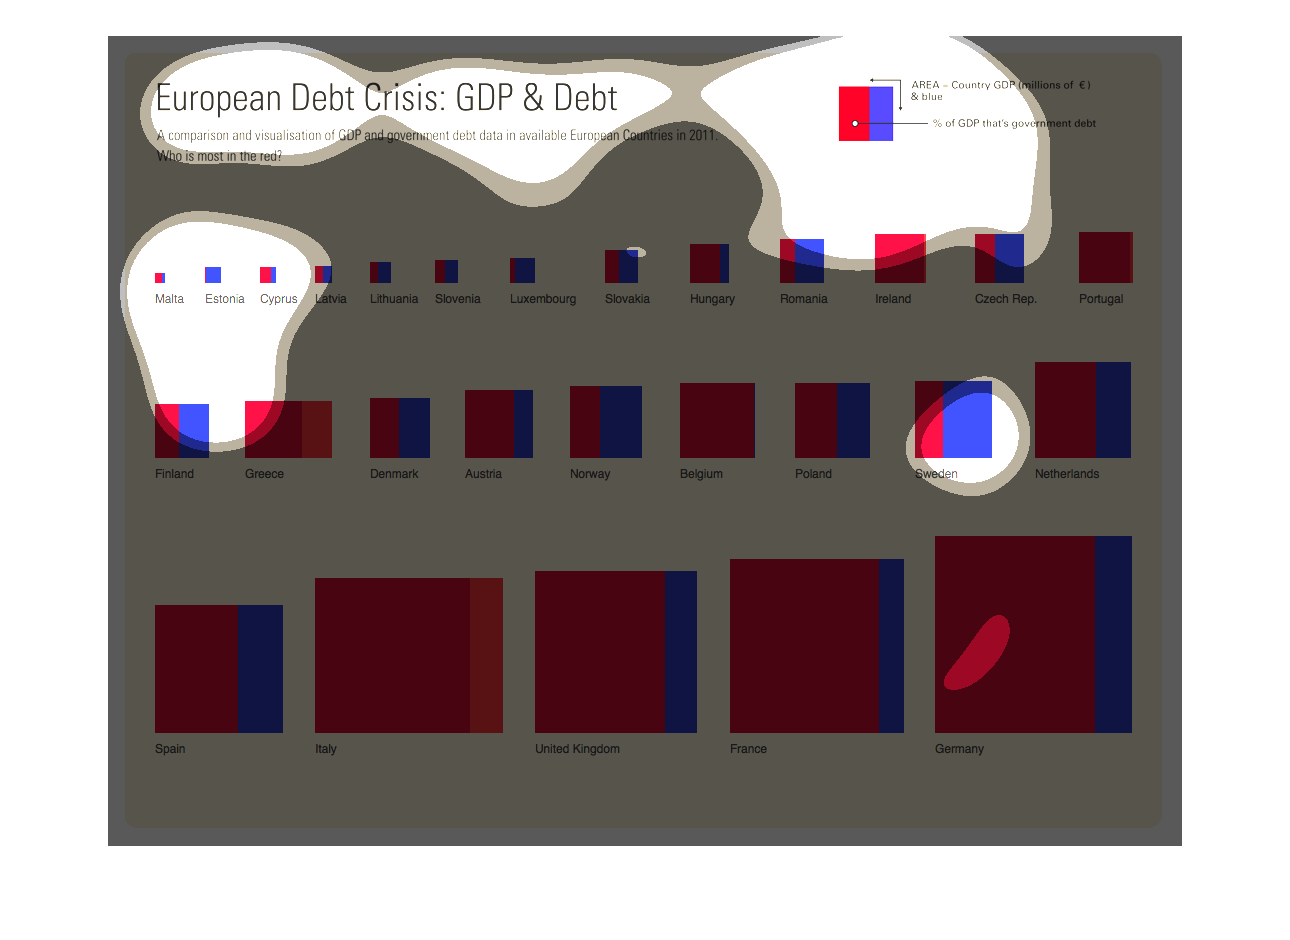
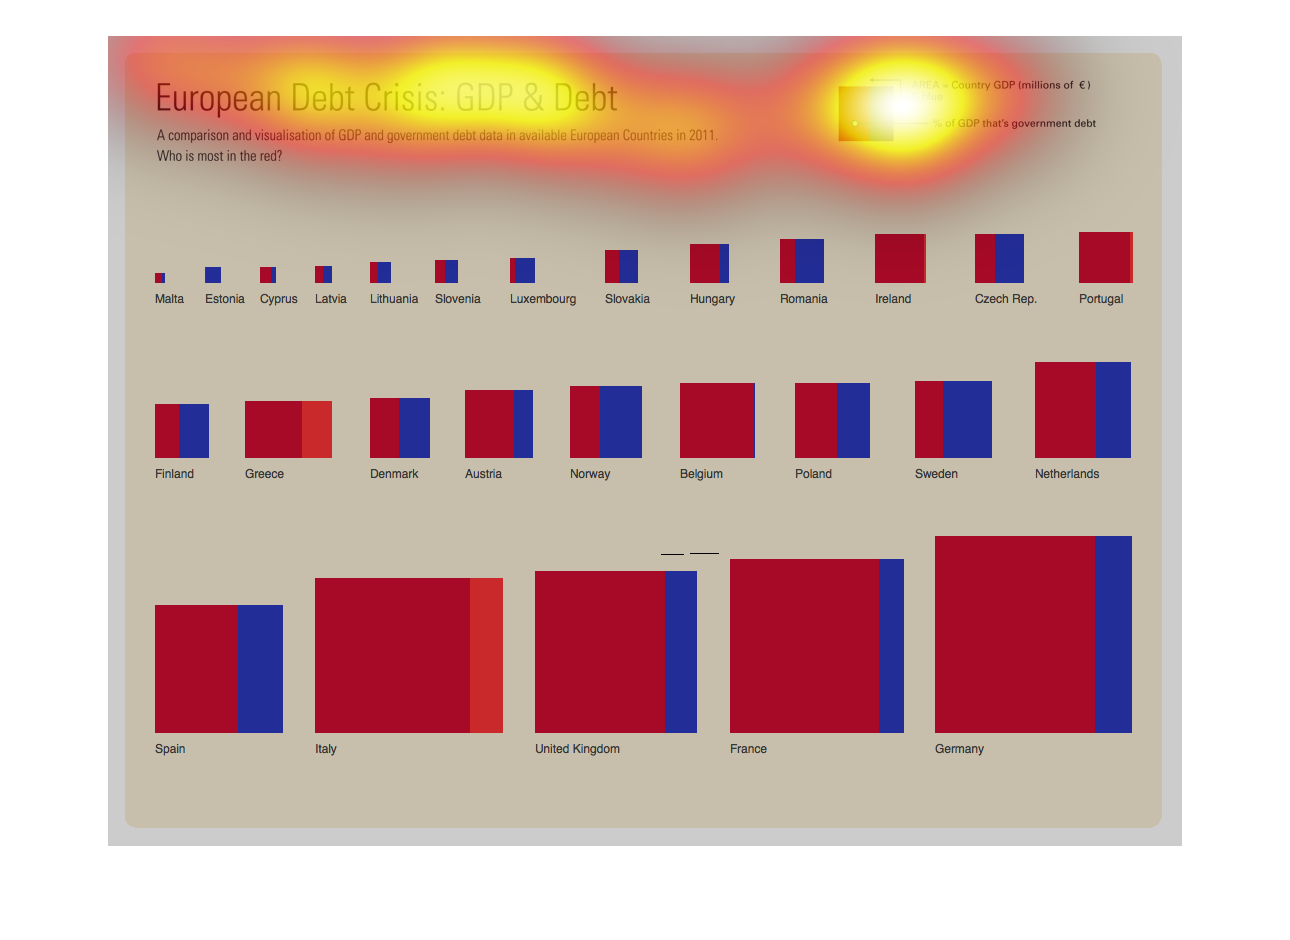
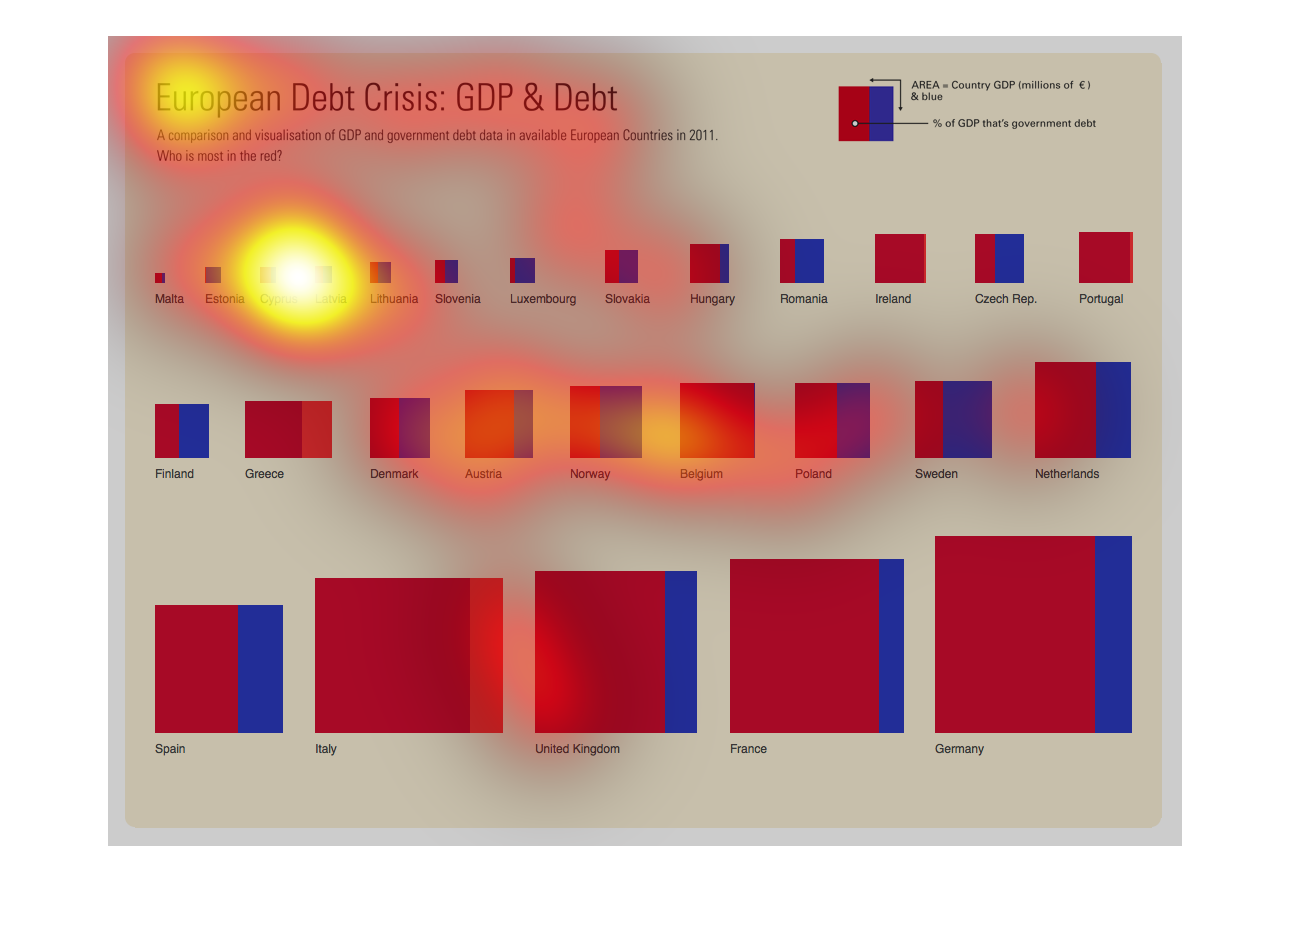
The image describes the European Debt Crisis by creating a comparison and visualization of
GDP and governmental debt data in available European countries in 2011. The overall pattern
shows governmental debt increasing and overtaking individual country GDP, with Western European
countries struggling with larger debt to GDP ratios.
This graphic shows a comparison and visualisation of GDP and government debt data in European
countries. Germany tops the list with the most government debt followed by France and the
UK.
This Graph shows the European Debt Crisis: GDP & Debt.  A comparison and visualization of
Government Debt data in available European Countries in 2001.  Multiple European countries
are compared with the size of the block being the size of the economy.
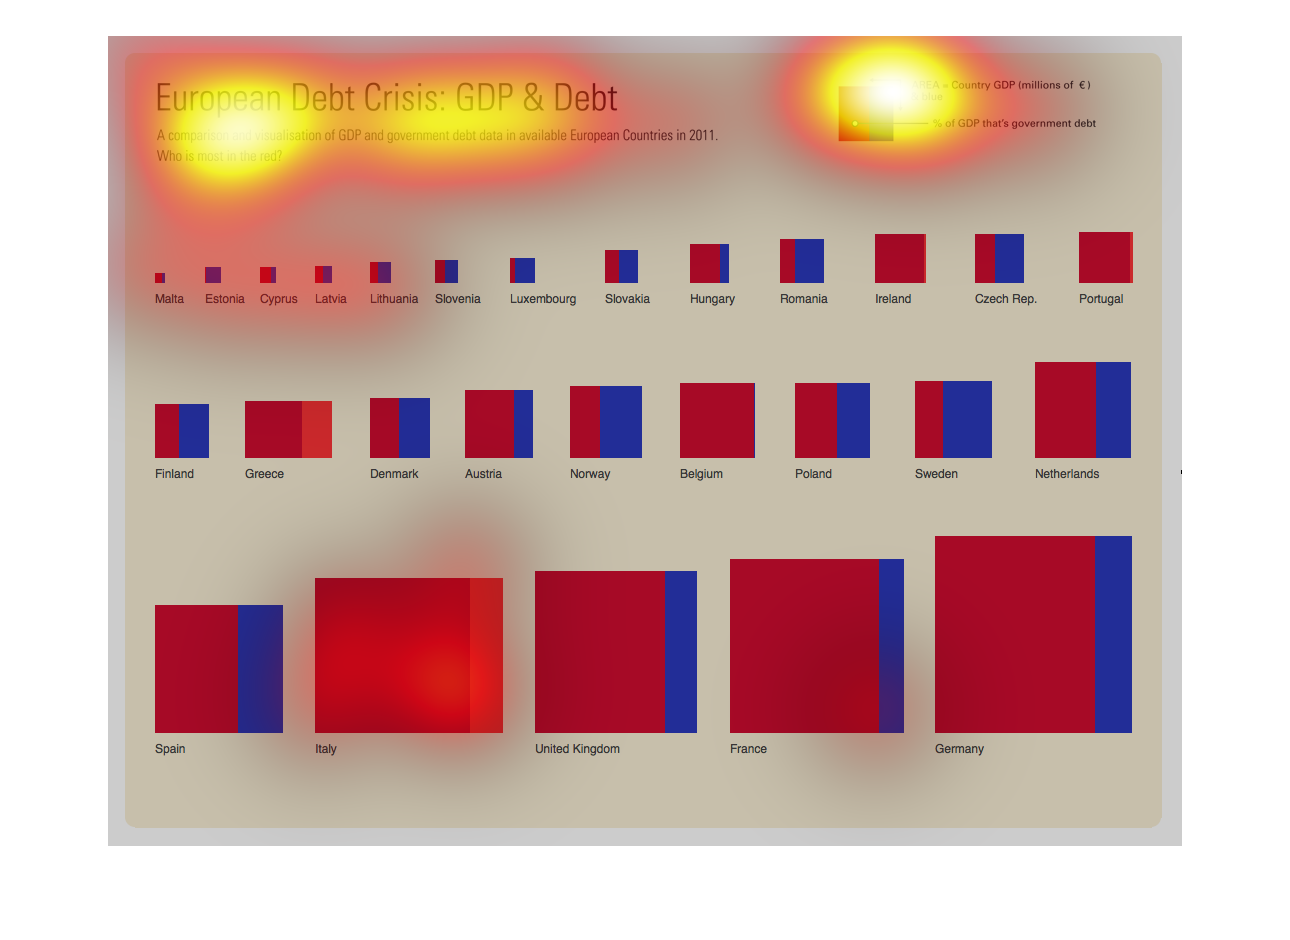
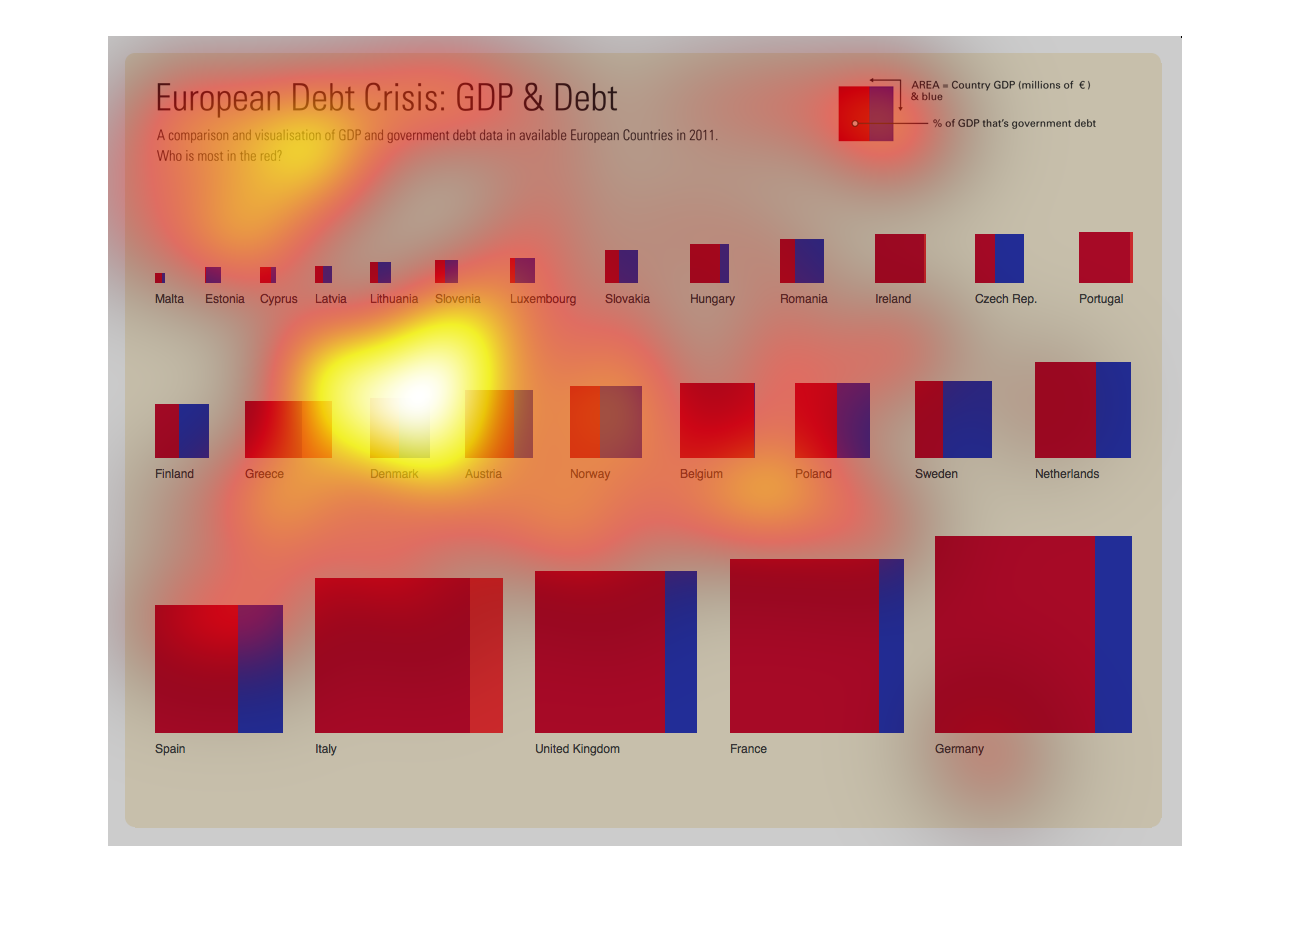
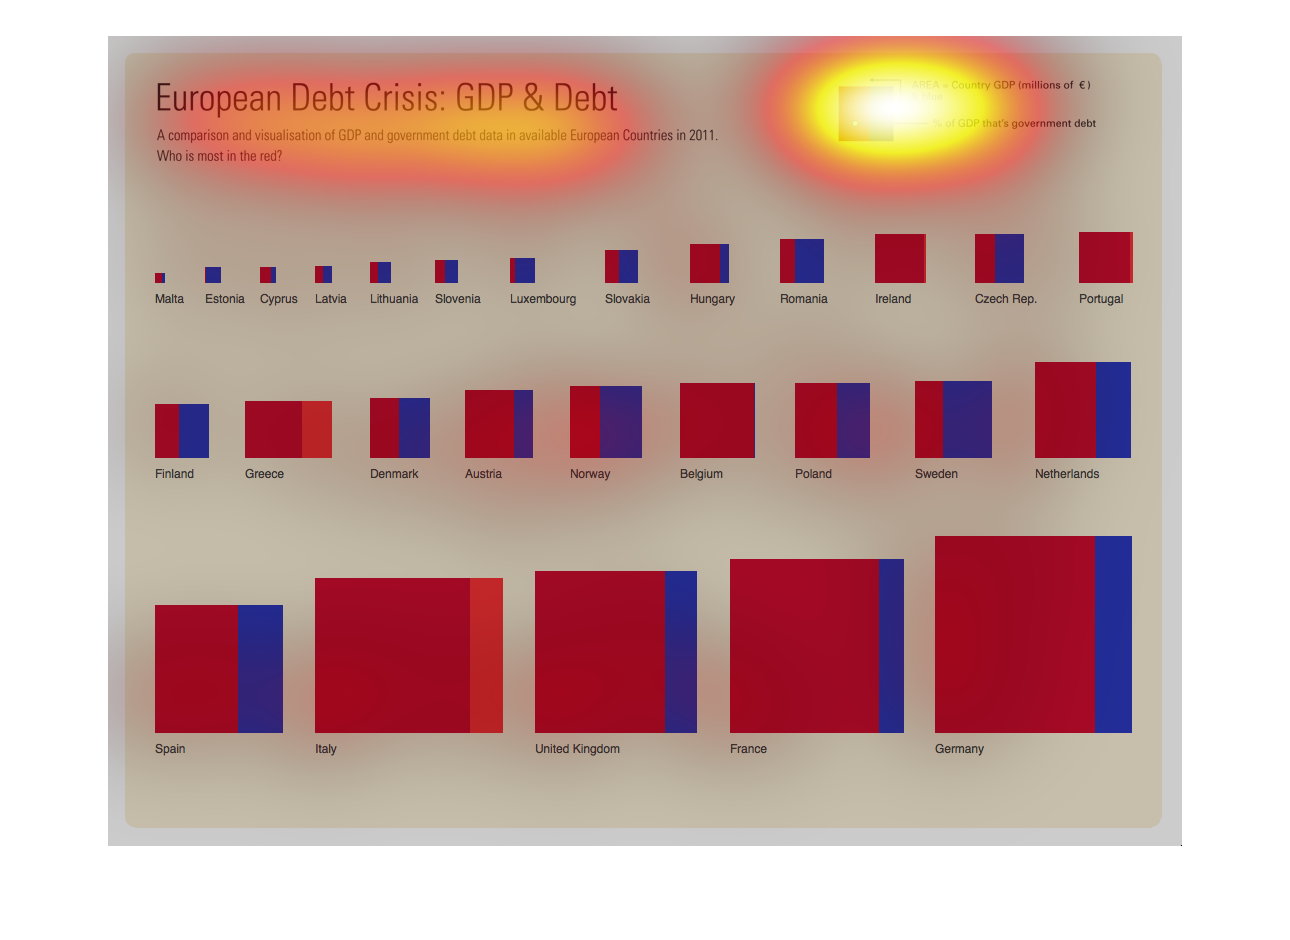
This looks at GDP and Debt in Europe. The graph shows the size of GDP overall proportionally,
and the blue shows how much of the GDP the debt is. The highest-indebted countries (proportionally)
are Estonia, Sweden, and the Czech Republic.
This chart describes European debt crisis: GDP and Debt. Countries represented on the chart
include Slovenia, Lithuania, Sweden, Hungary, Norway and the UK.
This describes the European debt crisis in terms of GDP. Some countries, like Italy, Spain,
Greece and Great Britain have a large portion of their GDP that's government debt.
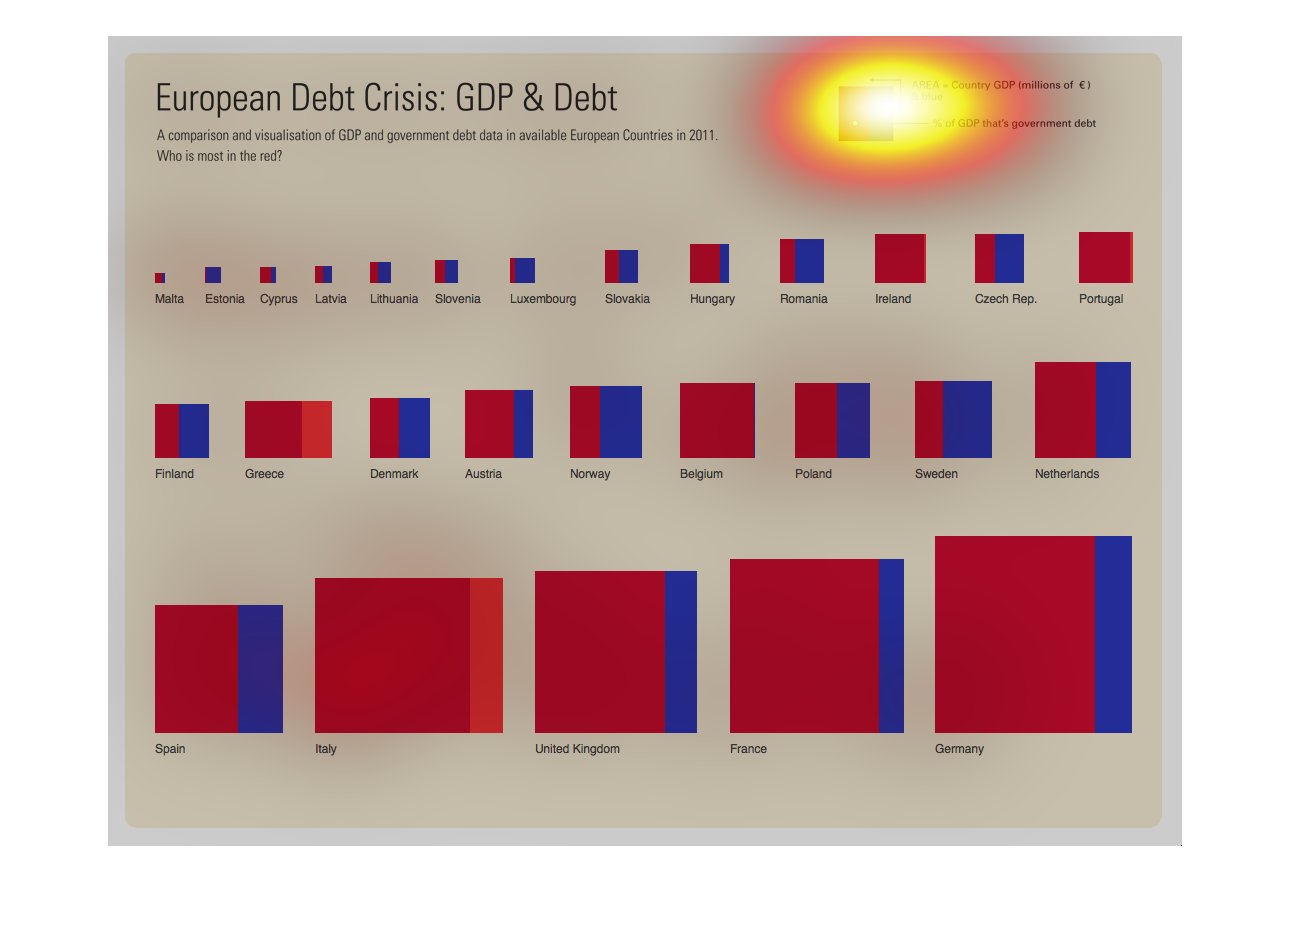
This chart shows European Debt Crisis: GDP and Debt. It shows data for 27 countries. It shows
a comparison and visualization of GDP and government debt data in available European Countries
in 2011.