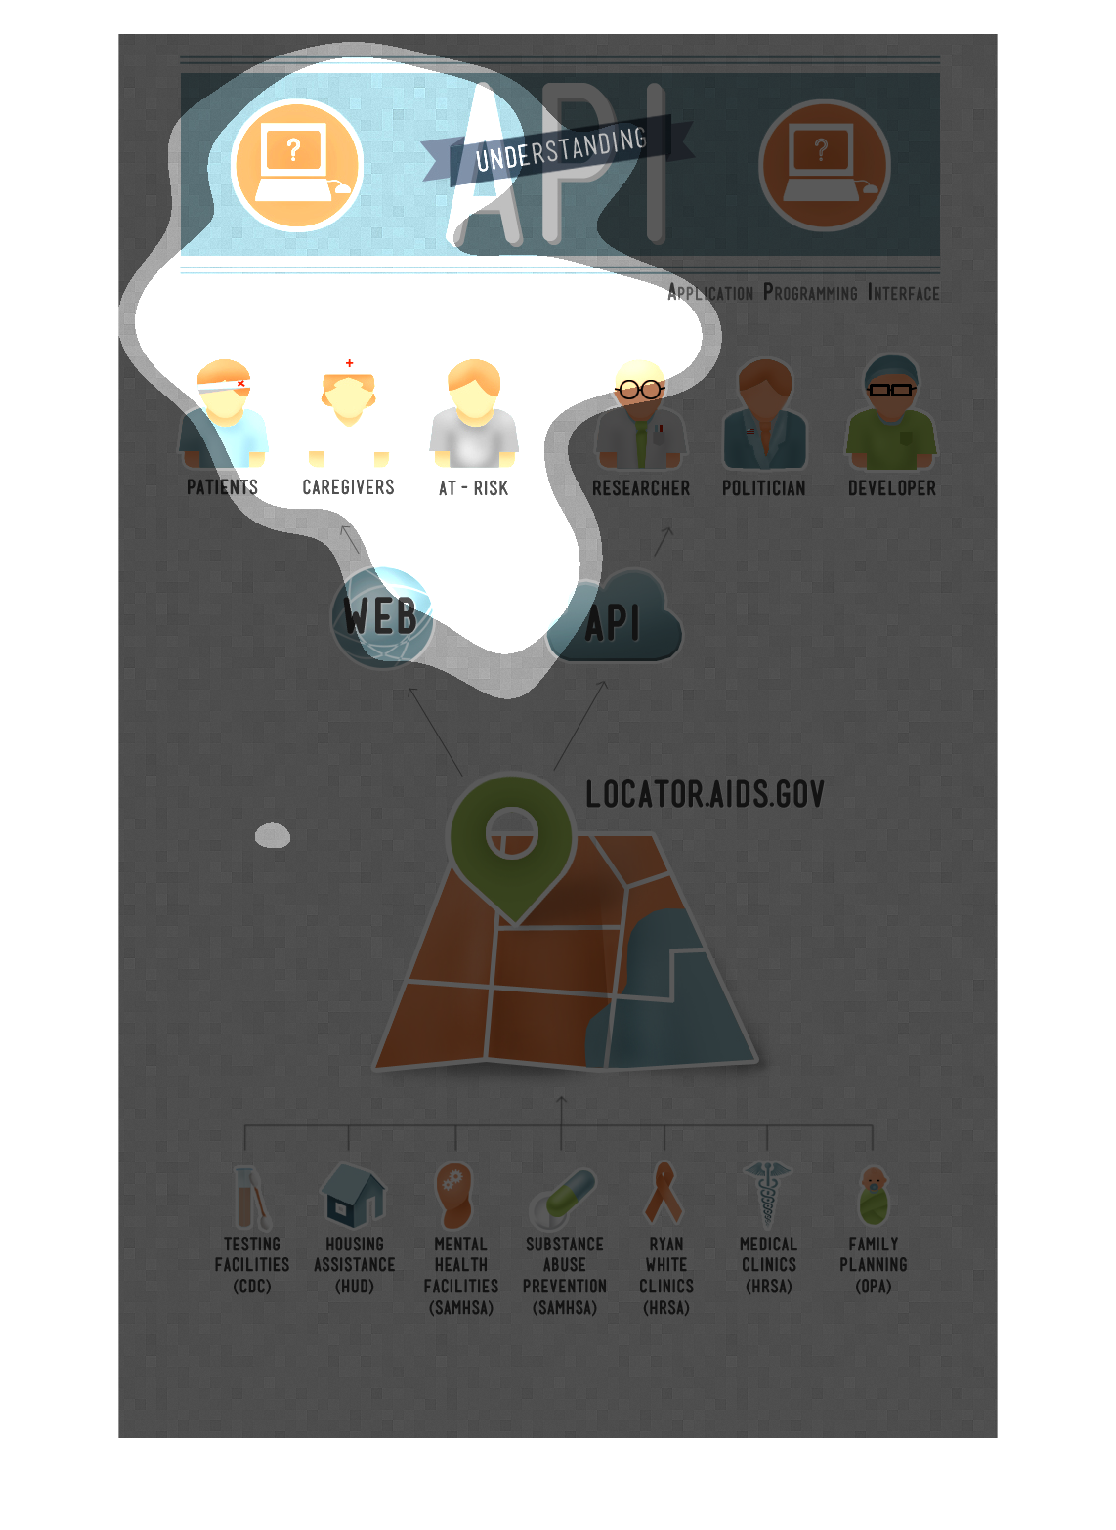
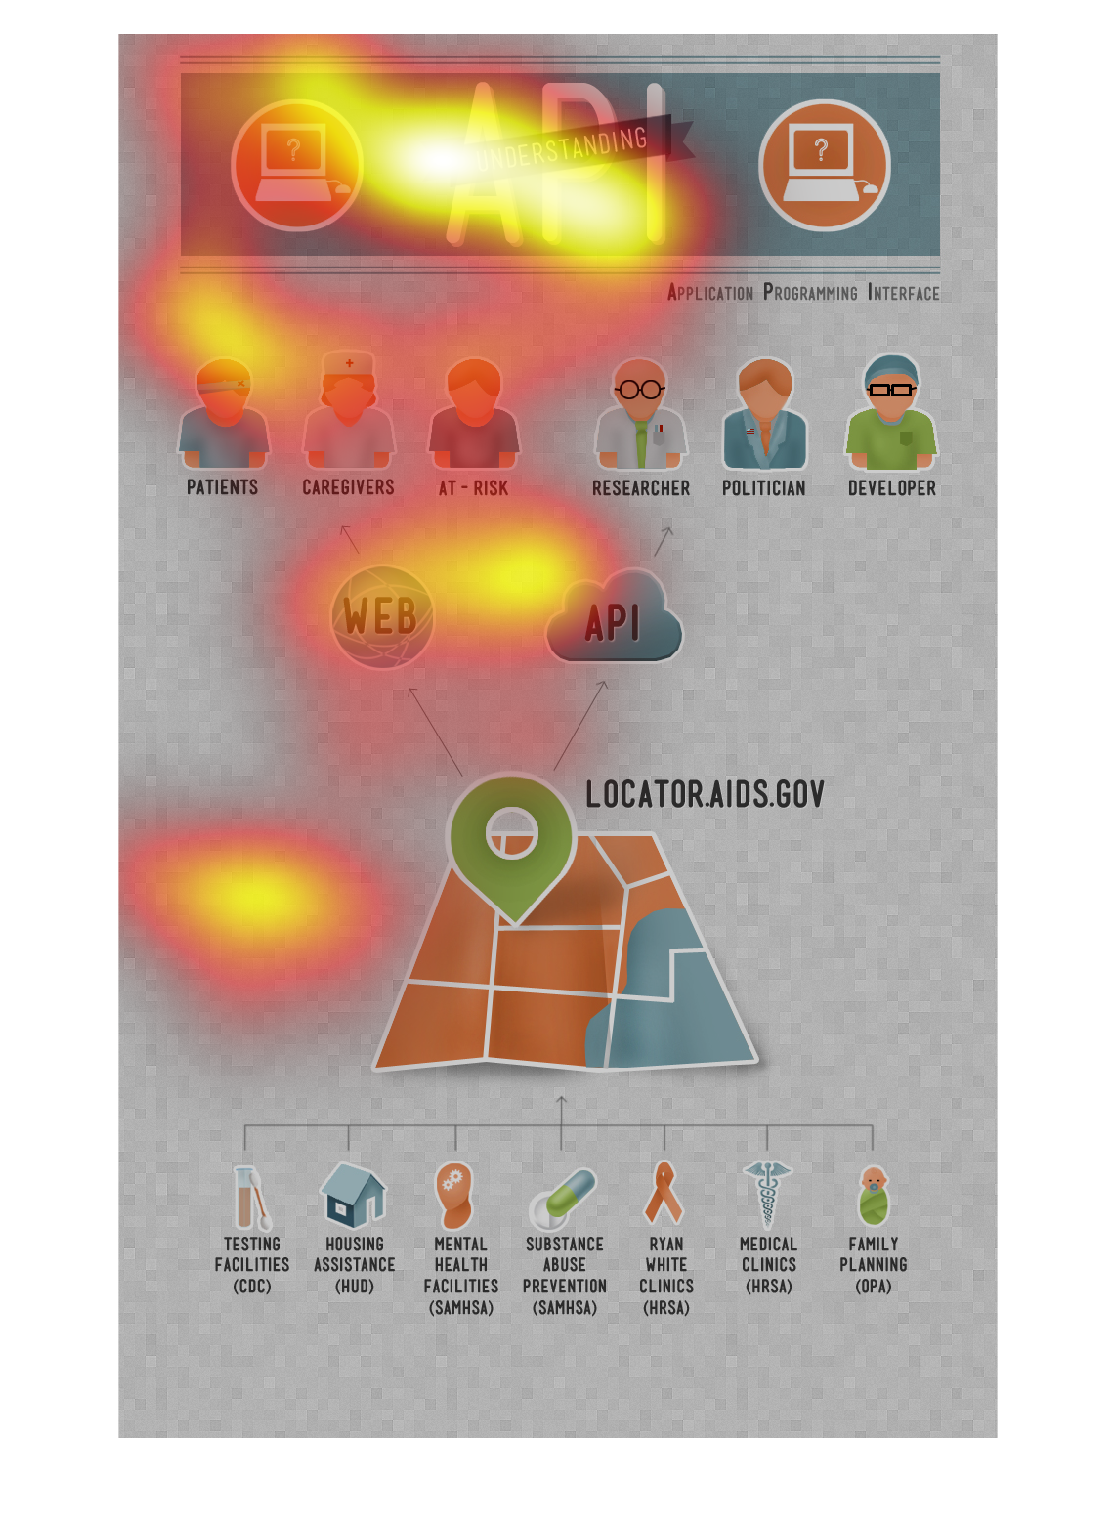
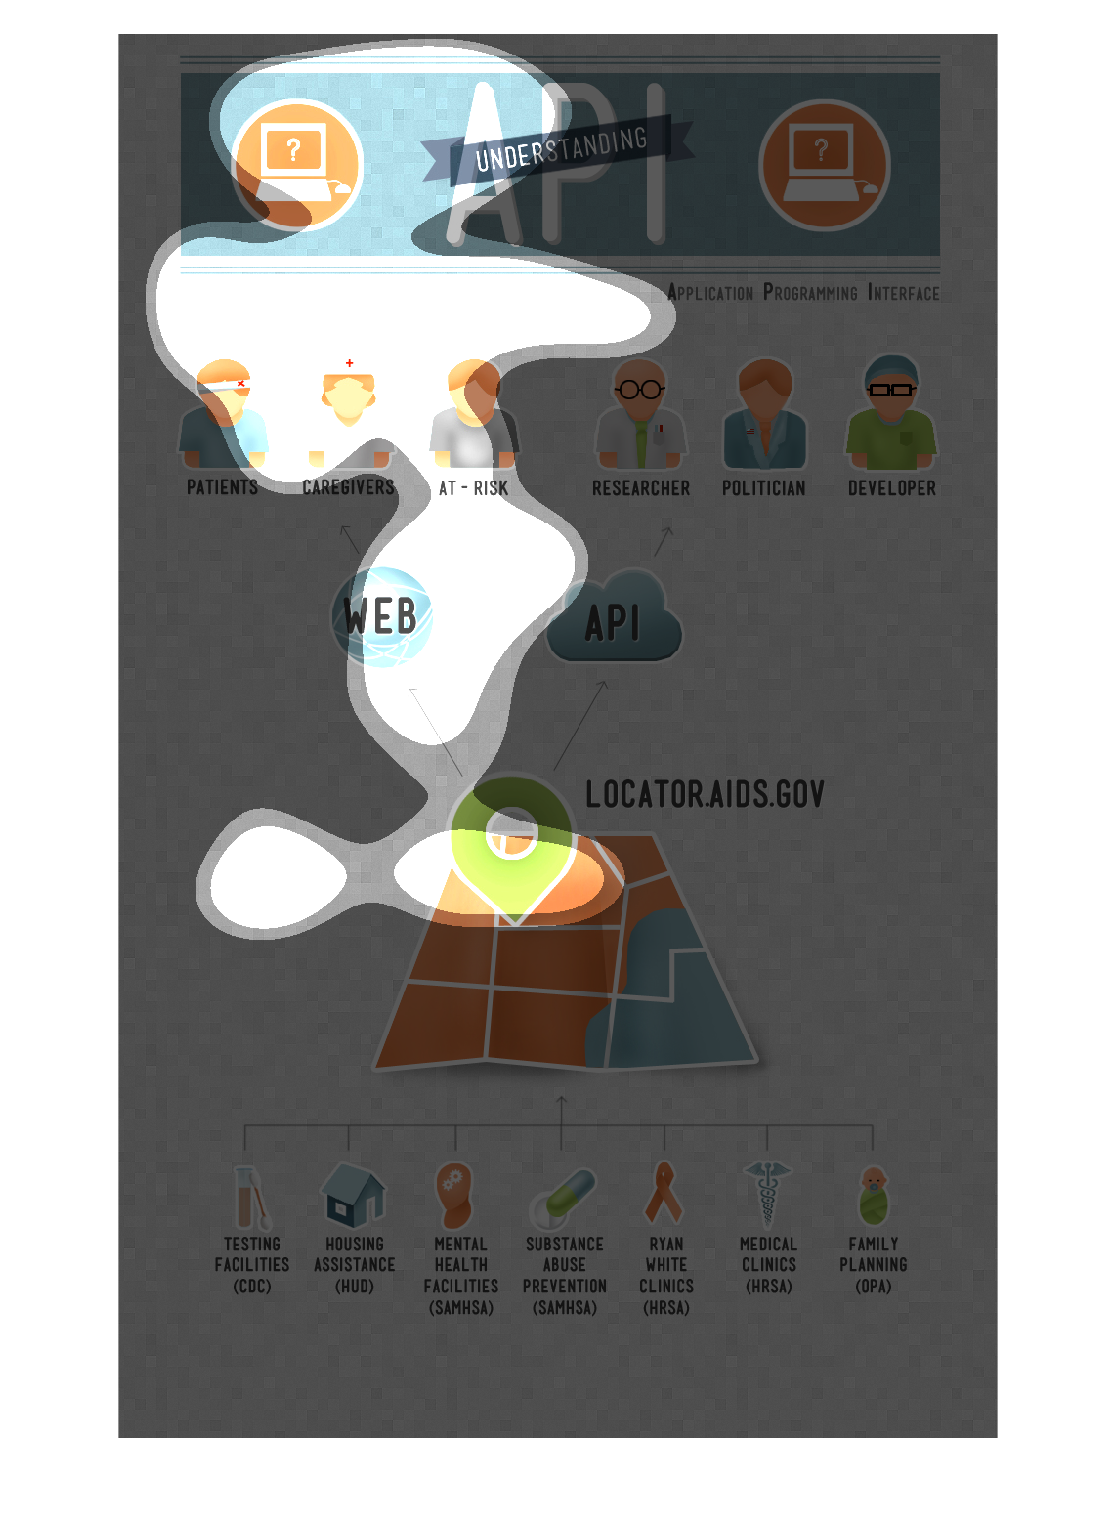
THIS INFOGRAPHIC SERVES TO ILLUSTRATE ABOUT API. AT TOP ARE THE DIFFERENT PLAYERS WITH REGARDS
TO API. AT BOTTOM ARE THE DIFFERENT PROGRAMS THAT ARE PART OF API.
This chart appears to be a map that shows the location of health care providers and Health
care clinics over a given area. It uses graphics to break down the location
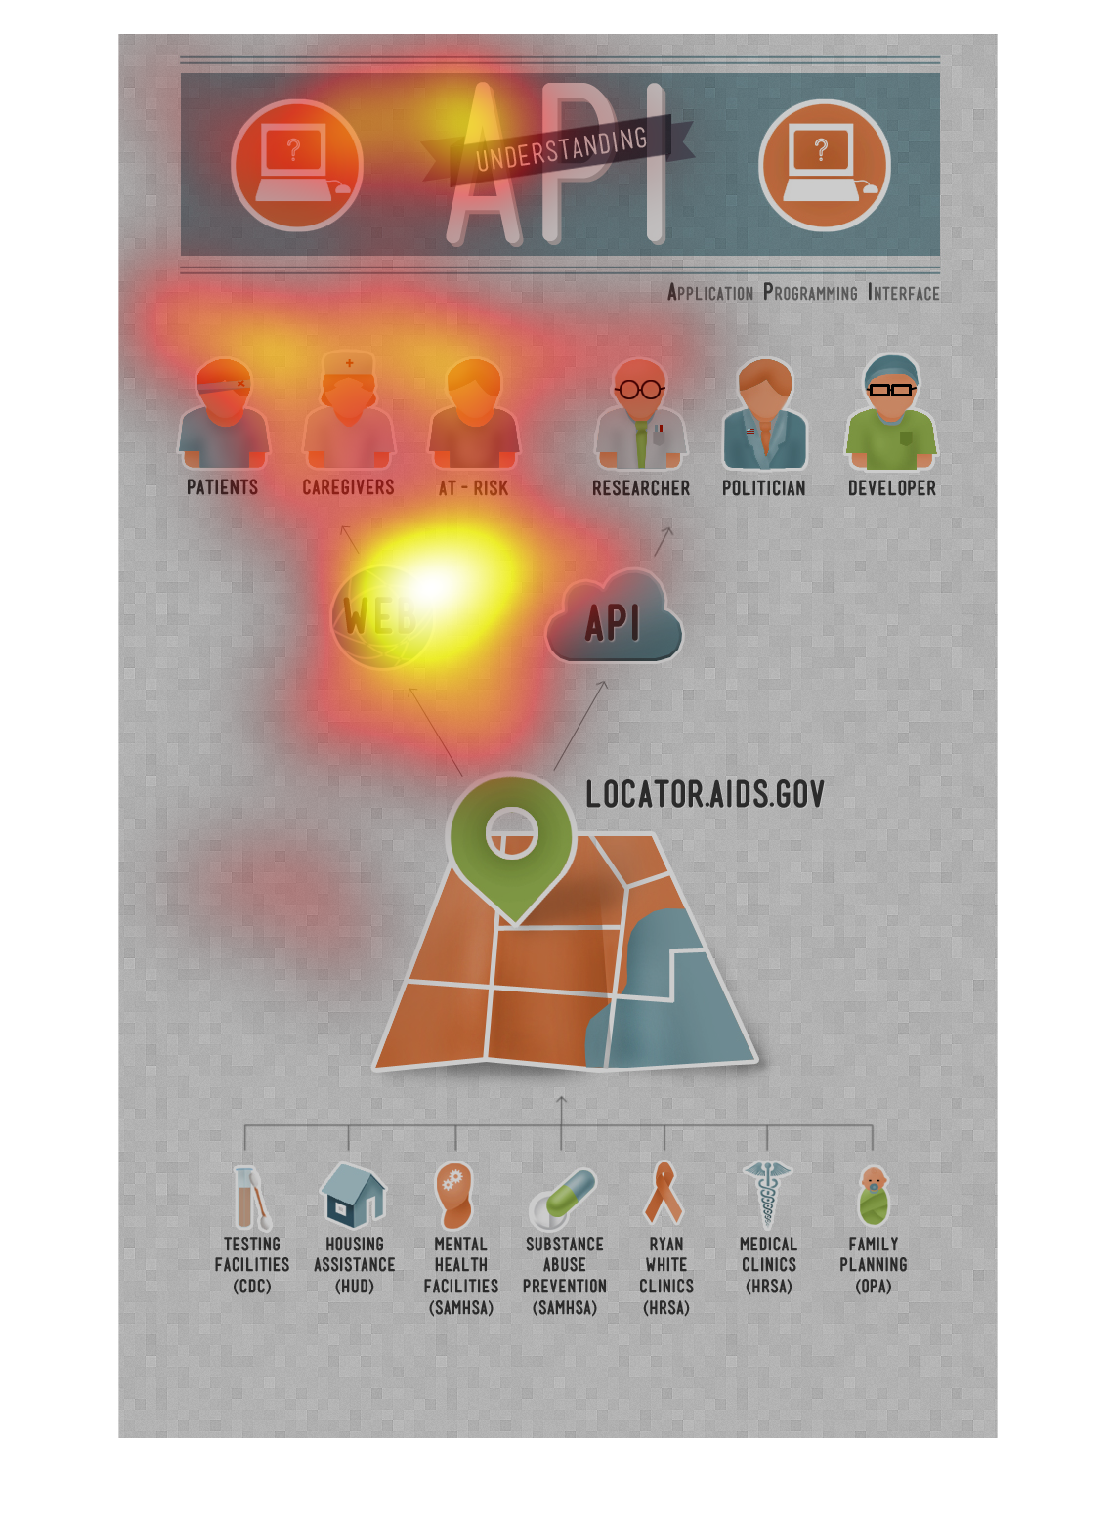
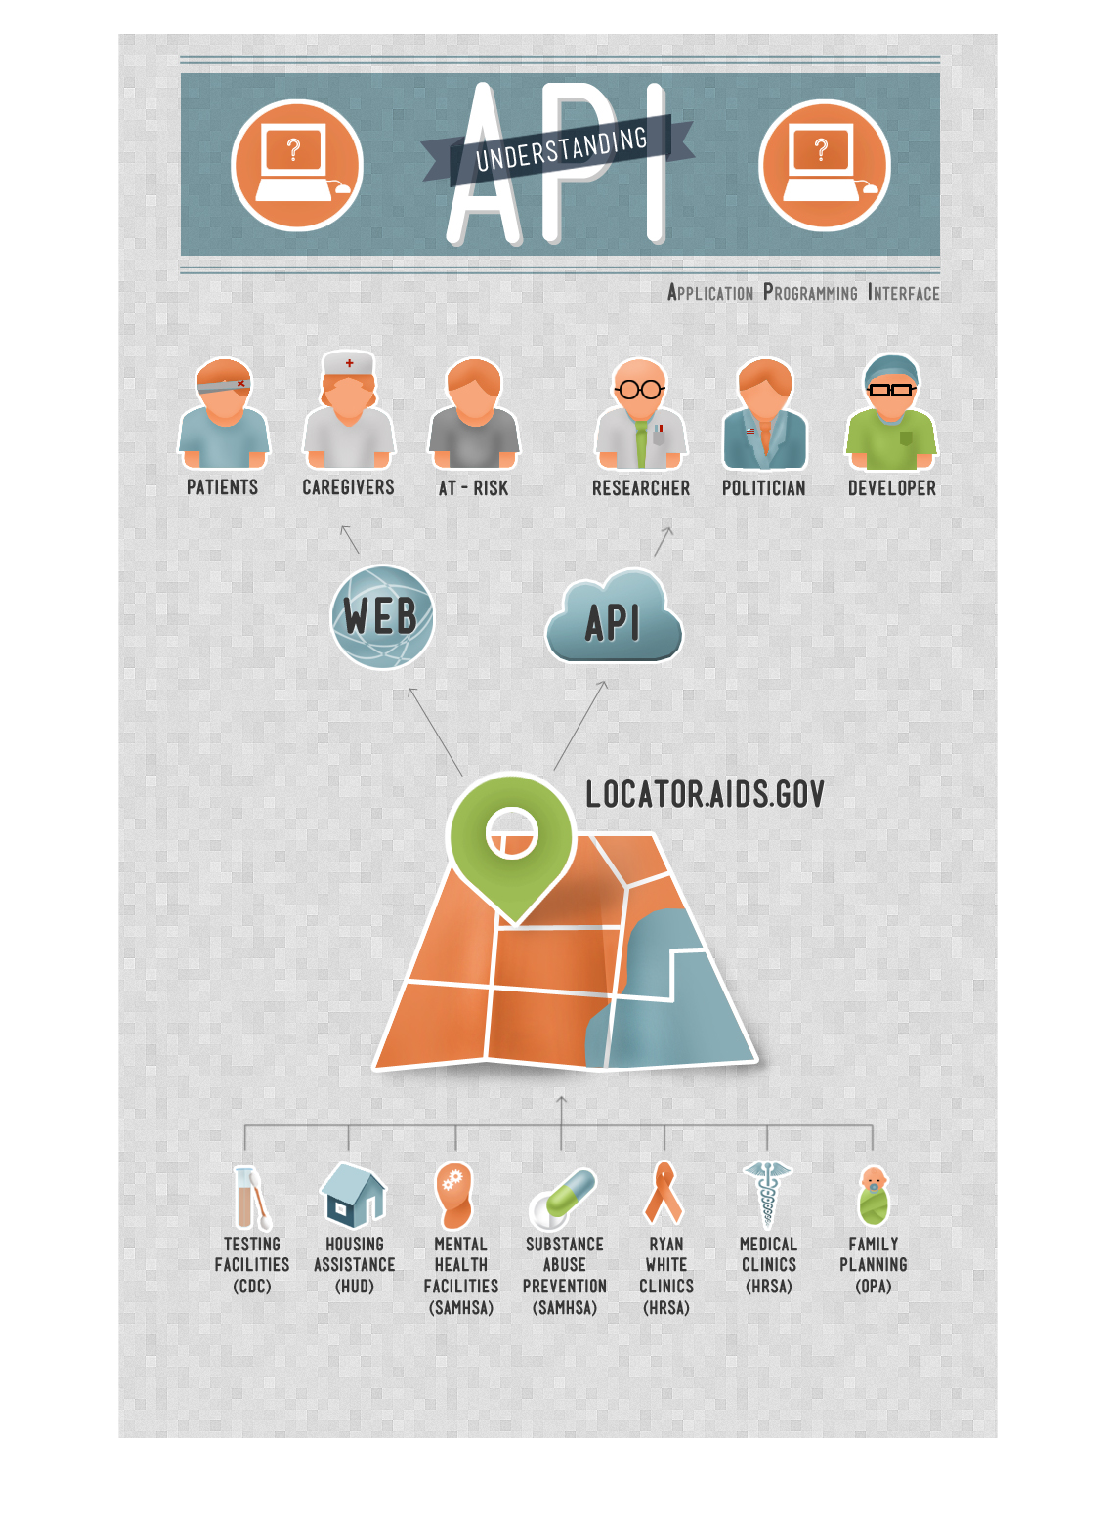
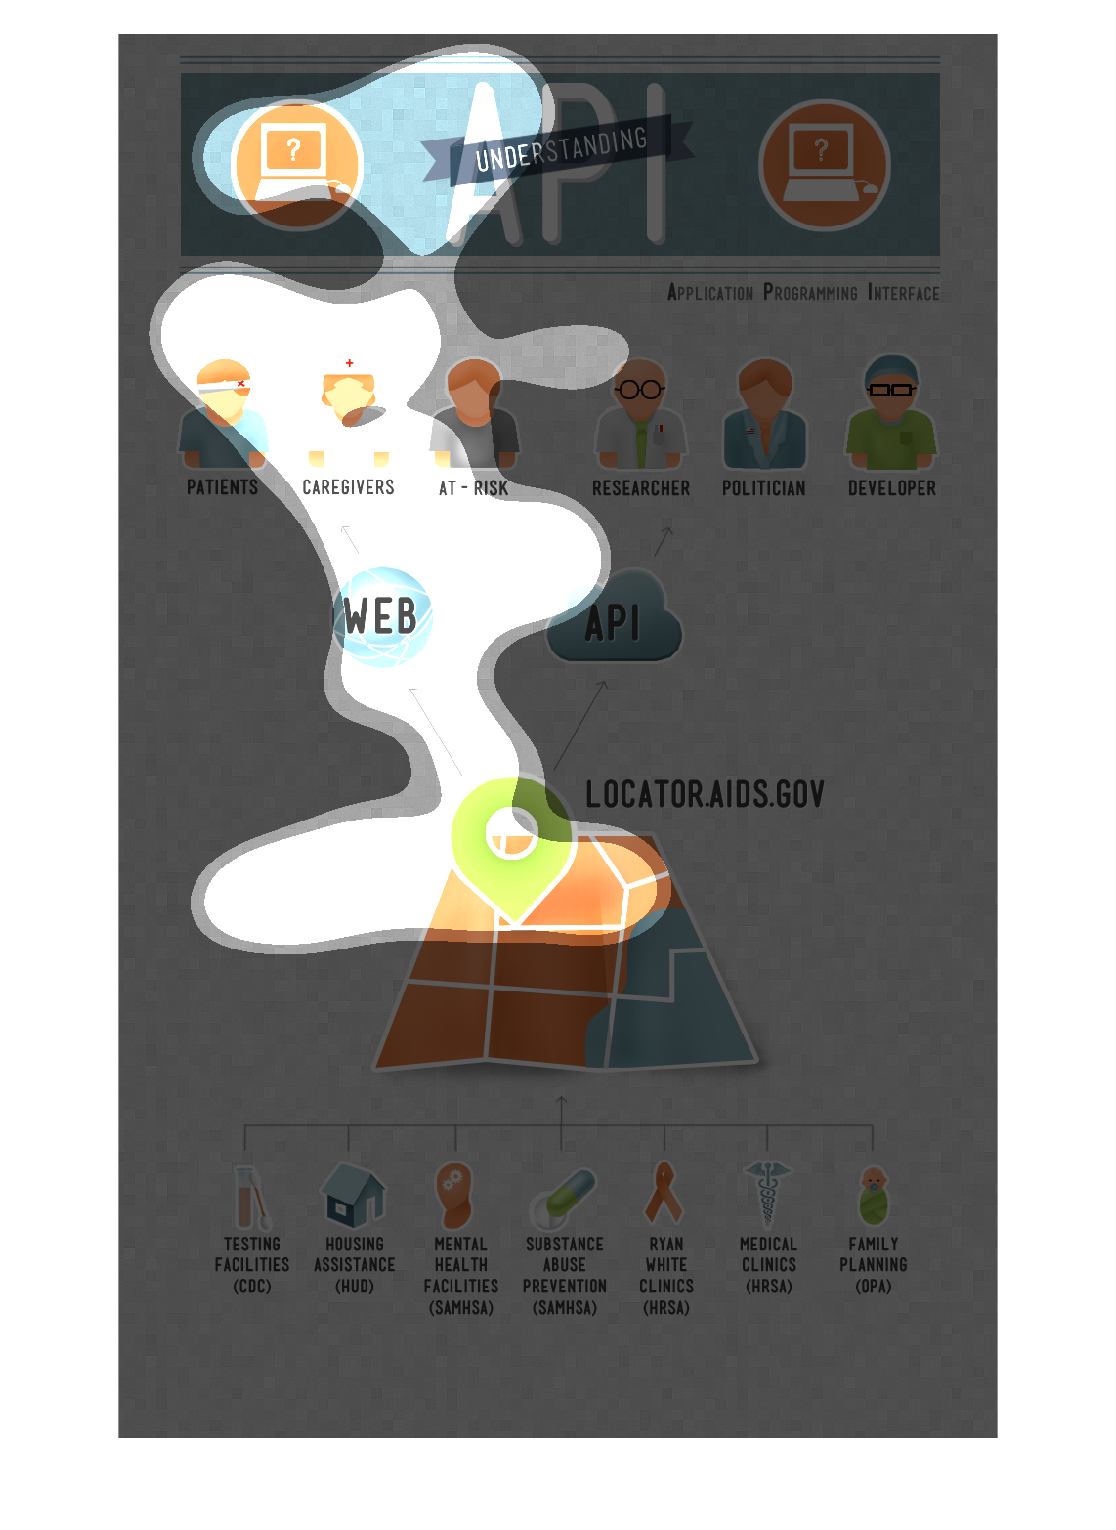
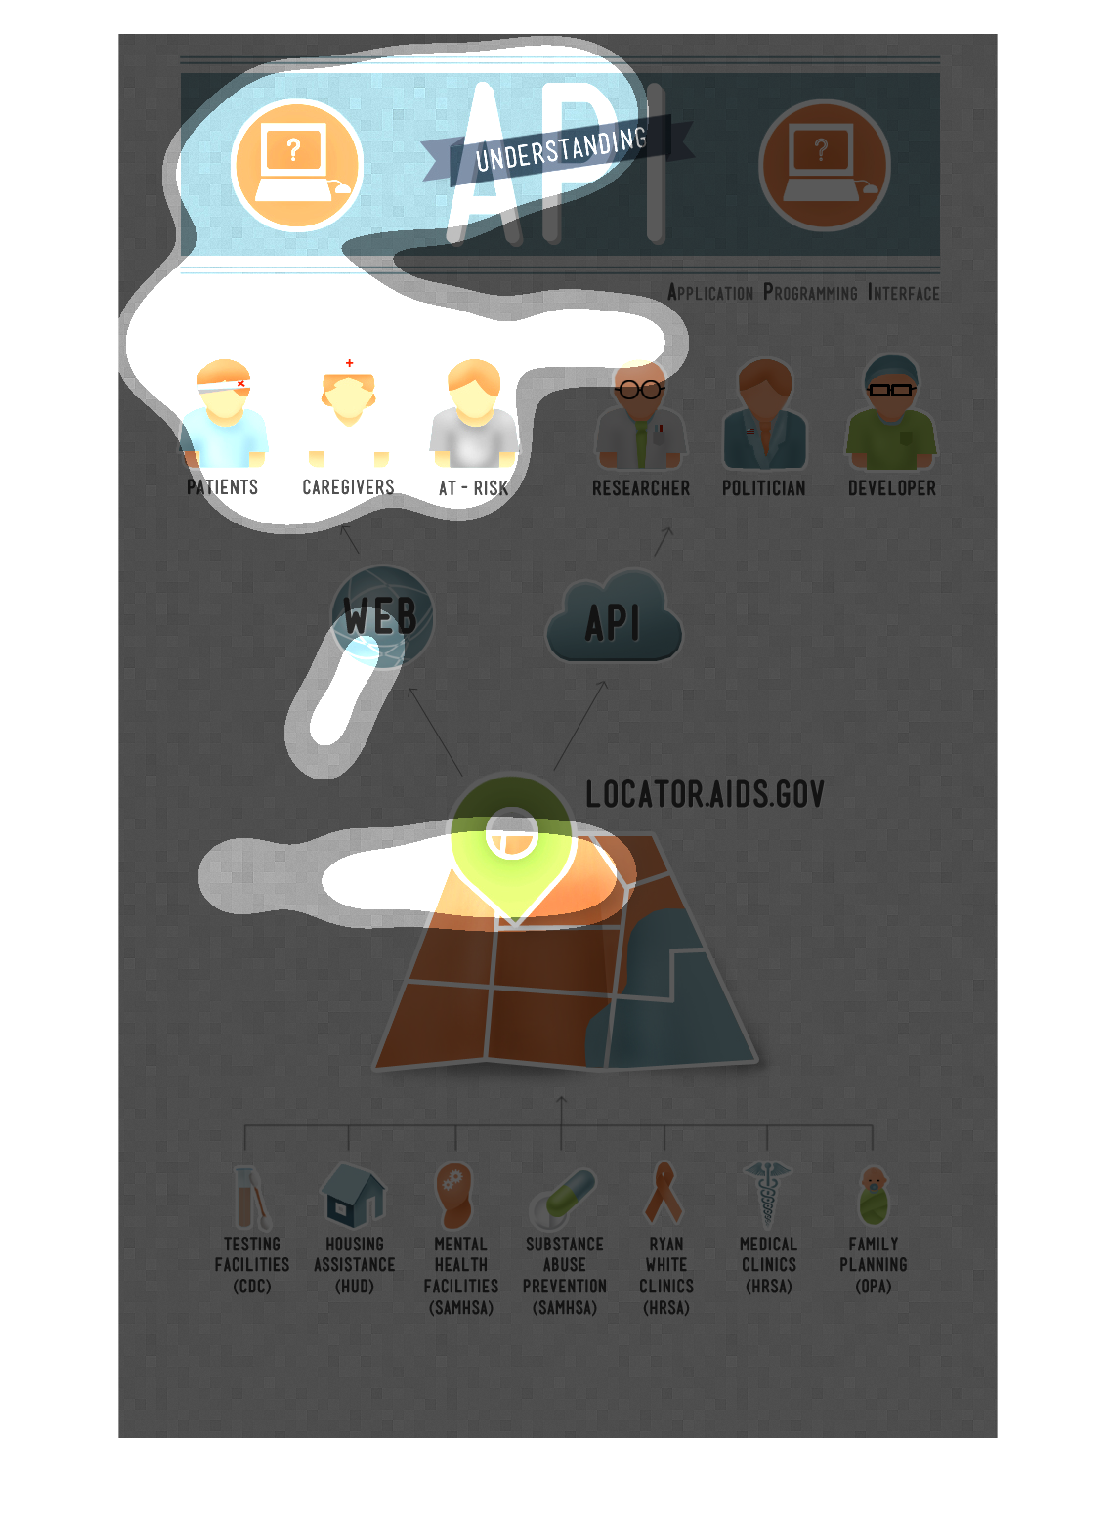
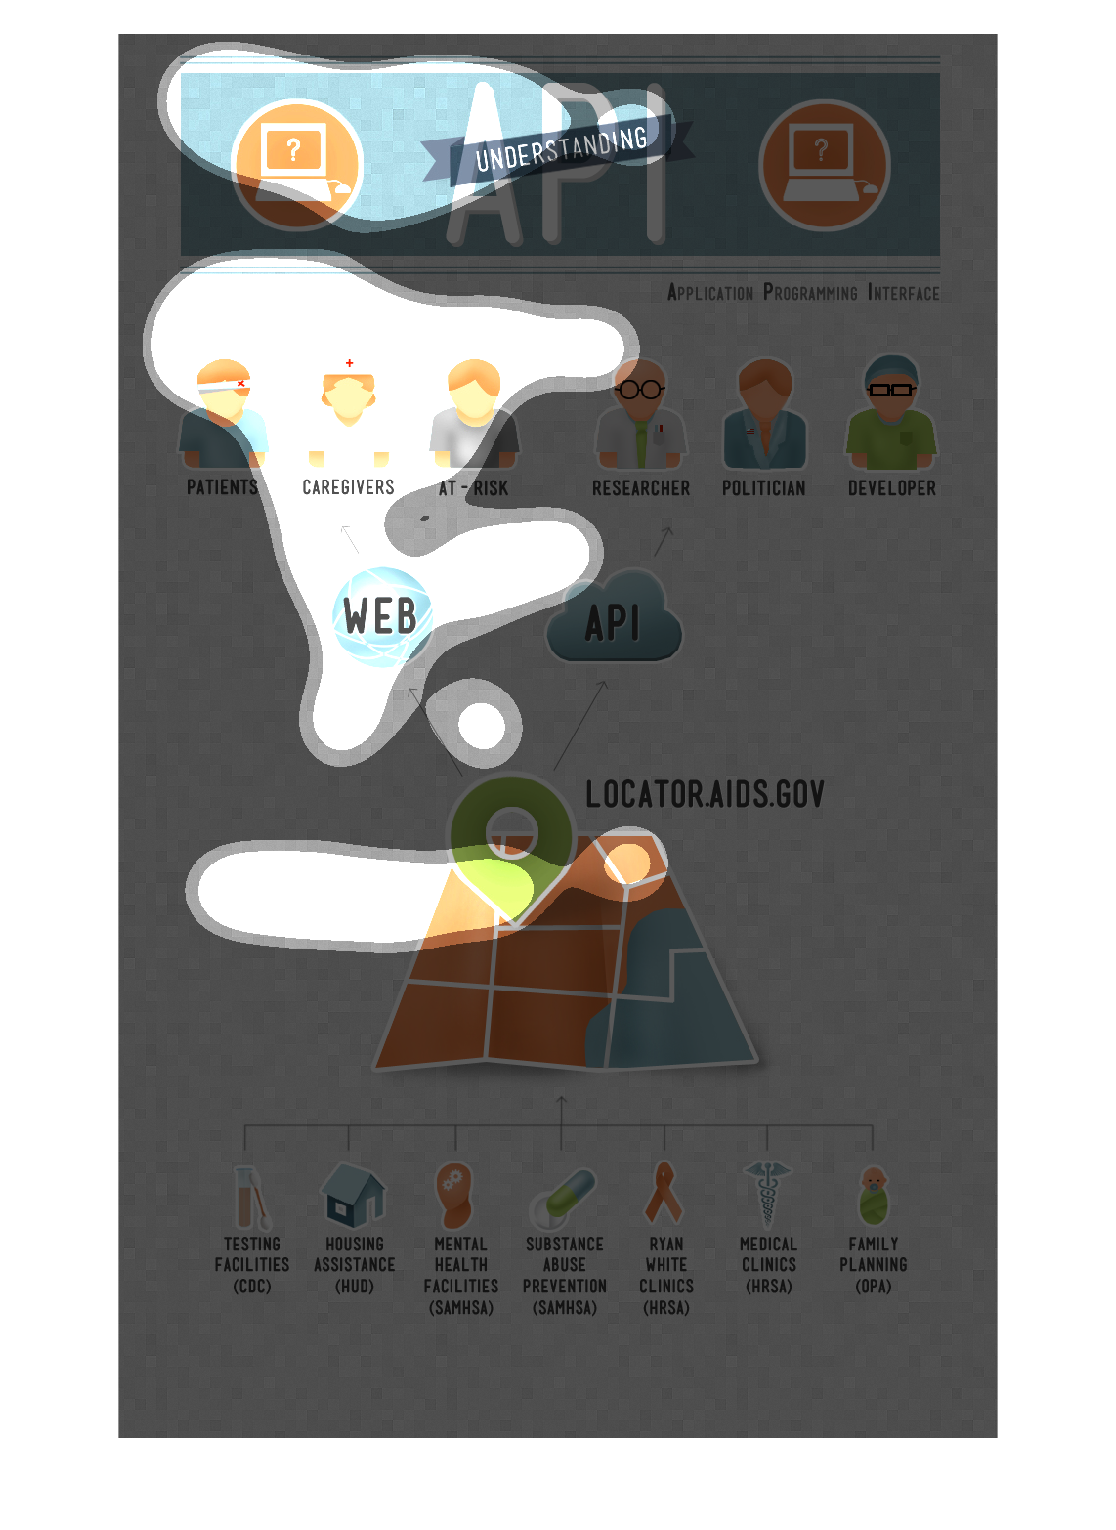
This chart is a graphical representation of what an Application Programming Interface is.
Graphically, it communicates although various groups access a website, different types of
people are shown different things. Some are shown the web site. Typically these are the clients.
Some are shown the API. Typically these are the workers.
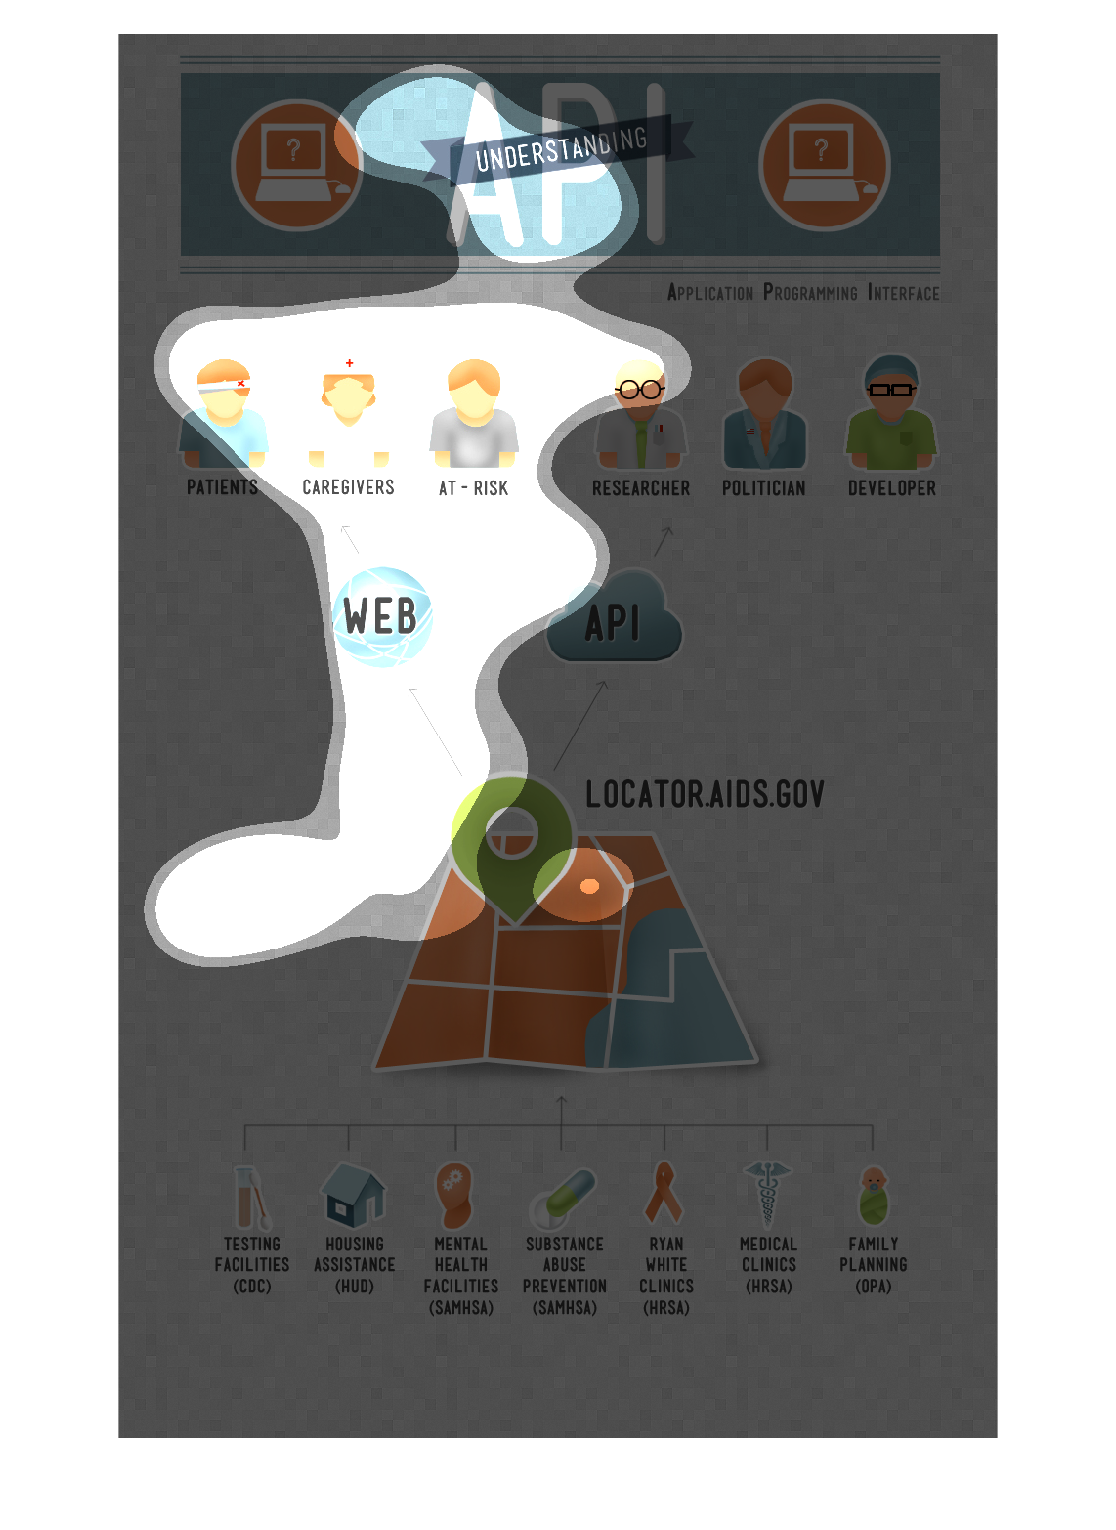
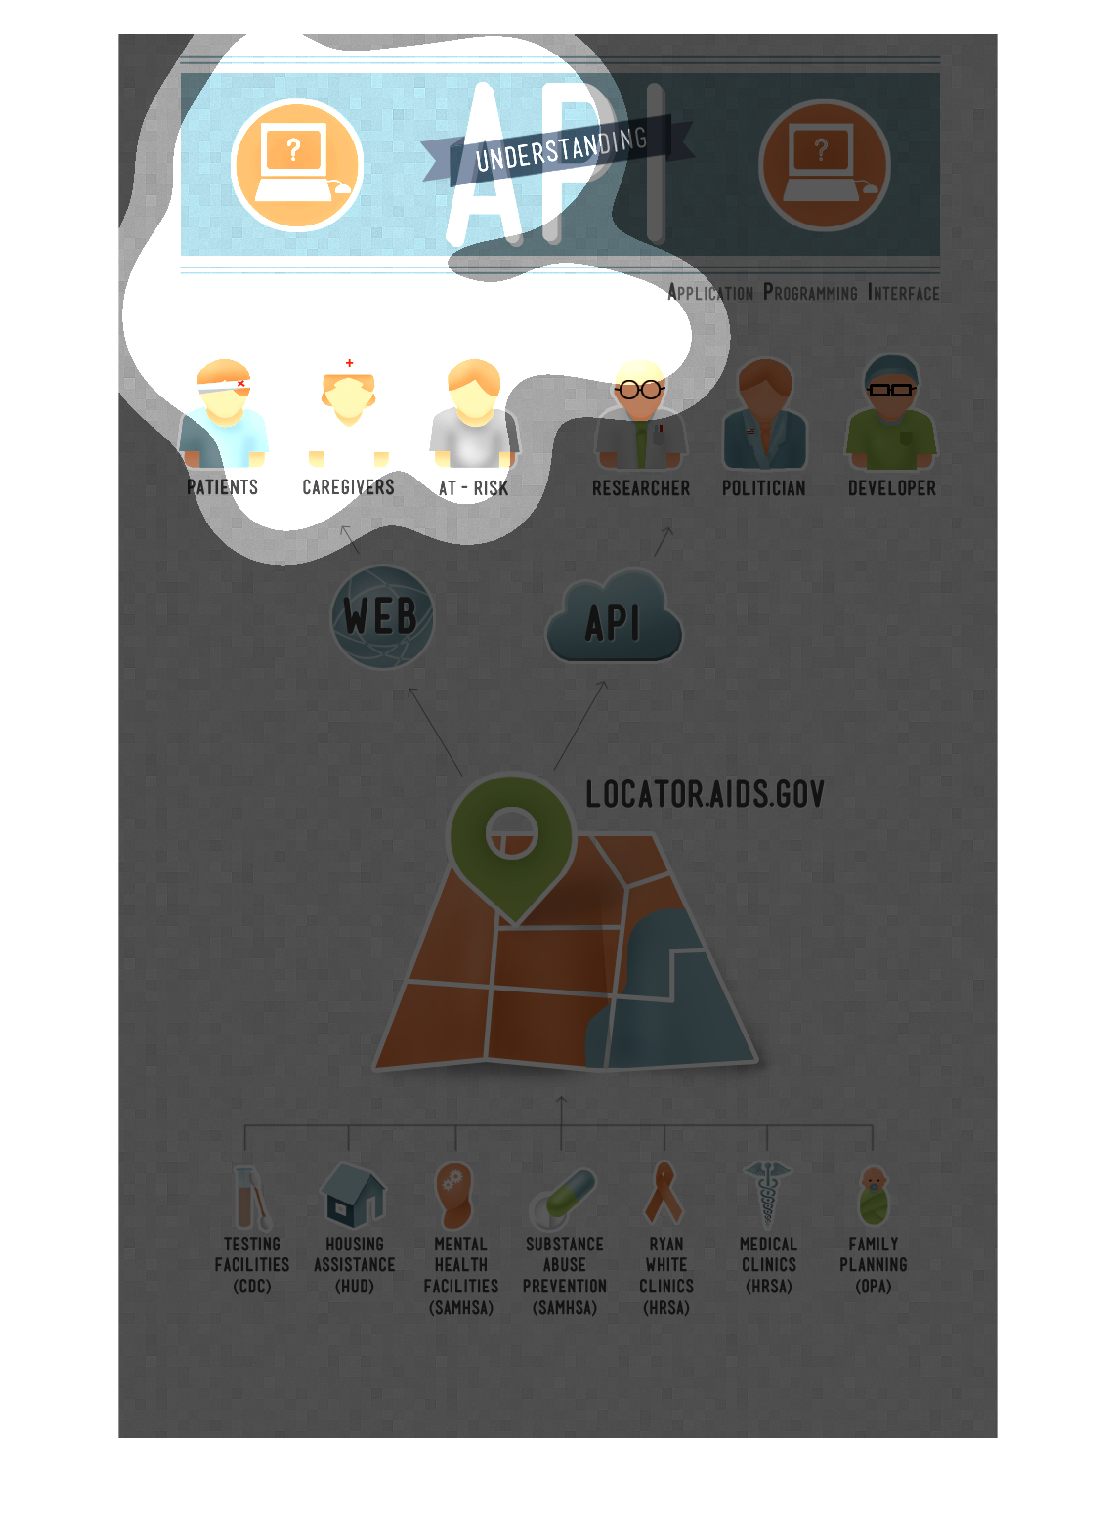
Image describes about understanding API. There are different types of people such as patients,care
givers,at-risk, researchers, politicians, developers. They are of different profession connected
to locators.aids.gov
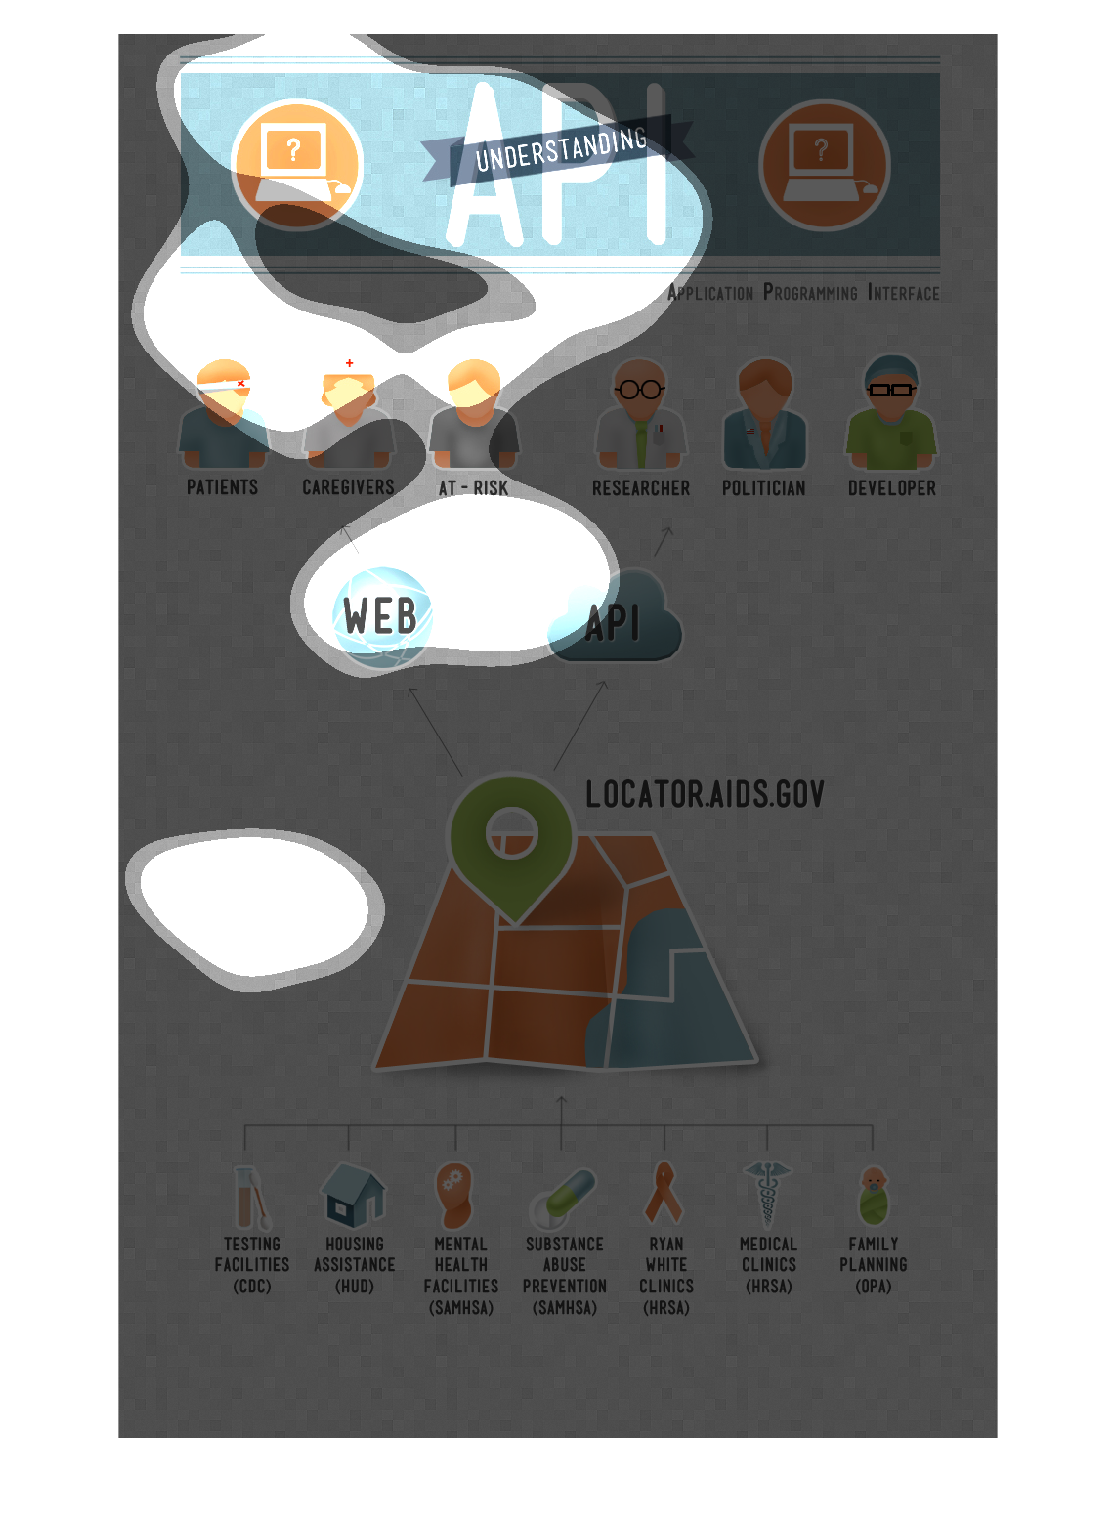
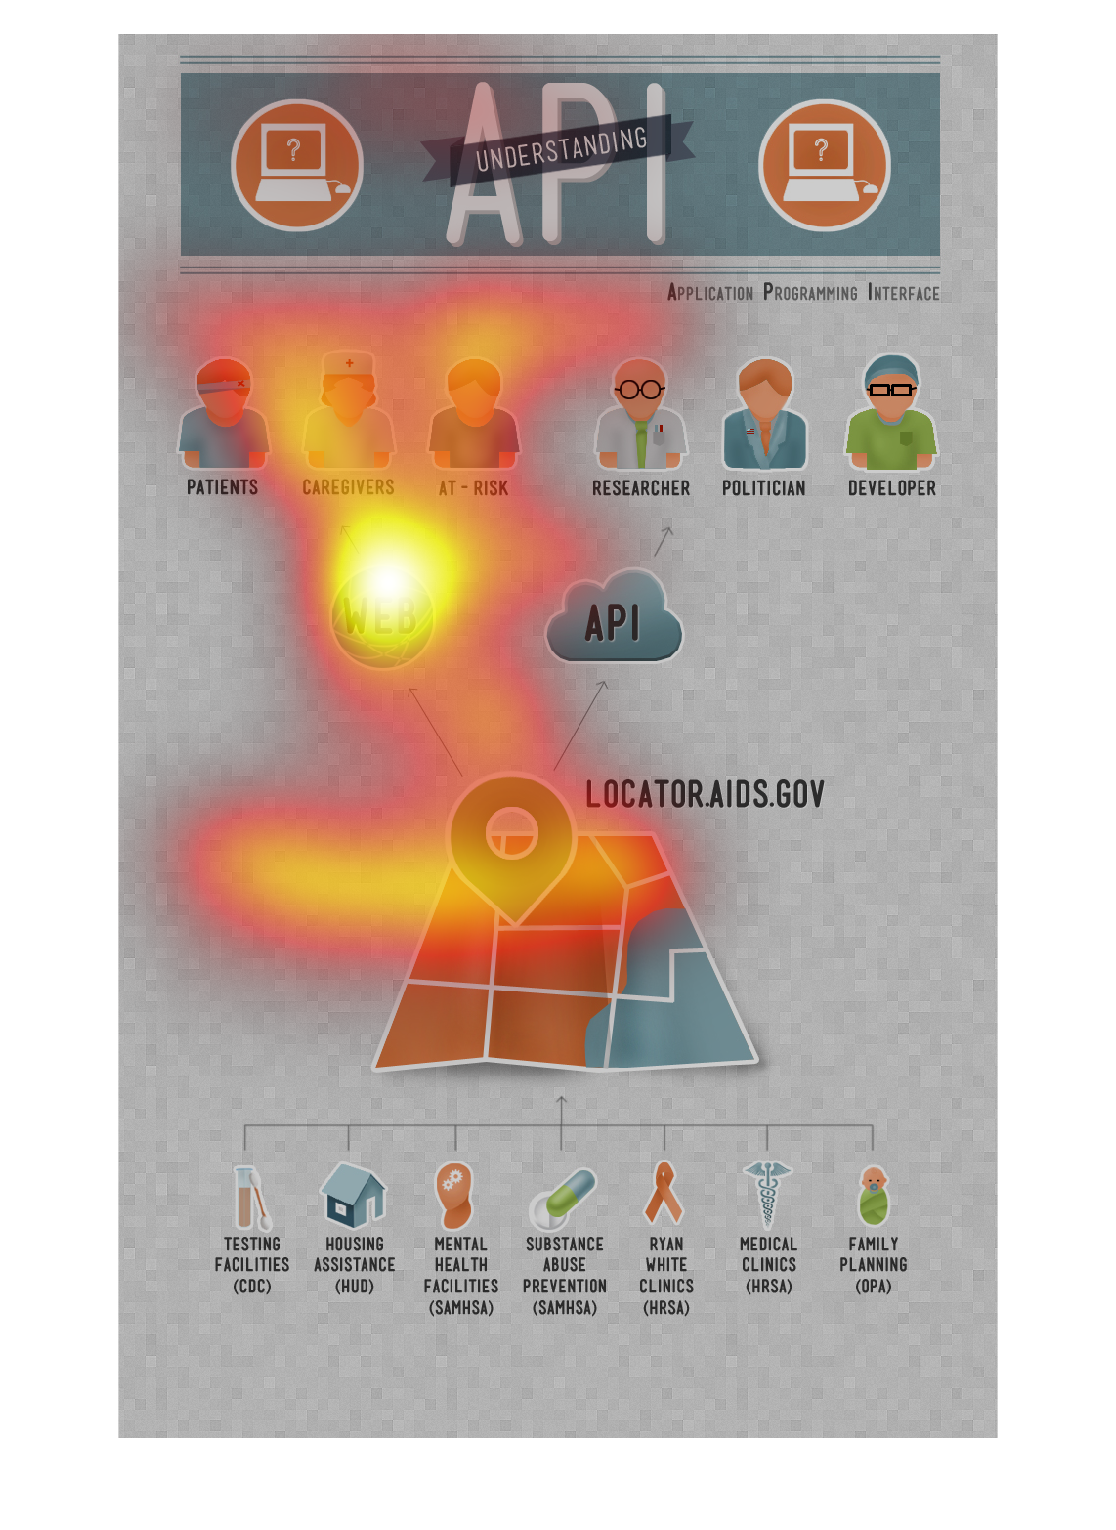
The image on the left hand side depicts two sets of individuals.  One set of individuals are
classifieds under WEB users which are patients, caregivers and at-risk individuals.  The other
set of individuals are known as API users which are politicians, developers and researchers.
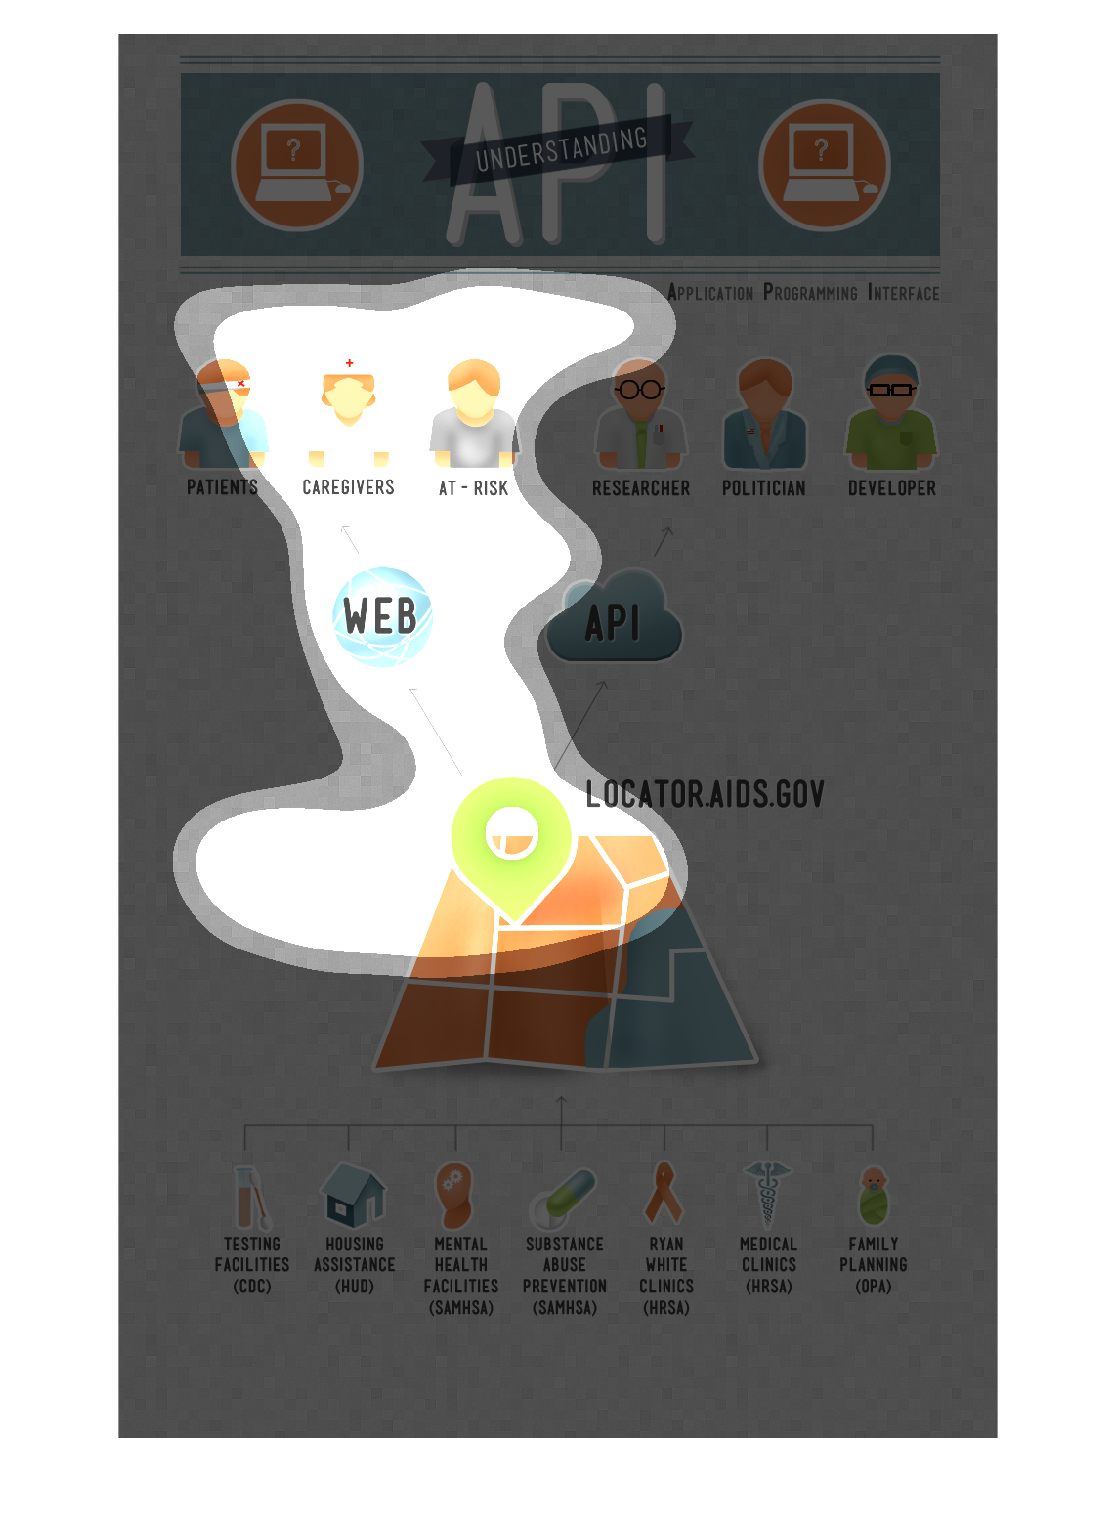
This image is about Understanding API which stands for Application Programming Interface.
 It shows a cartoon picture of different people who may be in the medical field such as a
patient, a caregiver, etc.  It has a picture promoting the website LocatorAids.gov.  Lastly
it shows small pictures advertising different agencies such as the CDC, mental health facilities
etc.
This chart is titled: Understanding API. It is a well done chart showing how the web, and
API work tighter with the other moving parts. It was very interesting.
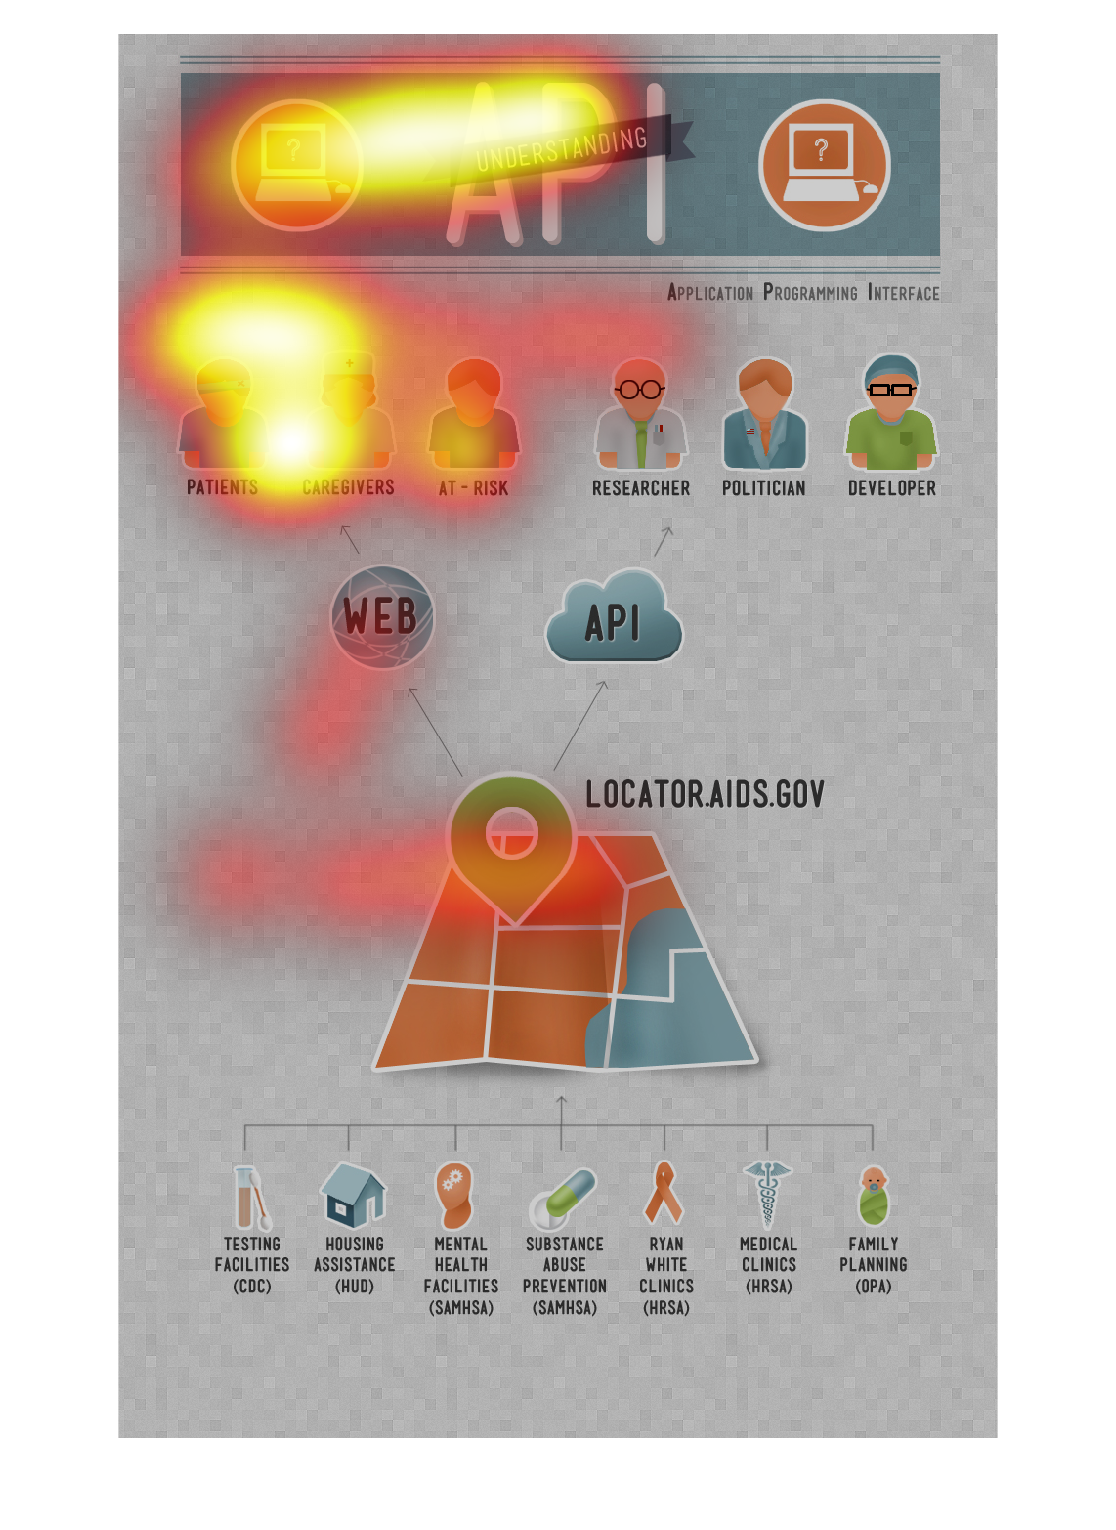
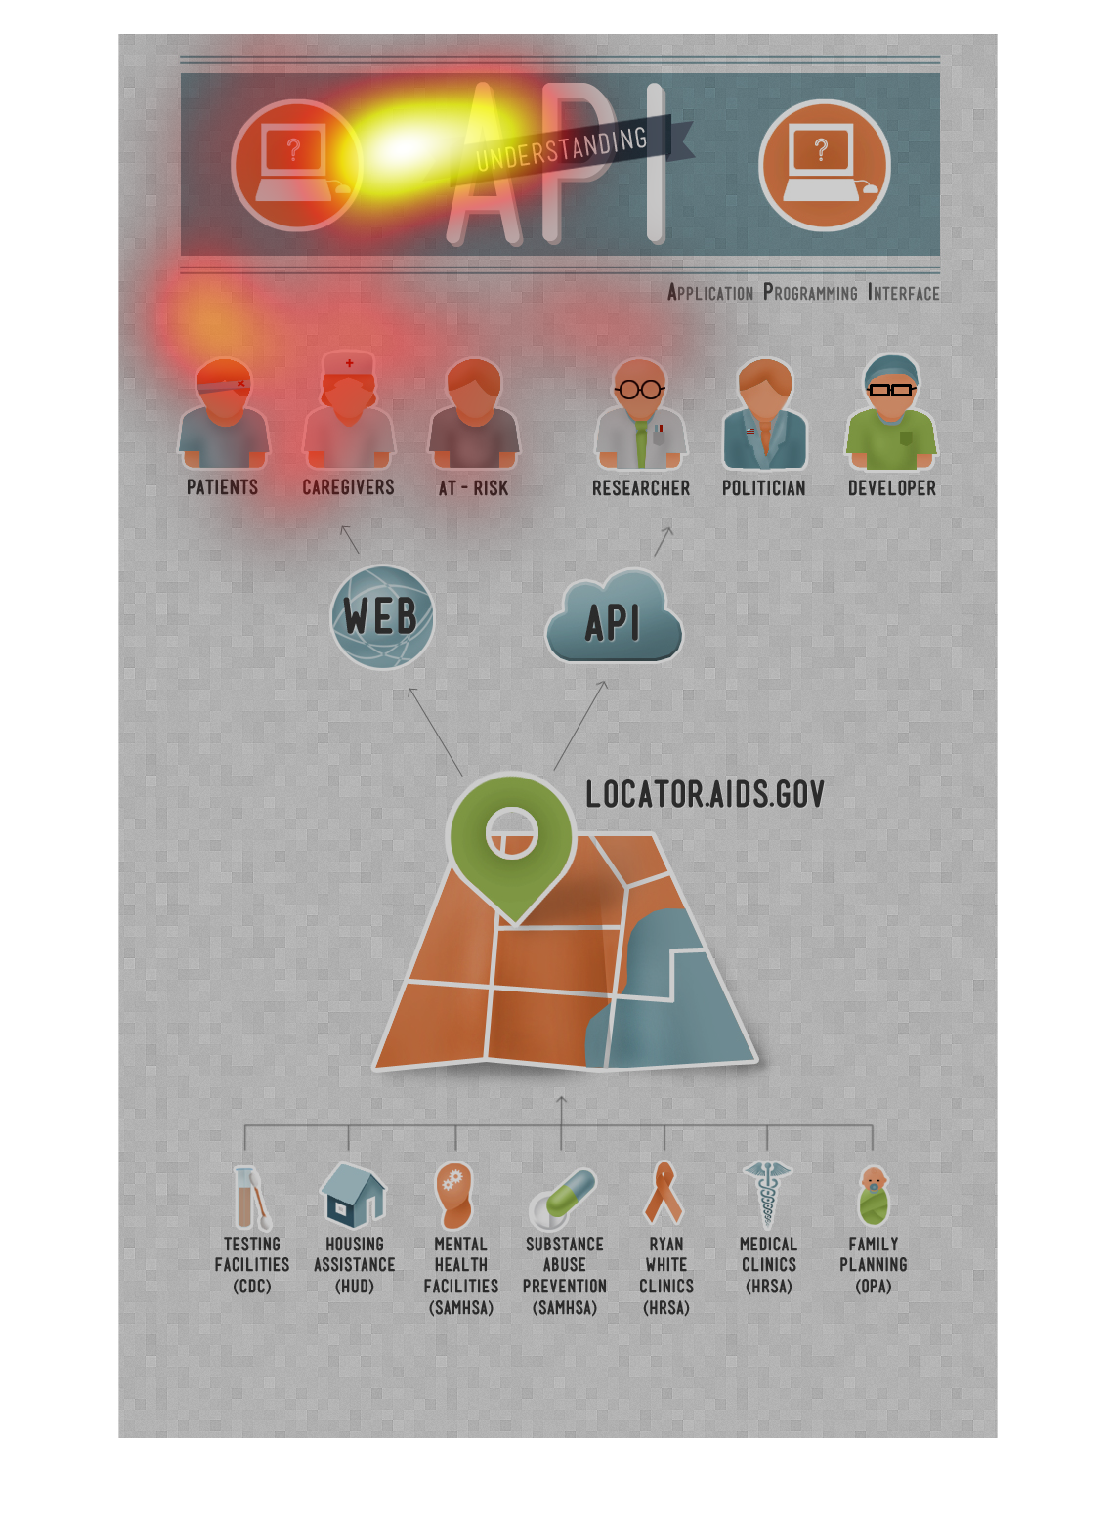
The following chart gives an example of how to understand Application Programmers interface.
It shows how the world wide web and Application Programmers Interface are connected and work
together.
The image was entitled, "Understanding API." It gave examples such as patients, caregivers,
at risk, researcher, politician, and developer. It showed a chart that depicted family planning,
medical clinics, and substance abuse.
This posses the question of studying and understating API under various designations that
cross from the social, private residential, and how it manifest itself in the web.
This graph is about understanding API and shows the difference in use between the web and
API.   Application program interface is a set of tools for building software applications.
A chart titled Understanding API. It seems to depict a hub where API representatives like
researchers and developers and WEB users like patients and caregivers can connect to needed
resources testing facilities, mental health facilities, family planning, and more.
This chart describes understanding API. Categories on the chart include care givers, parents,
at-risk, researchers, politician, developer, web, and API.
 This is a informational graphic board bringing awareness to a disease called API. It includes
all participants concerning API including patients, care givers, at-risk individuals, researches,
politicians and developers.