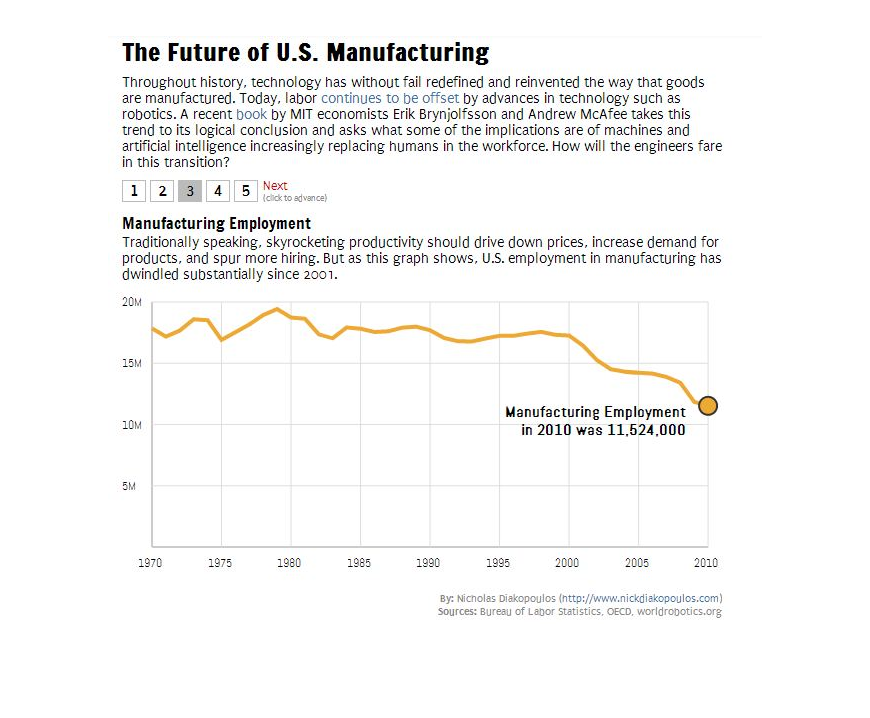
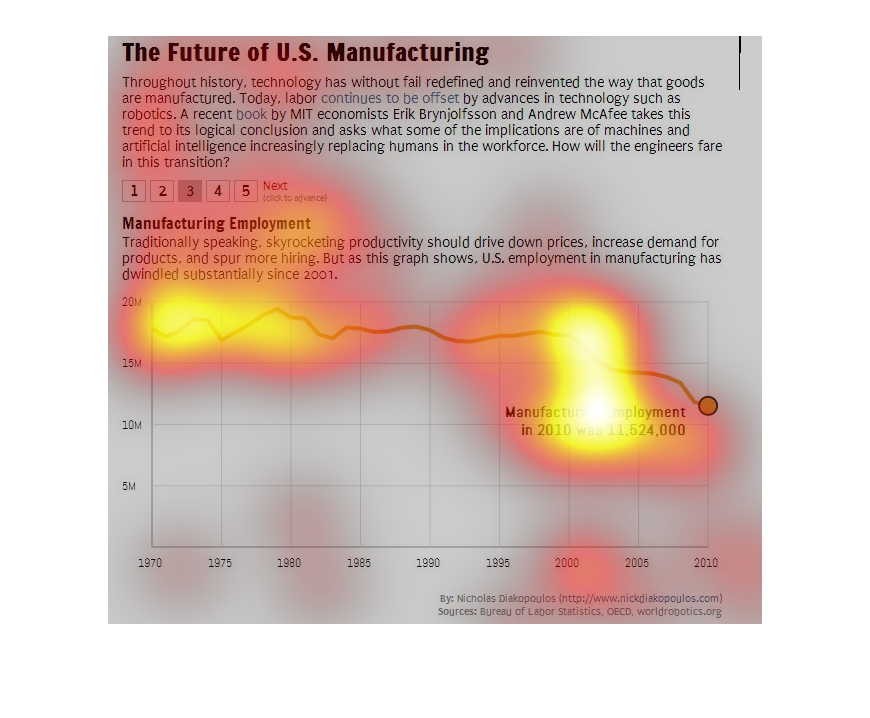
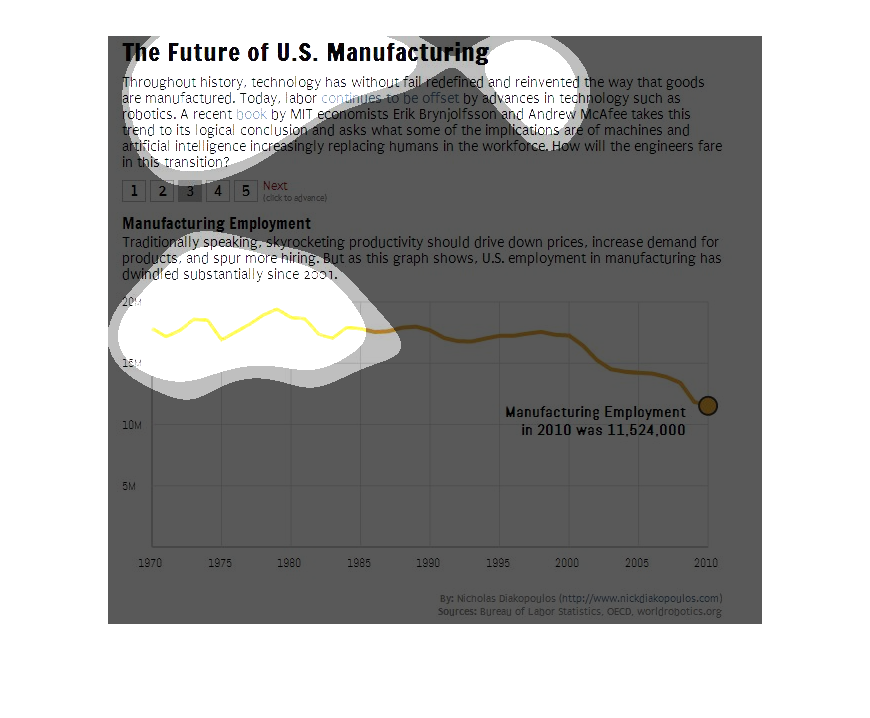
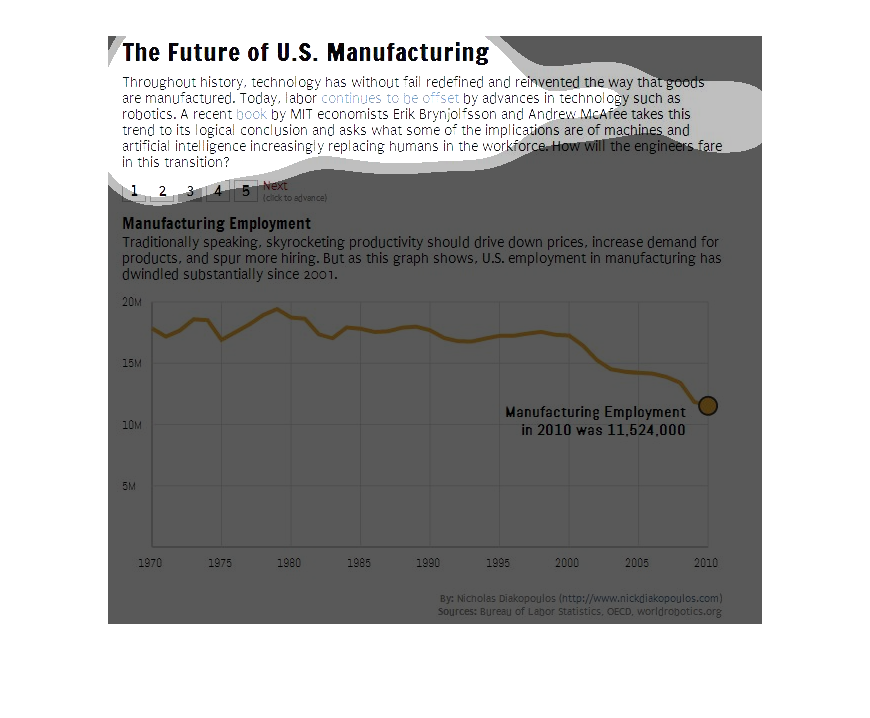
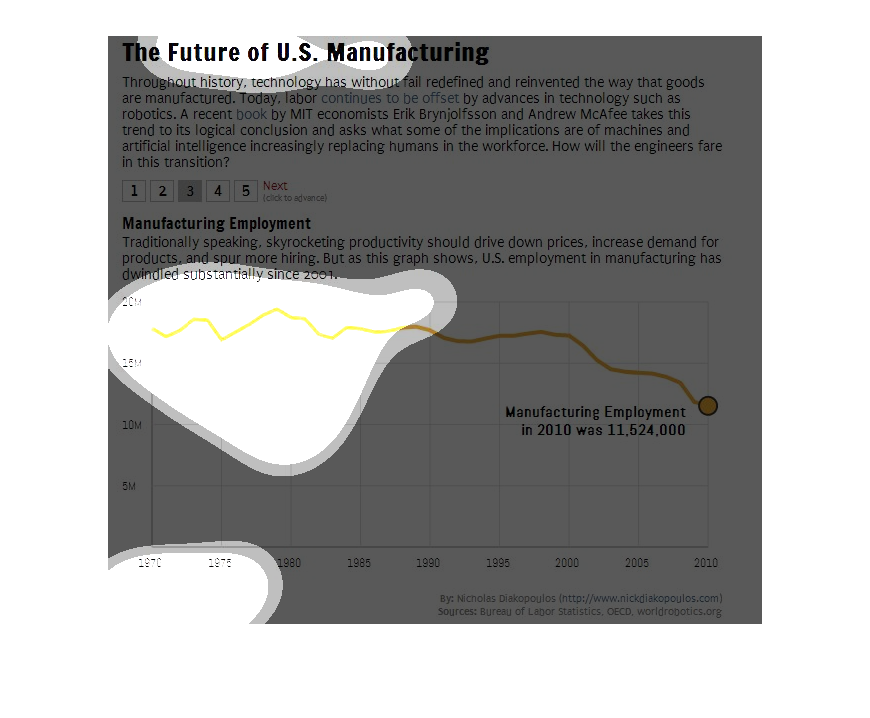
The image is of part of an article describing the economic effects of manufacturing advances.
Two MIT economists wrote a book about the topic, including information about the implications
for human laborers, such as engineers. A graph is shown describing the trend of manufacturing
jobs in the U.S. decreasing steadily since 1980, with a big drop-off as we entered the 21st
century.
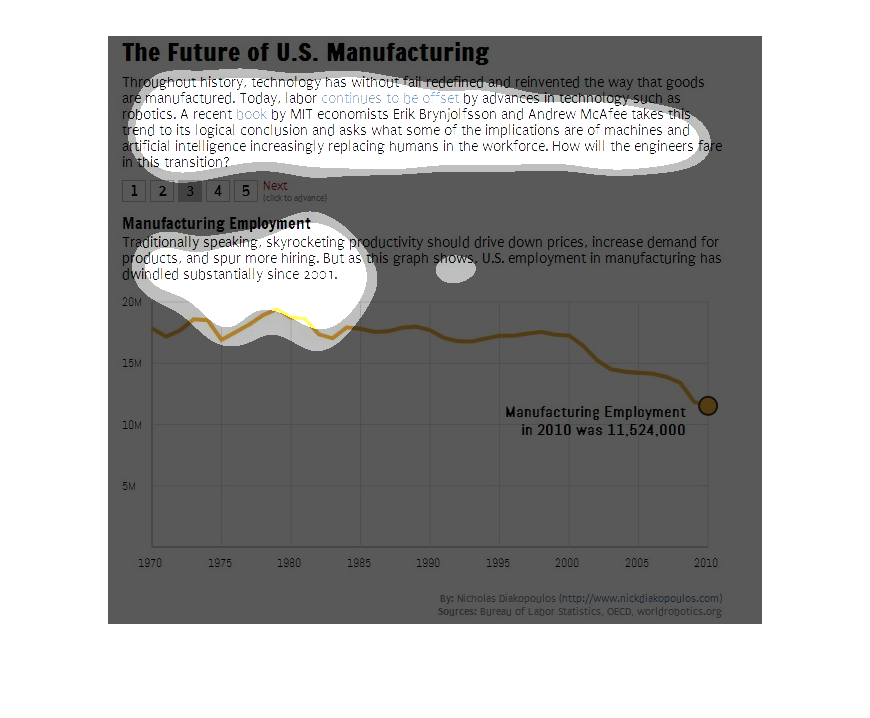
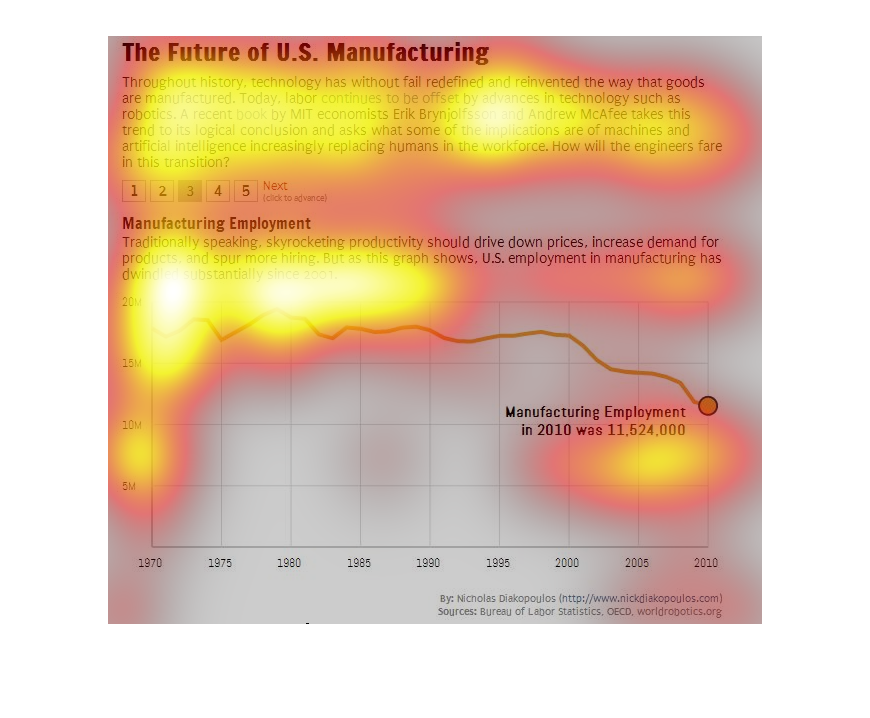
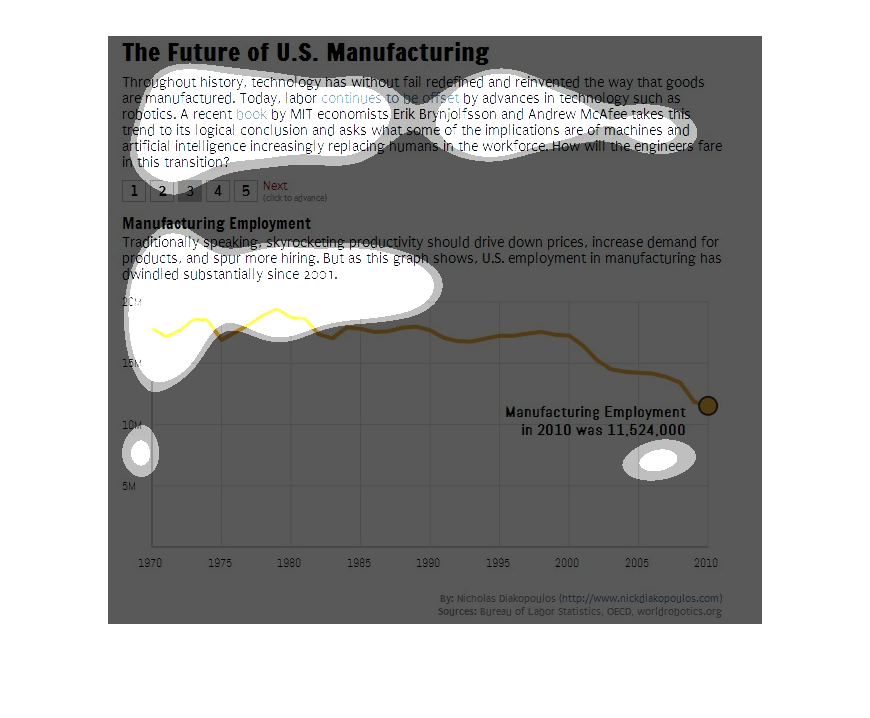
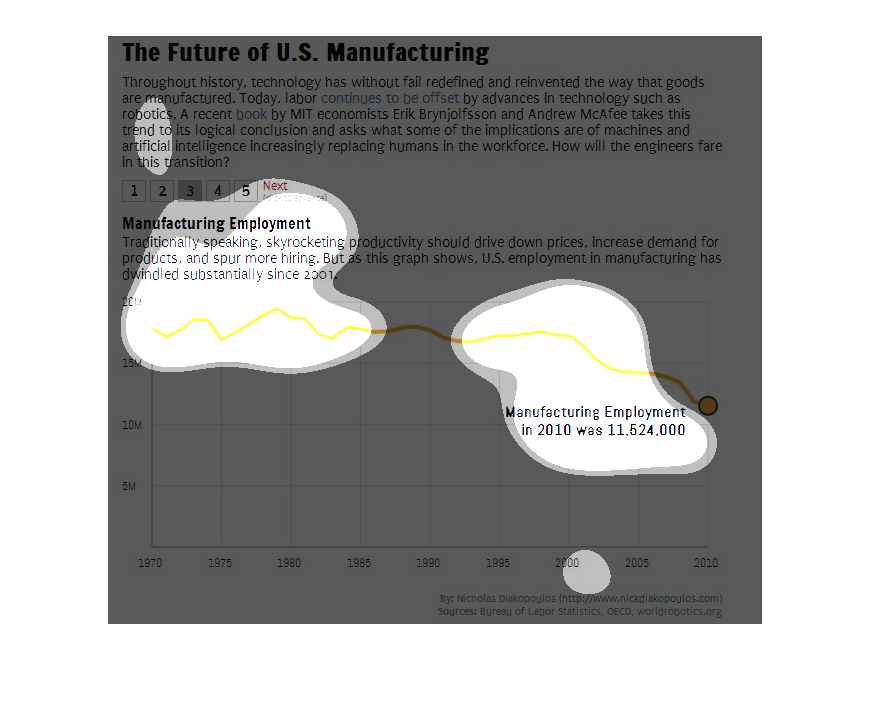
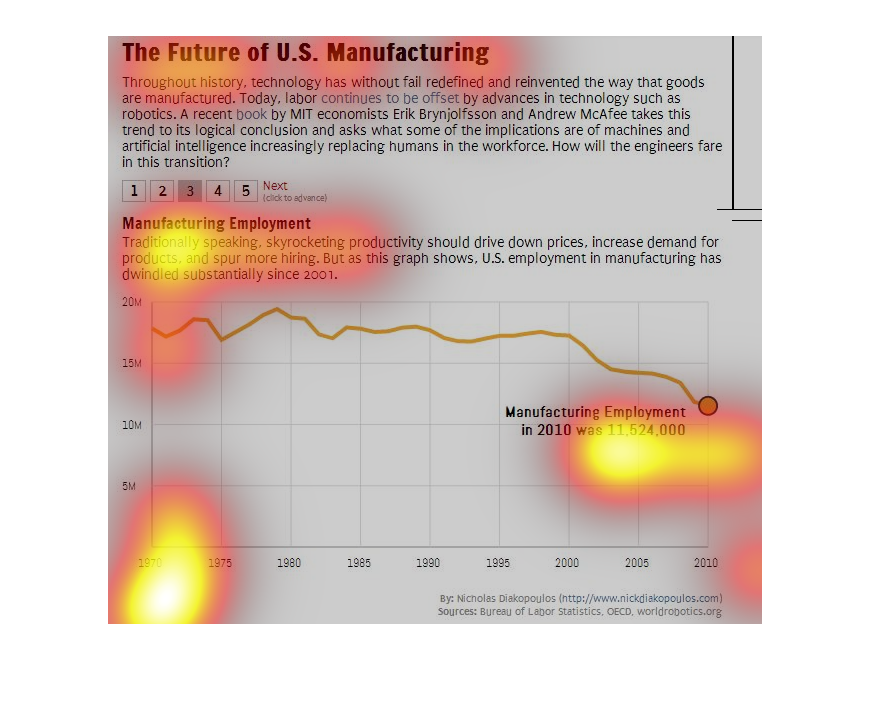
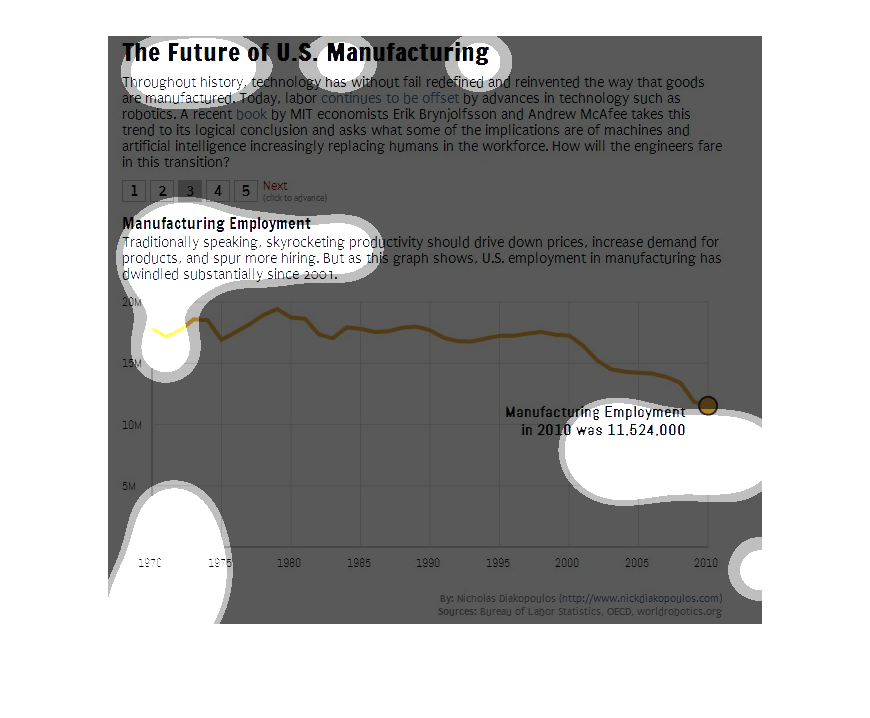
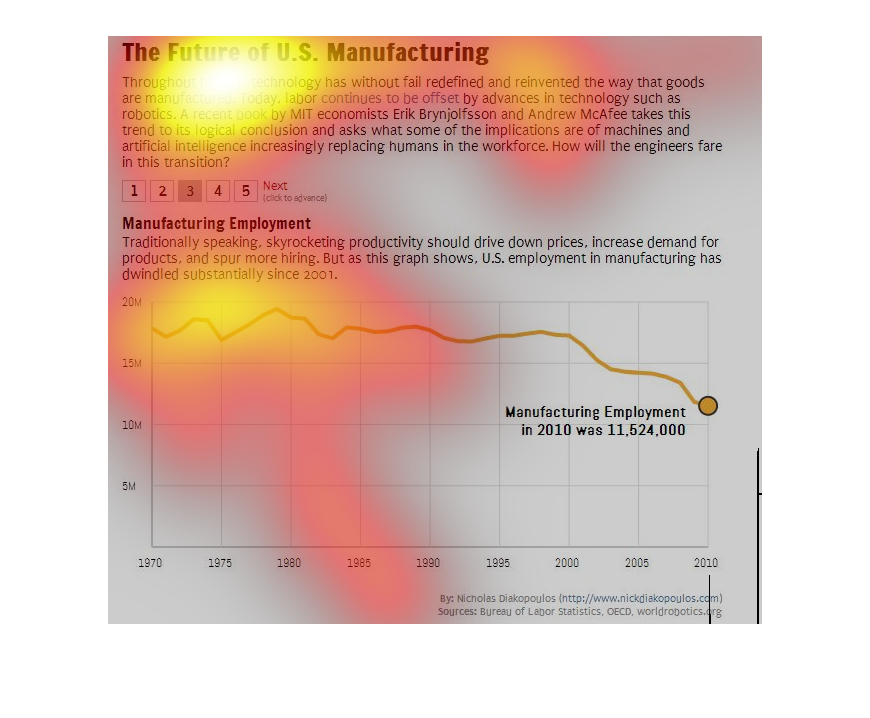
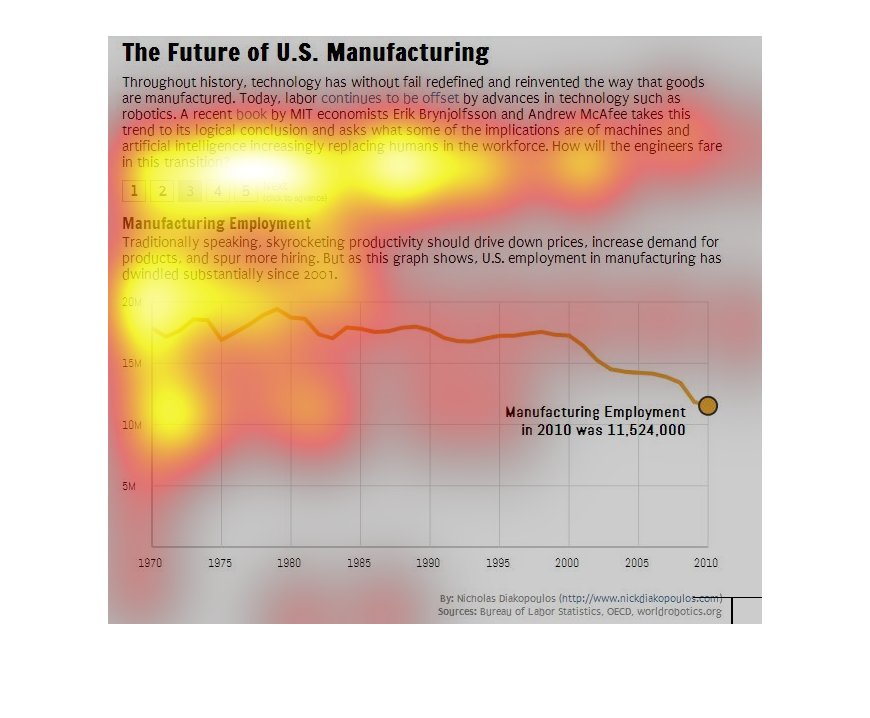
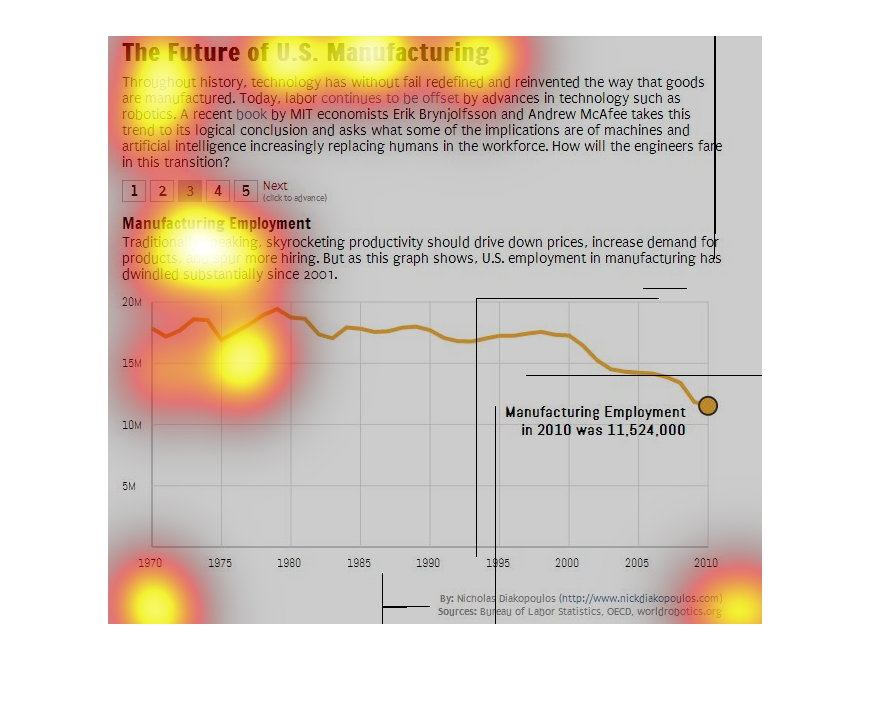
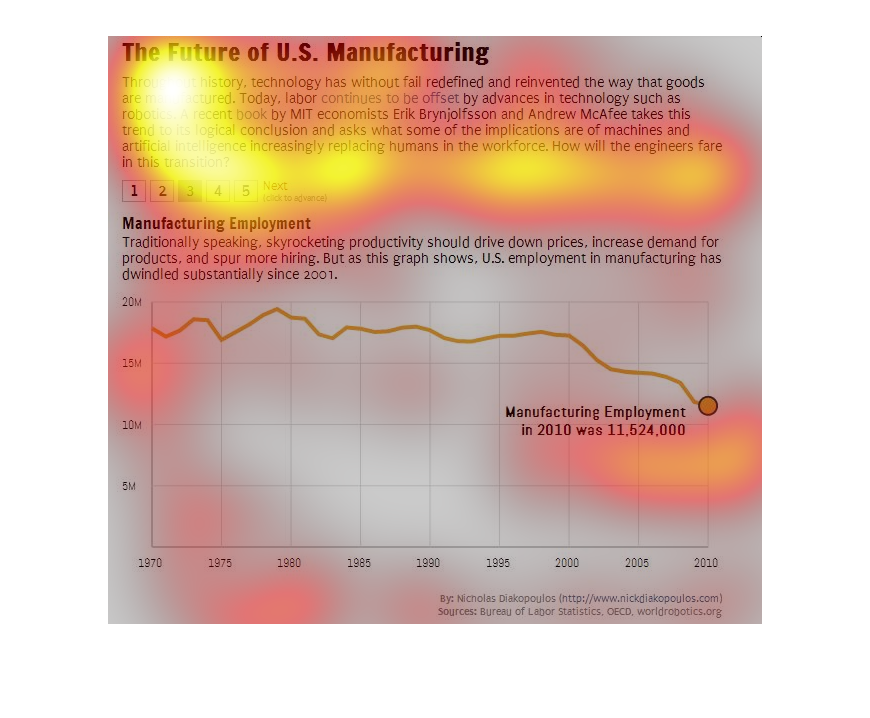
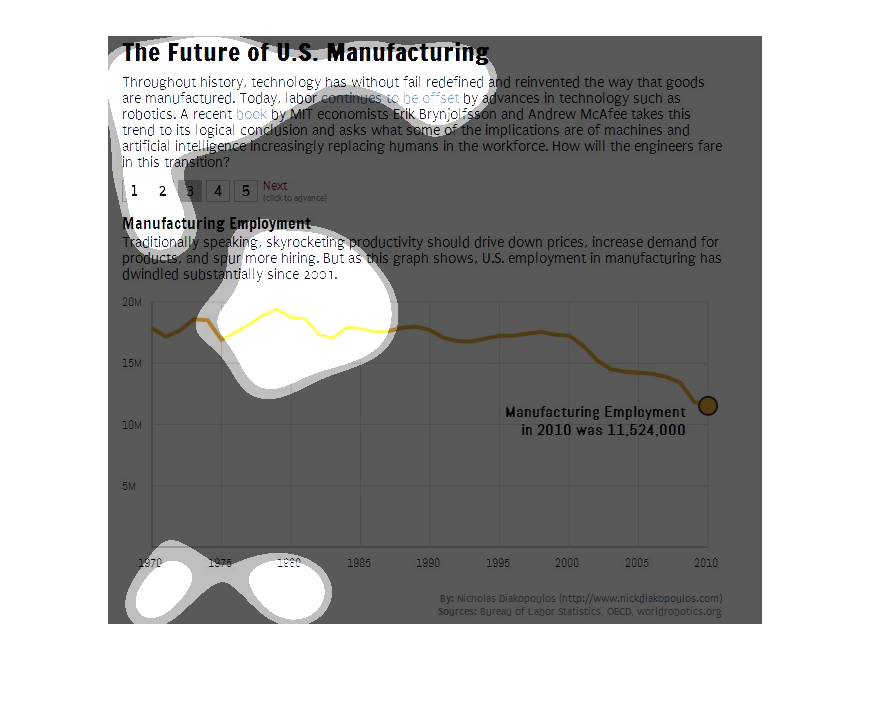
The image depicts the future of US manufacturing by providing a graph, as well as a paragraph
citing the importance of machines and technology in manufacturing and how it affects human
labor. Data cites the years 1970-2010. As the decades pass, it becomes obvious that US manufacturing
has decreased noticeably, with the lowest point being 2010.
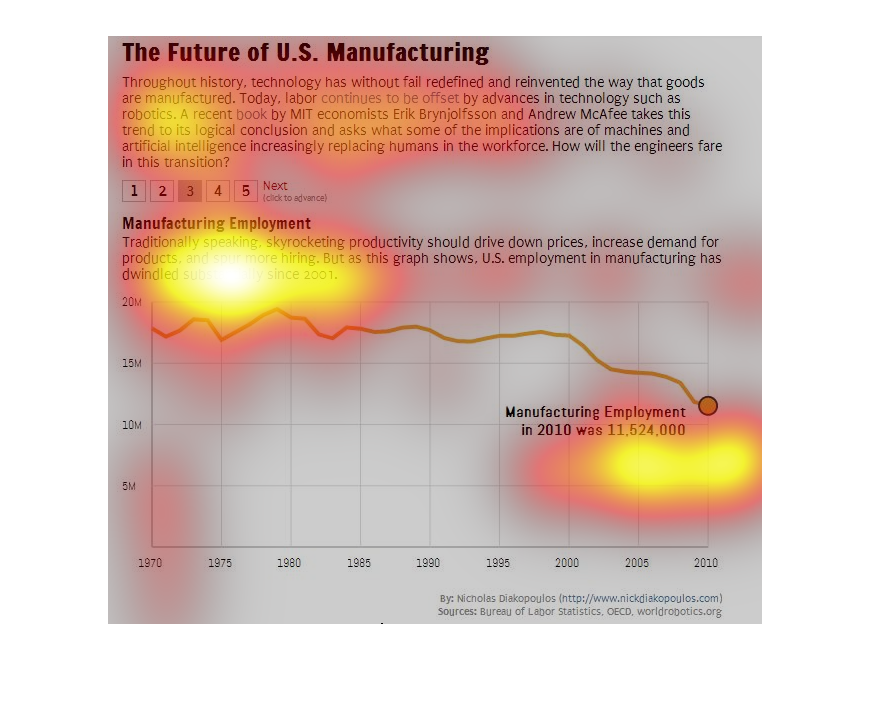
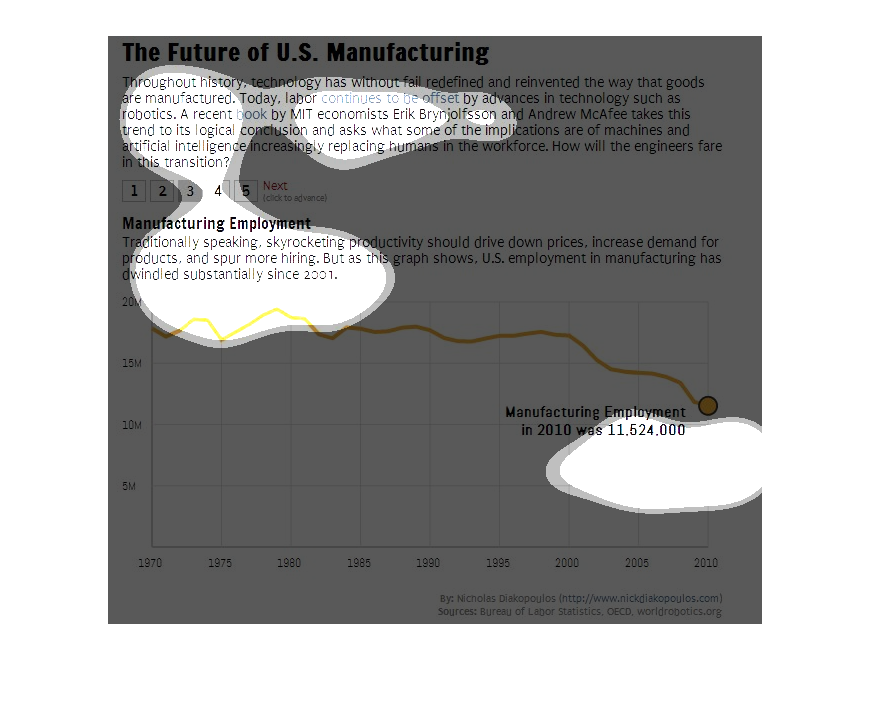
This chart describes the future of United States manufacturing. It tracks manufacturer employment
from the years 1970 to 2010. The number of manufacturer employees in the year 2010 was about
11.5 million. Overall, manufacturer employment was highest in 1980 and started to sharply
decrease in 2010.
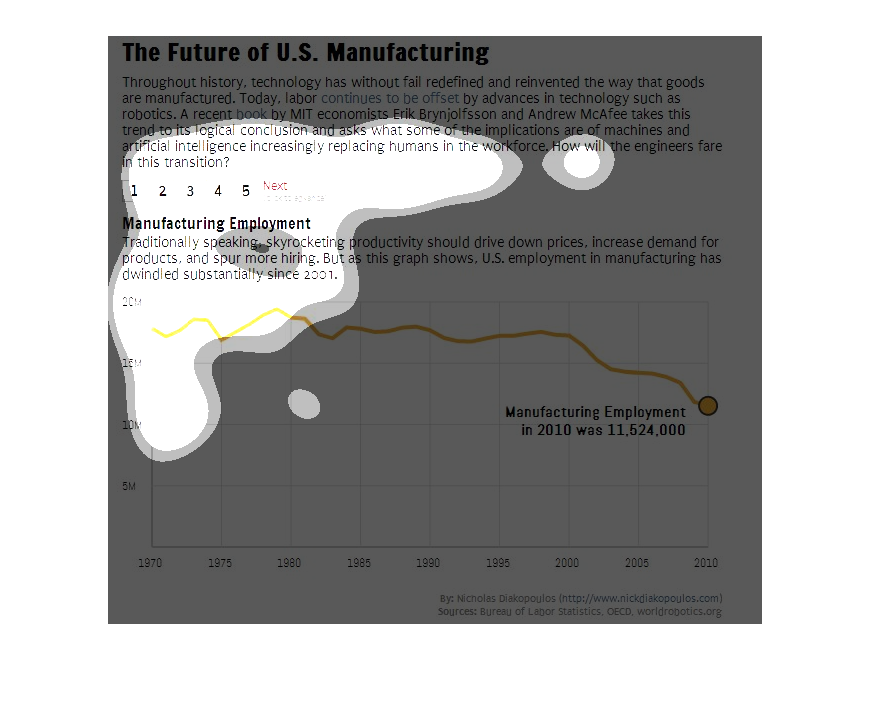
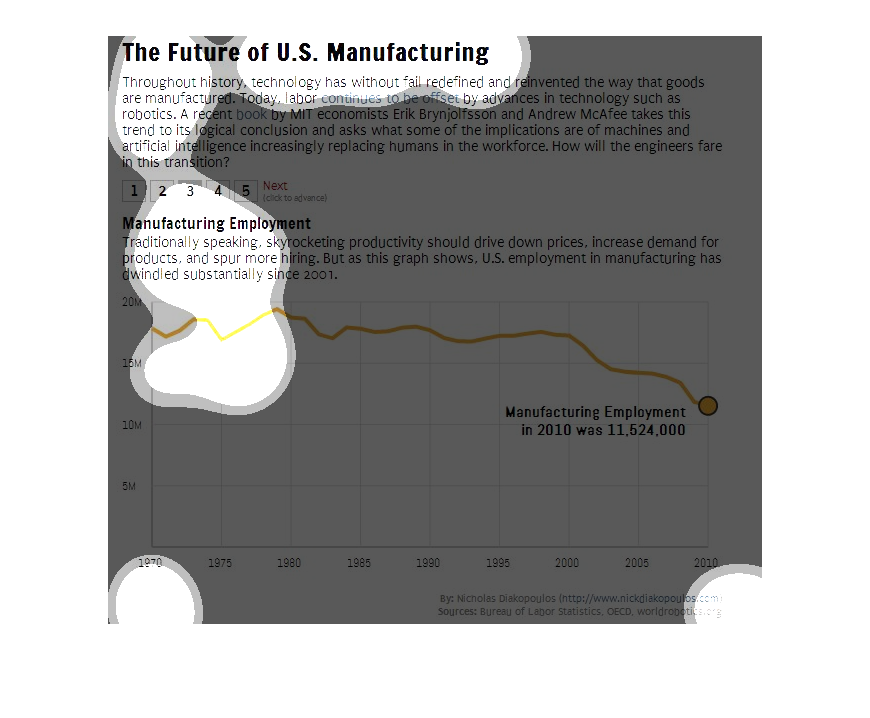
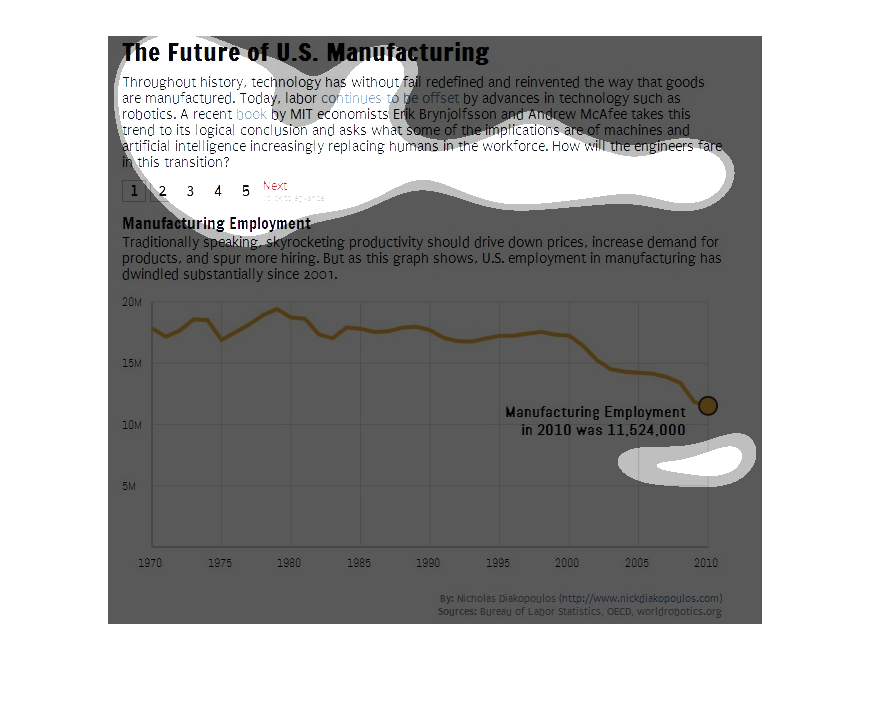
This graph illustrates the future of US manufacturing.  It has statistics about manufacturing
employment up to the year 2011 and a graph over time from 1970 to 2005.
This chart is a representation of the future of manufacturing in the United States of America.
 It also shows statistics for manufacturing employment in the US.
A graft citing a Massachusetts Instite of Technology study on comparing robotic to human workforce
in manufacturing jobs and how this research has shown a decline in the USA.
This chart describes the future of US manufacturing. Specifically, throughout history, technology
has without fail redefined and reinvented the way that goods are manufactured.
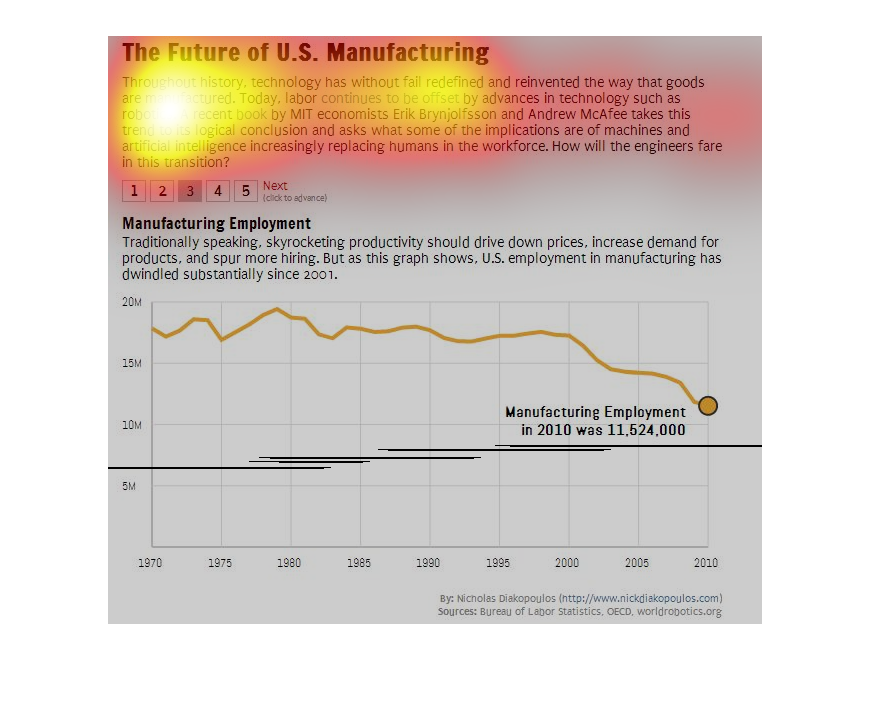
This chart shows the future of U.S. manufacturing. There are several paragraphs describing
this information. The graph covers the years of 1970-2010...
This charts name is called the future of United States and it shows what is in store for the
u.s in the next couple of years. Manufacturing employment of what's going to happen in the
future.
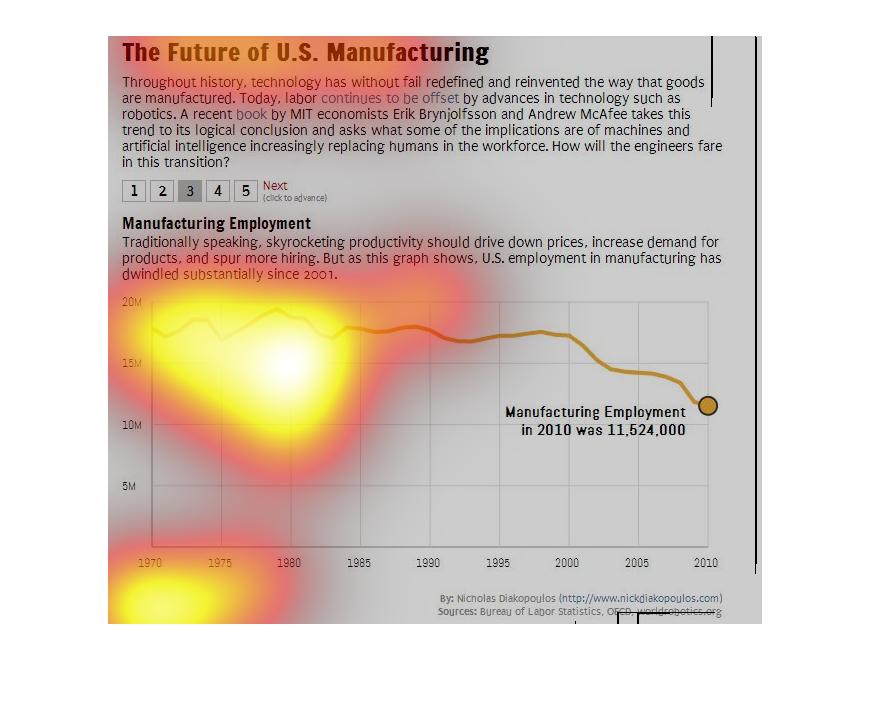
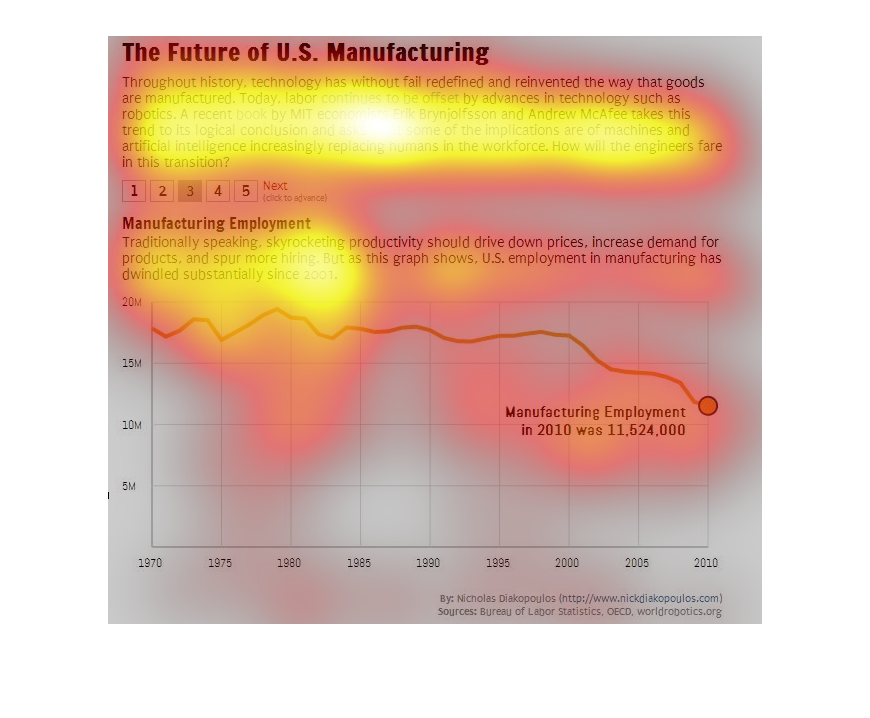
The following chart presents to the viewer how artificial intelligence is slowly replacing
humans in the world of manufacturing. It displays the slow and steady decline of jobs
Its no secret that there are no real jobs in America anymore. All labor intensive jobs have
been shipped over seas where the dollar reigns supreme and goes a long way. This graph goes
into detail and demonstrates that trend over the decades.
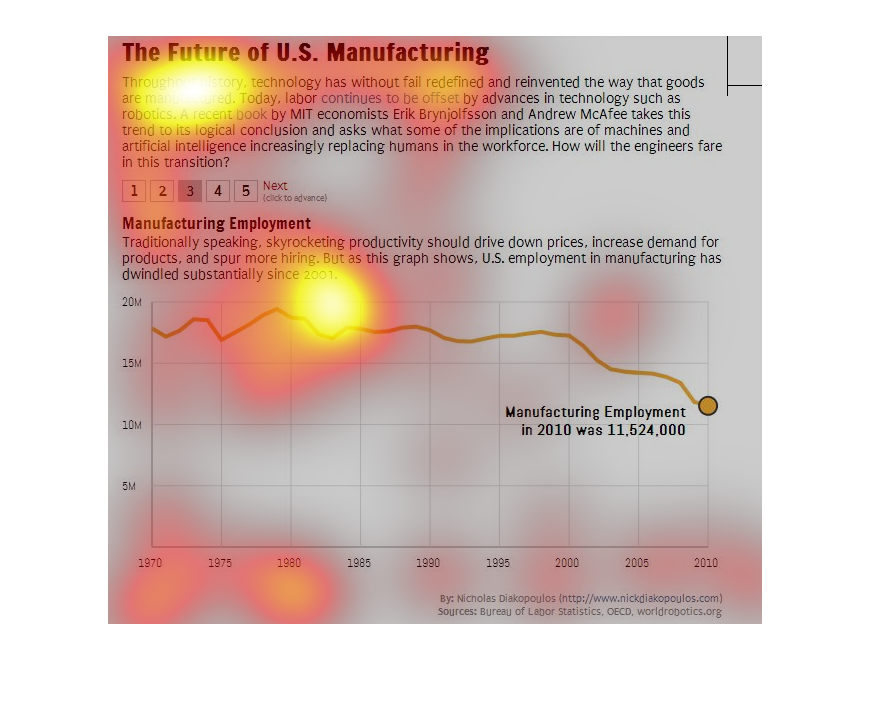
It explains the increased use of robots and artificial intelligence to manufacture products
in the US and the gradual and substantial decline of employment.