The graph describes people who are under nutrition in our world. There are 925 million people
in the world who are undernourished.  It gives other basic facts.
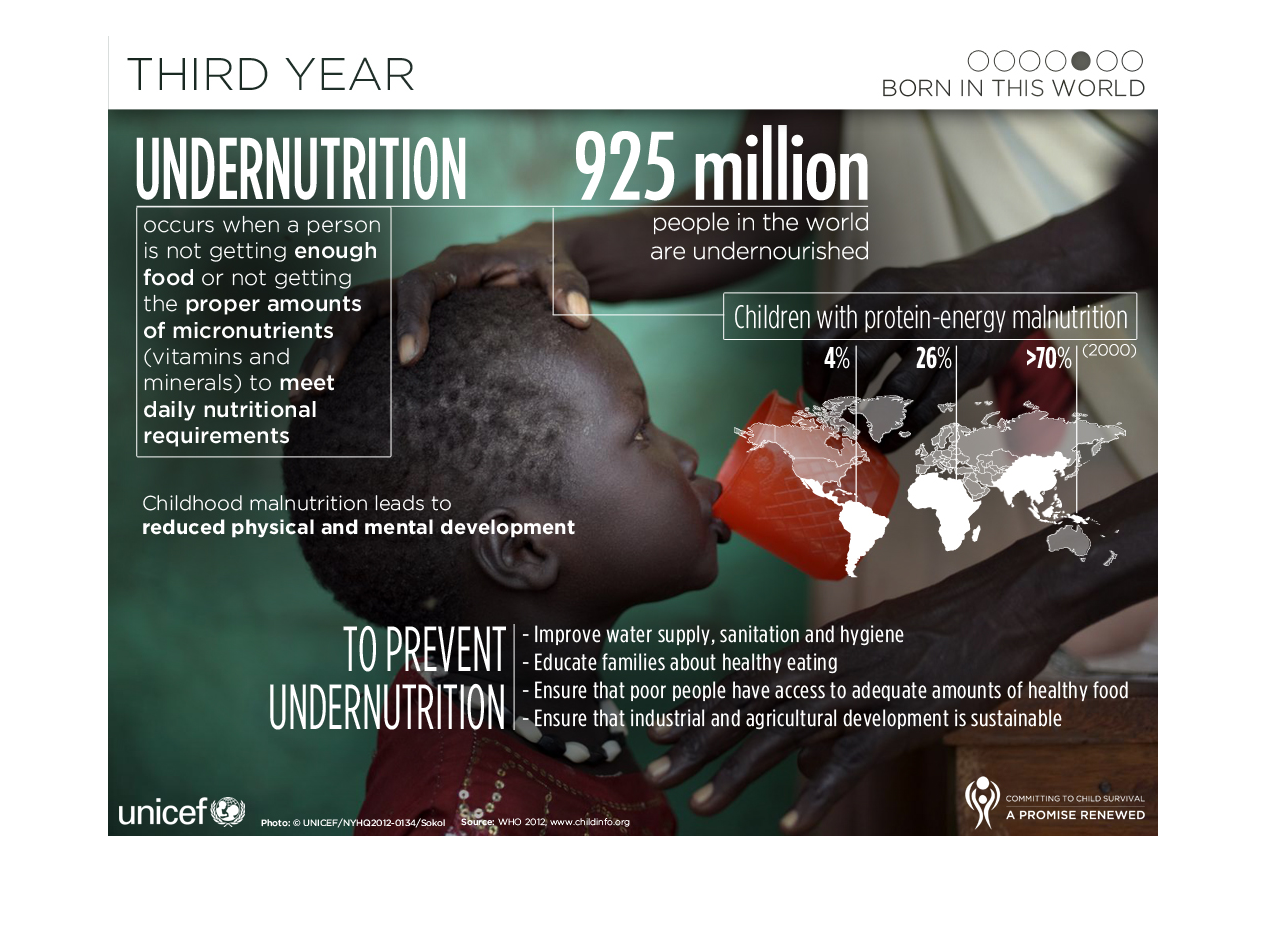
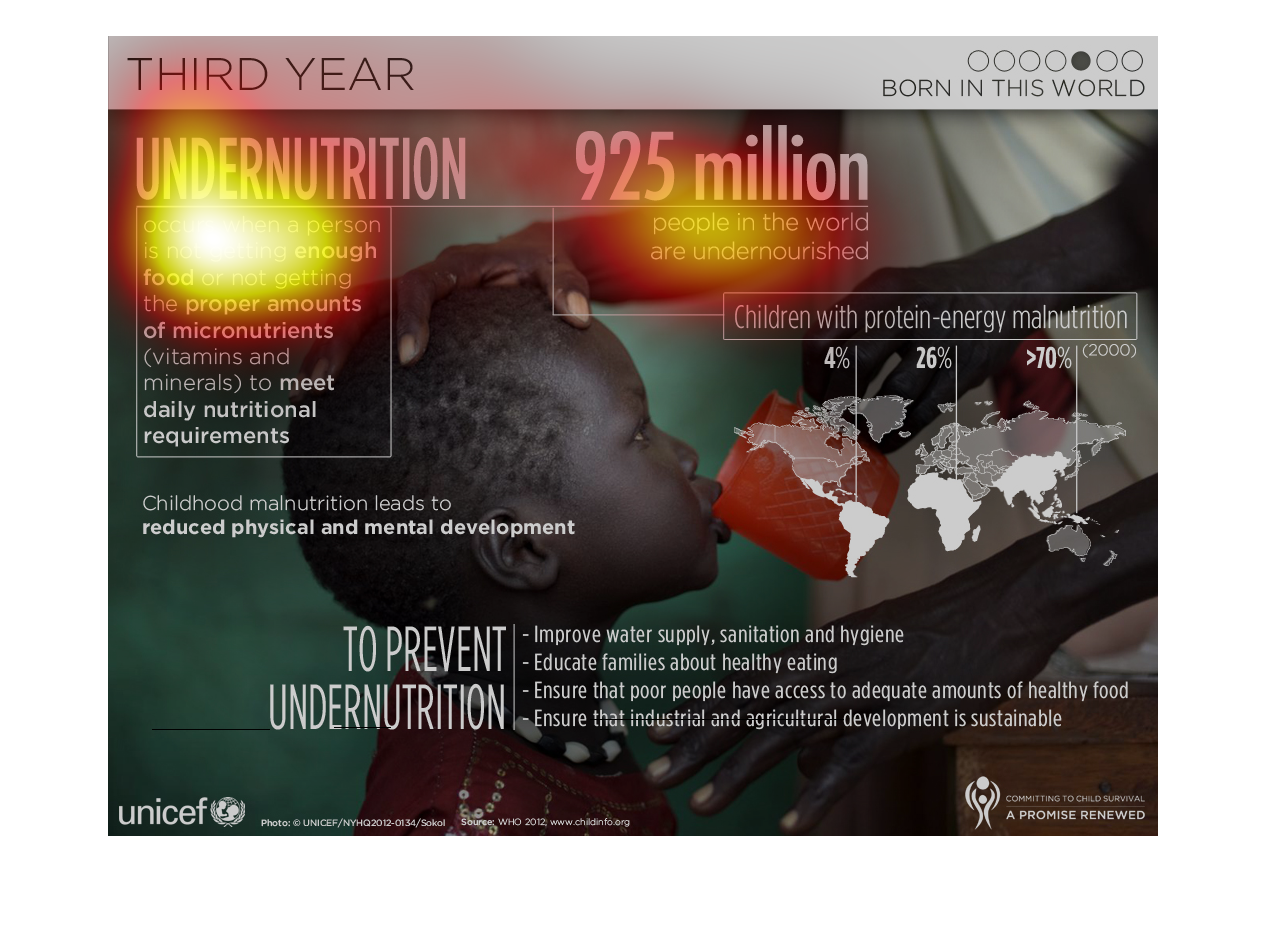
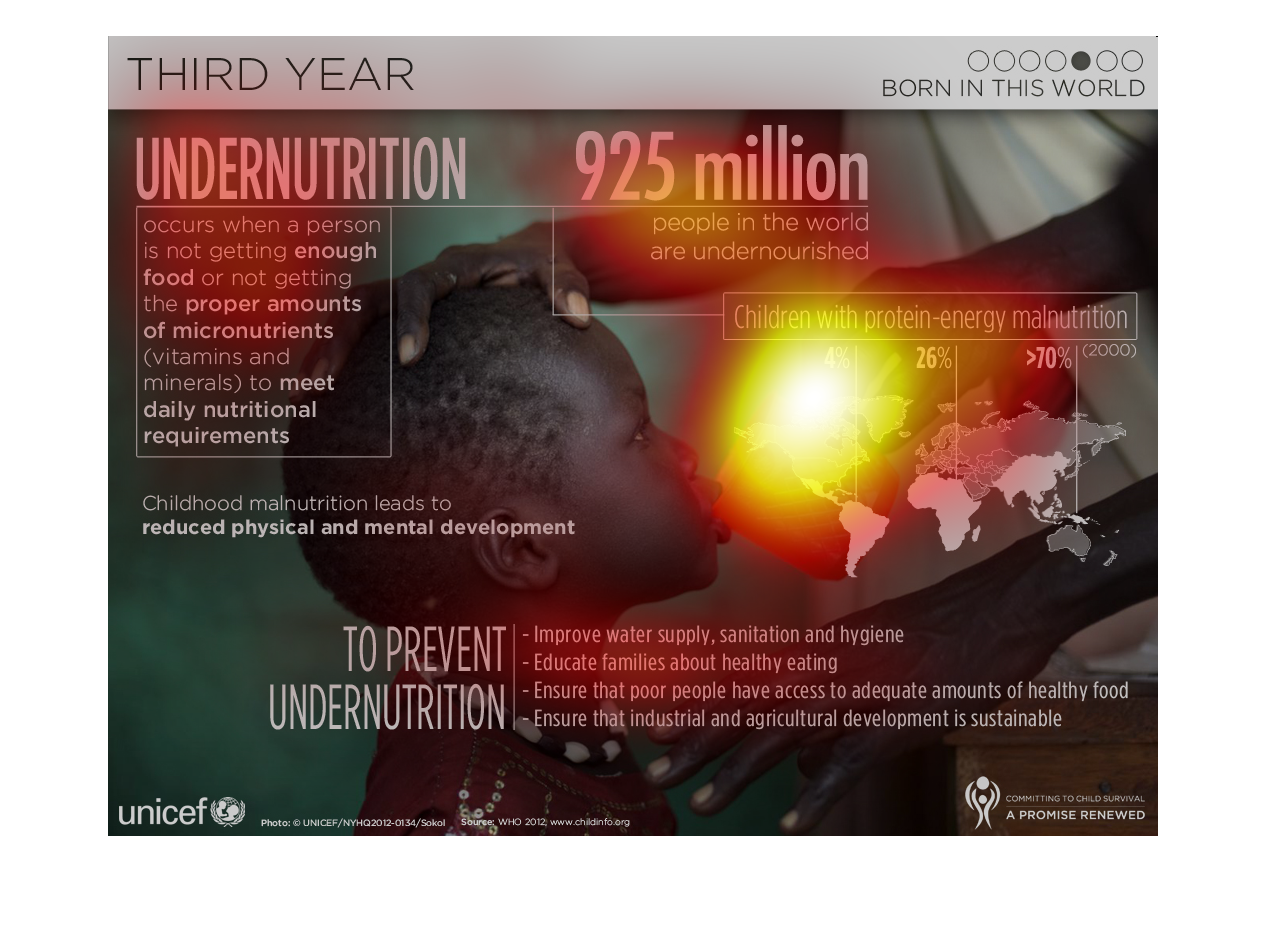
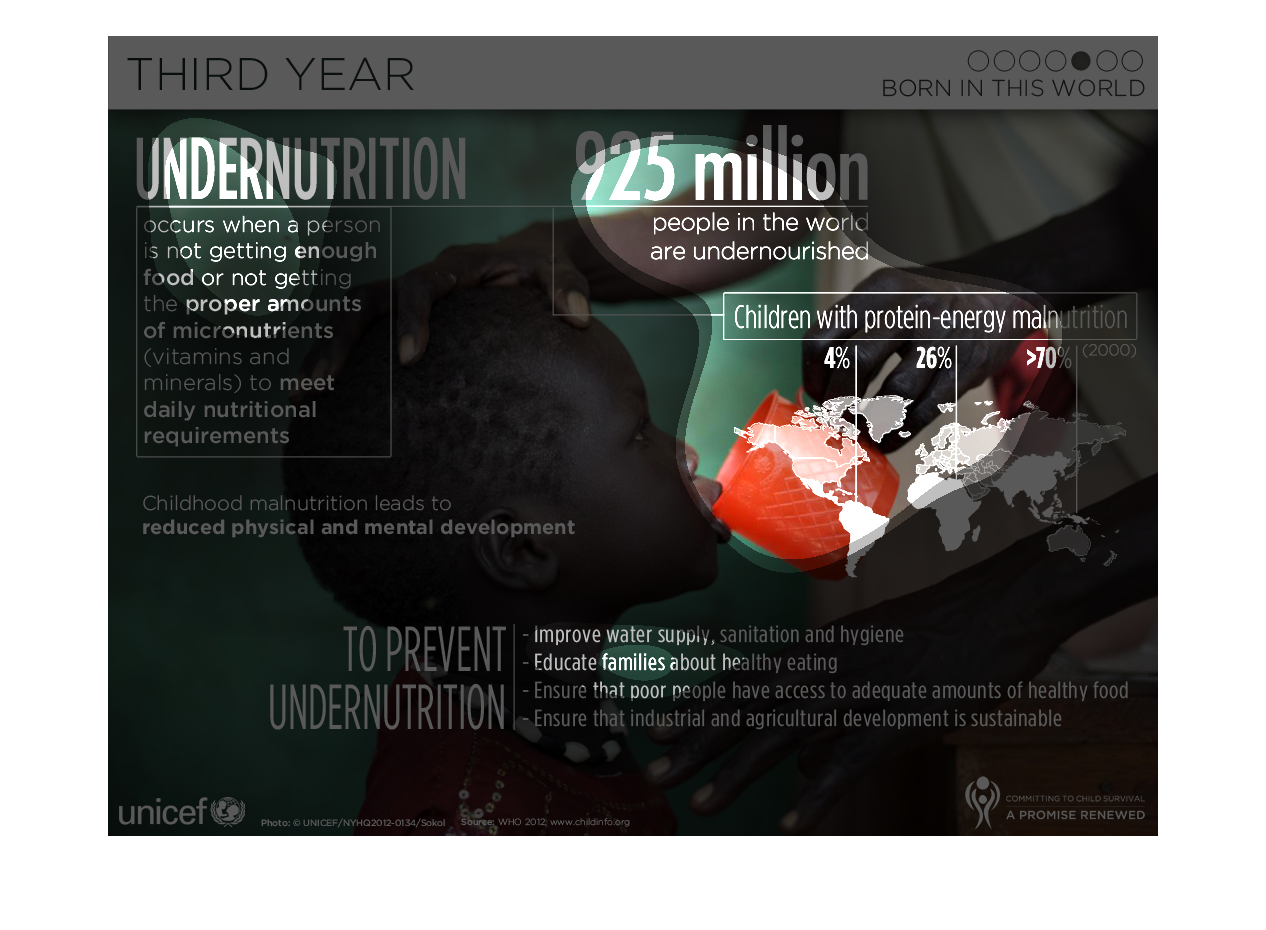
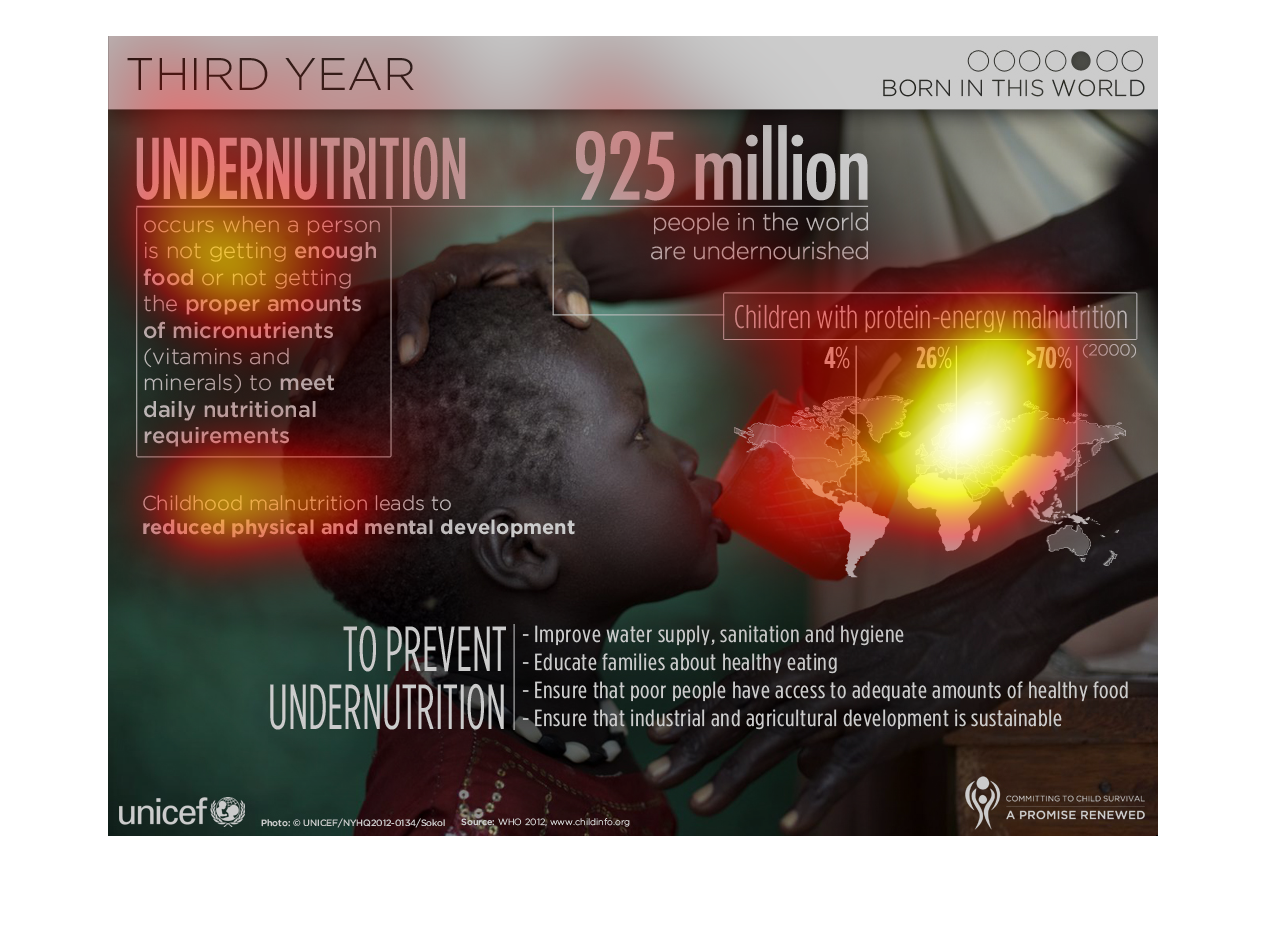
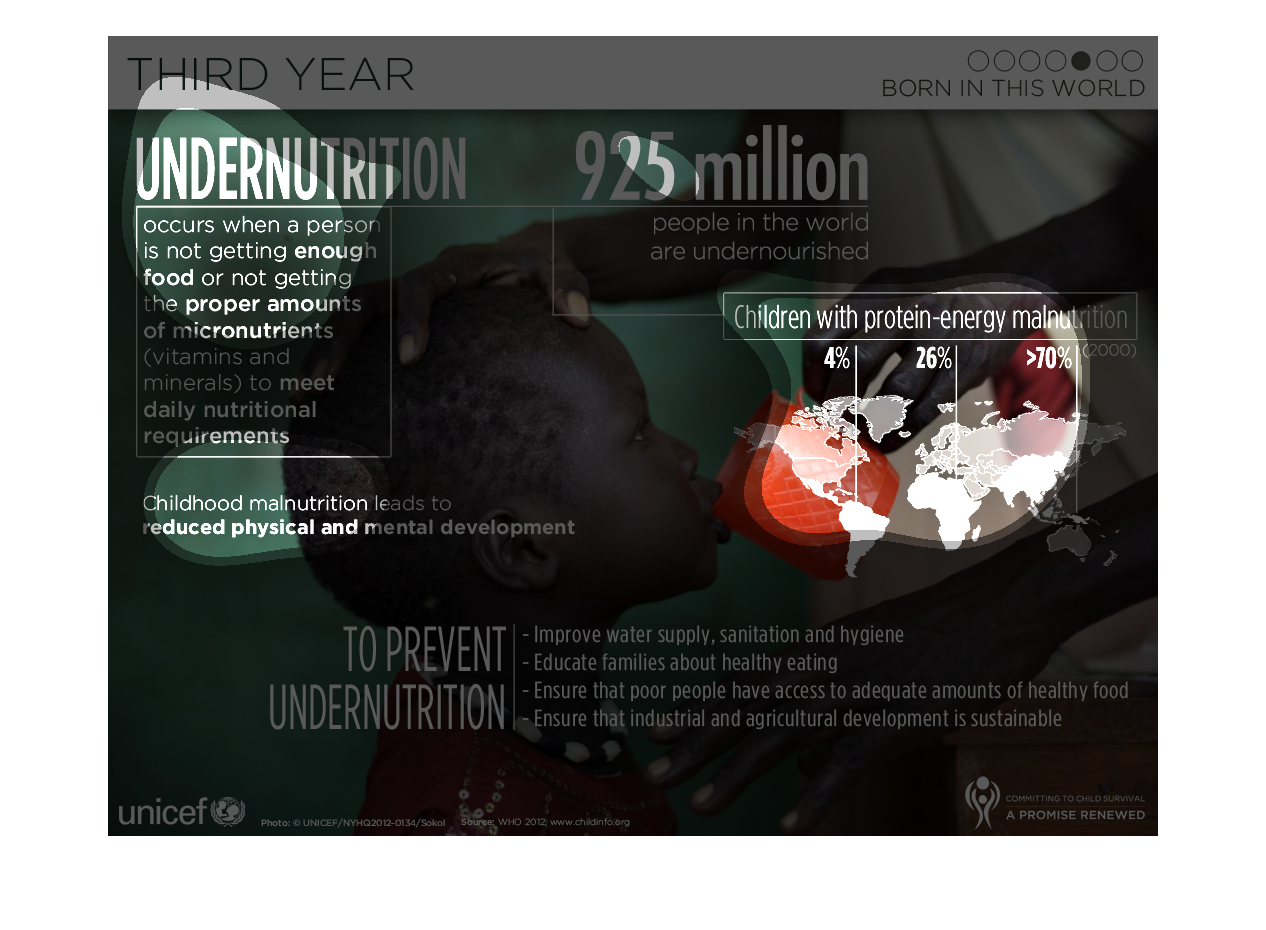
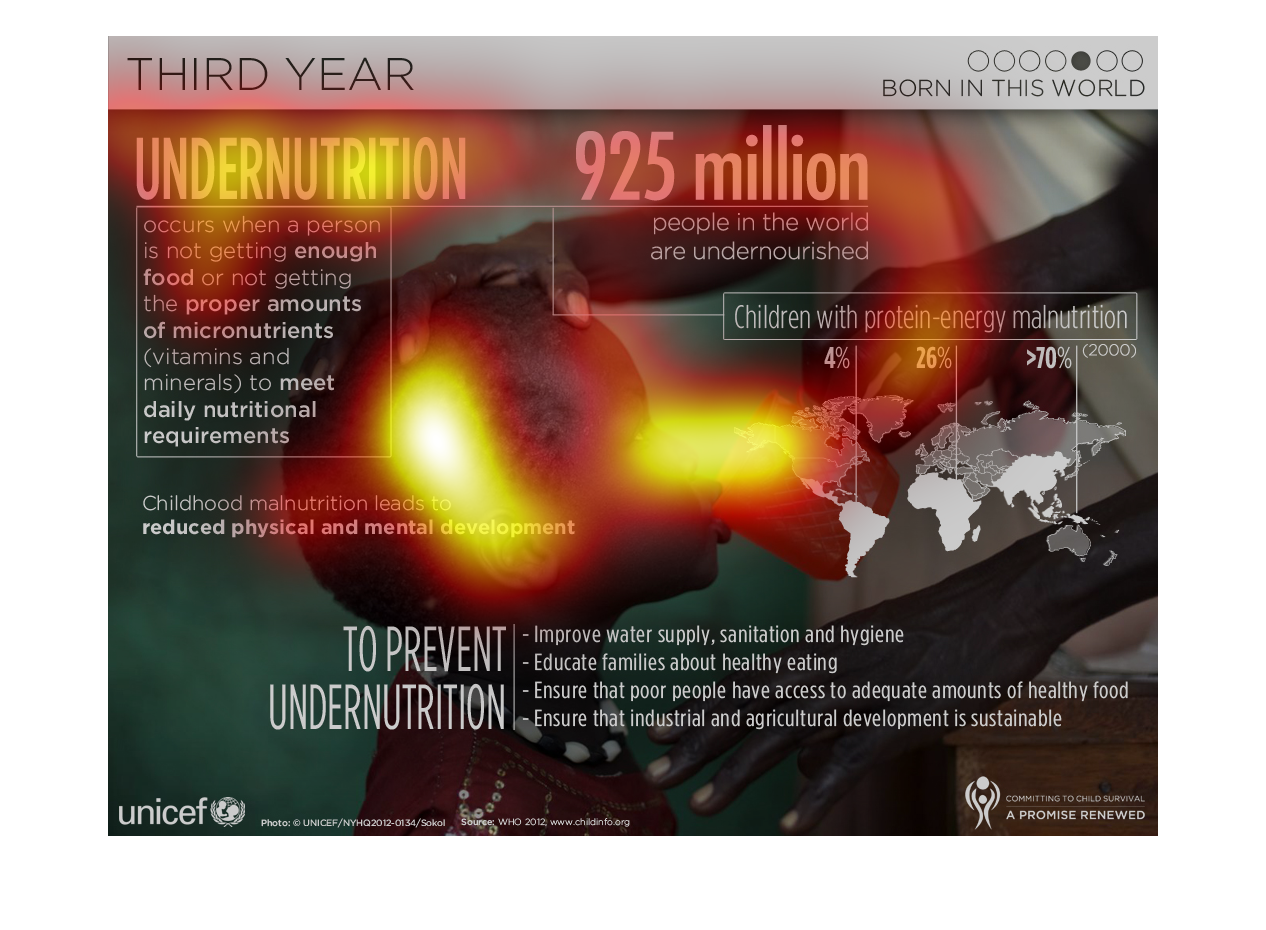
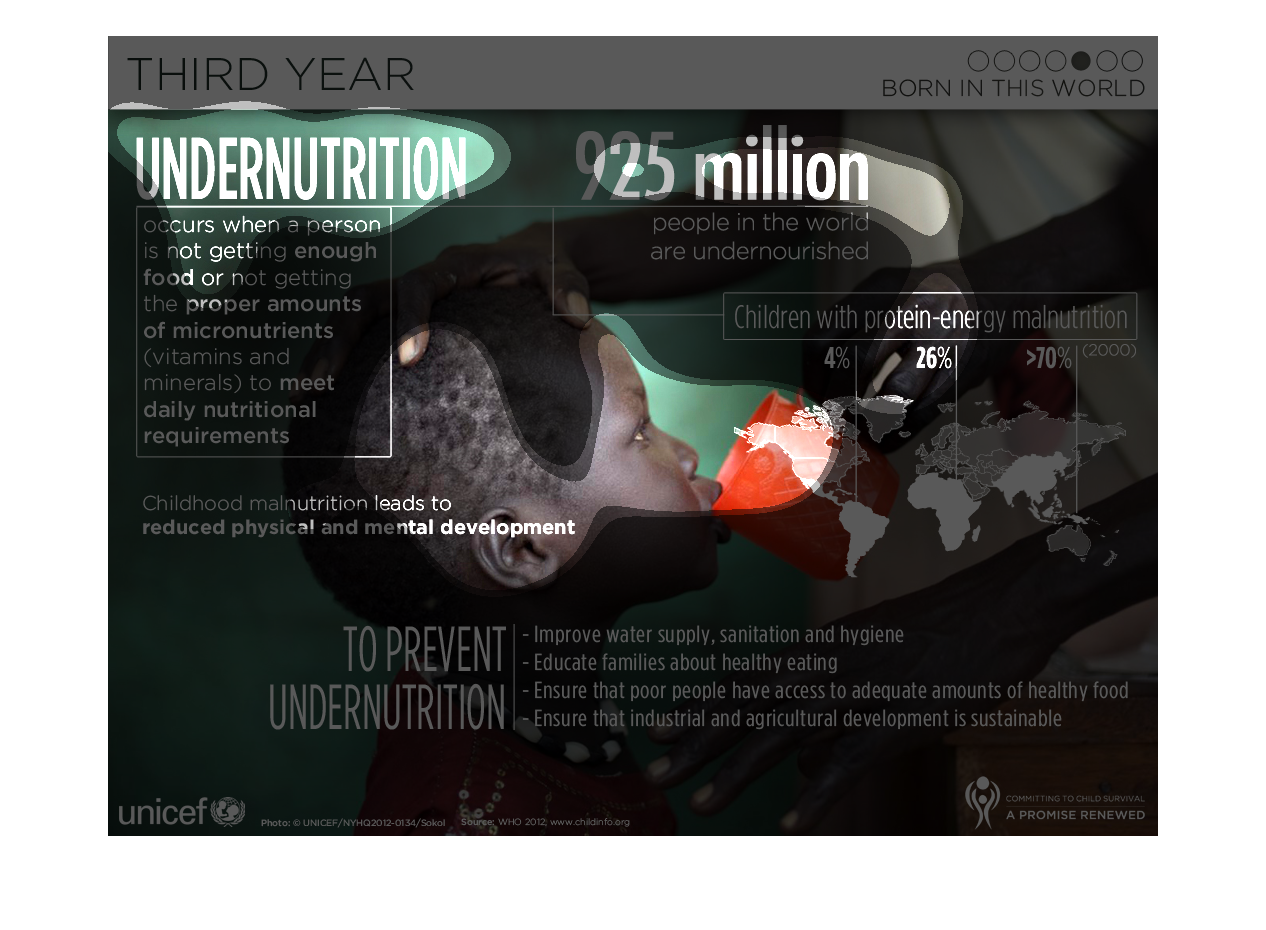
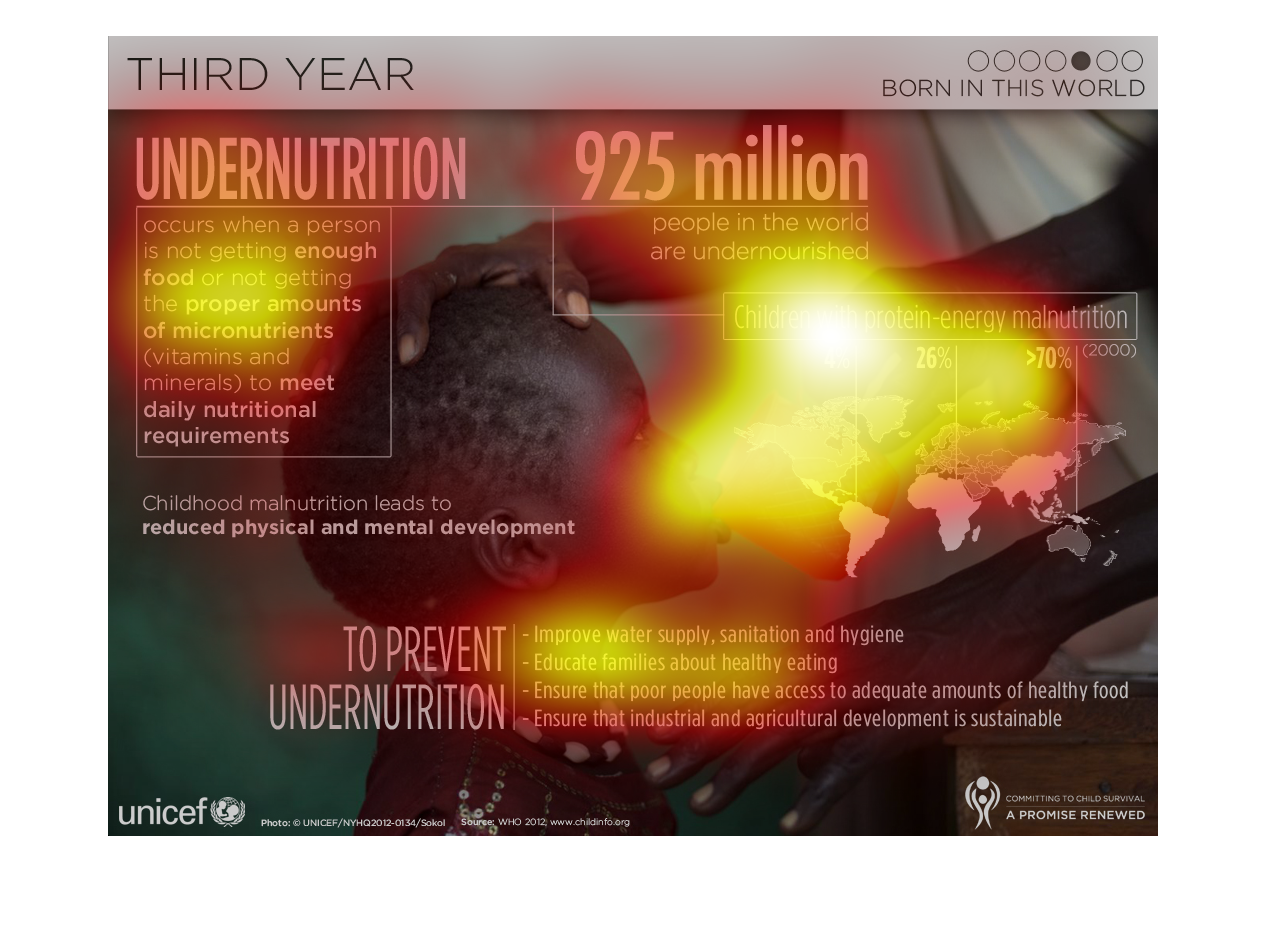
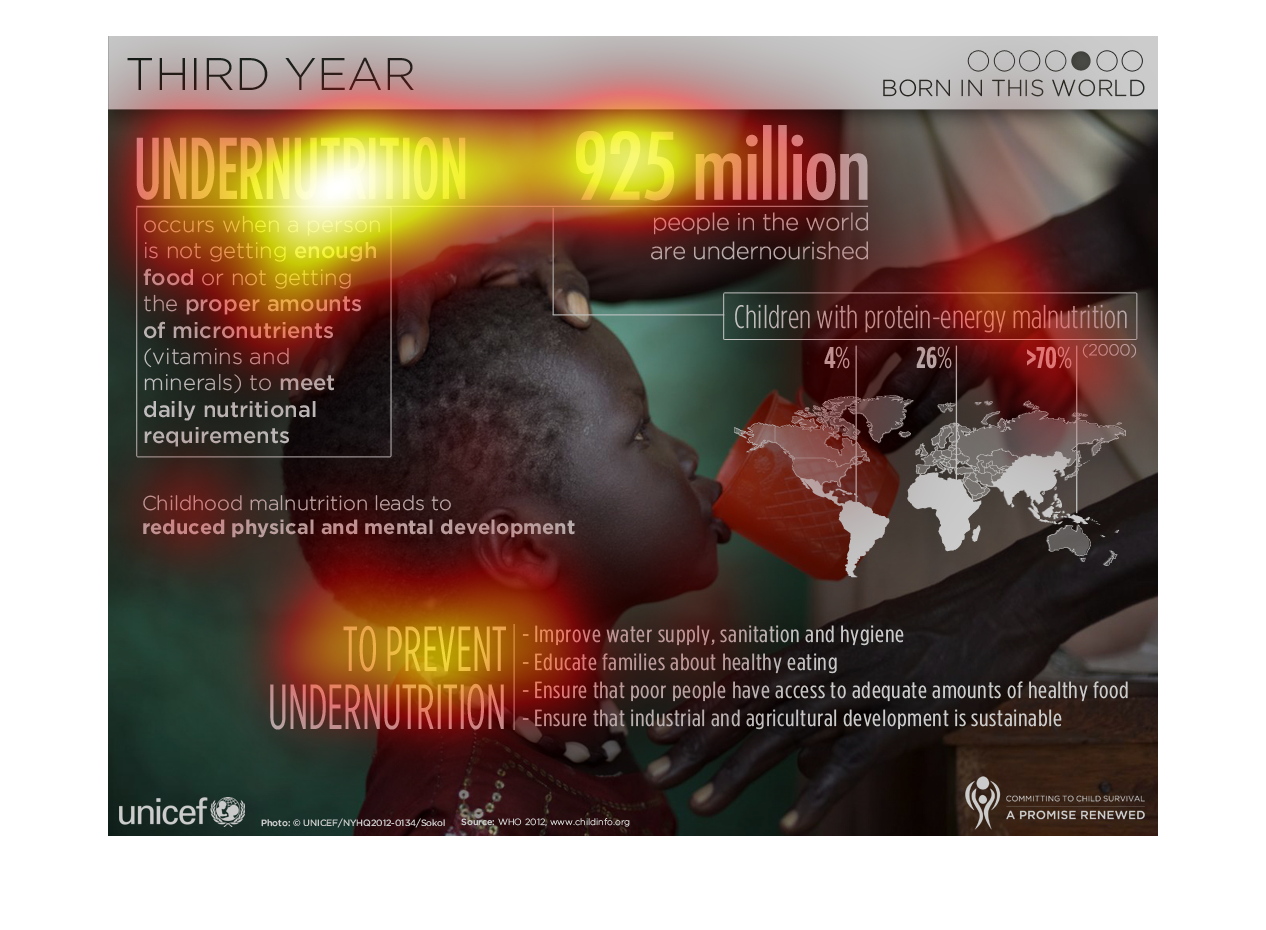
The image depicts the problem with lack of nutrition around the world. 925 million people
in the world are undernourished. The image explains what undernutrion is, and why it occurs,
the dangers of undernutrion and consequences, and also lays out solutions to ensure that populations
have proper nutrition as a whole. The image has a map of the world, and areas heavily affected
by undernutrion. Source is UNICEF.
This chart informed me that 925 million people in the world are undernourished. Undernourishment
happens when a person does not get enough food to meet their nutritional needs.

This chart describes under nutrition. It states that 92 million people in the world are undernourished.
It explains that under nutrition occurs when a person is not getting enough food.
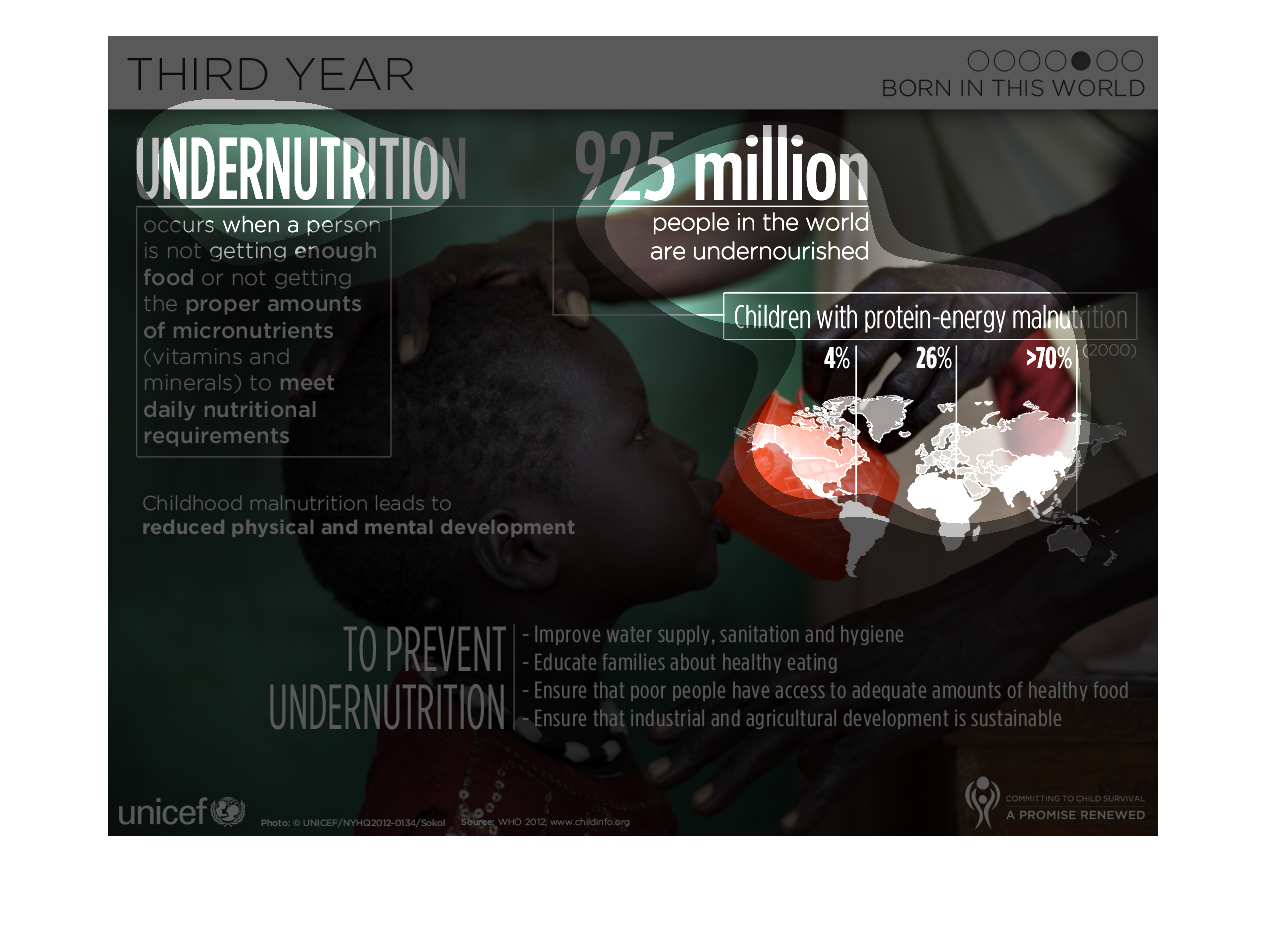
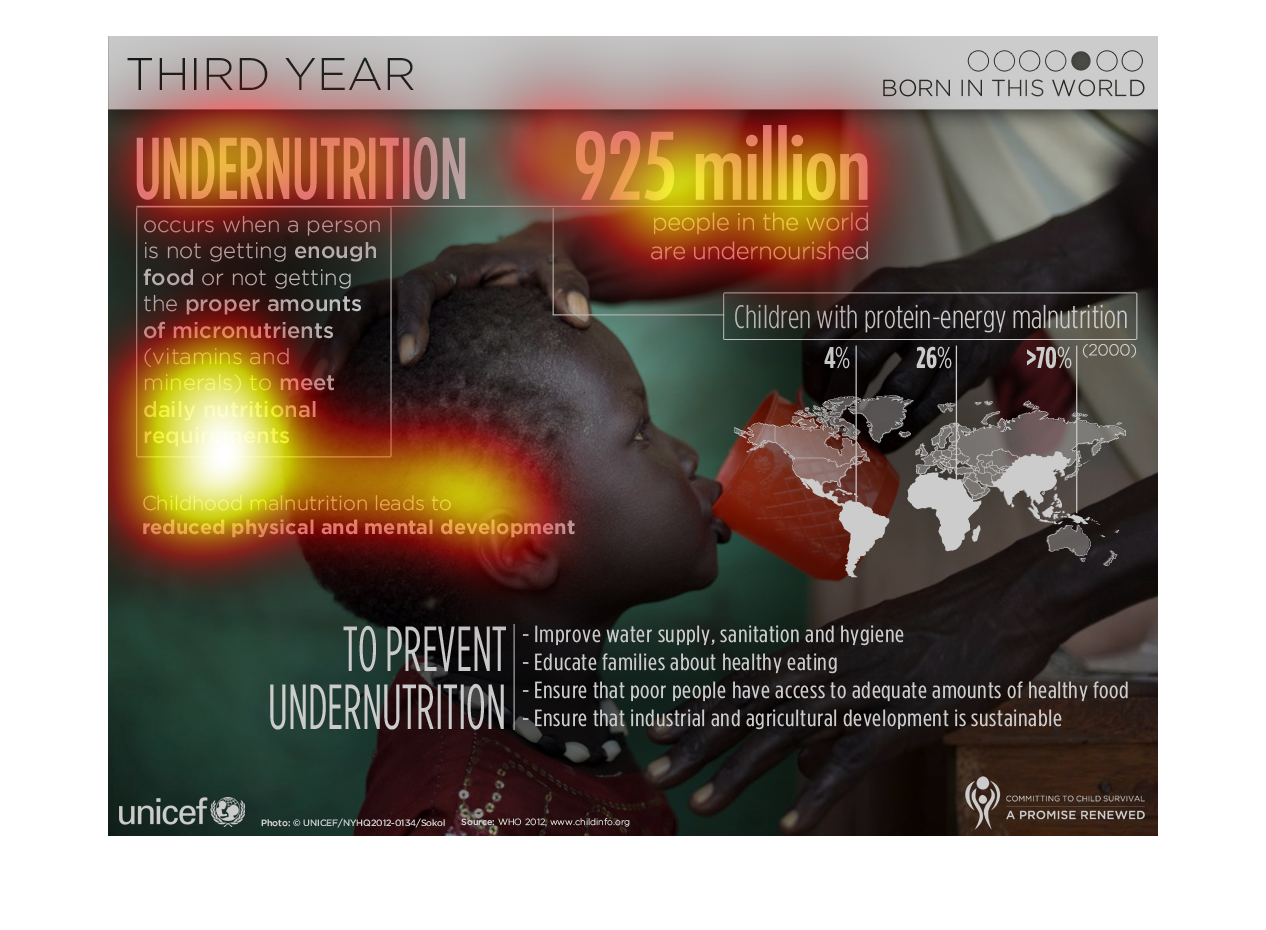
The following chart gives information about mal nourishment in our world. It states that 922
Million people on the earth are mal nourished. With 26% in Africa and a very high 76 percent
in southeast asia.
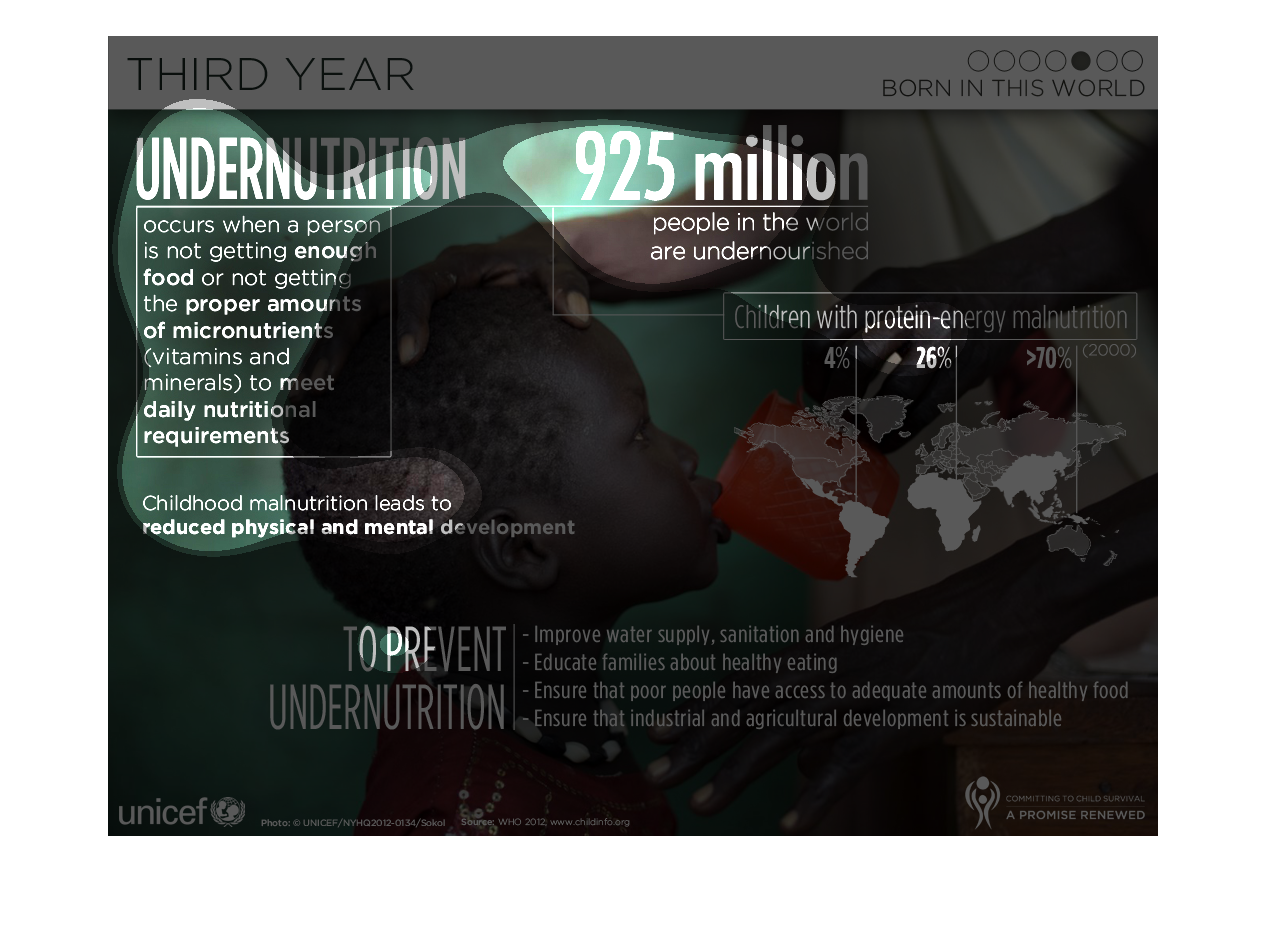
The graph on the left hand side is depicting under-nutrition facts and preventative ways to
keep this deadly disease kill less.  According to this graph 925 million individuals suffer
from under nutrition.  This occurs when an individual is not obtaining appropriate foods and
hydration for their body.
This graph illustrates under nutrition including the number of people in the world who are
malnourished.  It also talks about the effects of malnourishment and what is needed to retain
health.
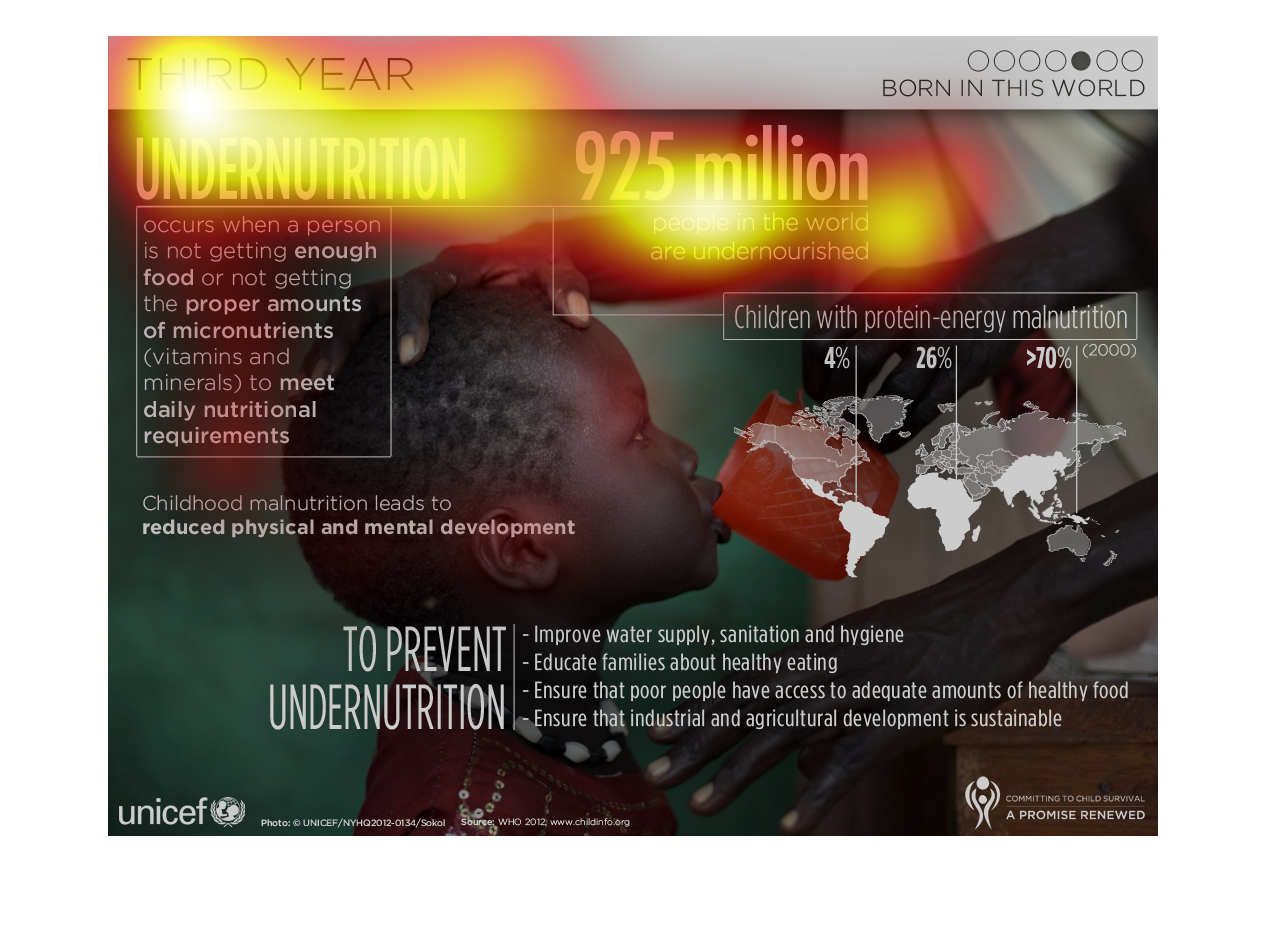
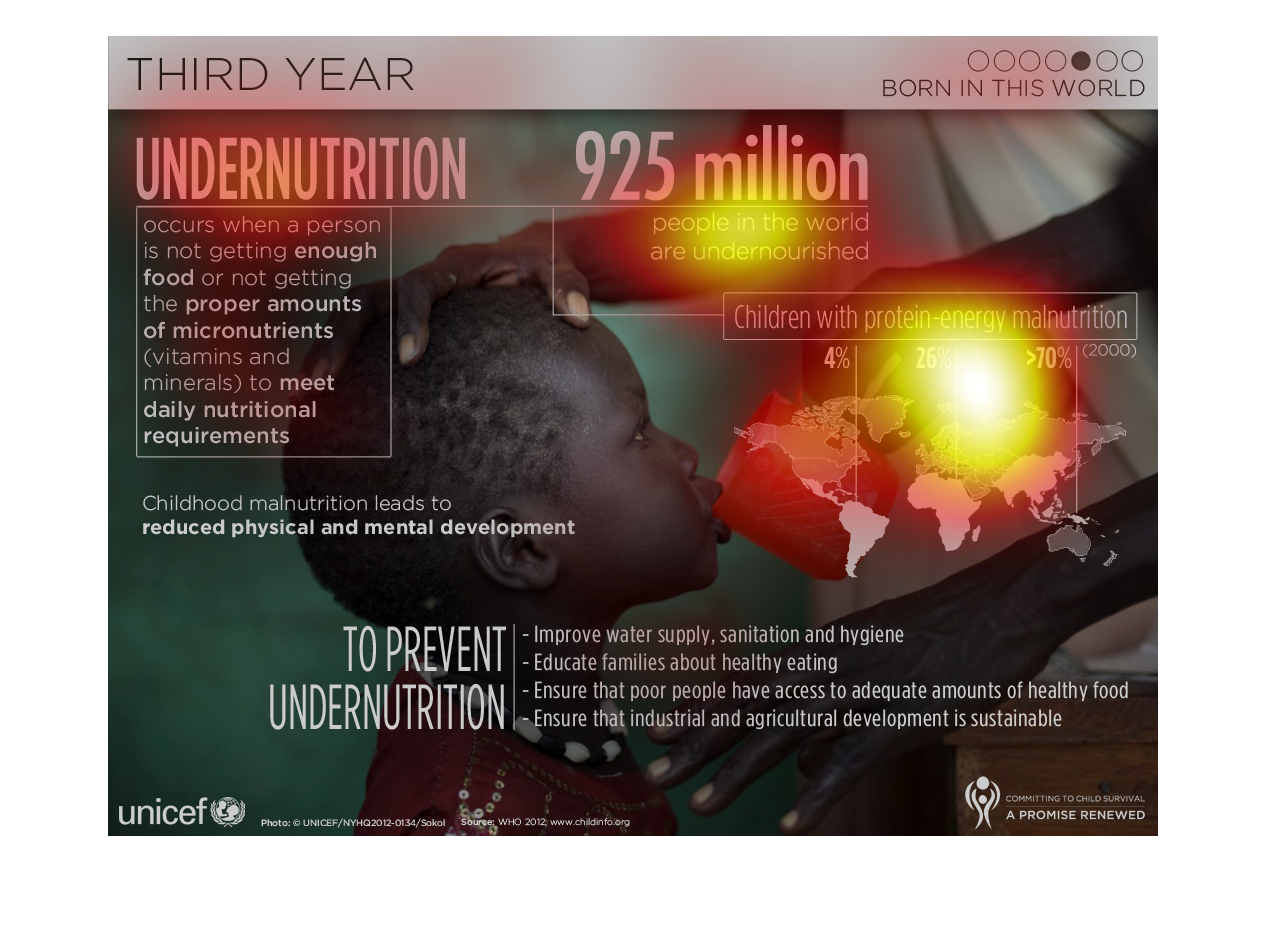
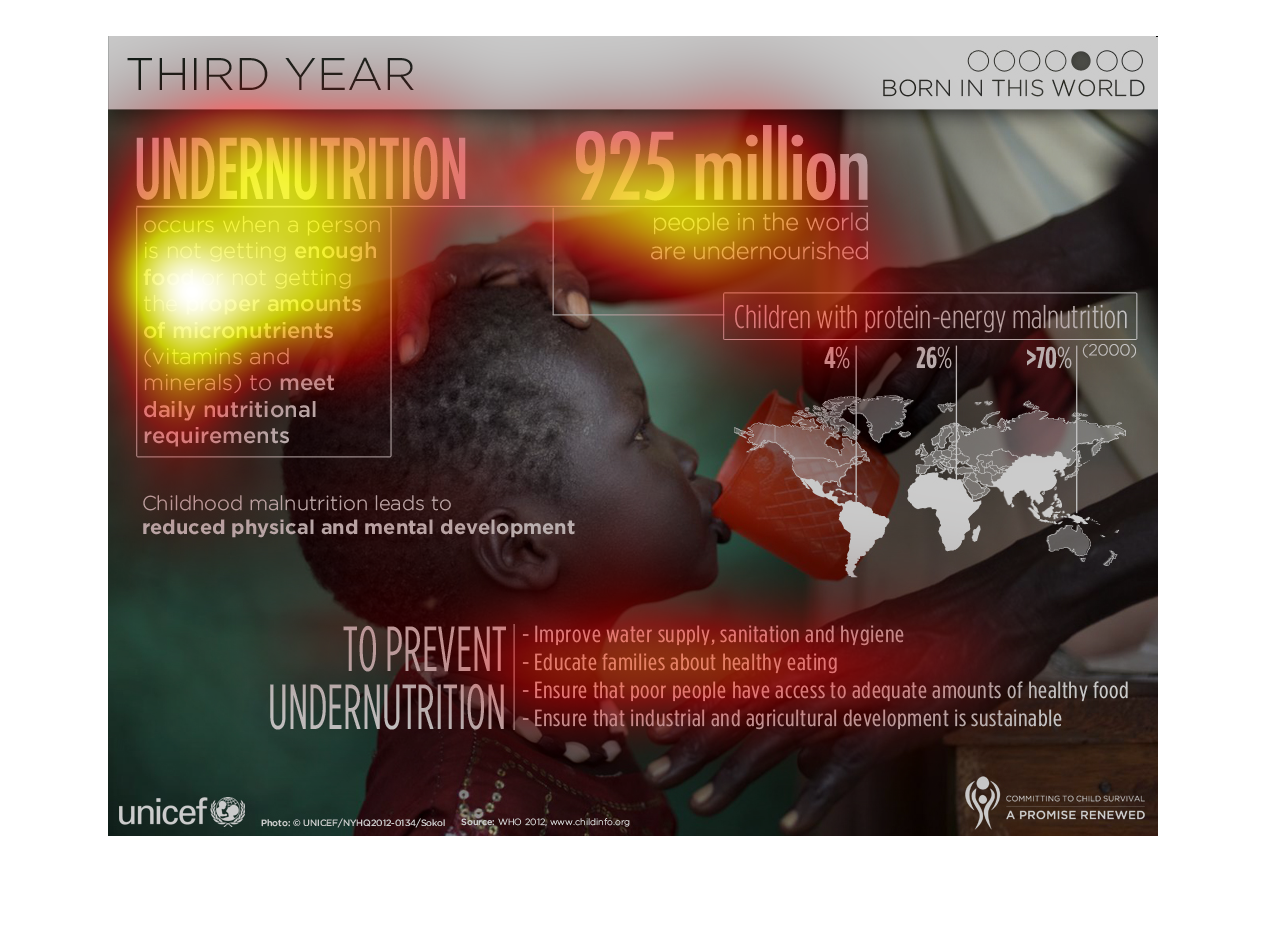
This image describes undernutrition which is when a person does not get sufficient food or
nutrient in their body. Under nutrition can be prevented by proving adequate access to food
to poor people. Improving water supply and sanitation, educating families about healthy eating,
and having sustainable agricultural and industrial development. 92.5 million people in the
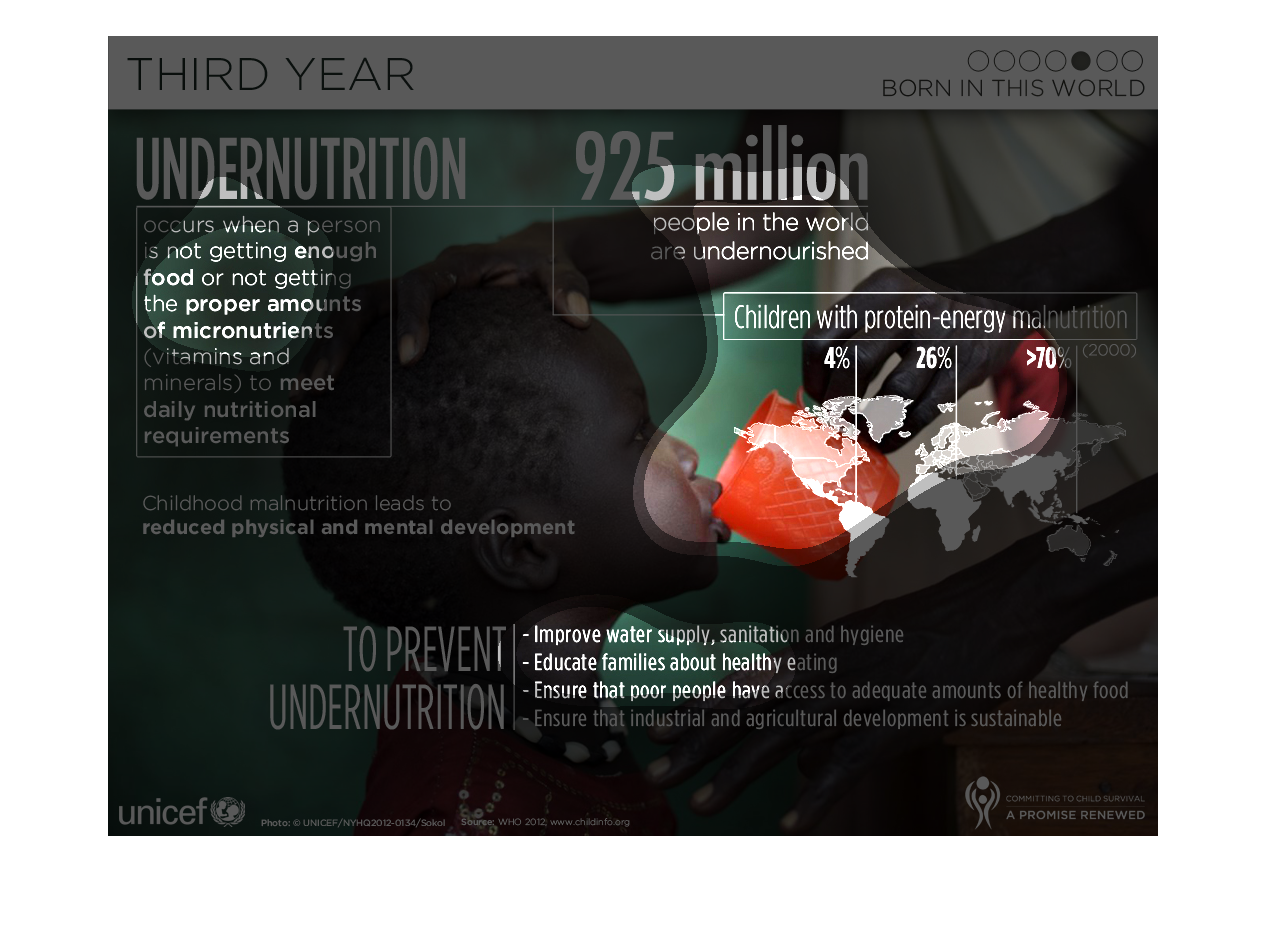
world are undernourished in the world. Stats given regarding children with protein-energy
malnutrition. As of 2000, South America experience 4% of protein-energy malnutrition, Africa
26% and Asia is greater than 10%.
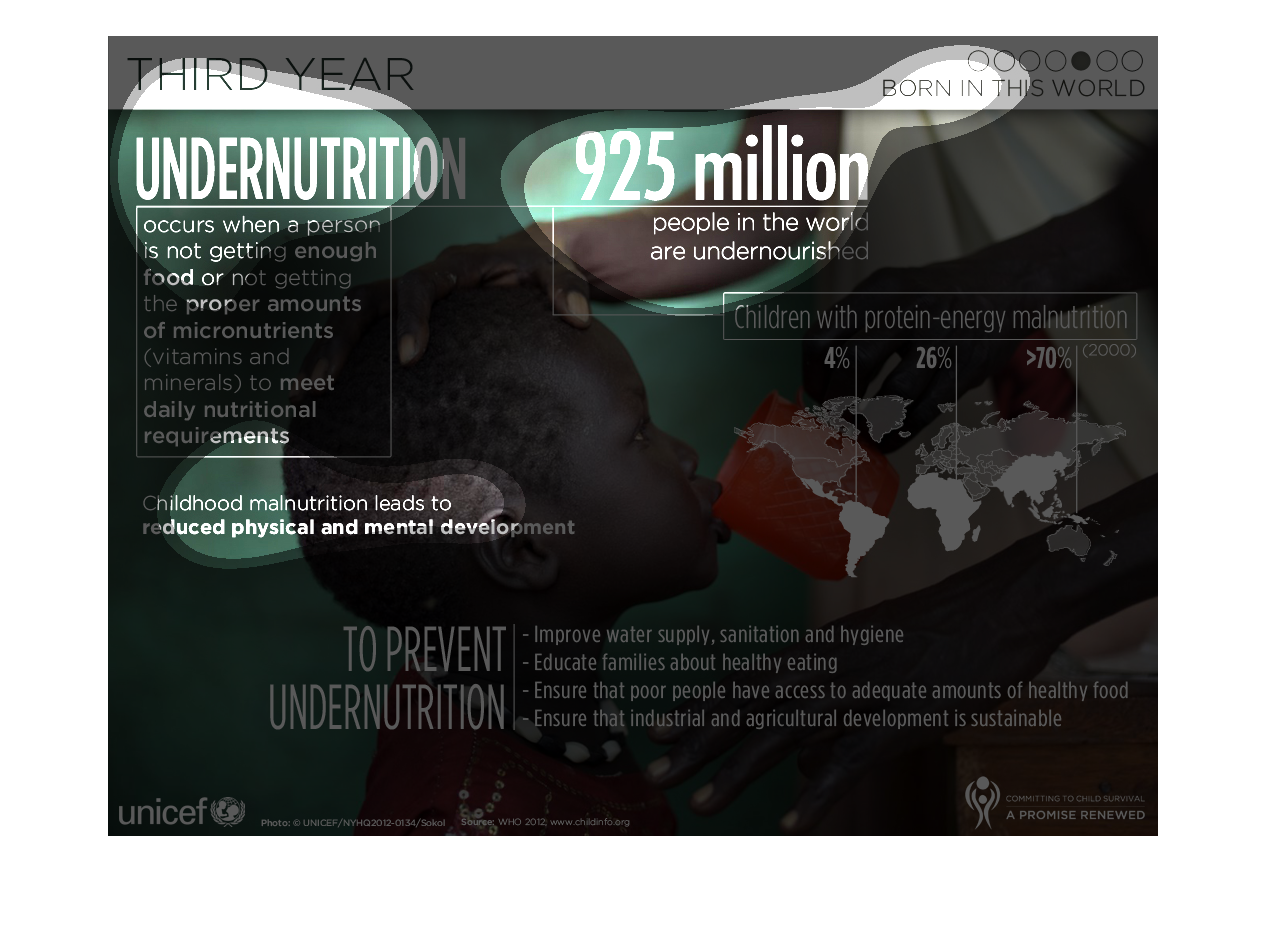
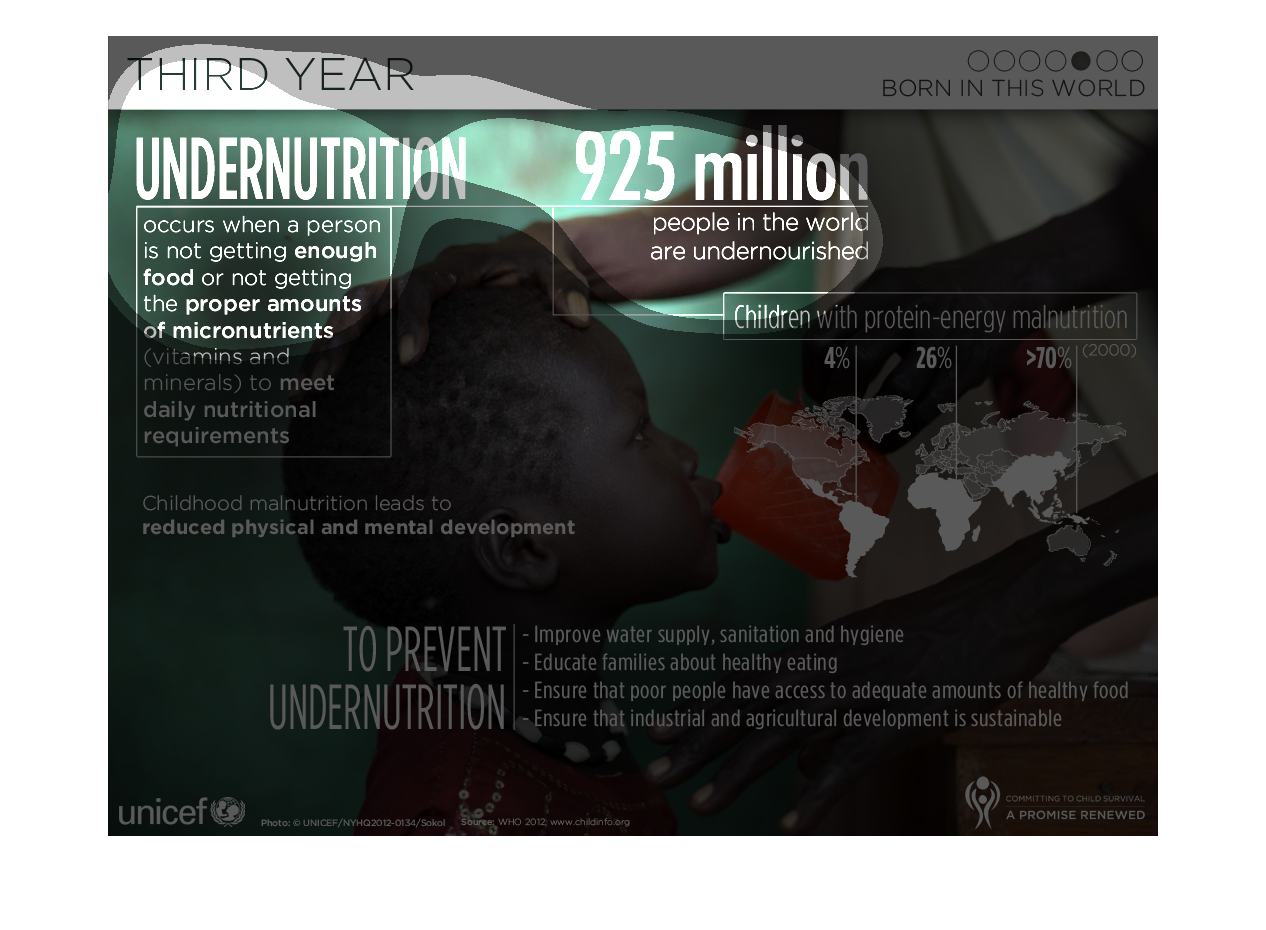
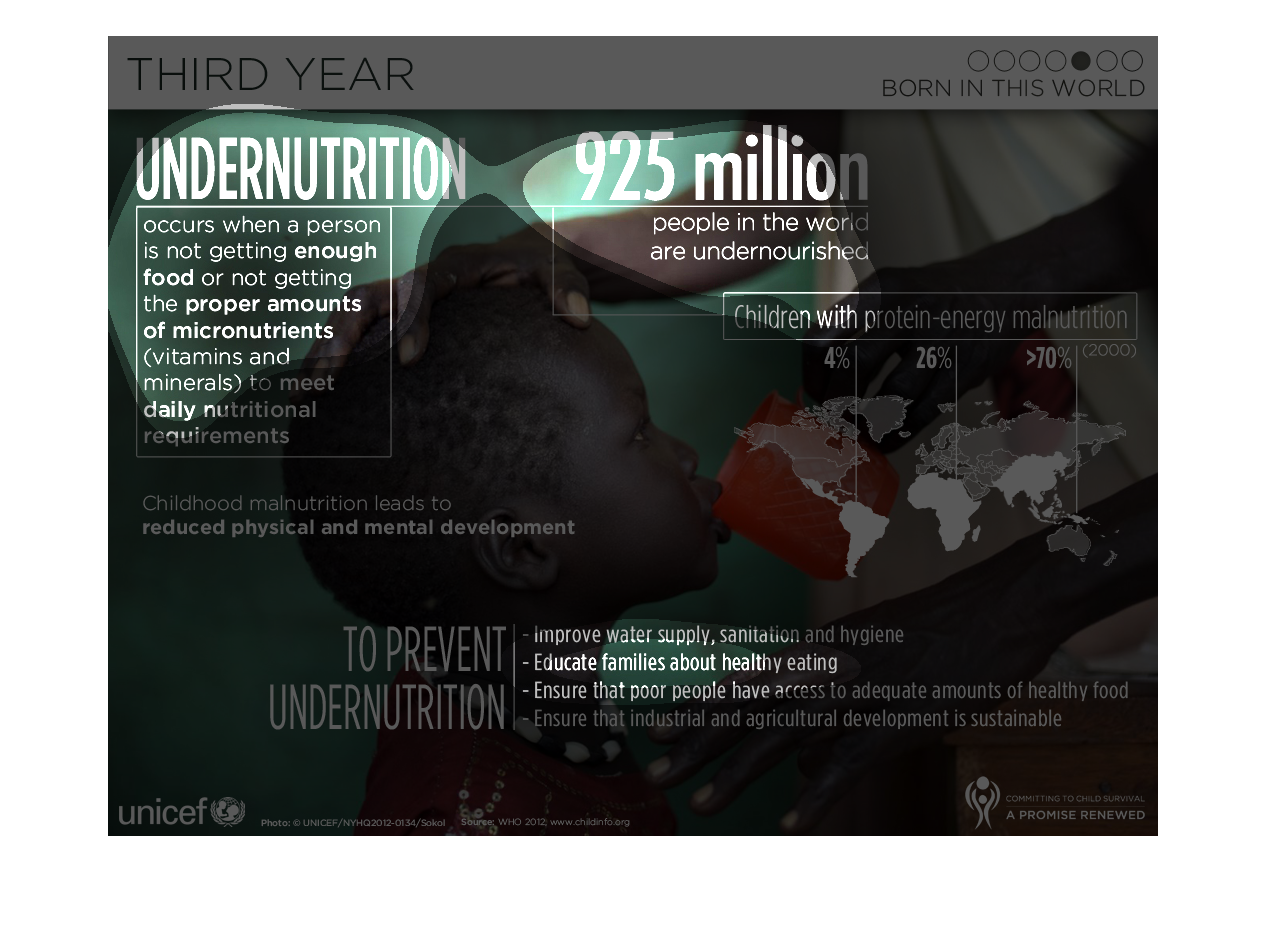
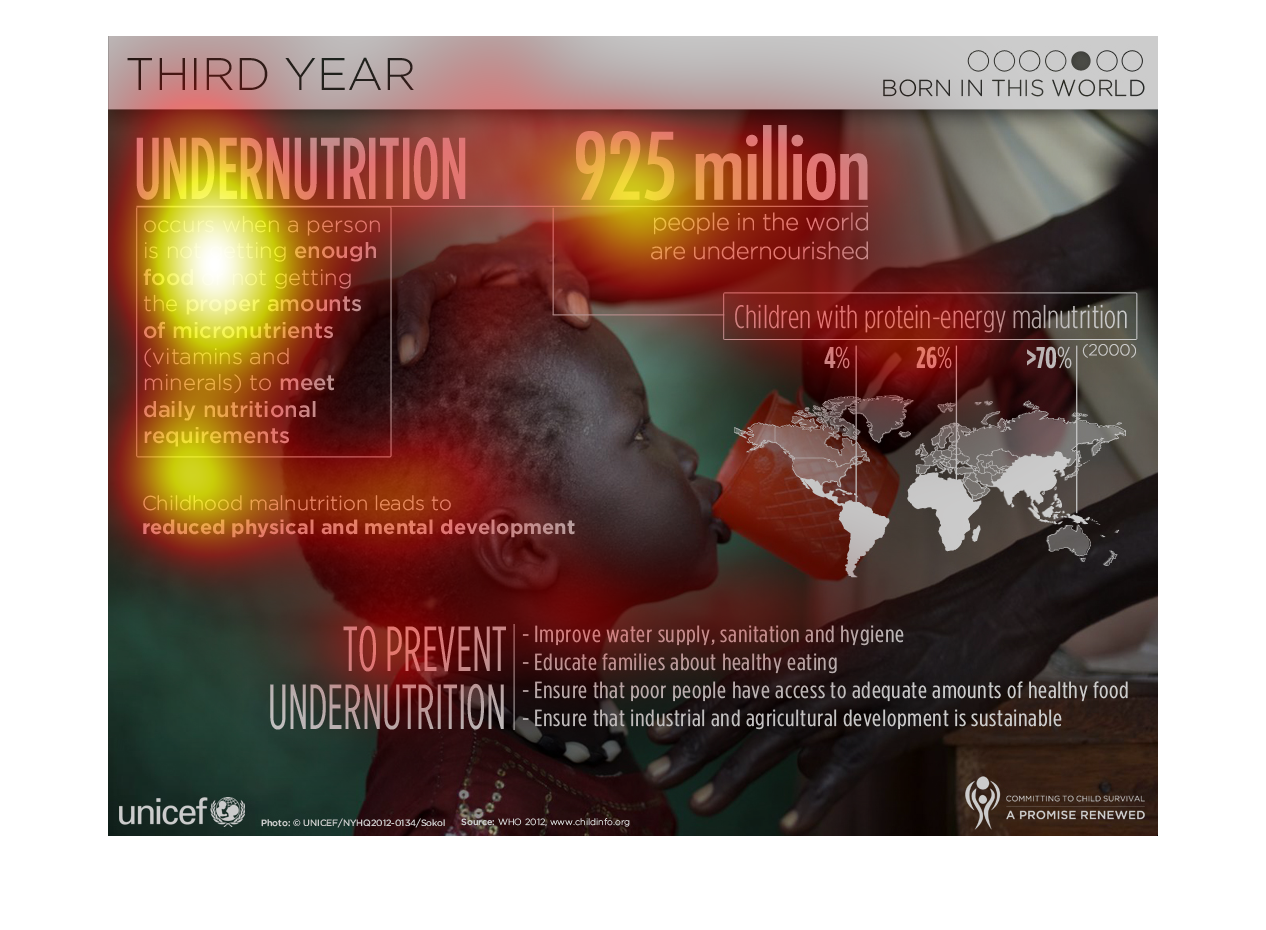
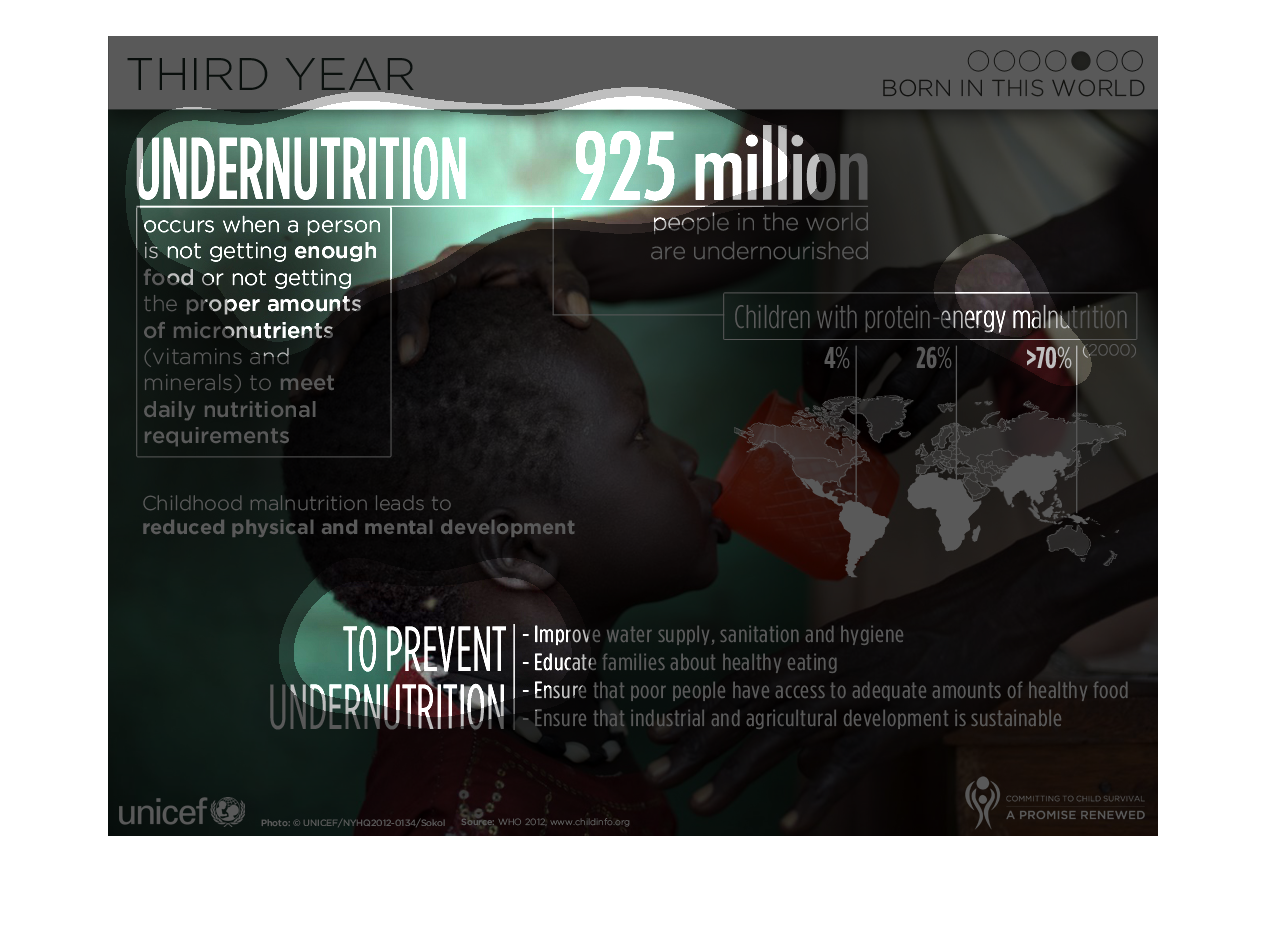
This infographic desribes the conditions and some of the adverse affect of malnutrition. The
infographic provides a world map that outlines the major areas that have widespread child
malnutrition. Child malnutrition is most common in Southeast Asia, Africa, and South America.
This was a little harder to depict the overall imagery but i gather that it is a description
in regards to malnutrition and possible diseases that could subsequently result in ailment
Mal nutrition due to a lack of resources is a big indicator of a nations developmental capabilities.
In this picture, we are shown the root causes of it and how to better treat it.
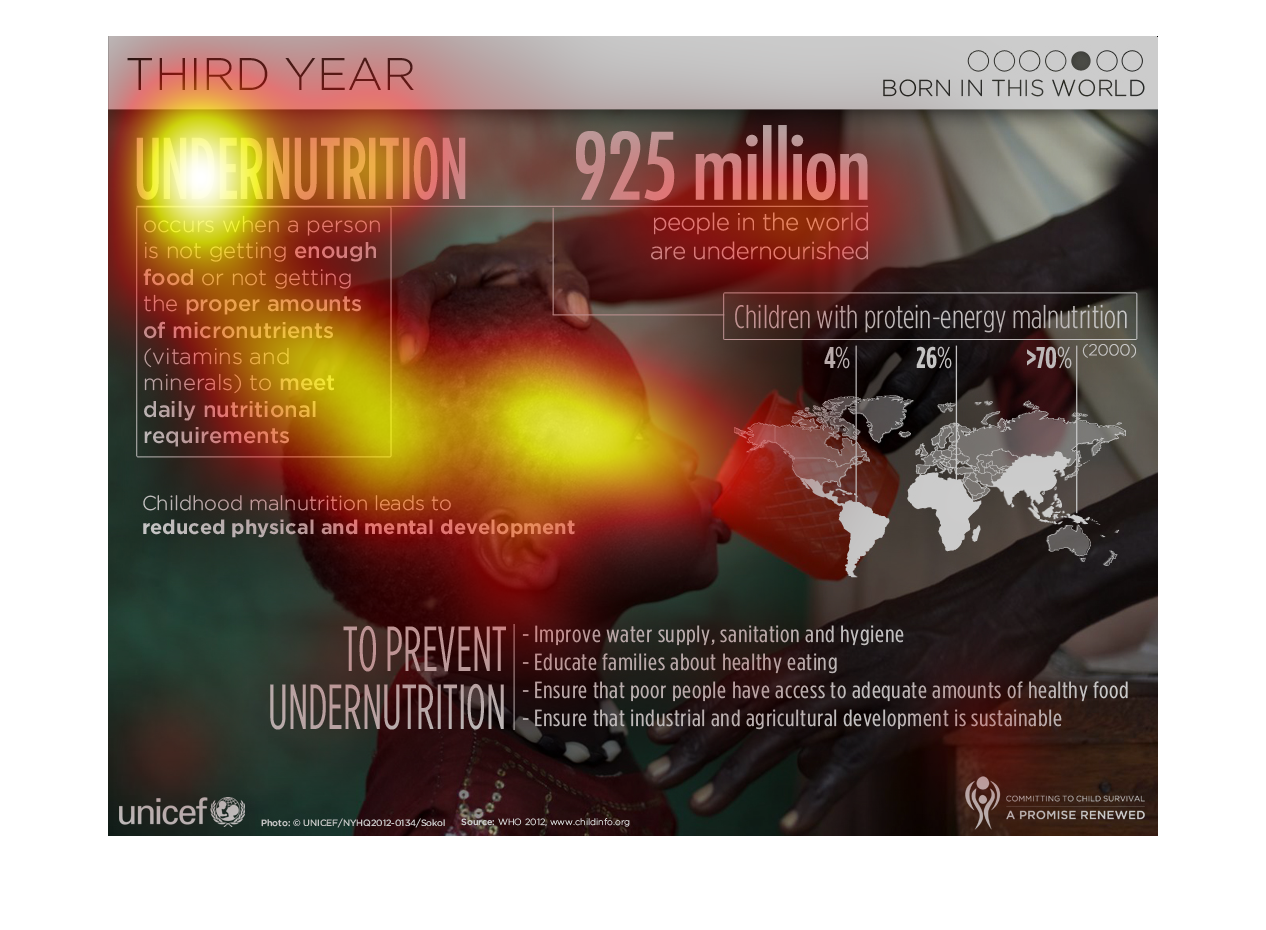
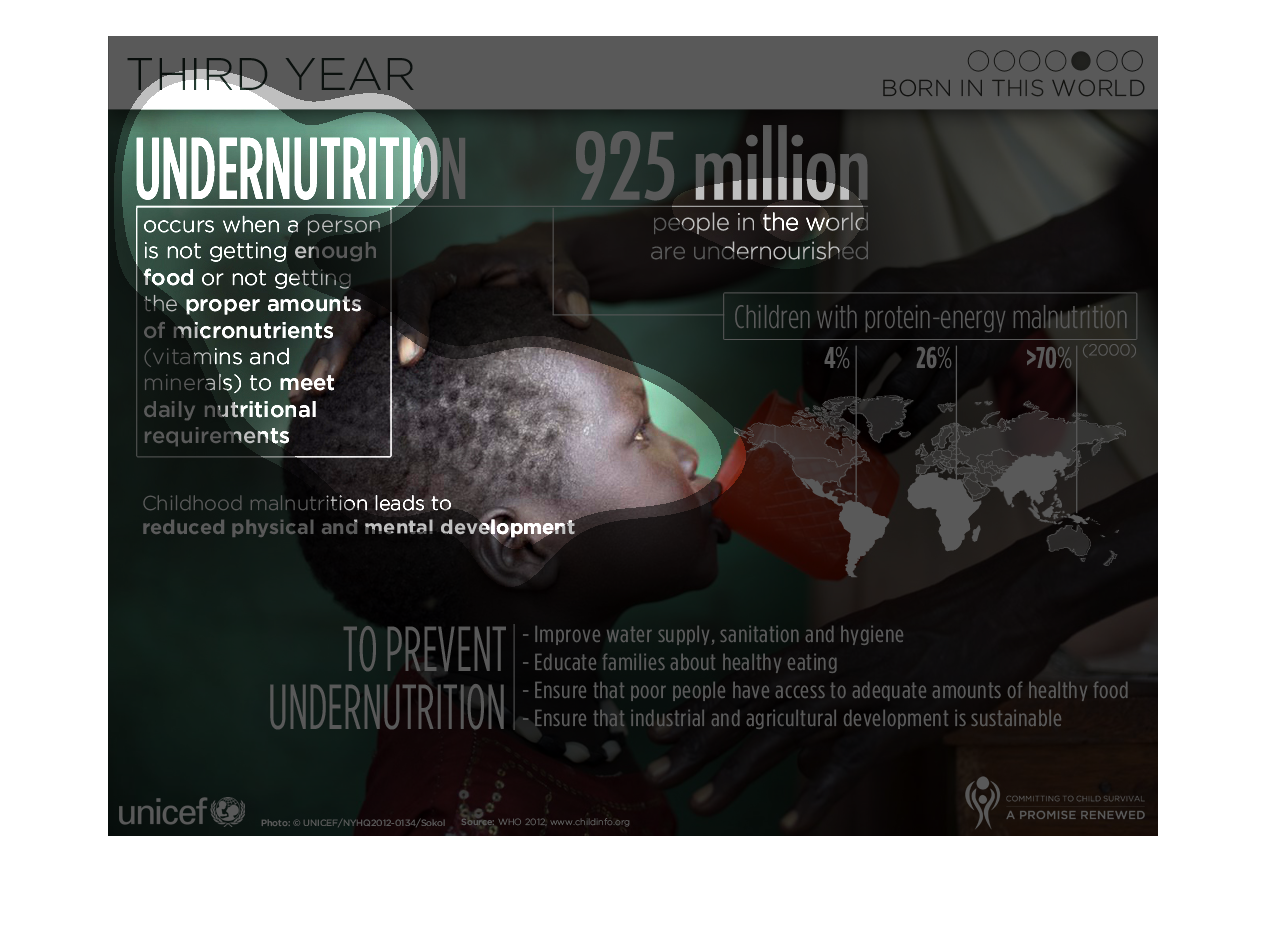
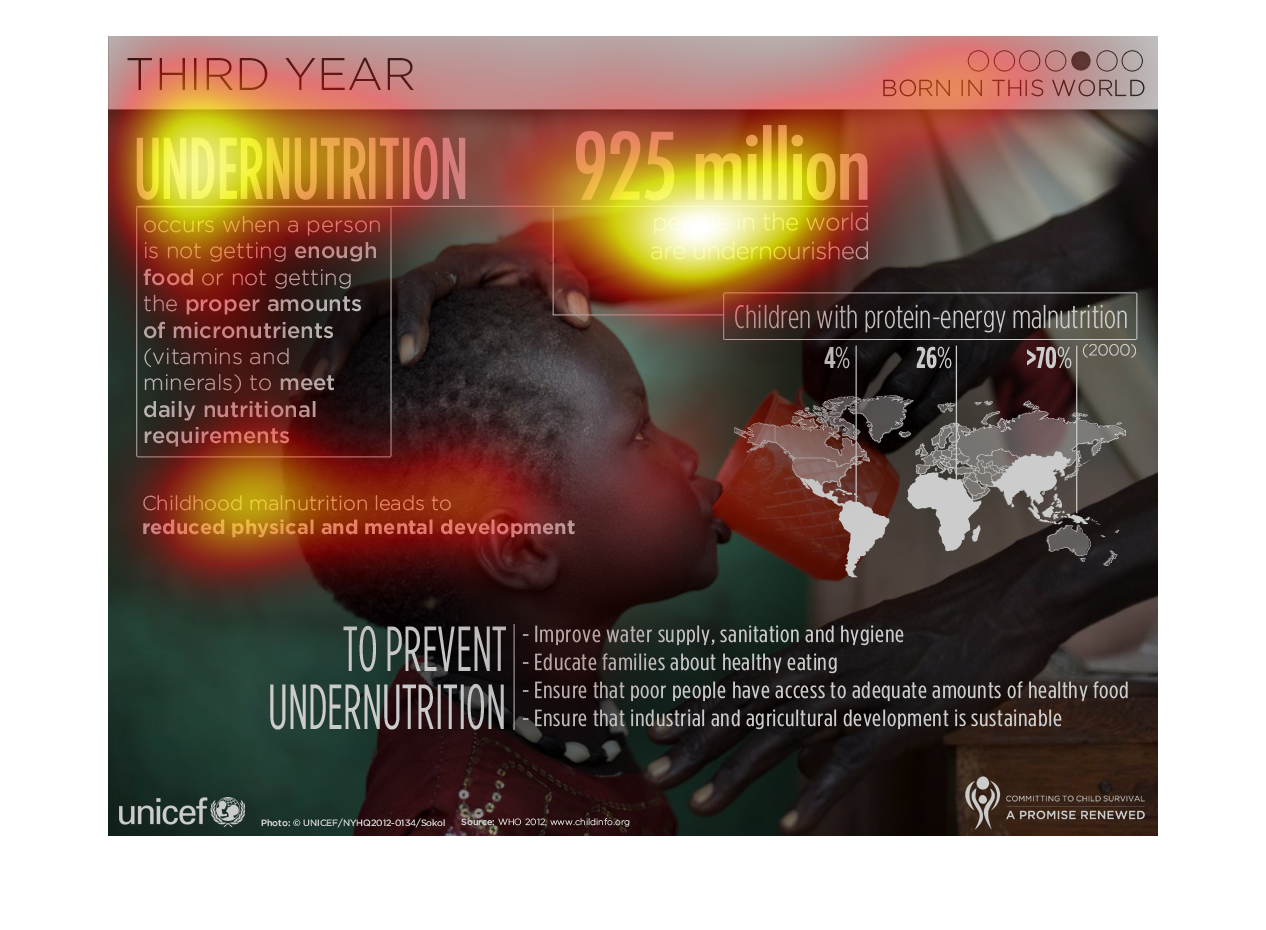
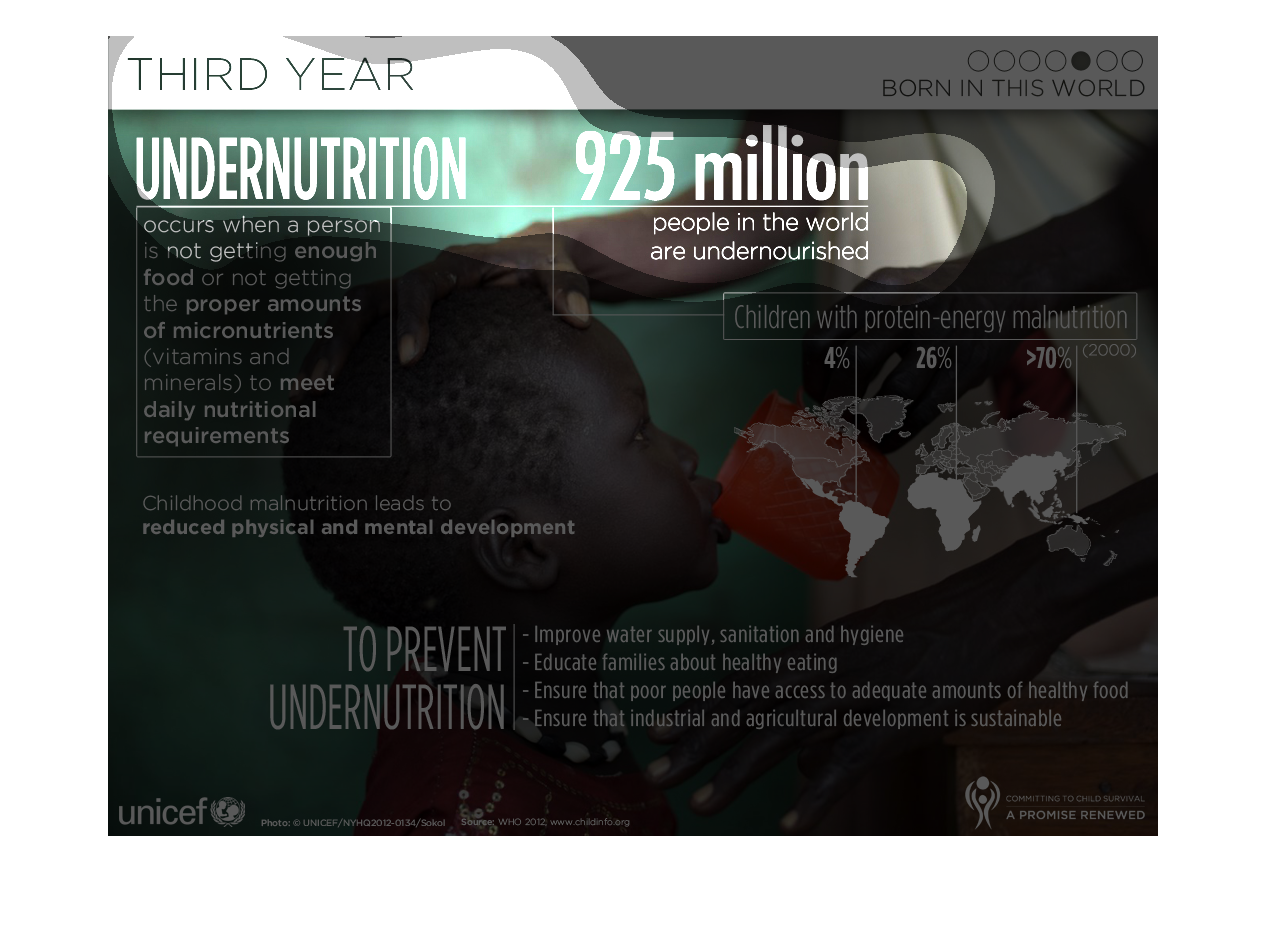
Poster on undernutrition featuring the image of an African child being feed something from
a red cup. It defines undernutrition as when a person is not getting enough food or not getting
the proper amounts of micronutrients (vitamins and minerals) to meet daily nutritional requirements.
It states that childhood malnutrition leads to reduced physical and mental development. It
gives a list of ways to prevent undernutrition including improving water supply, sanitation
and hygiene; educating families about healthy eating; insure that poor people have access
to adequate amounts of healthy food; and insure that agricultural and industrial development
is sustainable. The poster states that 925 million people in the world are undernourished.
The poster also provides a map which shows percentages of children with protein and energy
malnutrition in different parts of the globe using statistics from 2000: 4% South America,
26% Africa and greater than 70% in Asia.
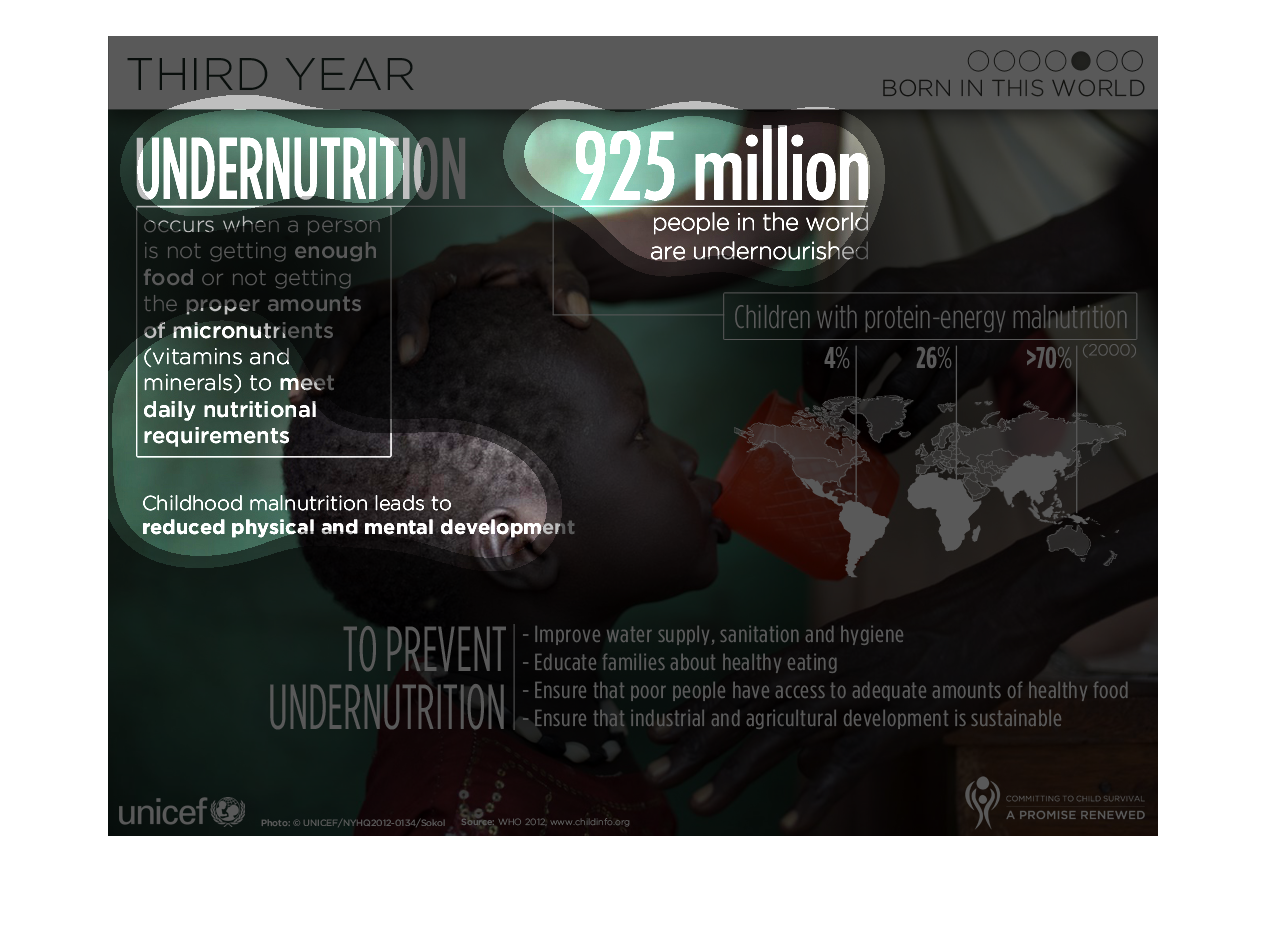
This chart describes facts about the 925 million people worldwide and the dangers it poses.
Under  nourished children risk reduced physical and mental development. It also lists things
that can improve these numbers.
This graph shows "Undernurition 925 Million.". This graph not only explains what undernurition
is, but also how to prevent it along with statistics from several countries.
This graphic provides basic information about under-nutrition. 925 million people in the world
are undernourished and can reduce physical and mental development in children.