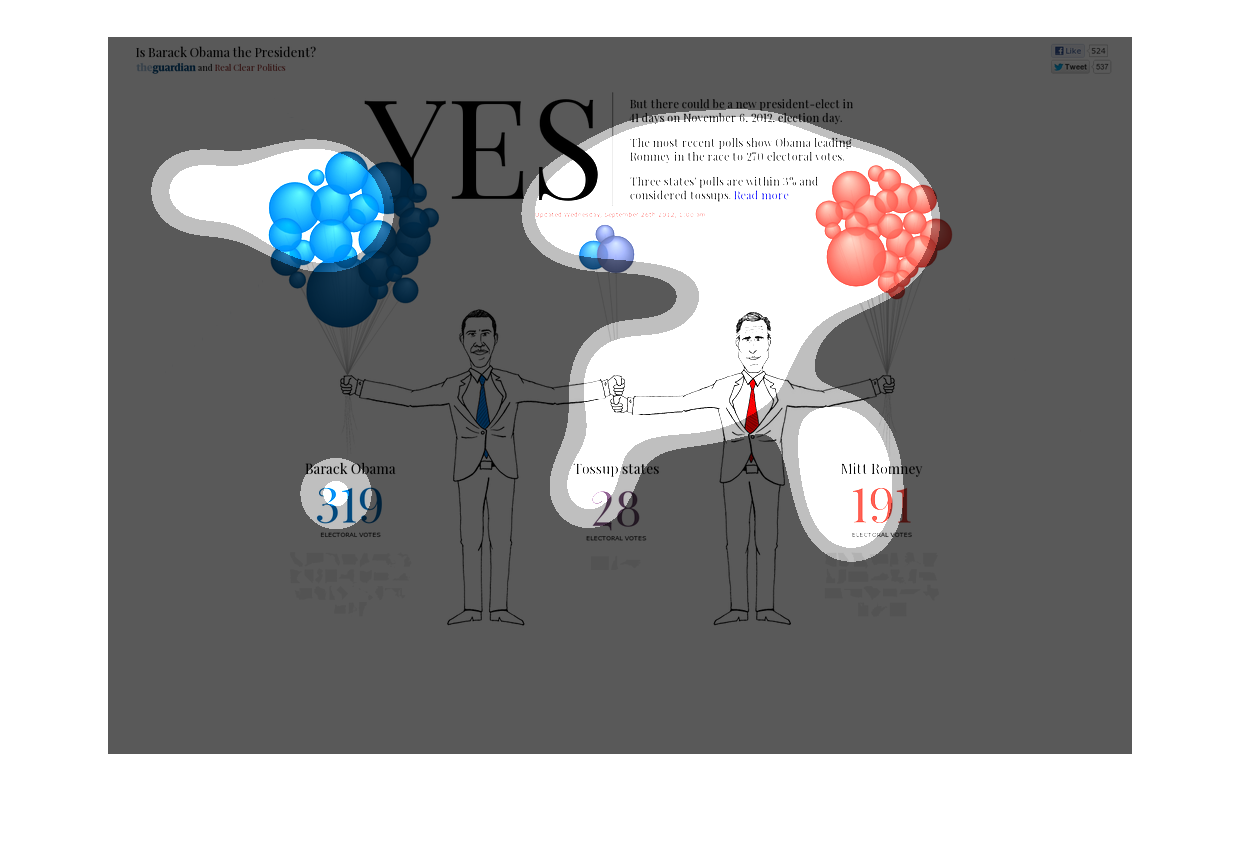
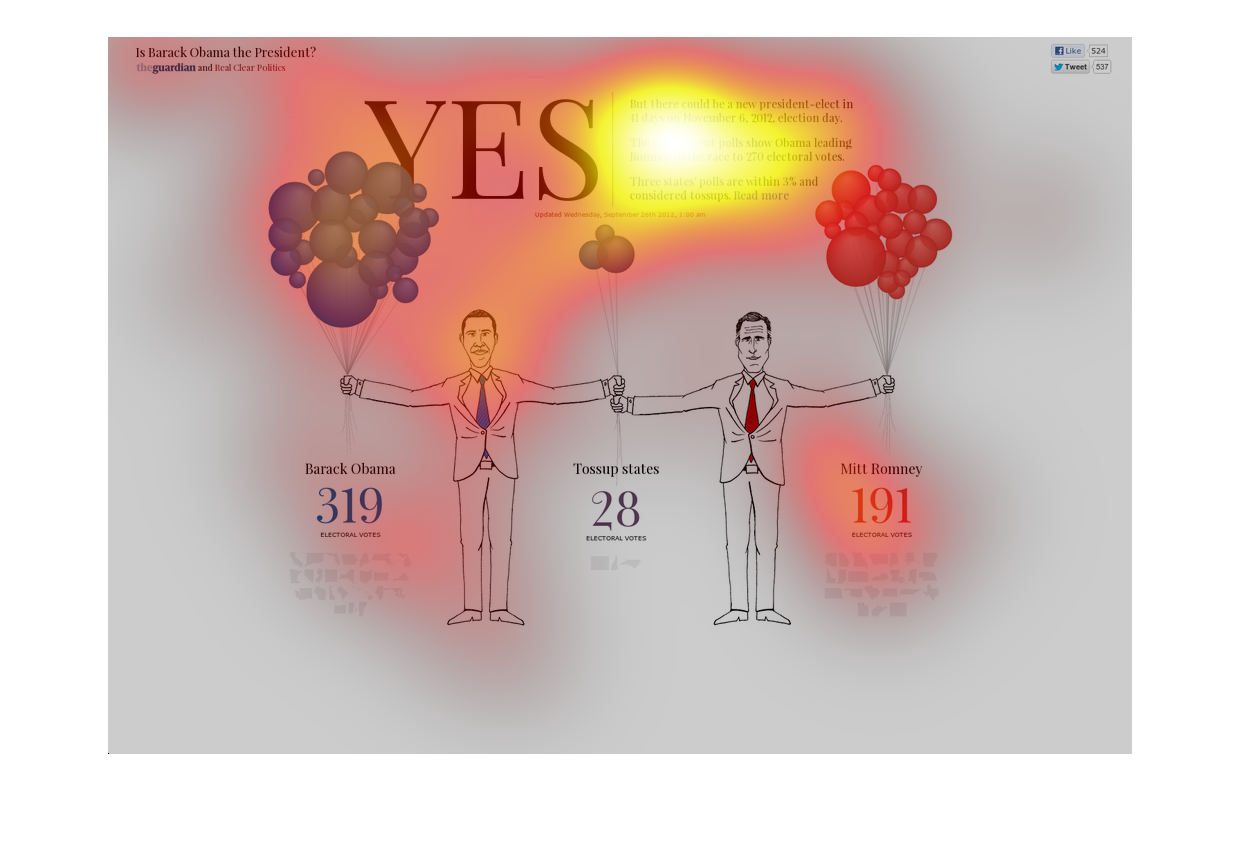
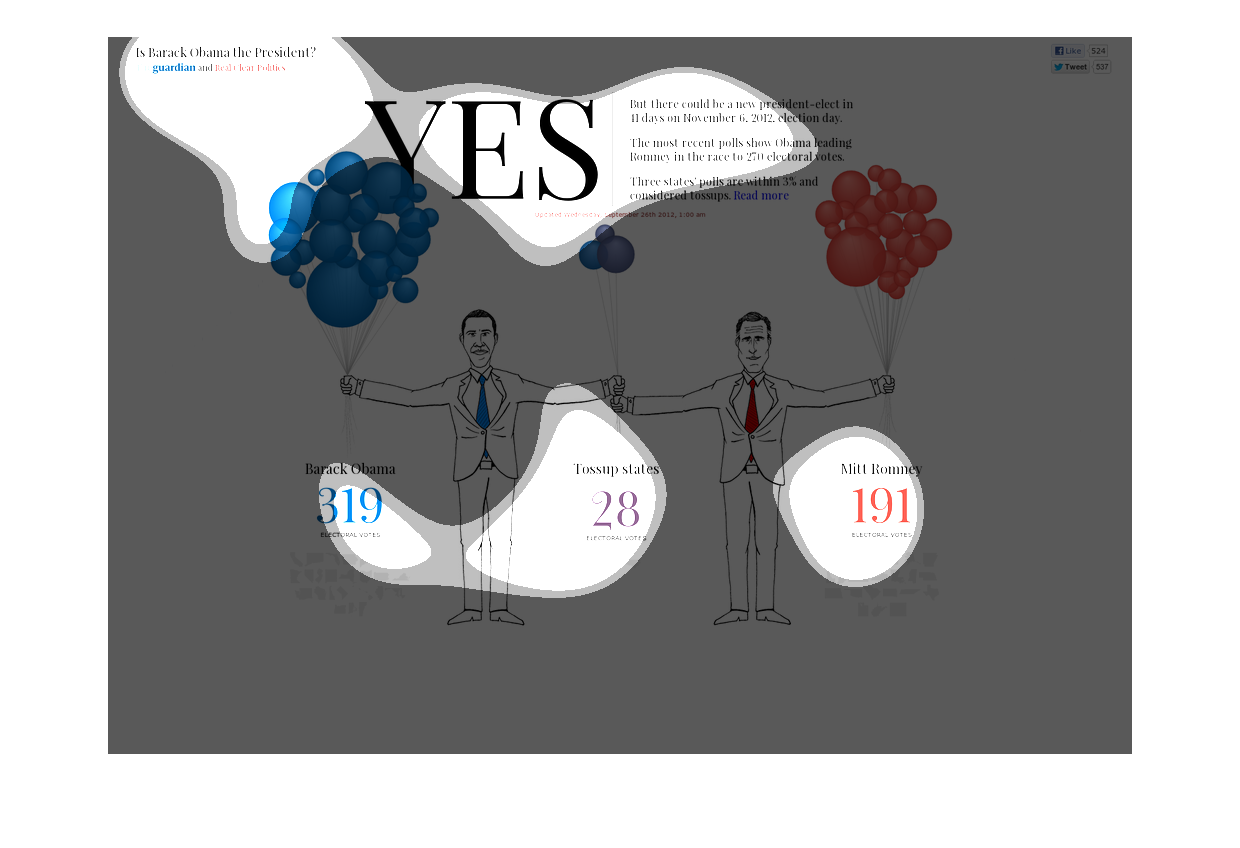
THIS PLOT IS DIFFICULT TO READ DUE TO SMALL TEXT, BUT I BELIEVE IT IS A PRE-2012 ELECTORAL
COLLEGE PREDICTION FOR HOW STATES WILL VOTE FOR PRESIDENT BETWEEN MITT ROMNEY AND BARACK OBAMA.
THE NUMBER OF ELECTORAL VOTES FOR EACH, AND TOSS UP, ARE SHOWN AS BUNDLES OF BALLOONS.

This chart breaks down the electoral votes during the 2008 presidential election. It shows
characters of Barak oboma and mitt Romney and how many votes each had

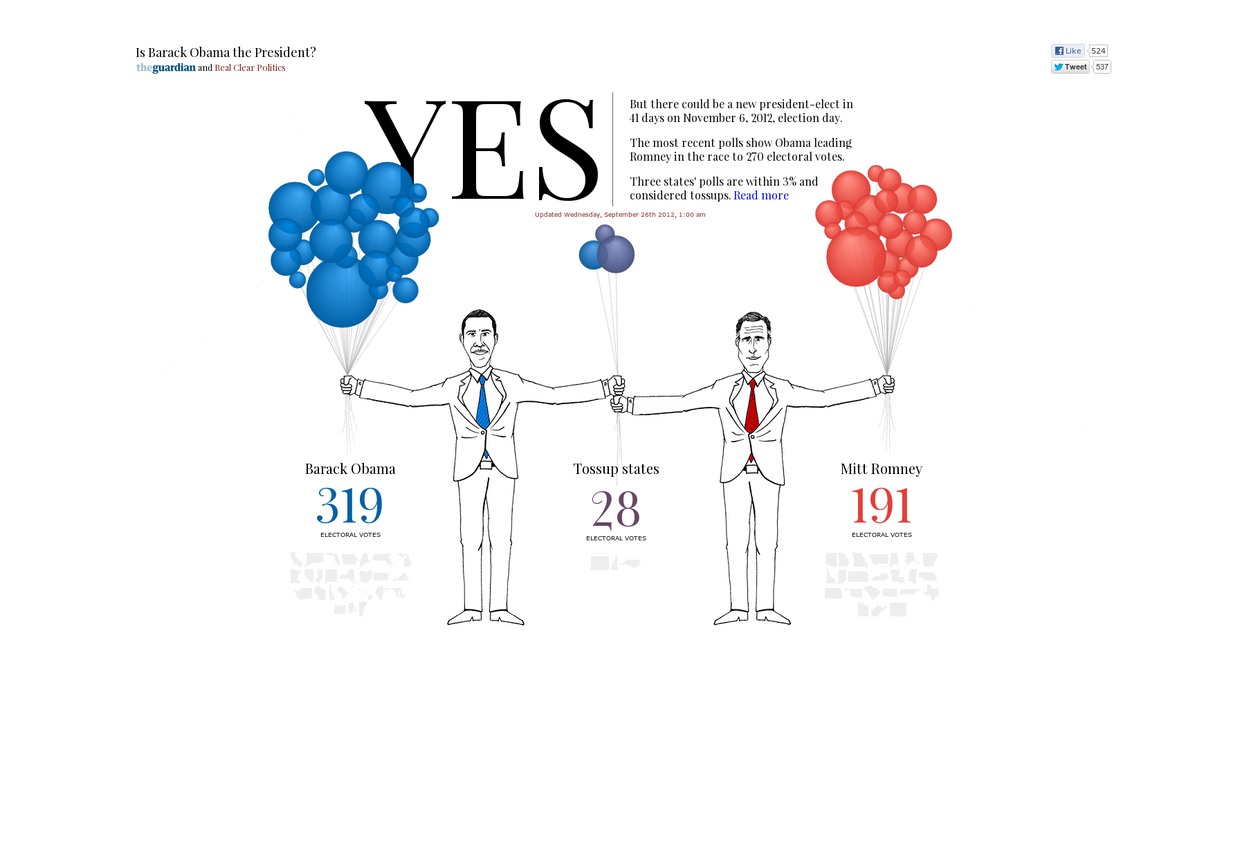
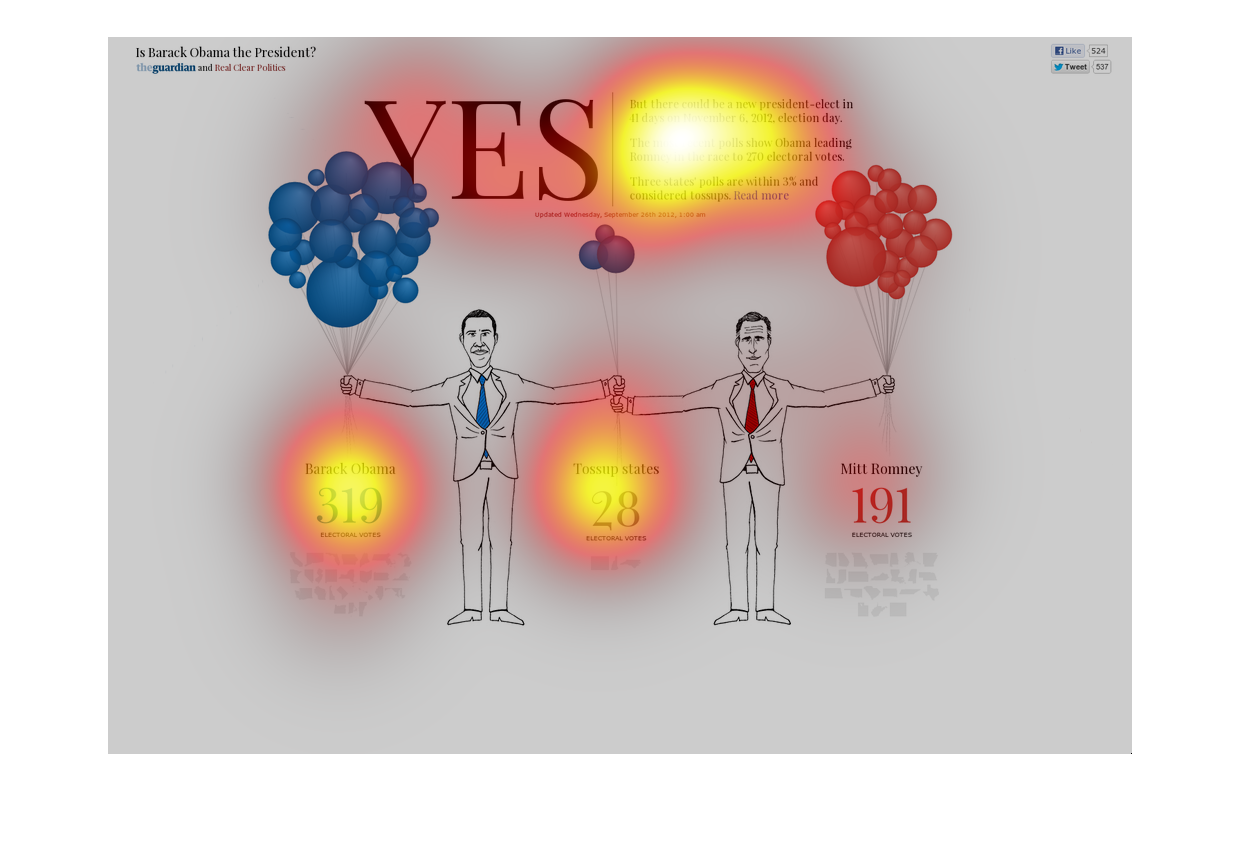
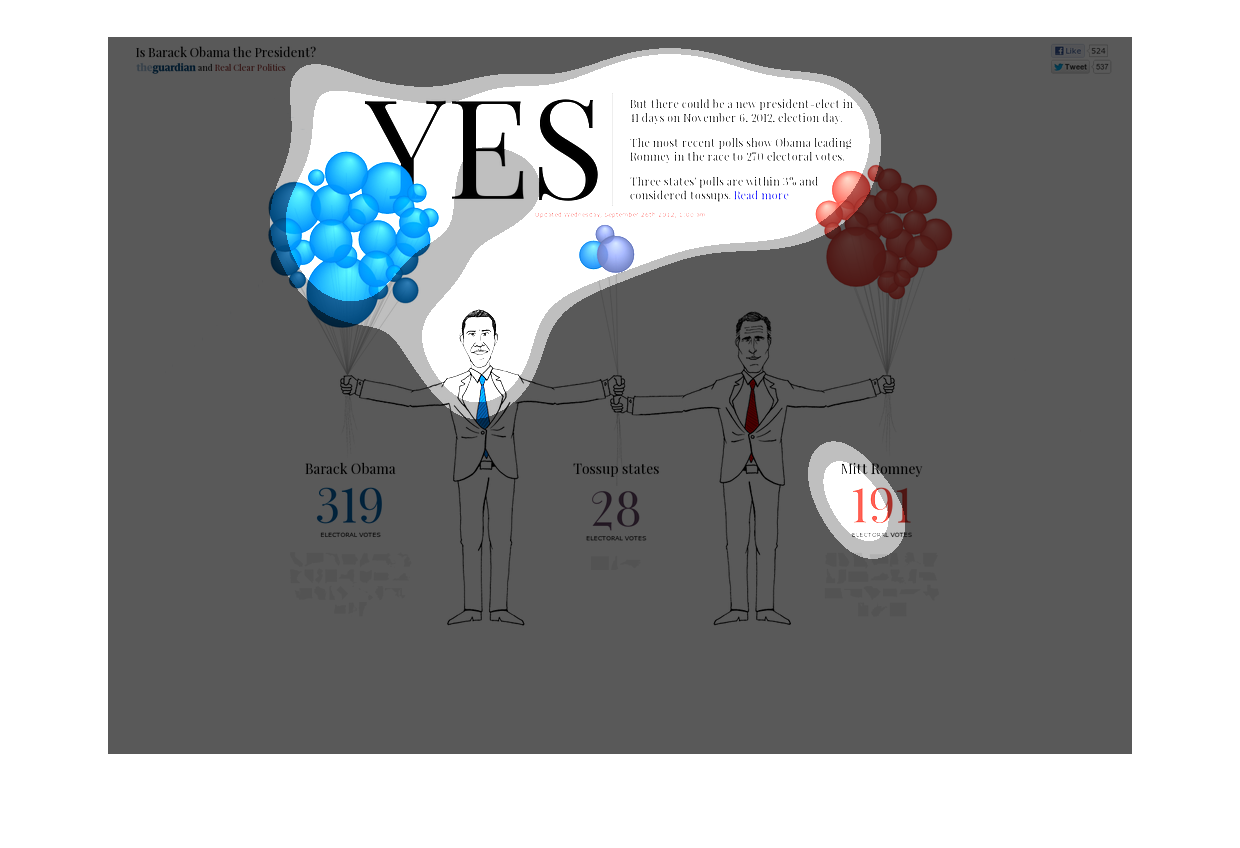
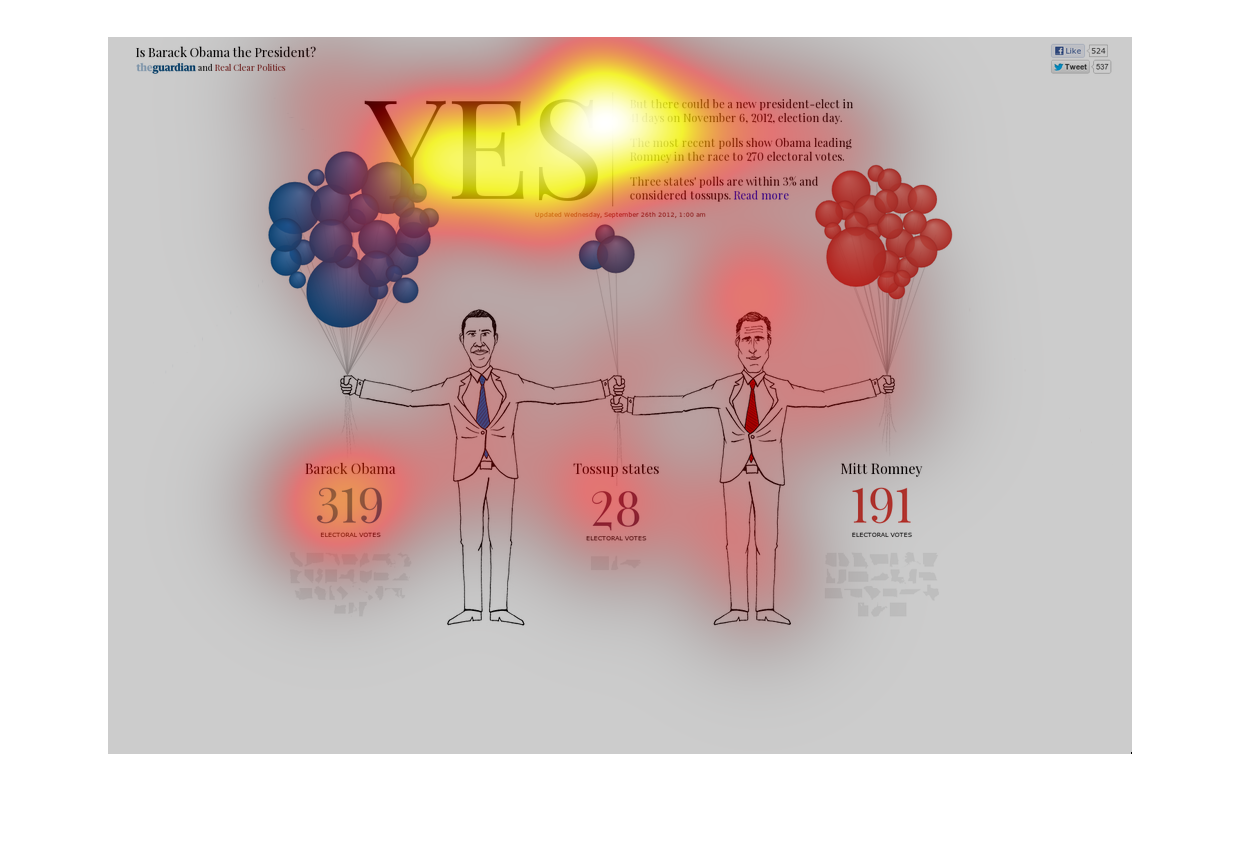
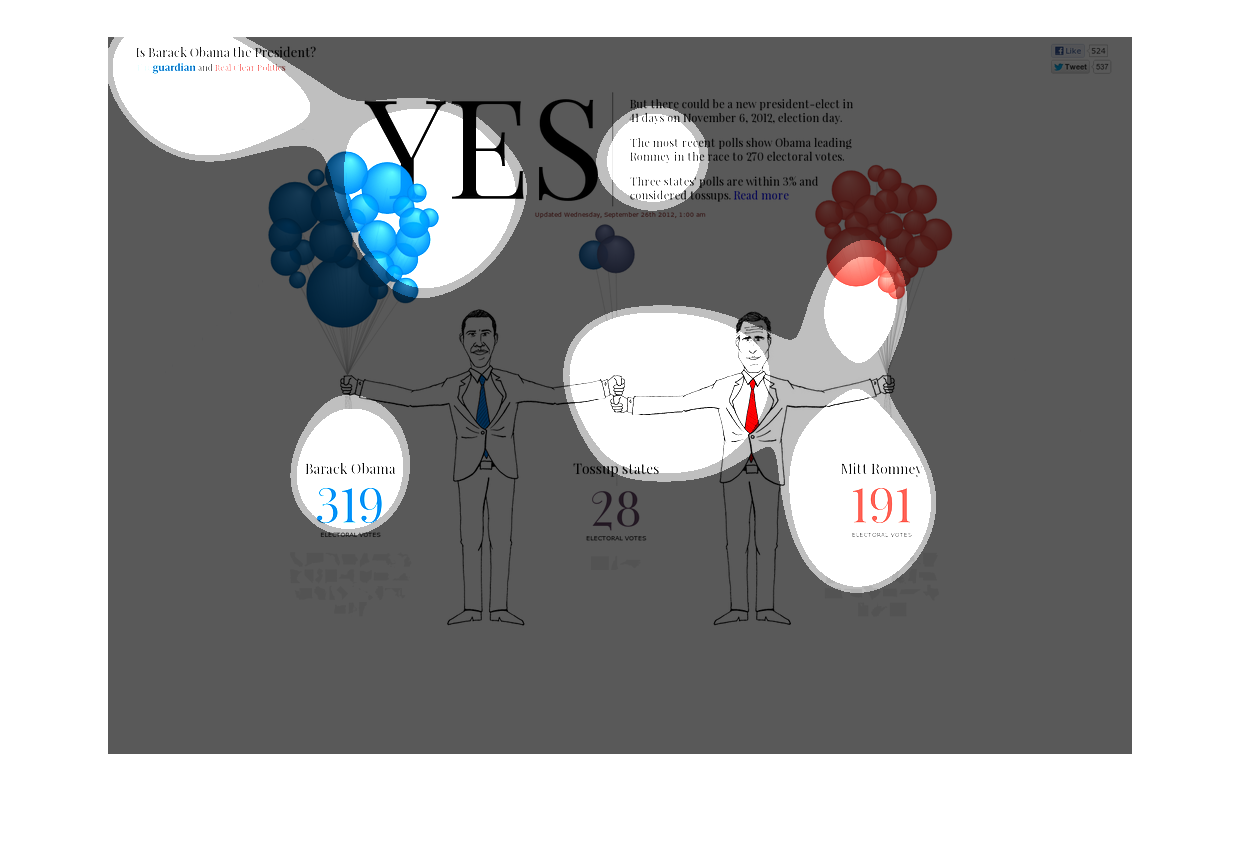
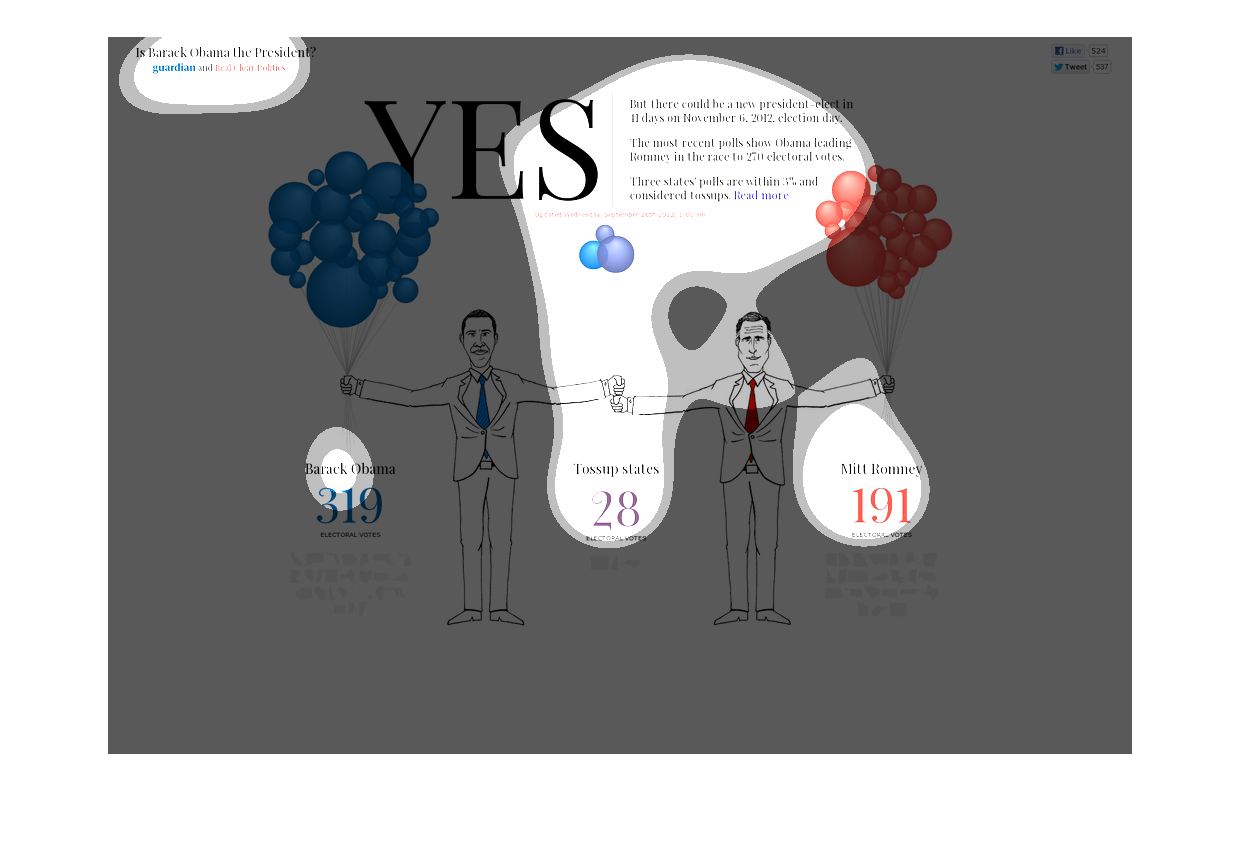
This info graphic tells about the electoral college results of the 2014 election between Democratic
candidate Barack Obama and Republican candidate Mitt Romney. With 319 electoral collage votes
going to Obama, 191 votes to Romney, Obama won the election. It was a close run with 28 of
the 50 states being tossup states.
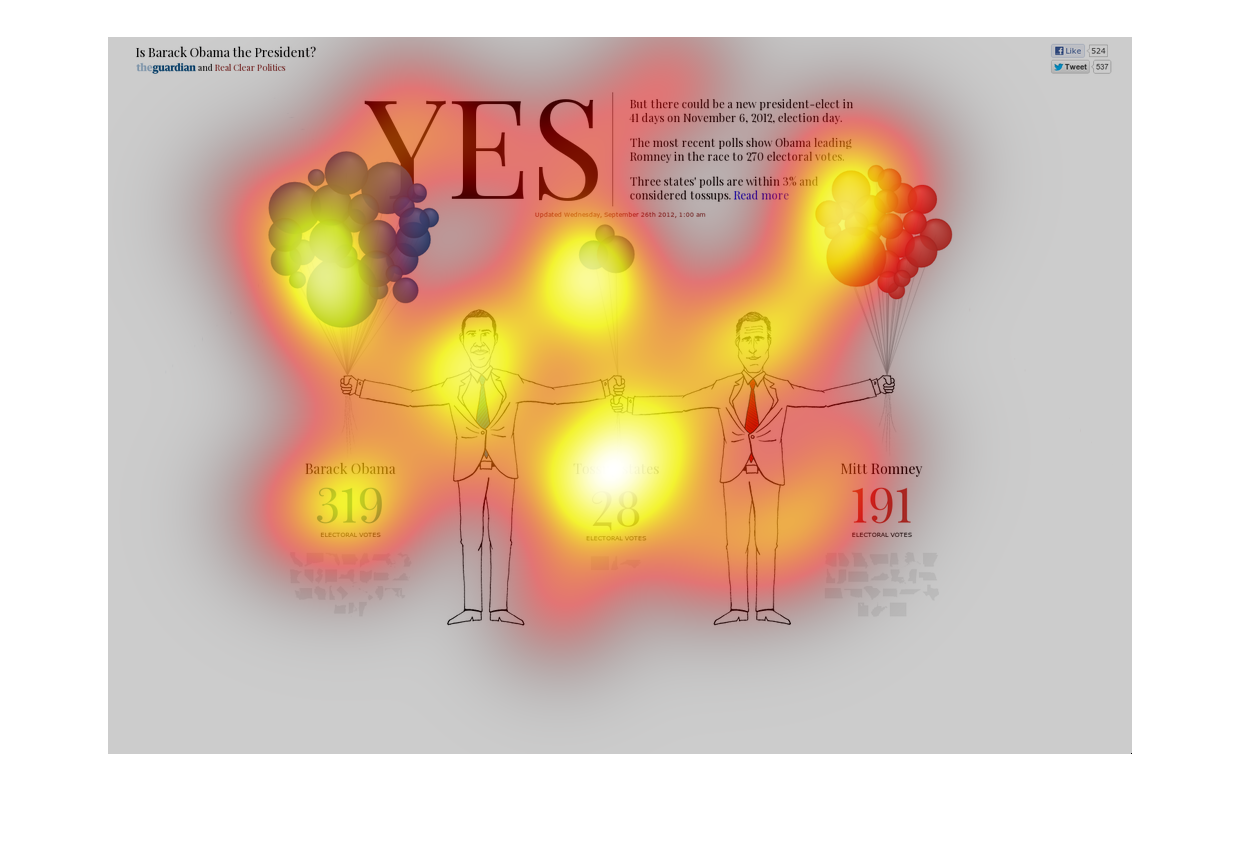
The Image describes about YES and its points. On the left, Barack Obama has 319 where as on
right,Mitt Ronney with 191. And tossup states is 28 together.
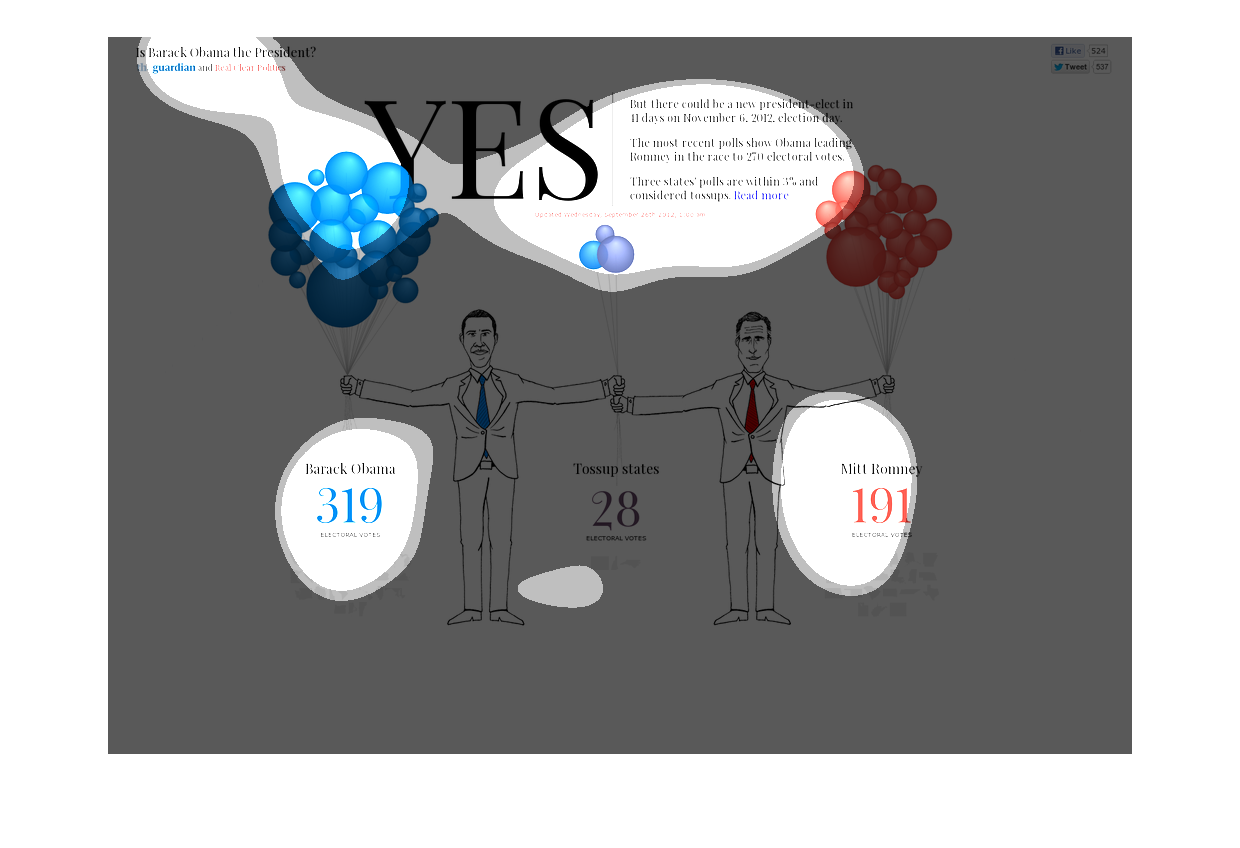
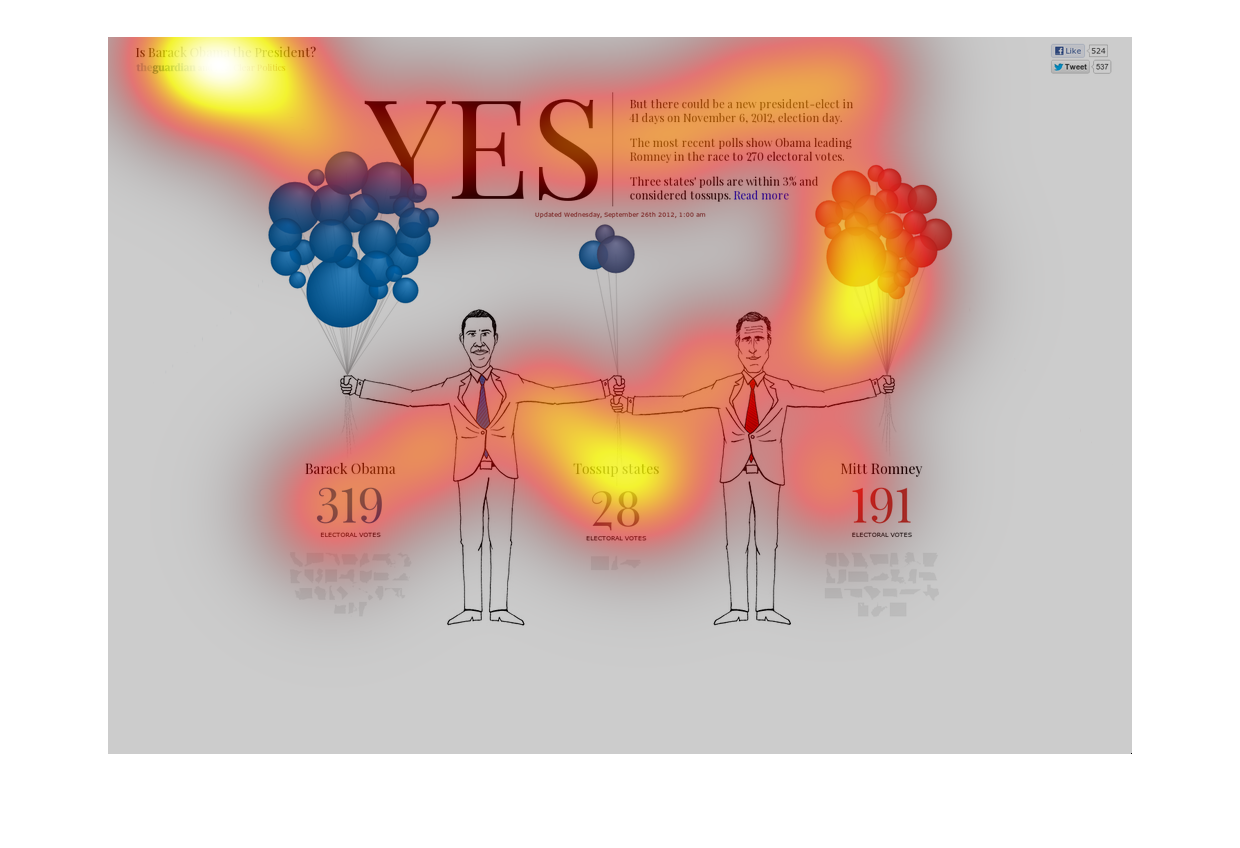
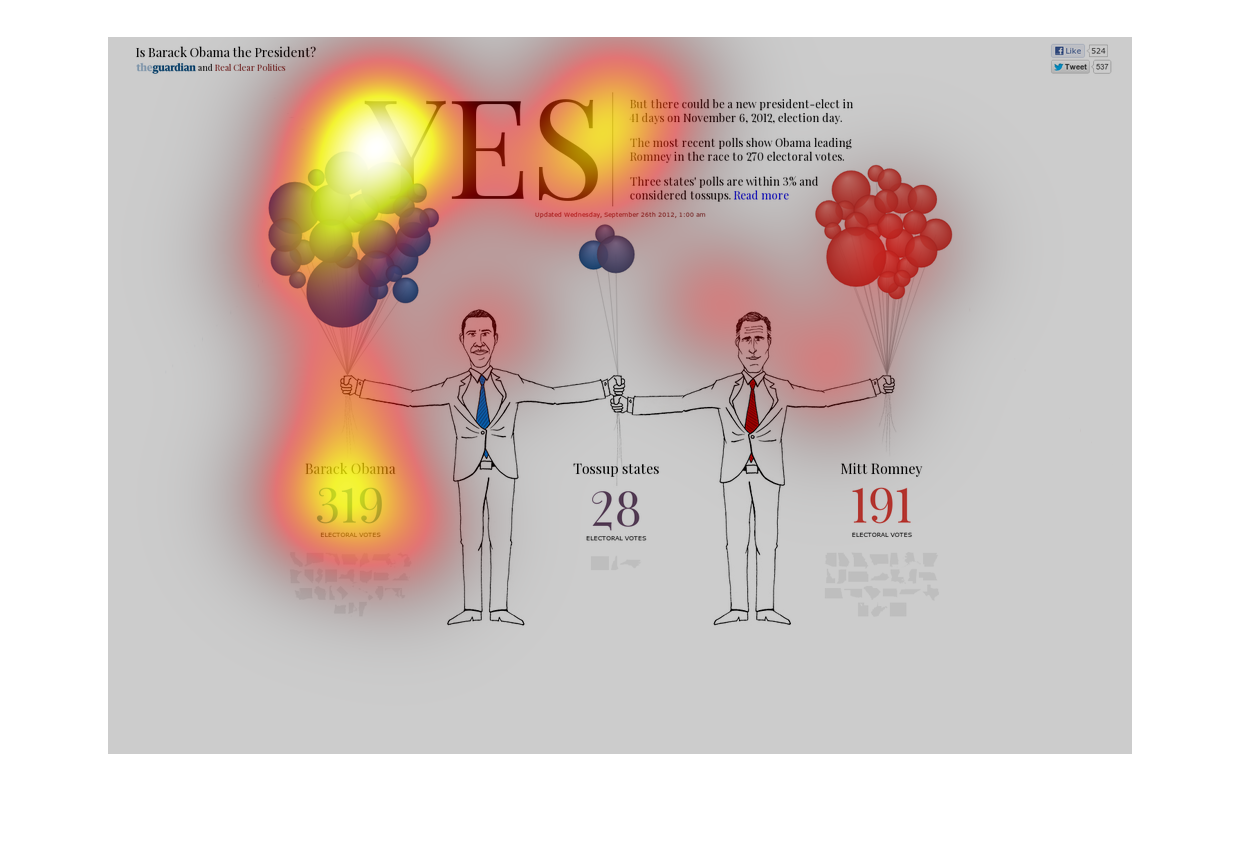
The image on the left hand side depicts the 2012 Presidential race between Barack Obama and
Mitt Romney.  With the balloons each contestant is holding it is a metaphor for how many electoral
votes they each got.  Since Obama has a bigger set of balloons (319 to be exact) one can infer
and eventually find out that he would be our next President.
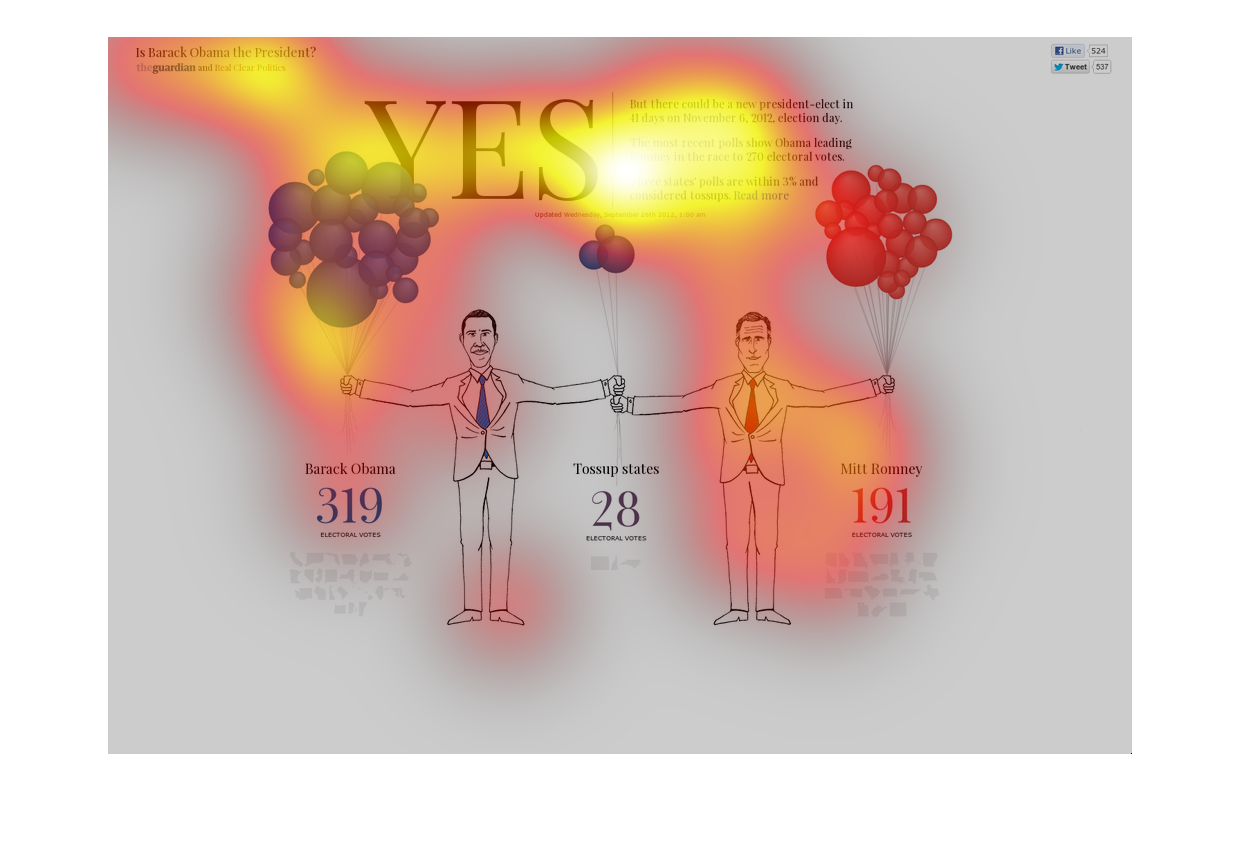
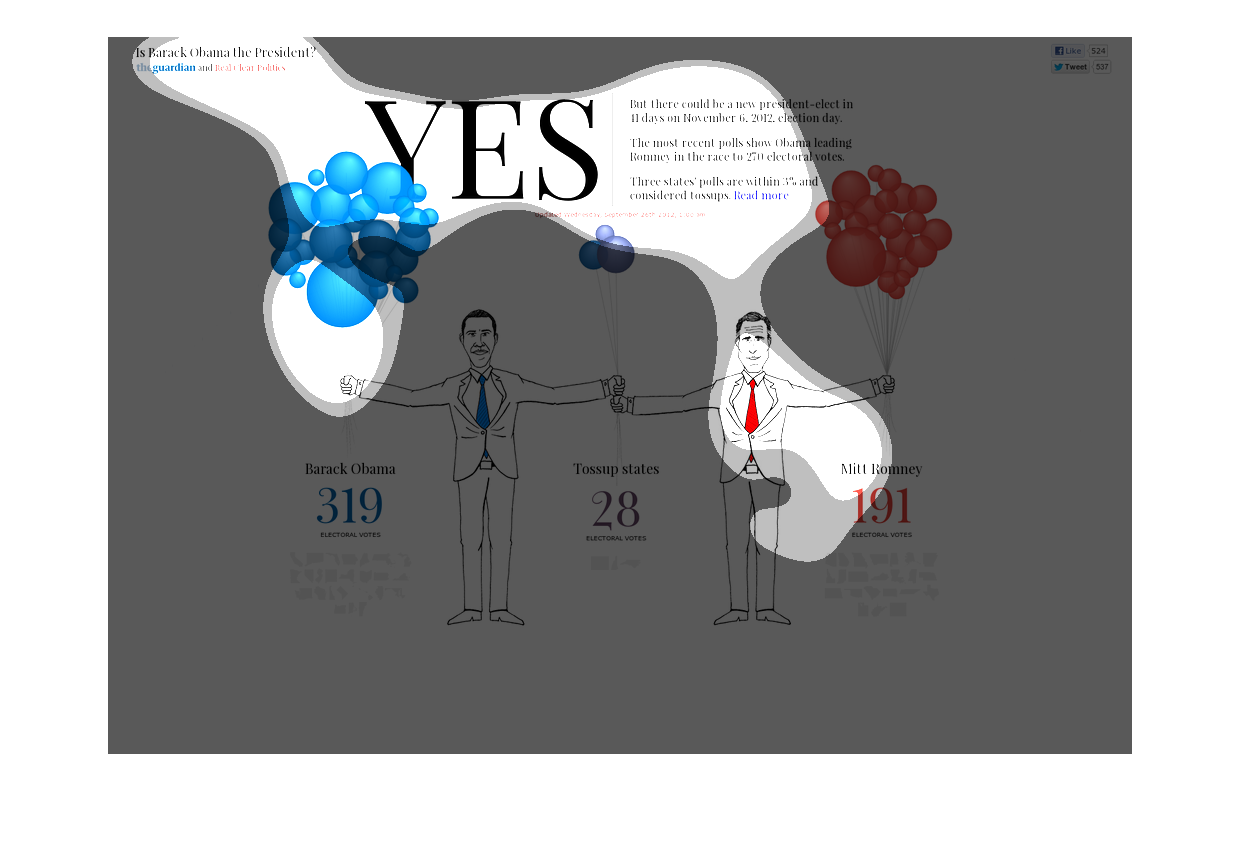
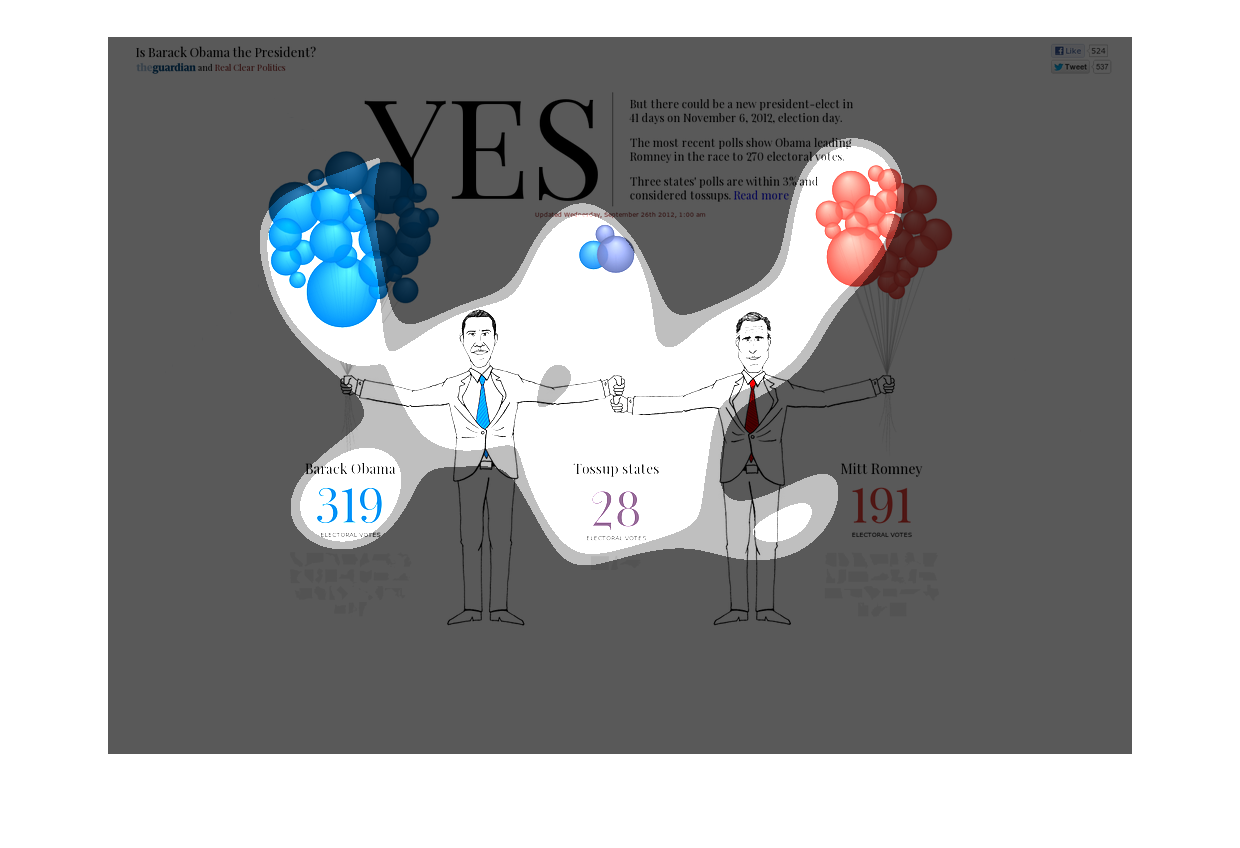
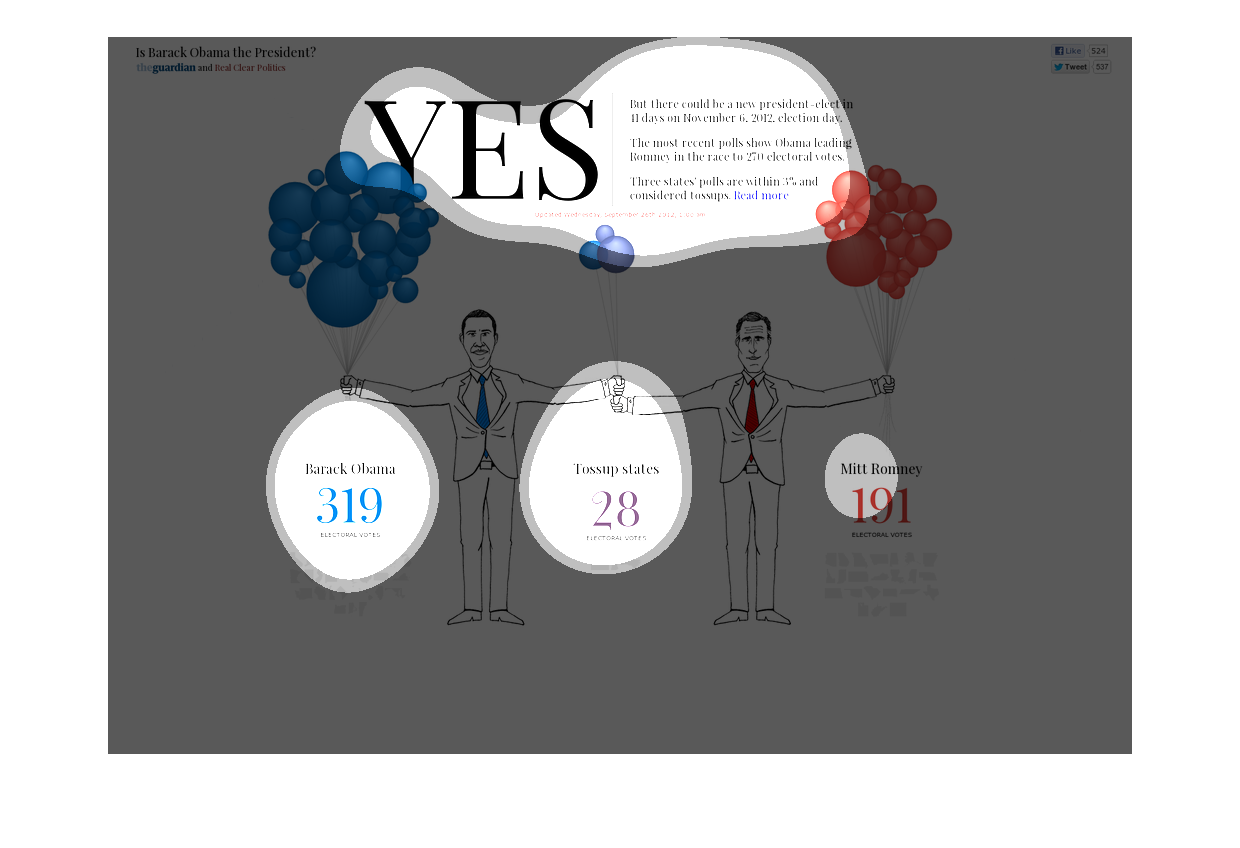
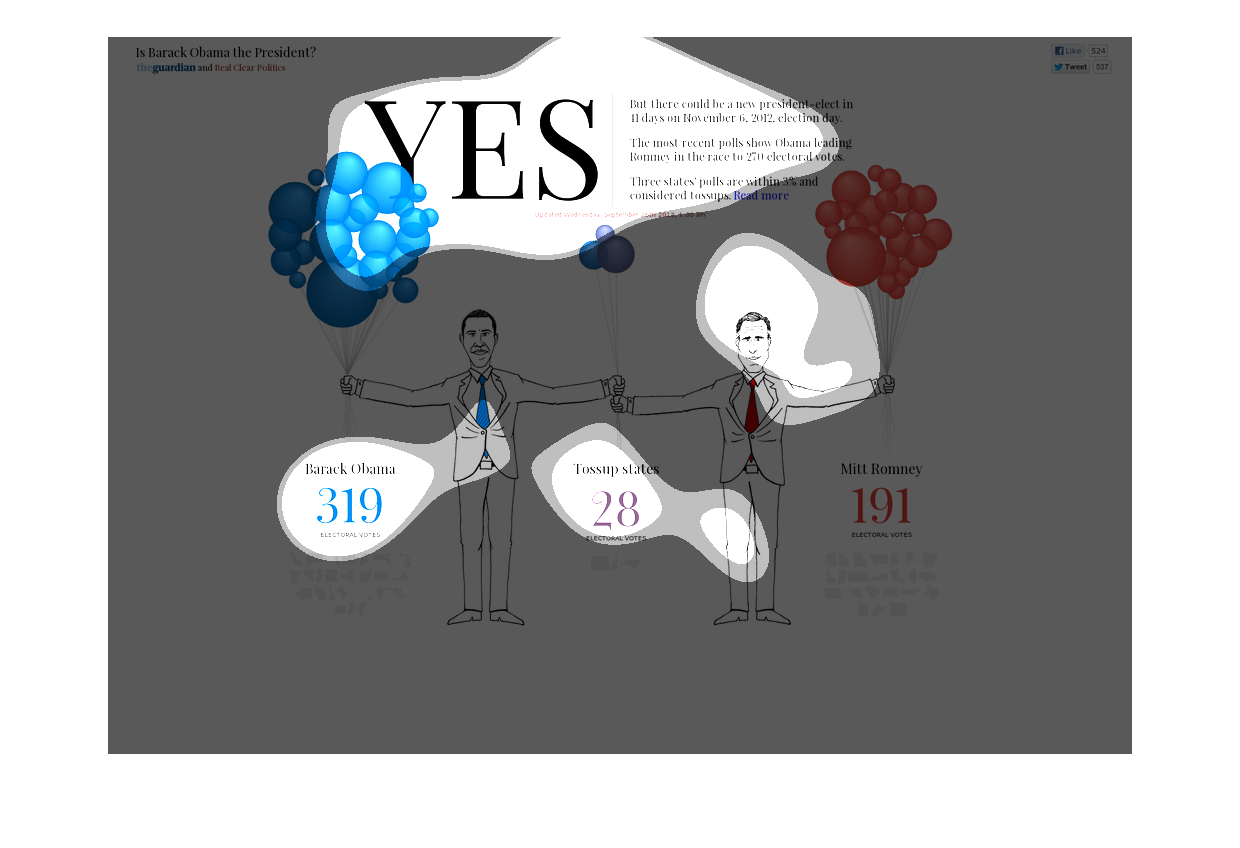
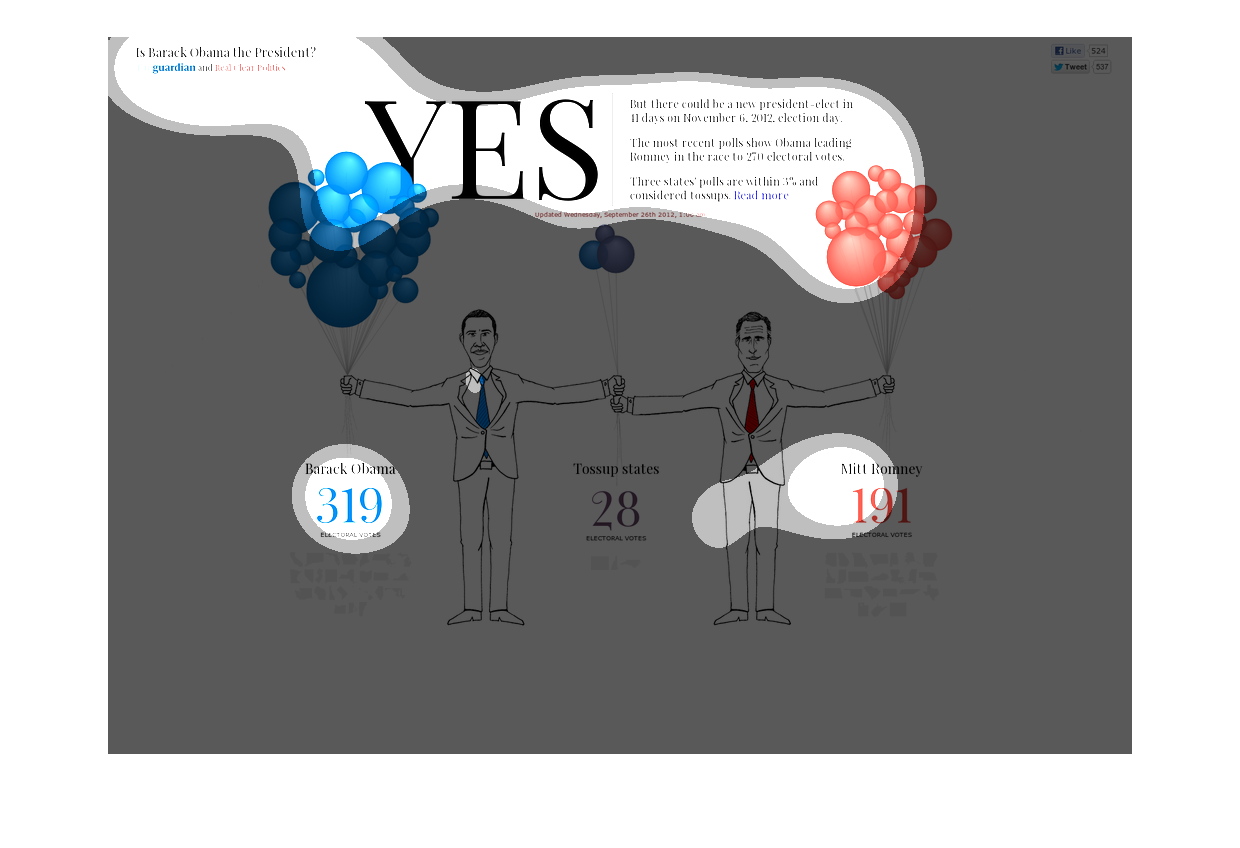
This image is a political image.  It says YES at the top.  It has blue balloons on one side
(to represent the democratic party) with an image of Barack Obama holding them , and red balloons
on the other (to represent the republican party) with Mitt Romney holding them..  It talks
about how Obama is likely to be the next president of the US and that he is currently leading
in the polls.  It shows that Obama is leading Romney by a score of 319 to 191.
This chart is titled: Yes. It shows Barack Obama, and Mitt romney not holding balloons. It
is demonstrating the amount of votes from the 2012 presidential race.
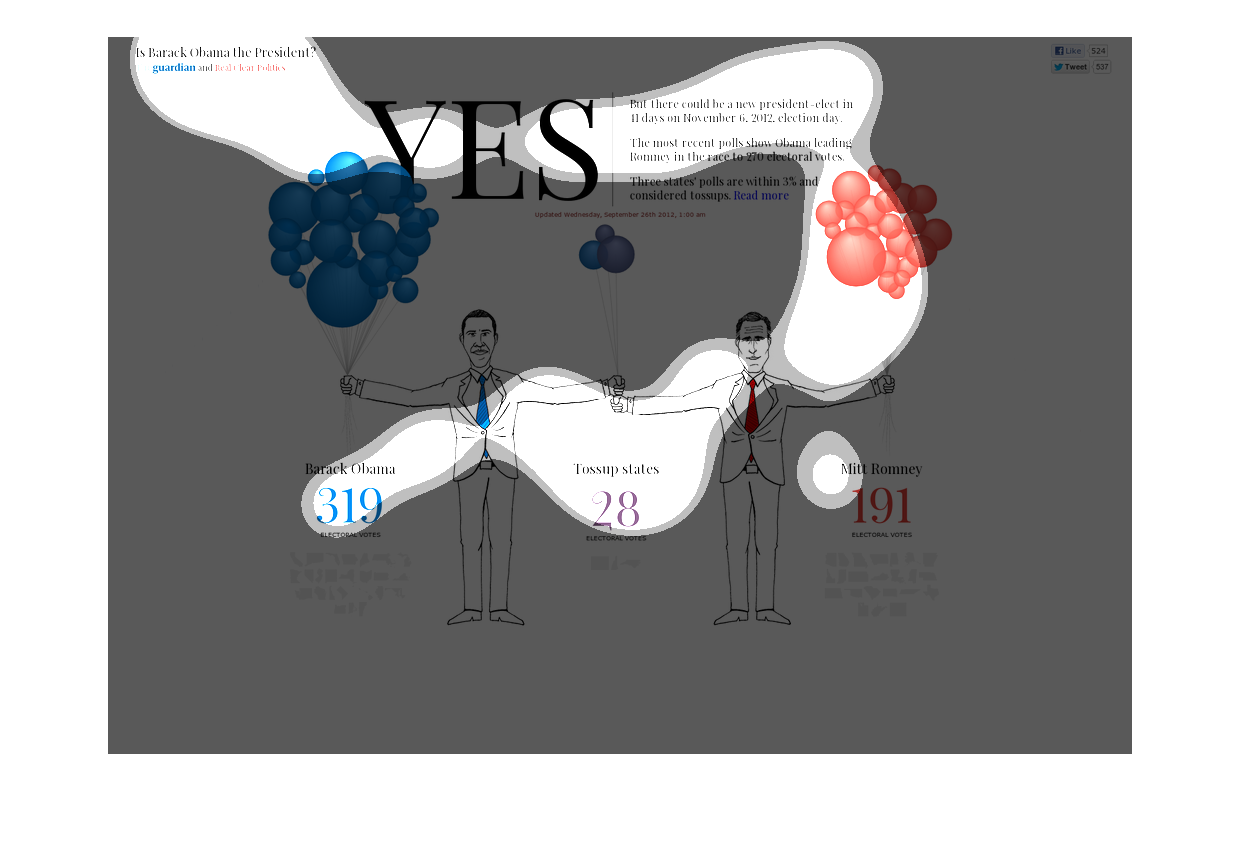
The following chart explains to viewers using balloons which represent the number of states
won in the presidential election between President elect Obama and candidate Mitt Romney.
This blurred image is a table that asks the question, "Is Barack Obama the President?" 319
said yes and 191 said no. The image is colorful and uses the colors of red and blue for distinction
of the polls. This image signifies that not all people know who the President is?
Who holds the most balloons? Is the question this picture poses, between Barack Obama and
Mick Romney. Barack Obama takes the lead with over four times as much as Presidential hopeful
Romney.
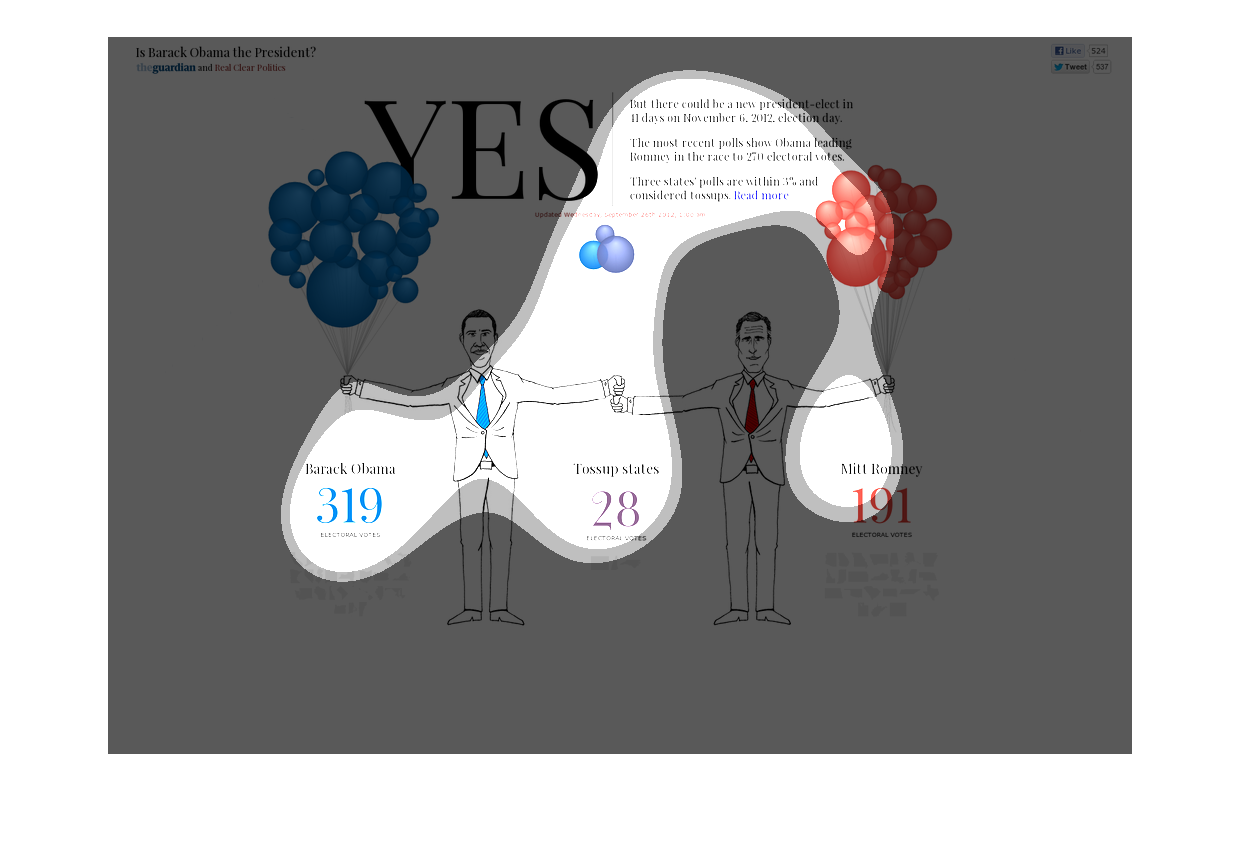
This is an illustration about the United States presidential election between Barack Obama
nad Mitt Romey with number of states and electoral votes that are split between them.
This appears to be the results of a public poll or survey regarding popularity or electability
of presidential candidates, depicting Democrat Barack Obama with 319 "balloons" and Republican
Mitt Romney with 191 "balloons", and 28 "balloons" shared between them; I assume the balloons
represent votes, but it is not totally clear.
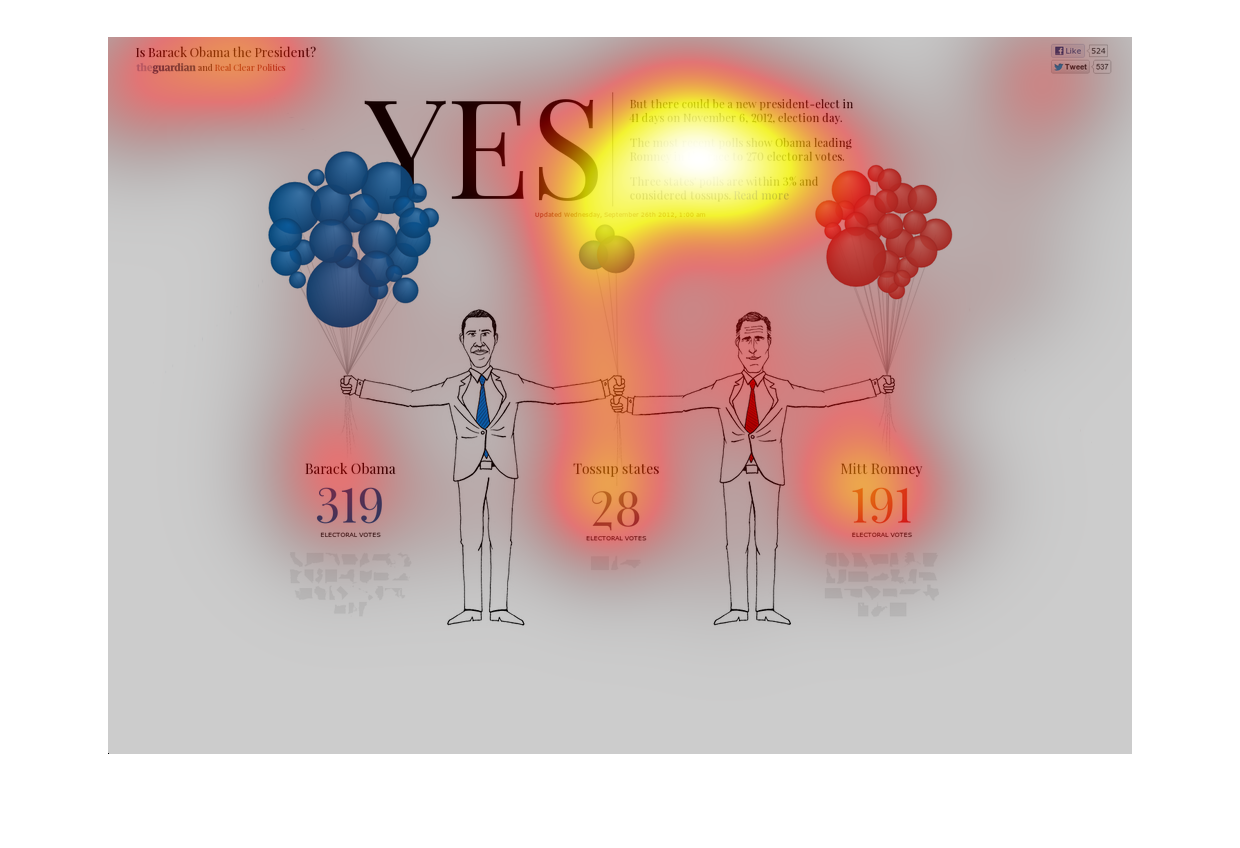
This chart describes Yes. It contains wonderful illustrations of Barack Obama and Mitt Romney
each holding balloons in their hands, which represent the percentage of votes.
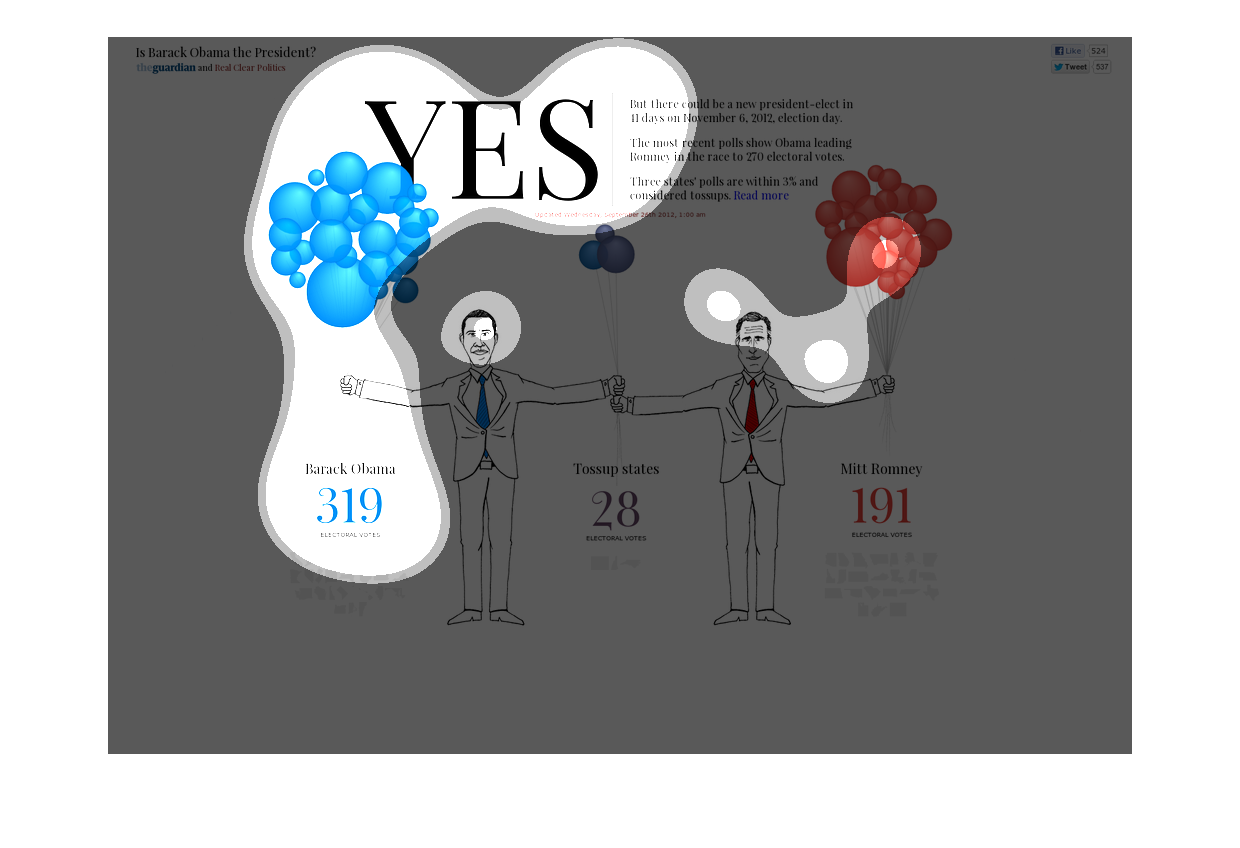
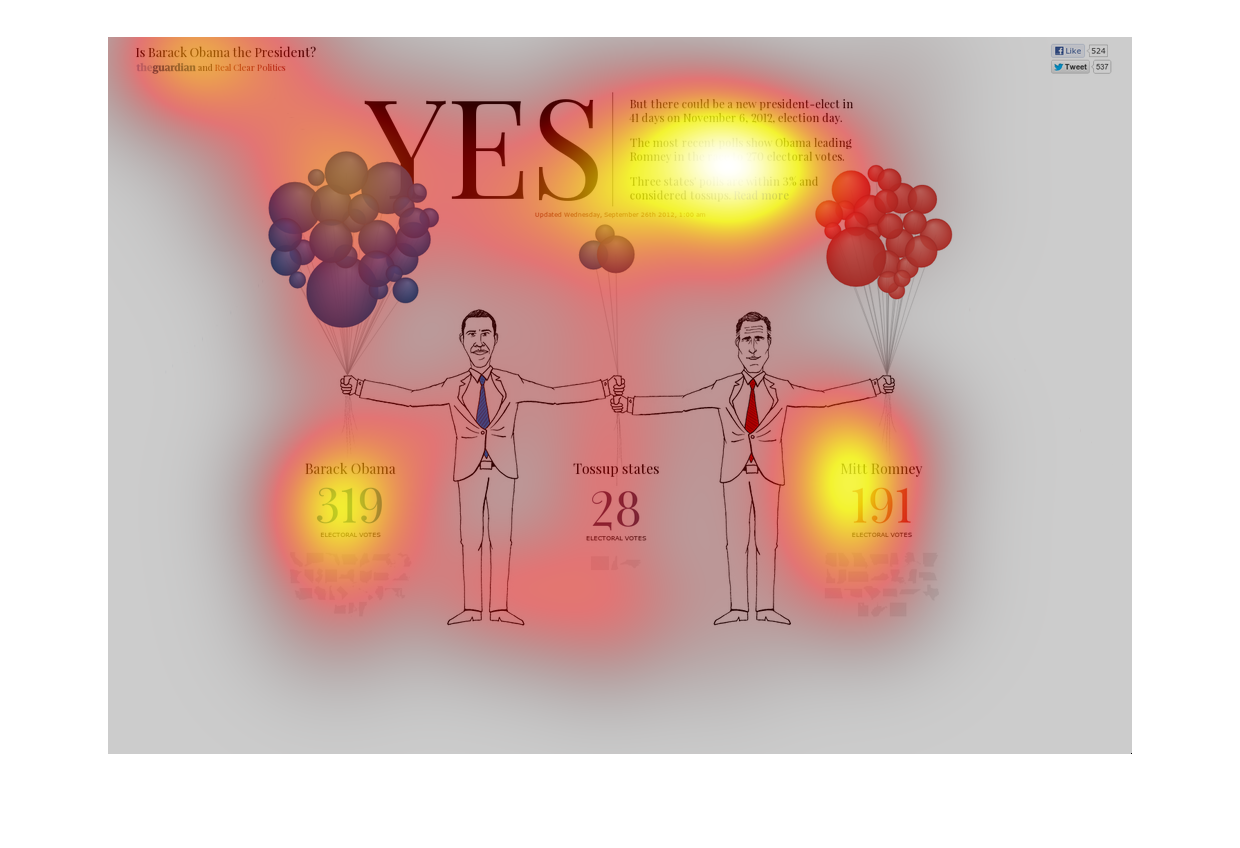
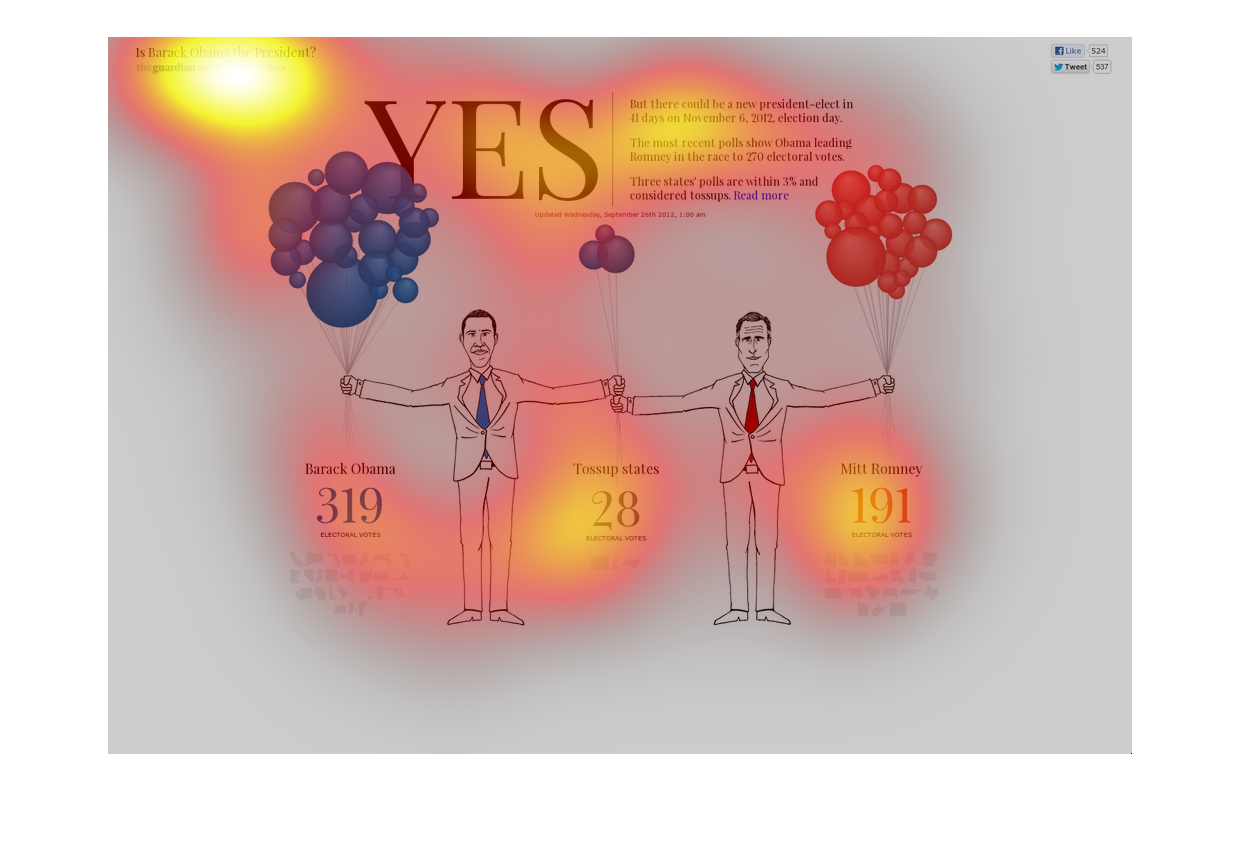
This is a political campaign comparing who is leading the polls during the 2012 presidential
campaign. President Obama is seen holding blue balloons indicating his affiliation with the
Democrat party, and red balloons for the Republican presidential nominee, Mitt Romney. Barack
Obama's balloons are larger than Romney's indicating Obama has the lead in the campaign.