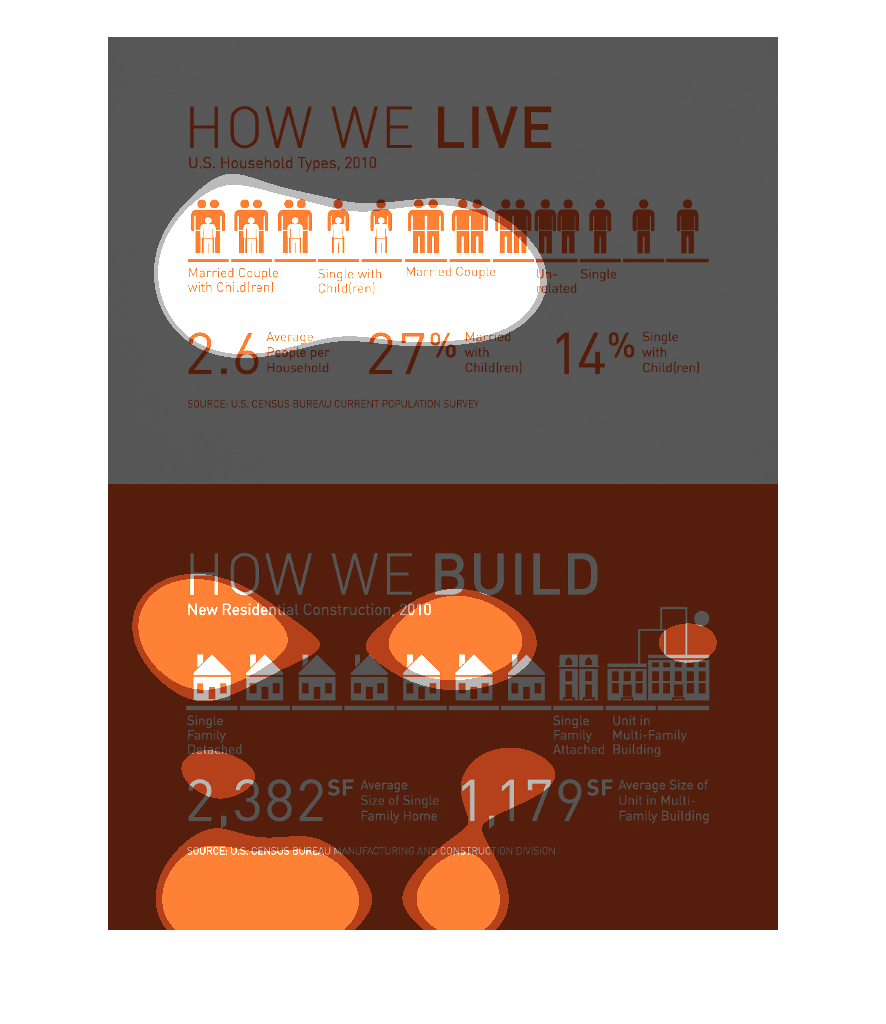
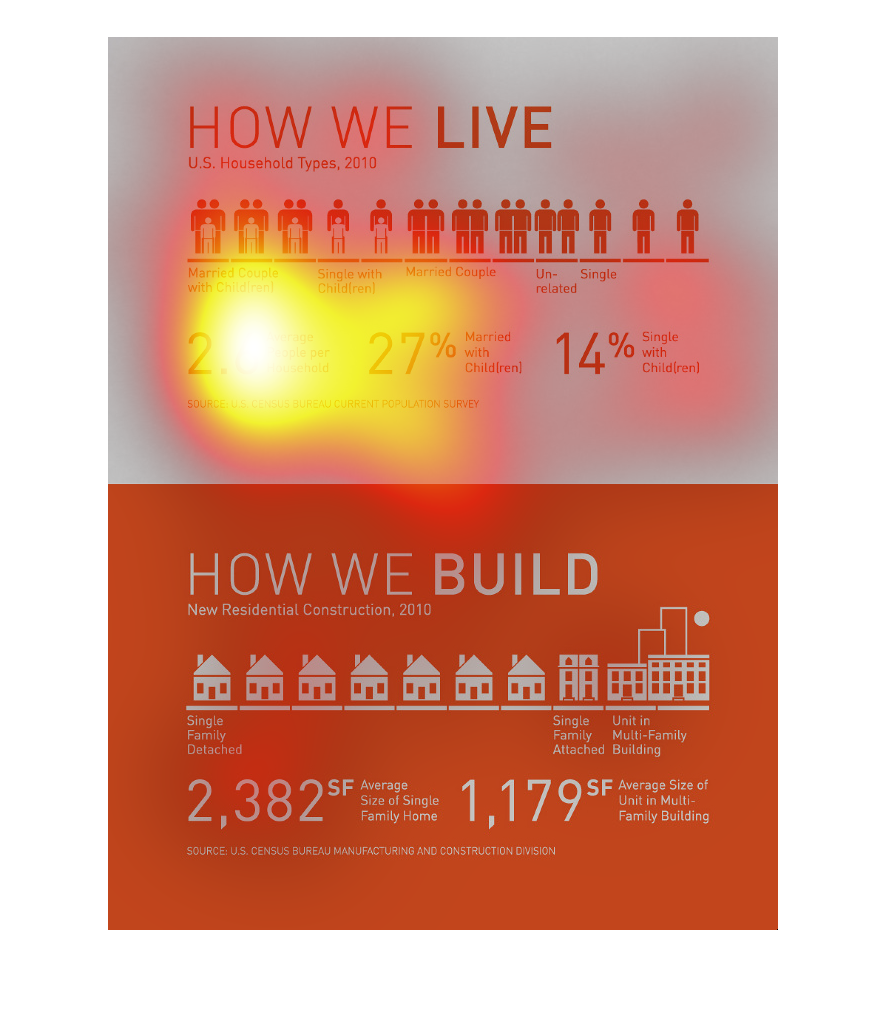
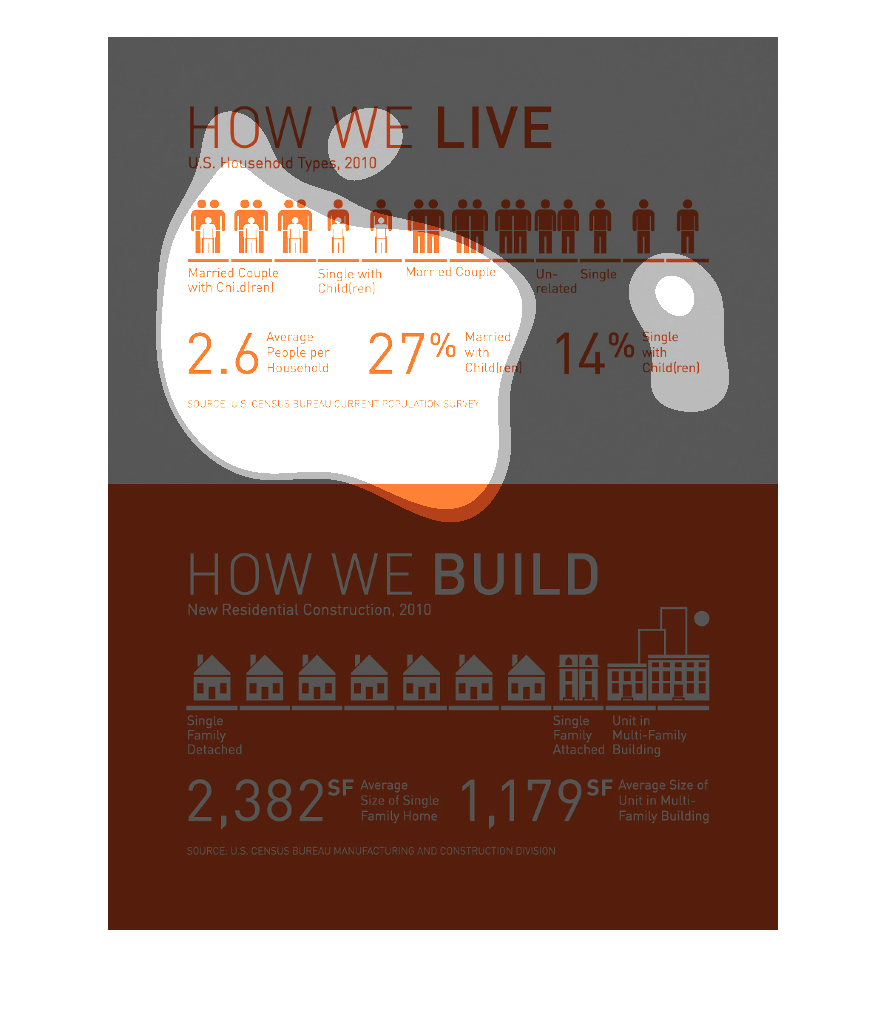
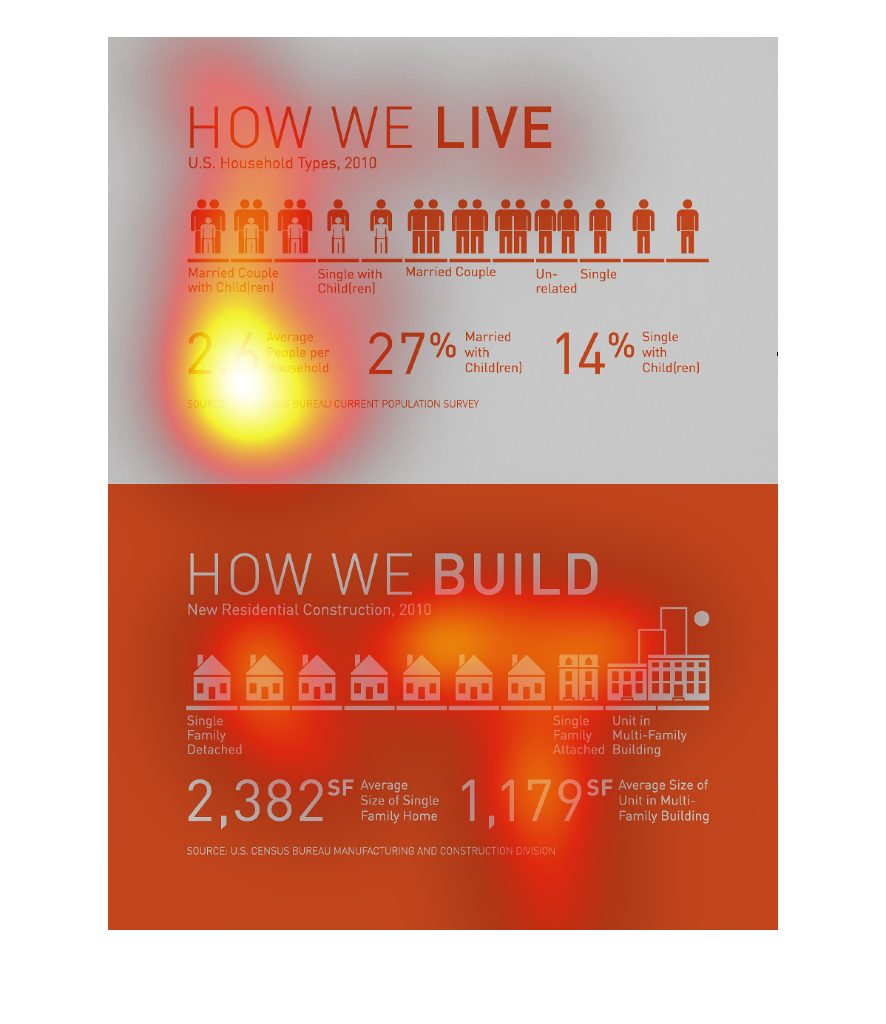
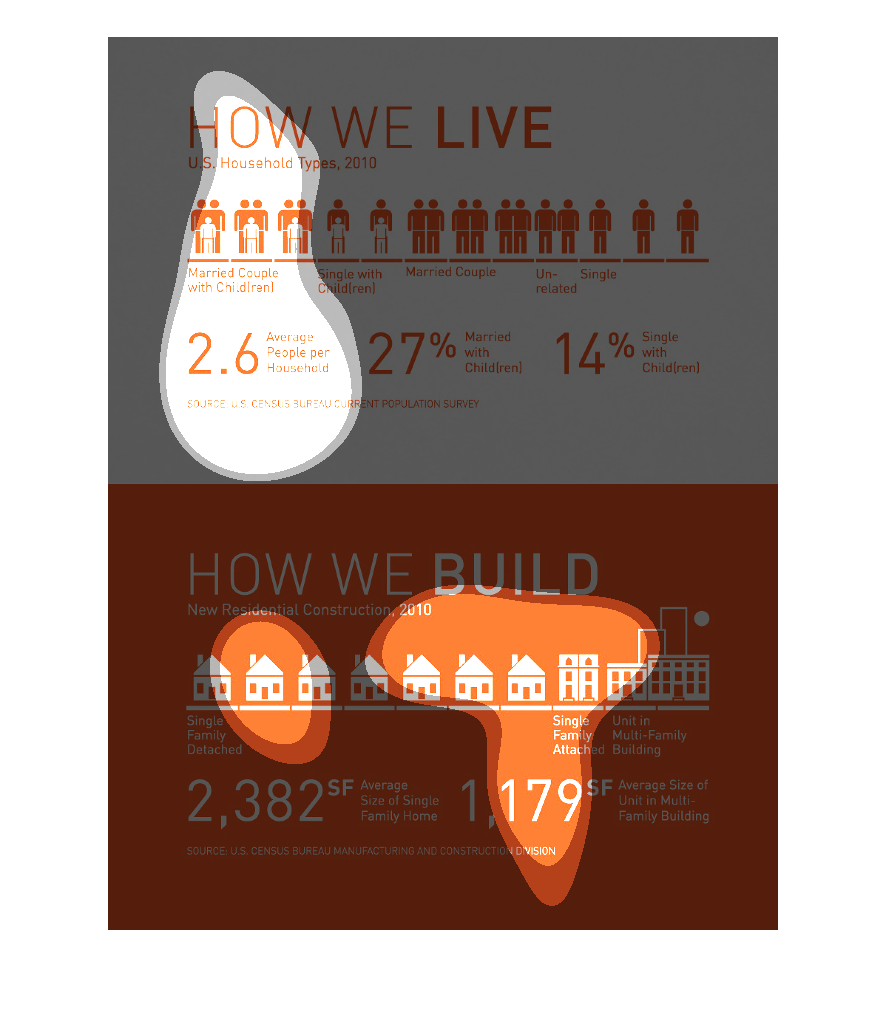
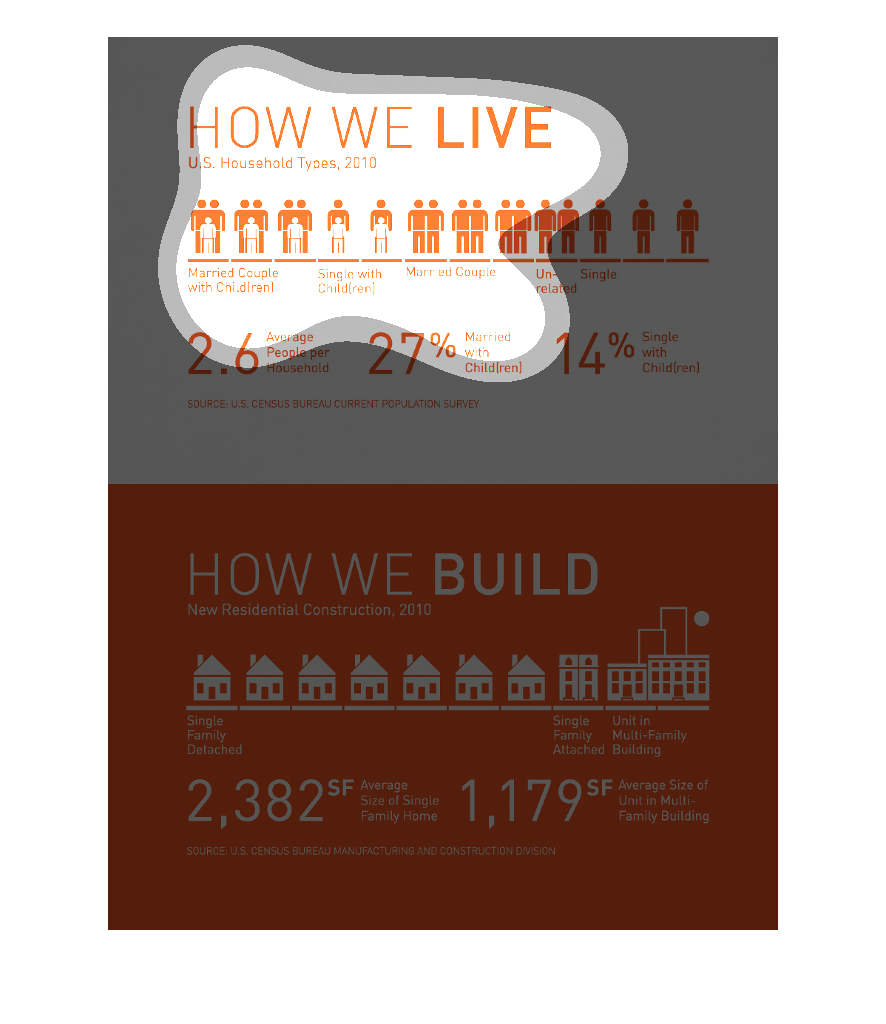
The image show two different categories of information. The top shows how family groups are
set up through a series of images and then gives some statistics on those groups, i.e. average
people per household. The bottom says "how we build" it seems to show different types of living
structures and then gives a few statistics on them.
This image shows or depicts in two parts of How We Live whether we are married, married with
children single or otherwise. There is an average of 2.6 people per household.
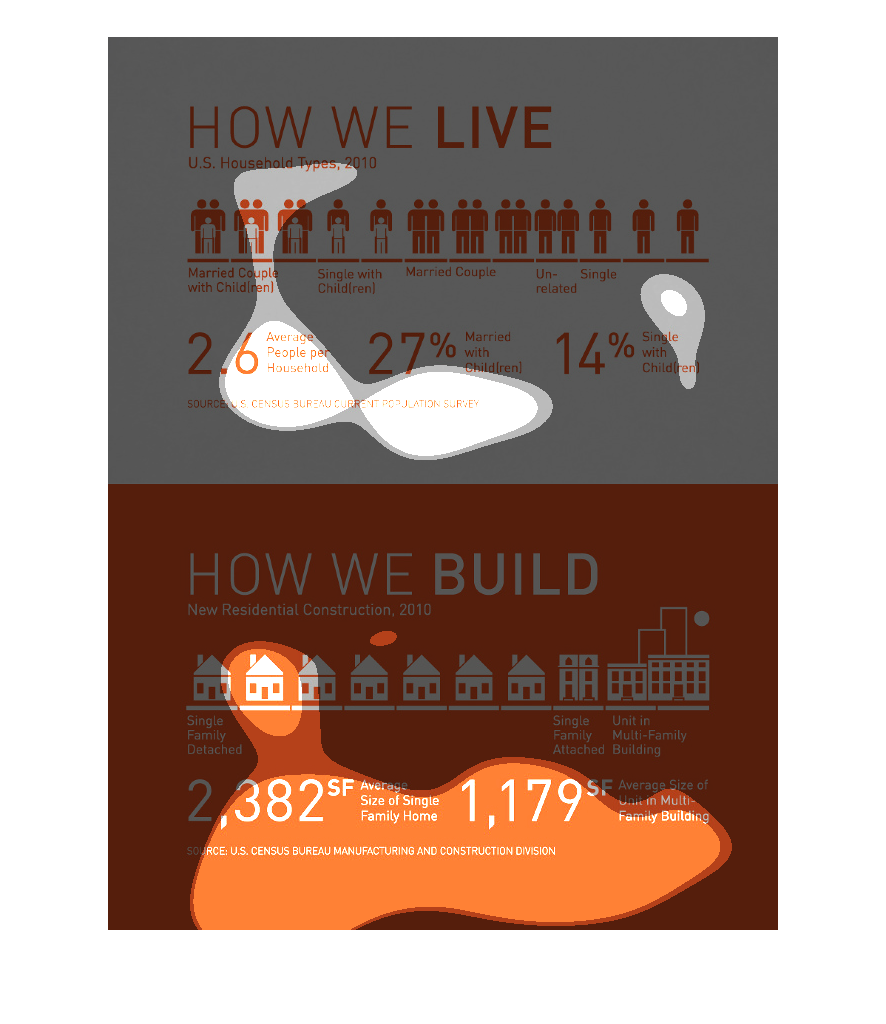
This is an orange square with white writing.  The first line reads How We Build.  The second
line depicts images of single family homes and attached homes.  The third line reads 2,382
sq. ft. and 1,179 sq. ft.  Above the orange square is a white square with orange writing.
 The first line reads How We Live.  The second line depicts outlines of people such as Married
Couple with Children, Single with Children, Married Couple.
This chart describes and depicts the percentages of to married couples with children, single
parents with children, and unrelated people living together.
This is an image comparing the types of families there are in America, with the average family
having 2.6 people, and what what type of homes are being built as well as the quantities of
both.
The following chart depicts how we Americans live in terms of family size and the average
size of the US Family and the different percentages of families by size. It also gives the
average size of the homes that we live in.
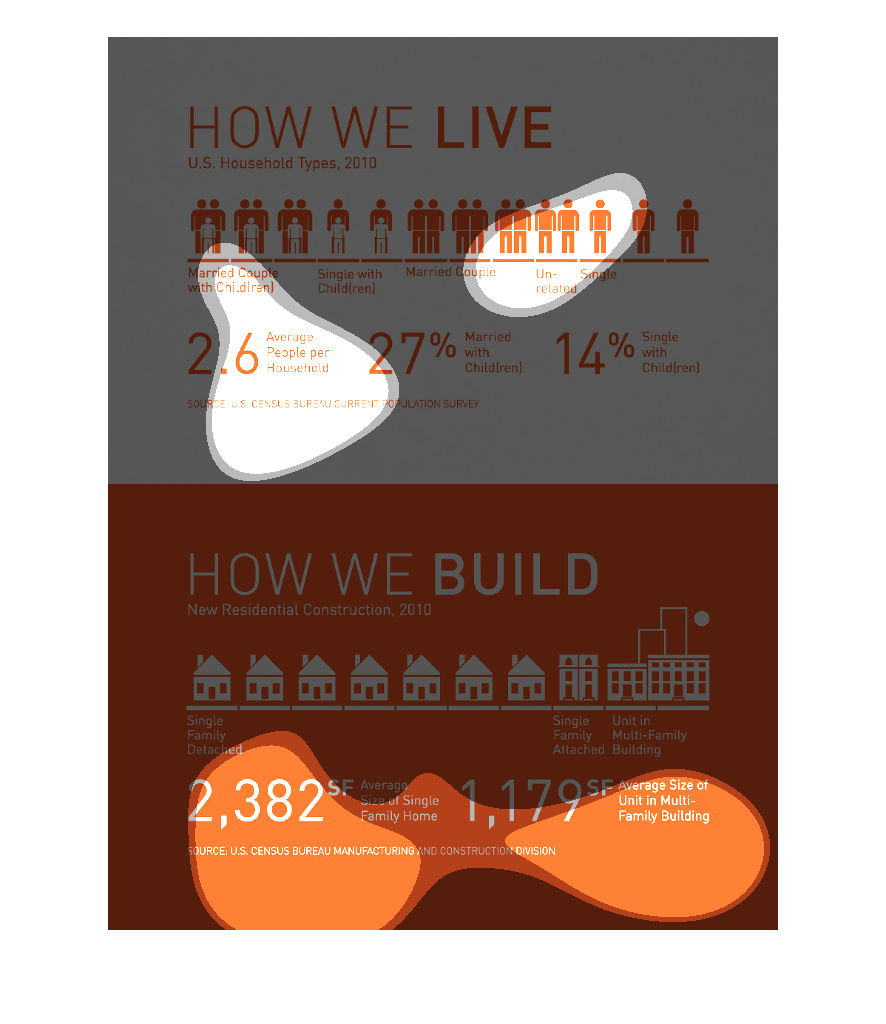
Chart titled "how we live", showing a graph of how much of the population is single, how many
are married with children, how many are married without children, etc..
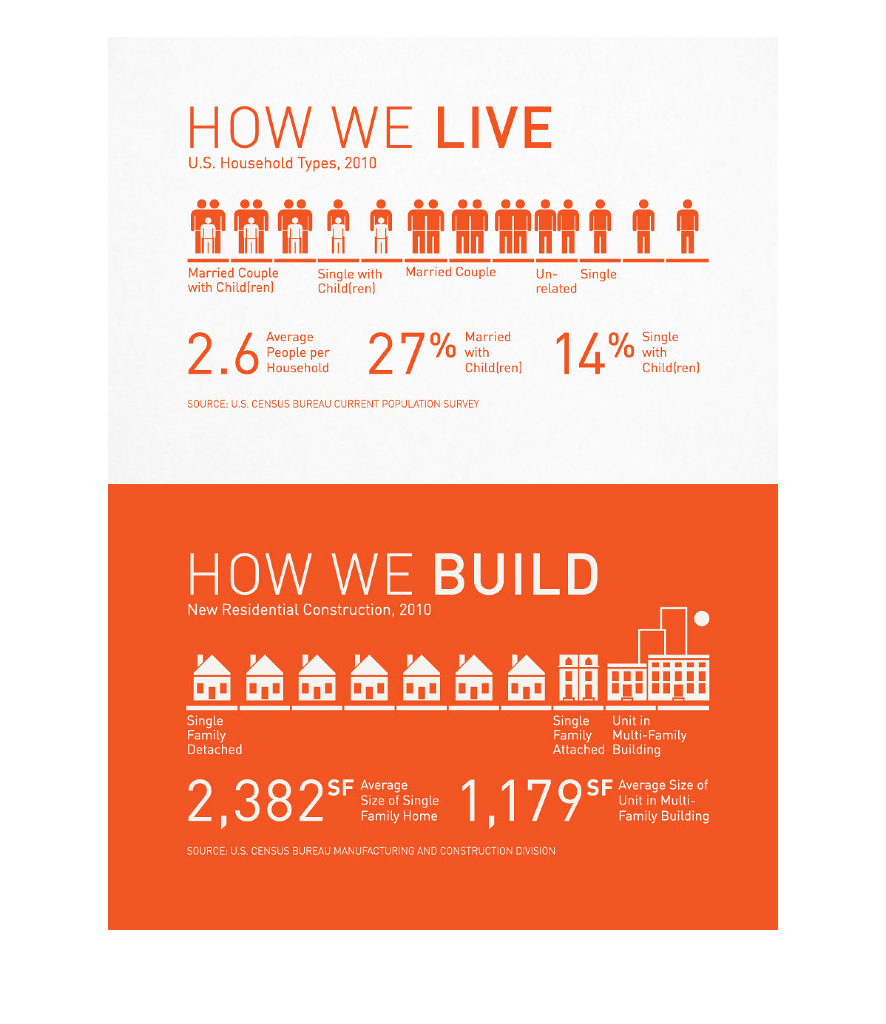
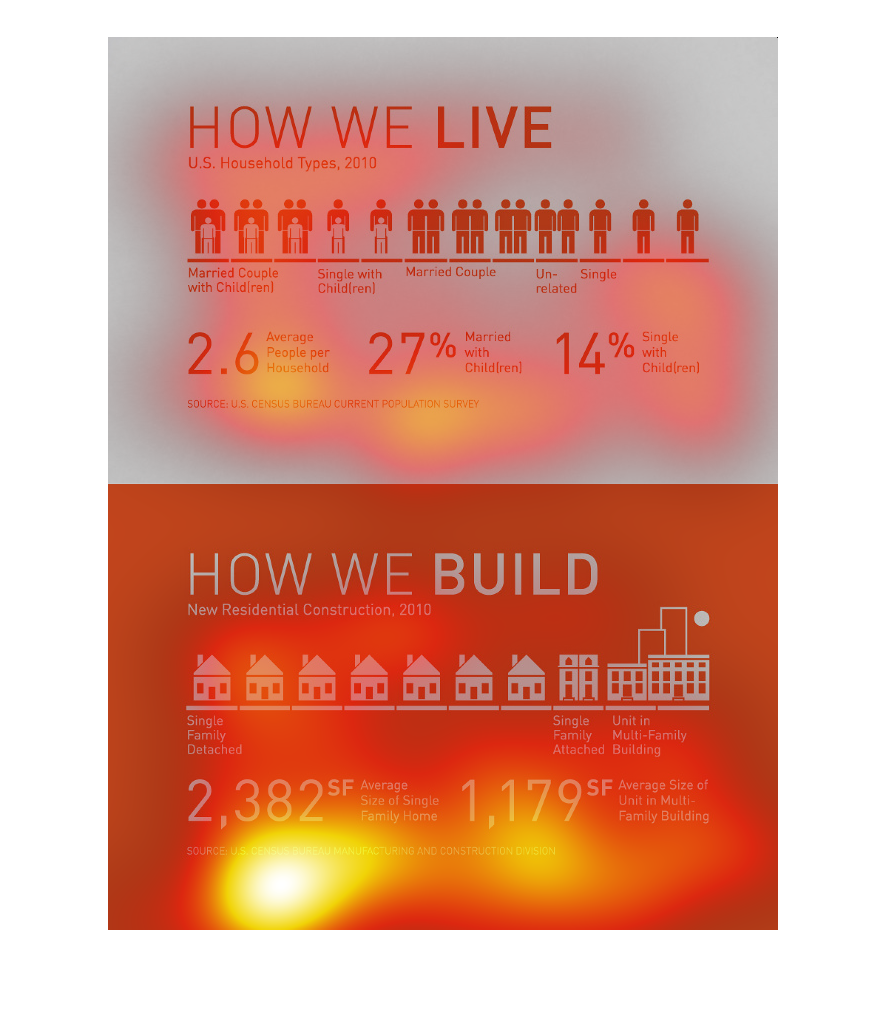
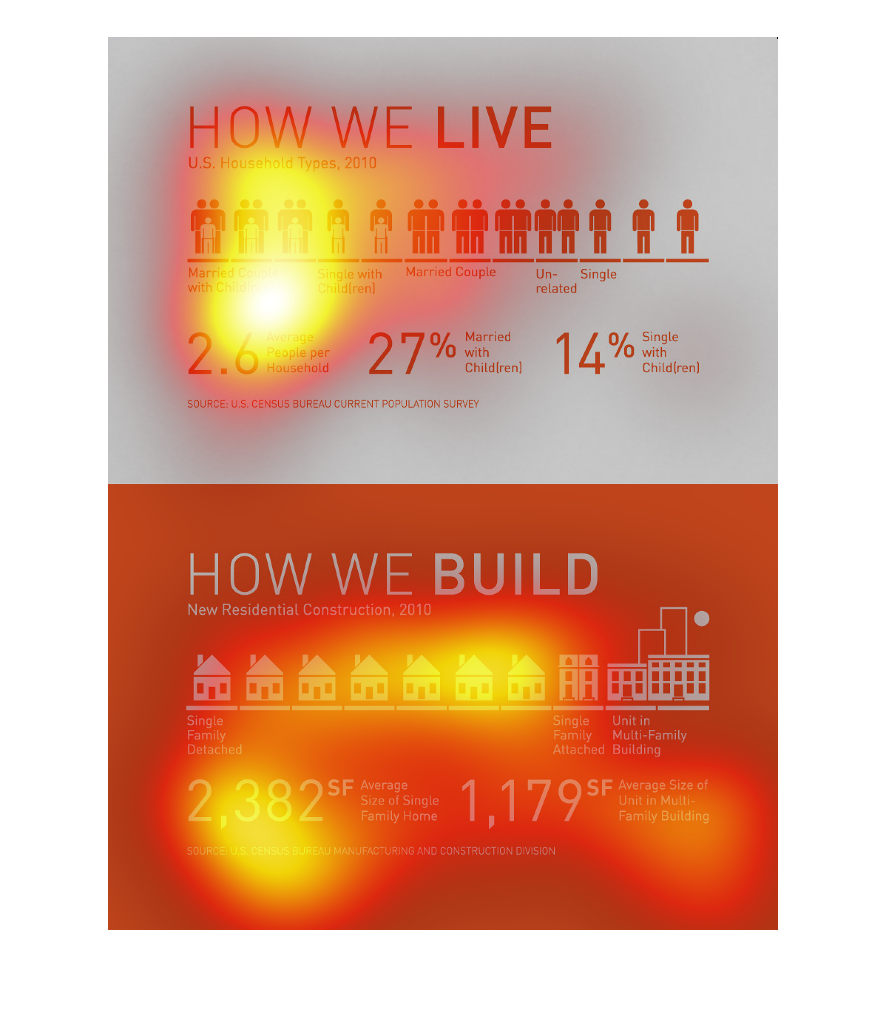
This shows the different US household types in 2010. We see 2.6 people per household, 27%
married with children, and 14% single with children. Alongside this we see construction, with
2,400sqft being the average of a single family home.
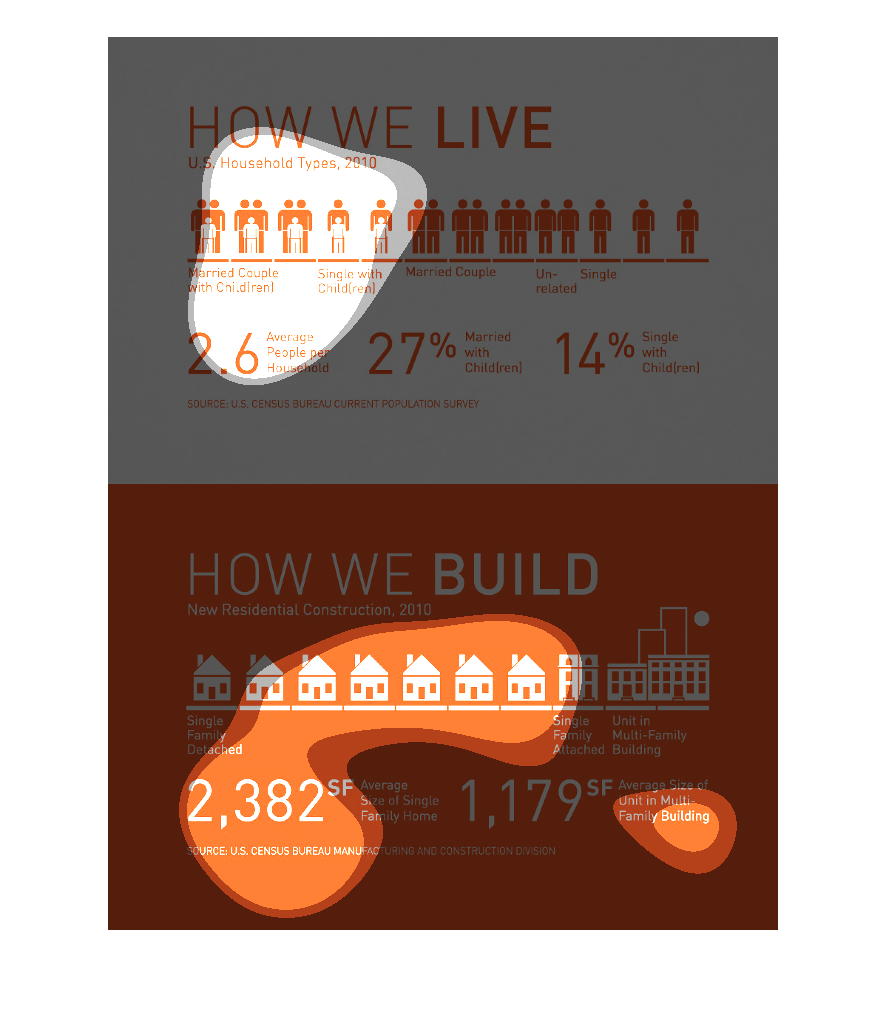
The graph on the left hand side depicts how Americans live.  it shows the average house for
each size of family.  For the most part the more individuals the bigger the home which we
would expect to see.  It also describes that the average square foot per house is lower per
family in multi unit houses such as apartments or condos as an example.
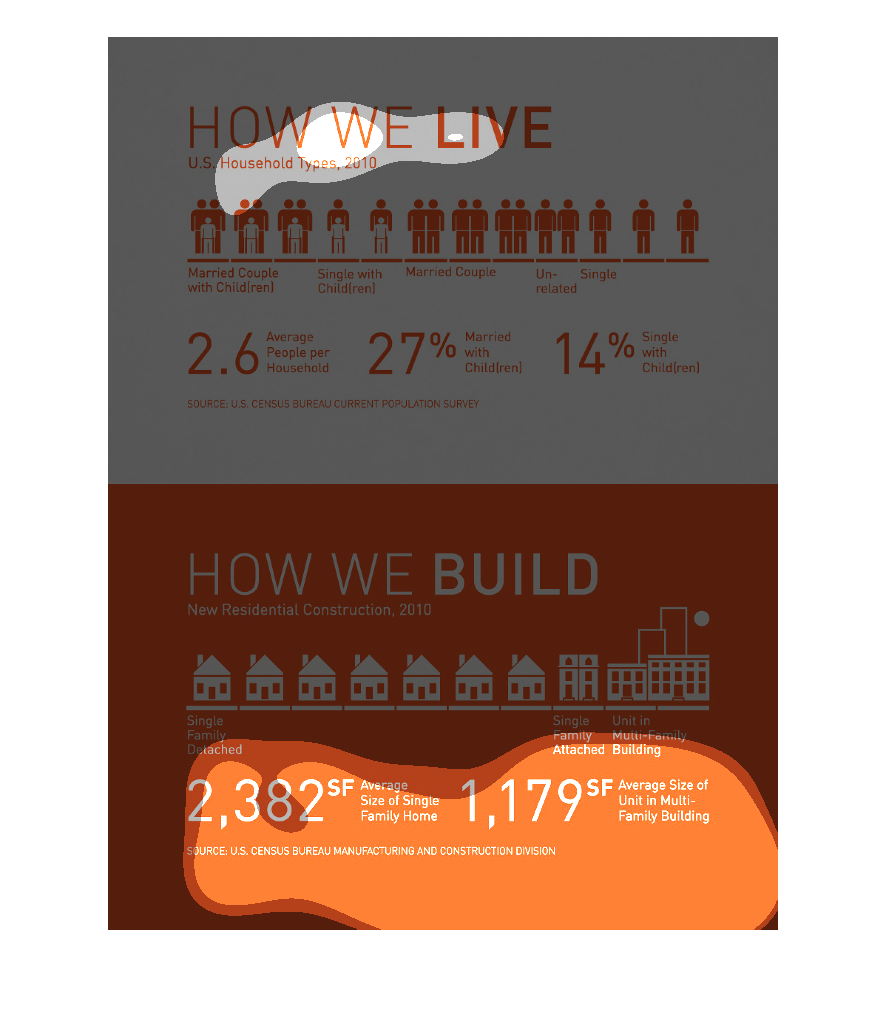
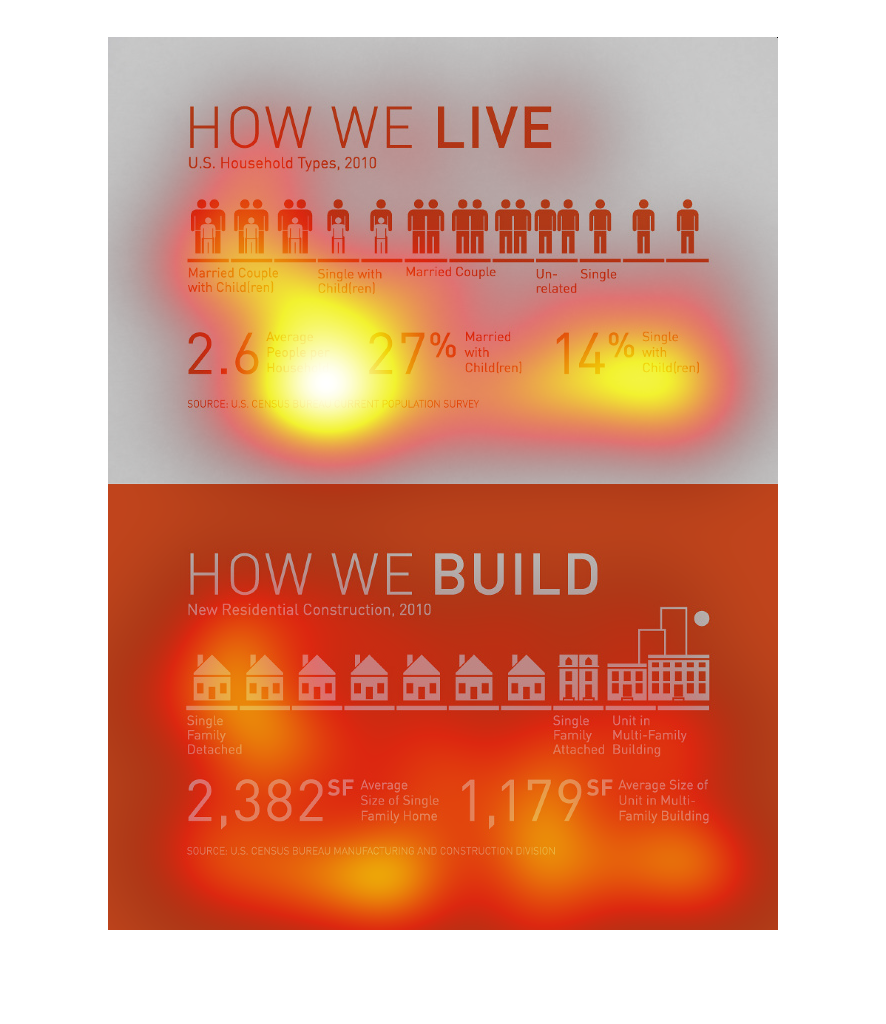
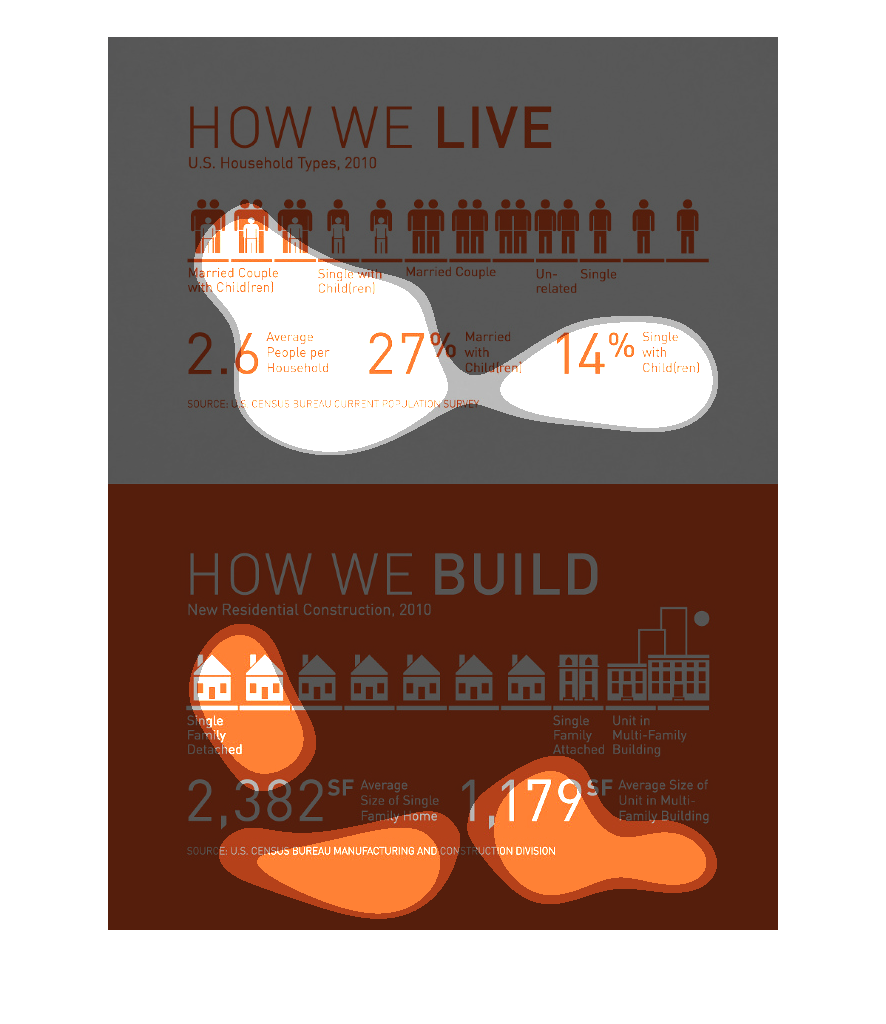
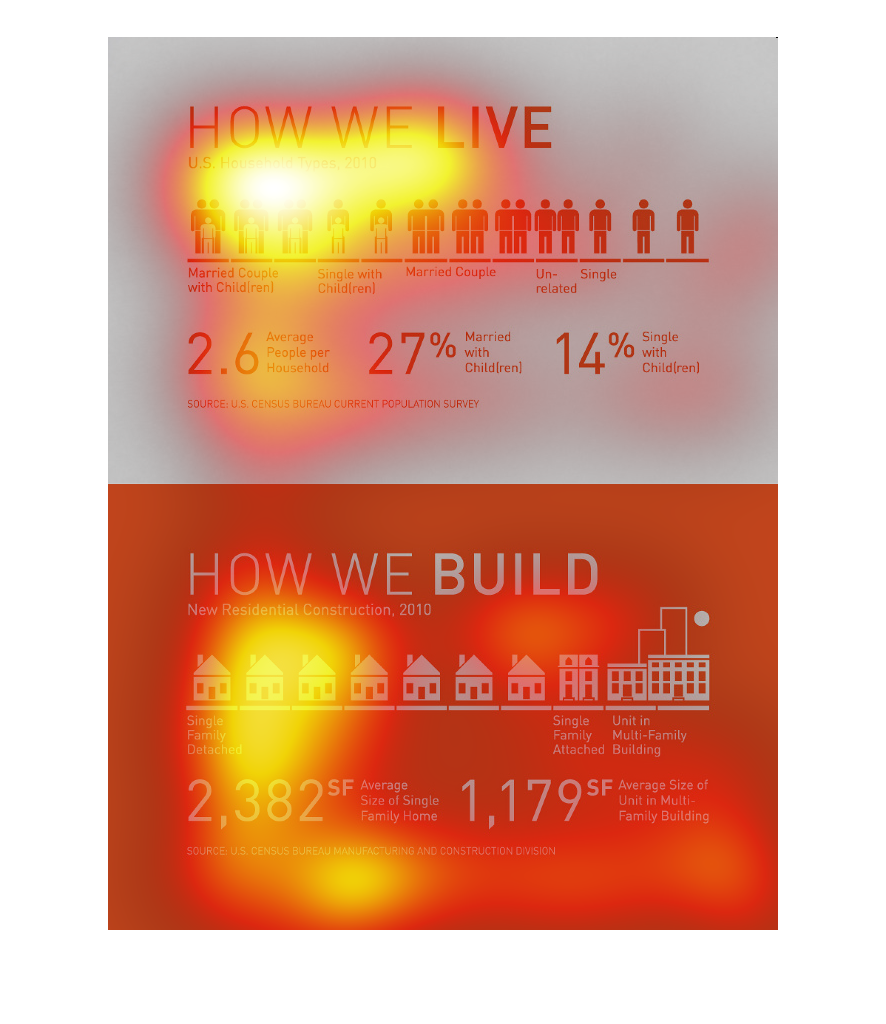
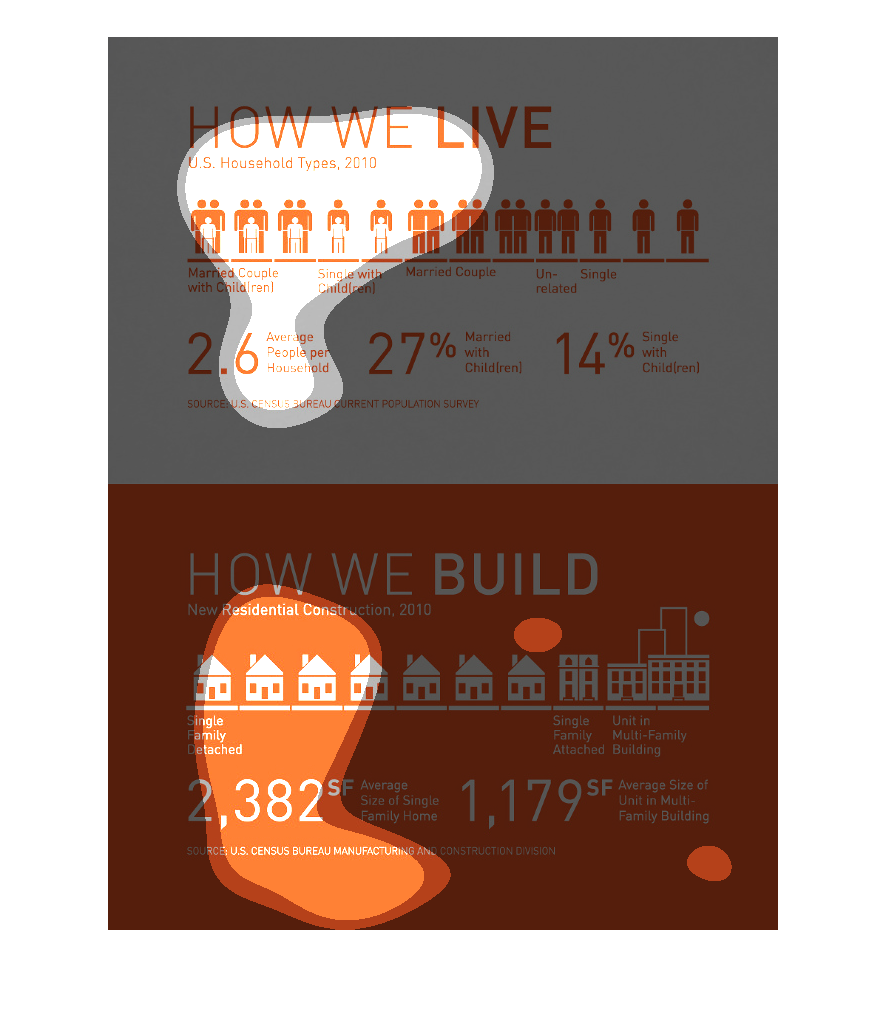
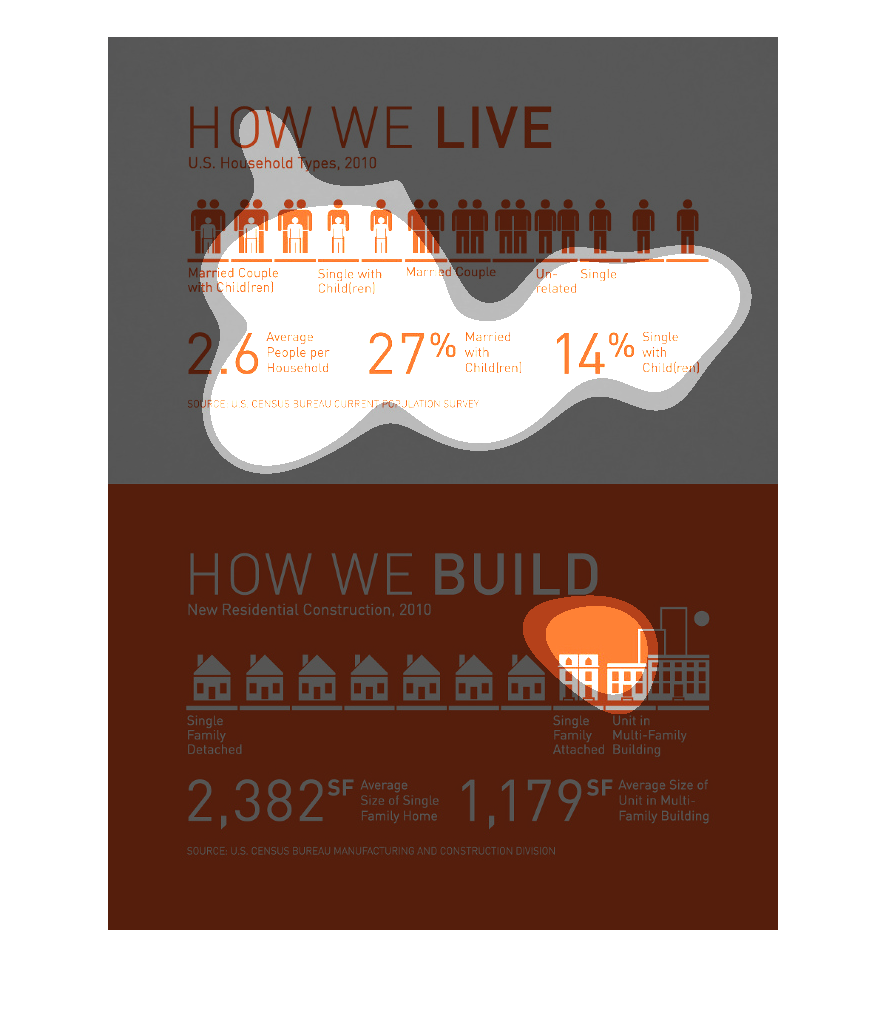
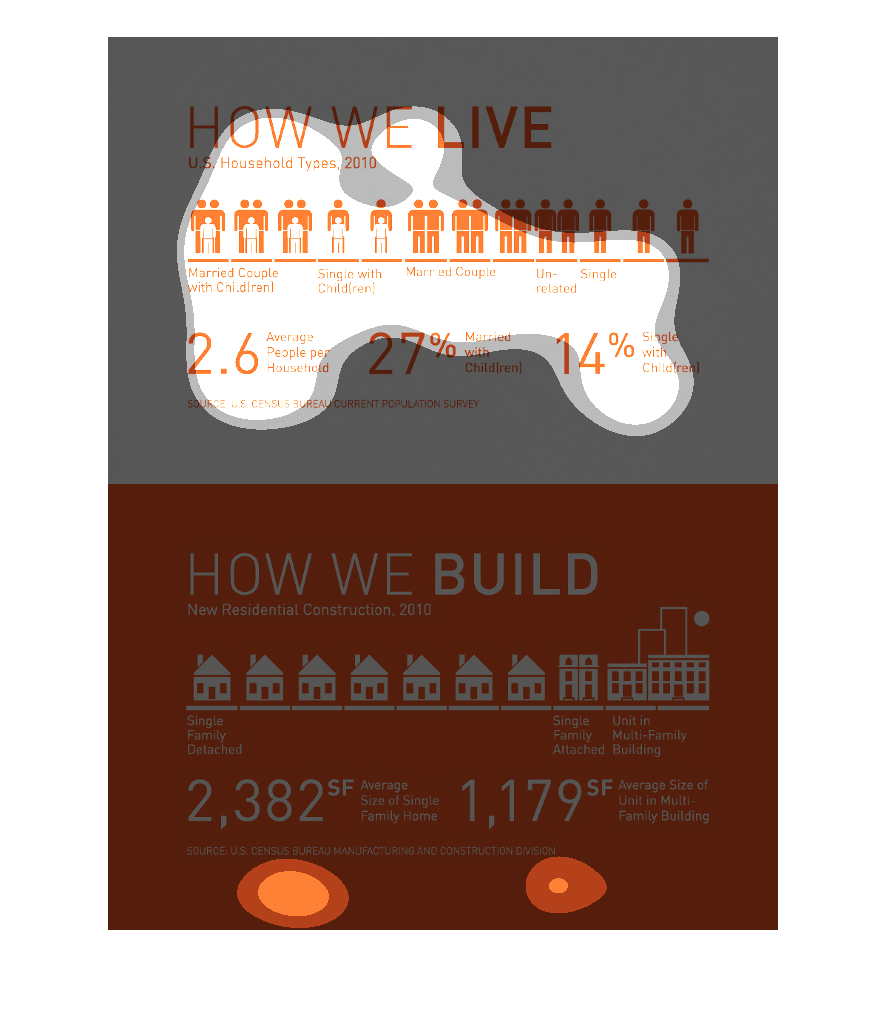
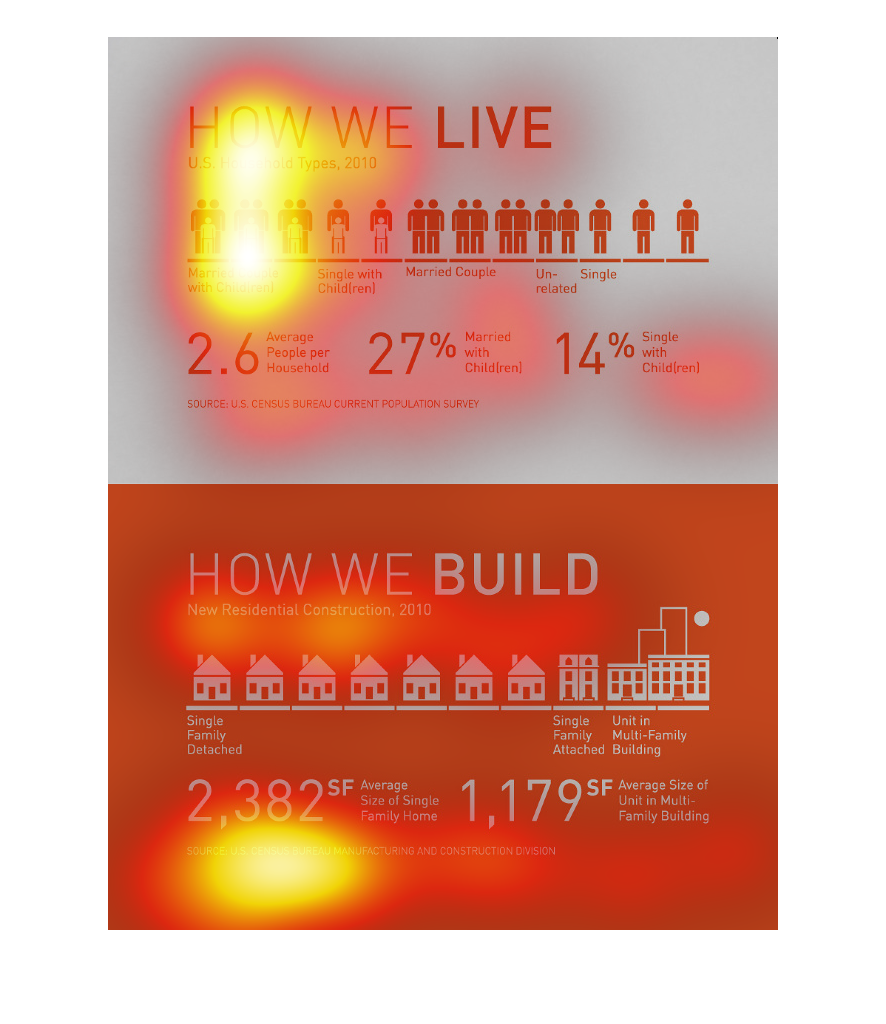
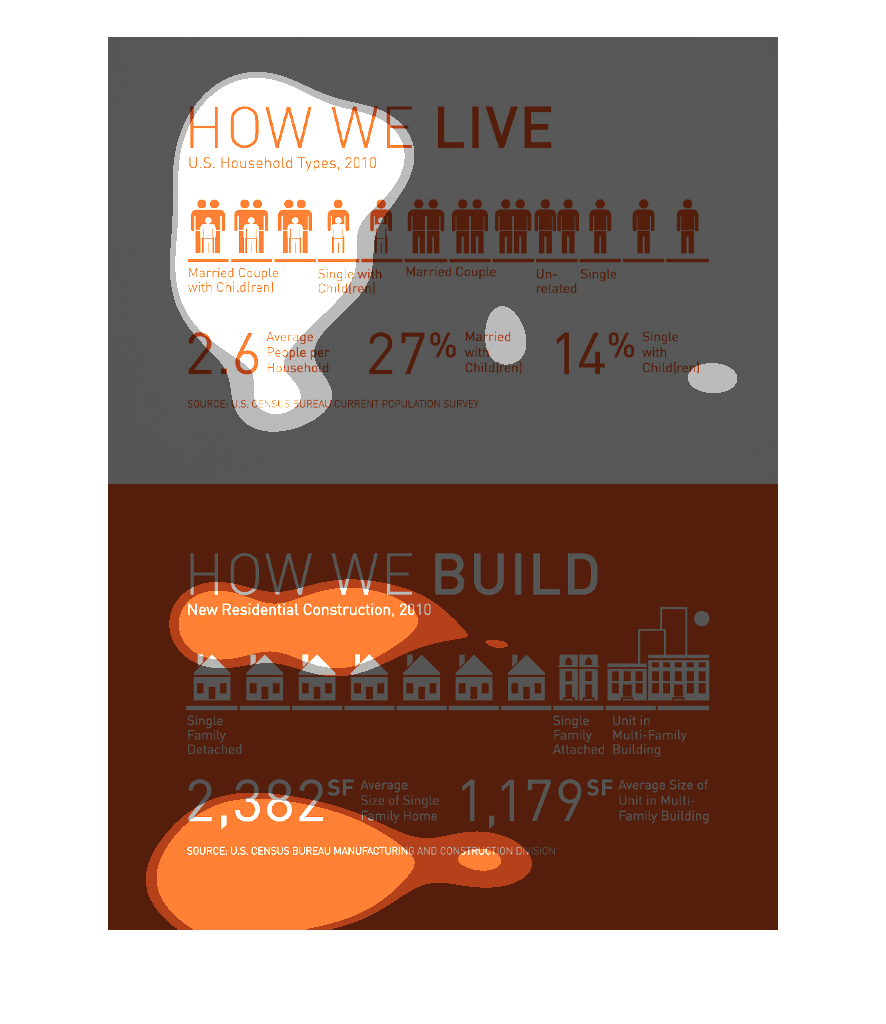
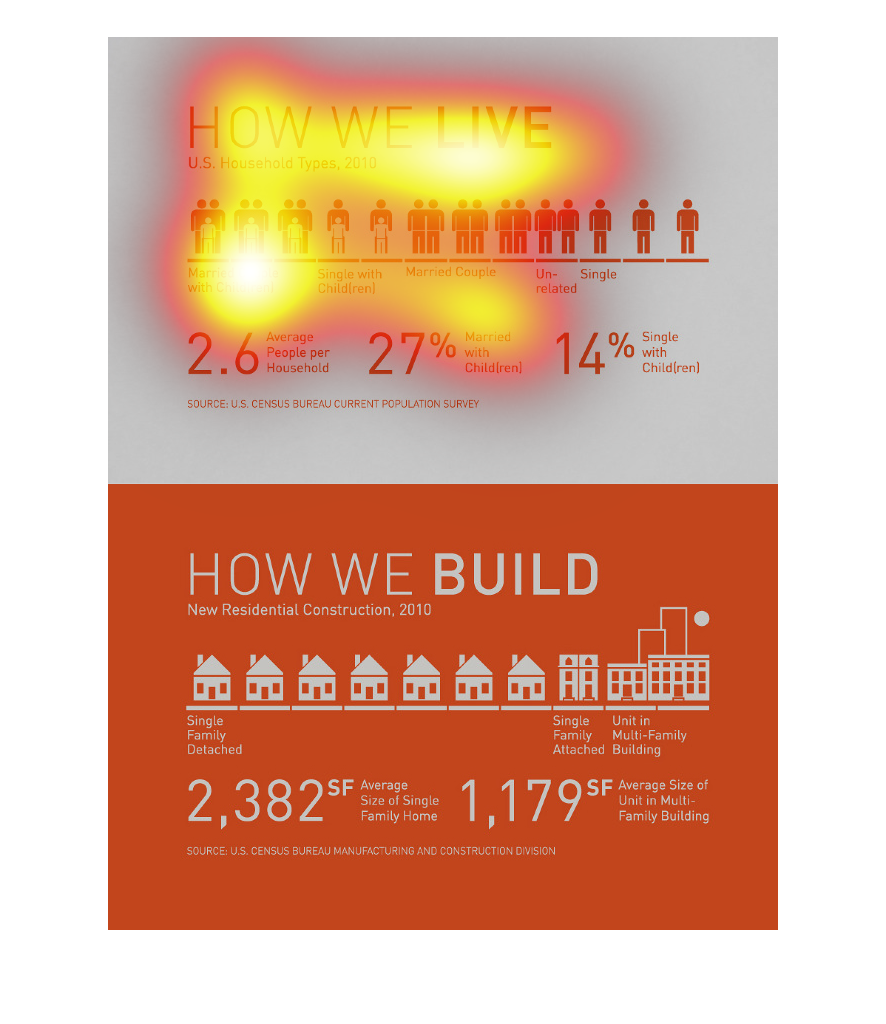
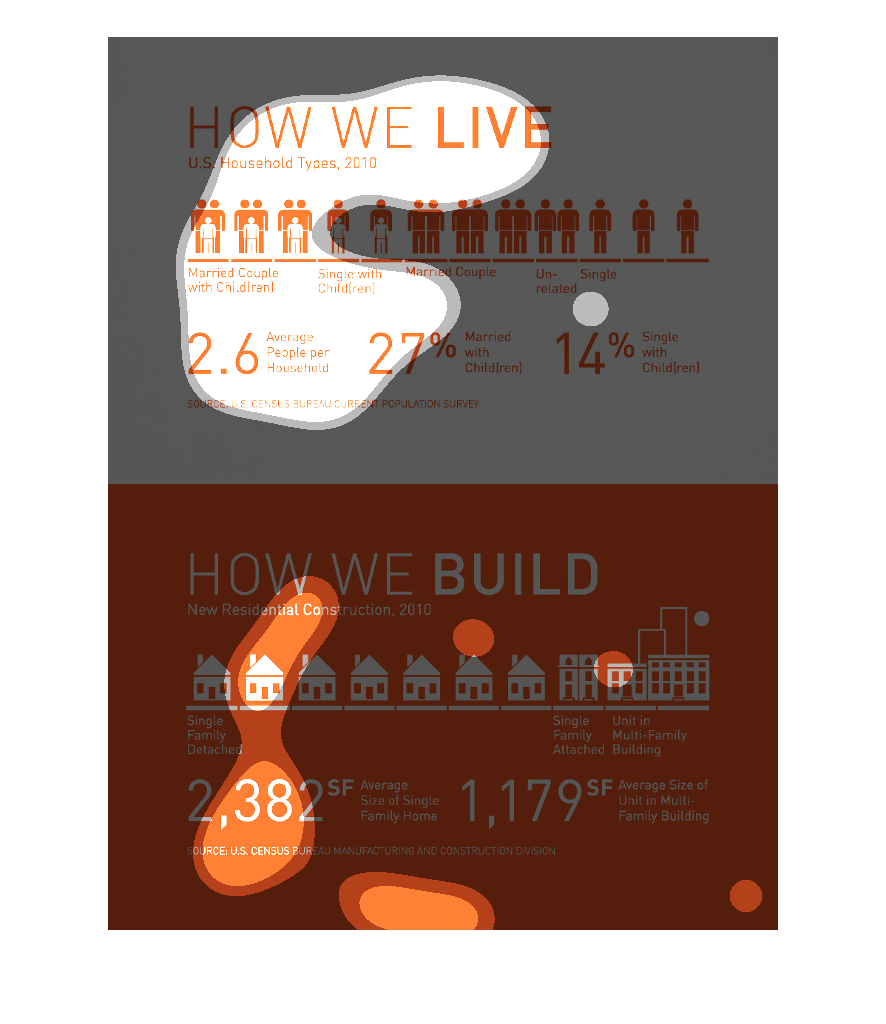
How we live, US household types and how we build, new residential construction. 2.6 average
people per household, 27% married with children, 14% single with children. 2,382 square feet
single family detached, 1,179 square feet average size of unit in multi family building
This chart describes how we live. The chart is divided into categories that include married
couple with children, single with children, and married couple.
This picture informs the viewer of " How we live" and "how we build" and splits it up into
marital and family status. It also shows the square footage of houses from families of different
groups
This is an infographic on how we live. It shows the population of single and married individuals
and average number of people per household.  The bottom shows how we build like average size
of houses.
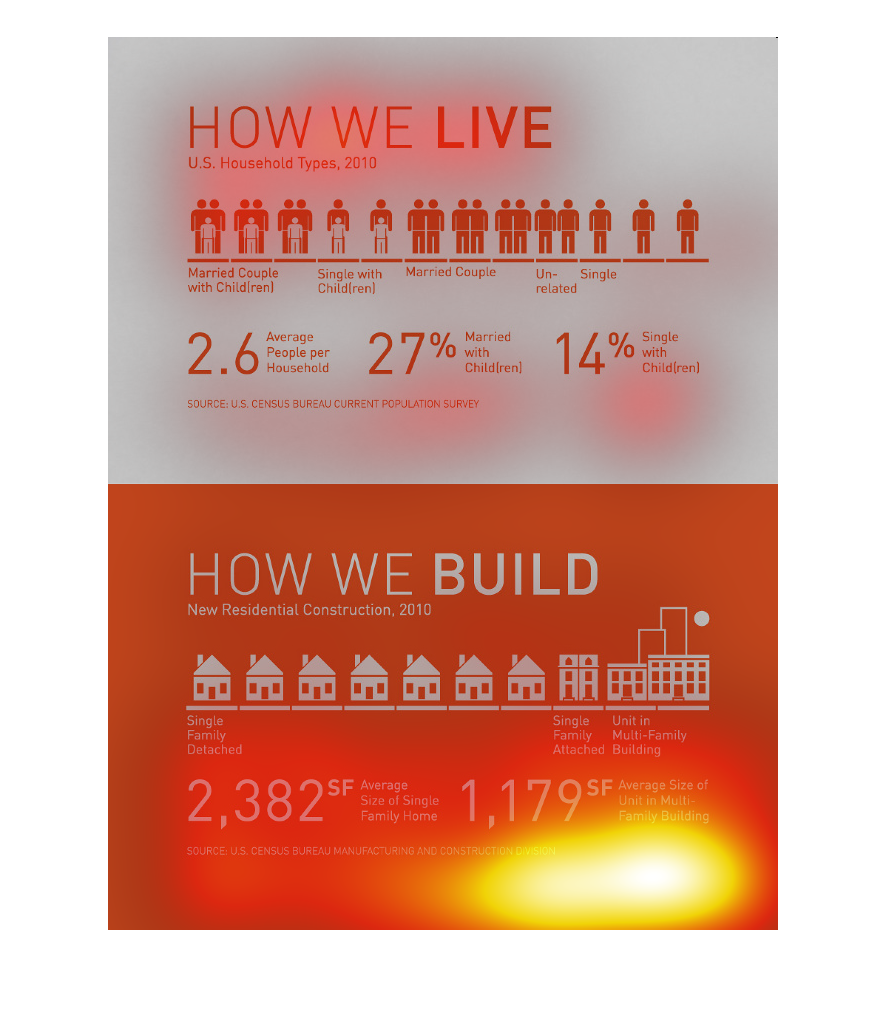
The caption for this graphic is, "How we live, US household types, 2010".  Around this heading
are people icons along with demographic information for different combinations of family types.
 On the bottom half of the graphic is another caption that reads, "How we build, New residential
construction, 2010".  Around this heading are house icons depicting different types of dwelling
types like, single family attached, single family detached.
the chart shows how different types of people live in different situations averaging 2.6 people
per household 27% of people are married with children 14% are single parents the chart also
shows certain sizes and averages for homes